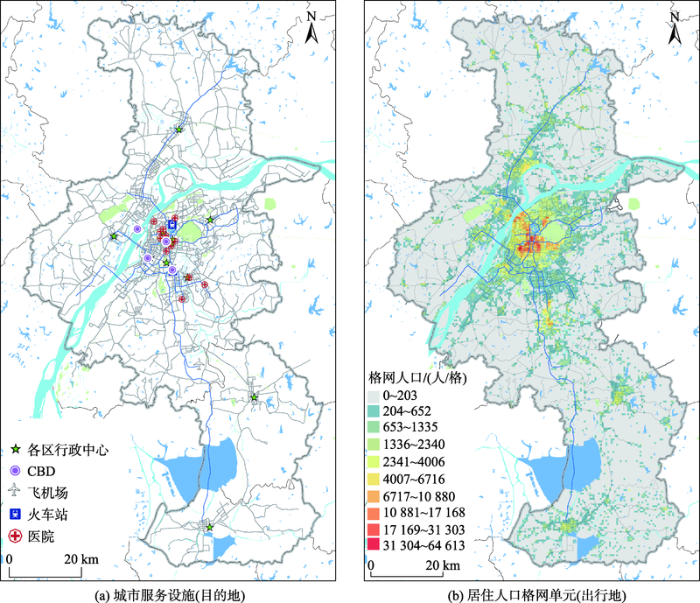
Spatial accessibility analysis is recognized as an efficient way to assess the convenience of residents in accessing public service facilities by different travel modes. To this end, analyzing the travel time between residents and public service facilities is essential part of accessibility analysis. However, most studies used rough estimates of travel distance/time by ArcGIS network analysis tools, especially for public transport modes. To calculate travel time more accurately, this study used Python language to develop a platform to extract the traffic trip data including travel times and distances based on the Baidu map navigation API (Application Program Interface) service. The nearest facility method and the cumulative opportunity cost and isochronal method were applied to measure and compare the disparity of accessibility to Nanjing's central business districts (CBDs), administrative service centers, large hospitals, railway stations, and airports in different public transportation scenarios (BTT and MTT). The results show that: ① A door-to-door approach in travel time calculations for public transport modes according to up-to-date schedules based on internet map service is more accurate and convenient compared with the traditional ArcGIS network method. ② The metro network system has obviously improved the accessibility from residential areas to urban public service facilities, especially the "corridors areas" along the metro lines or bus routes and the areas close to the important transportation facilities, such as metro stations. ③ In the MTT scenario, the changes of the accessibility from residential areas to CBDs were significantly concentrated in 0-30 minutes; the cumulative population and area within 30-minute time threshold are respectively 1.7 times and 2.2 times those of the BTT scenario. ④ The changes of the accessibility from the residential cells to the nearest railway station were significantly concentrated in 0-30 minutes and 30~60 minutes; the cumulative population and area within 30-minute time threshold were respectively 8.9 and 3.0 times those of the BTT scenario. The cumulative population and area within 60-minute time threshold were respectively 1.5 times and 1.9 times those of the BTT scenario. ⑤ The changes of the accessibility from residential cells to airports were significantly concentrated in 60~90 minutes and 90~120 minutes, and the cumulative population and area within 90-minute time threshold were respectively 12.6 and 6.6 times those of the bus scenario; the cumulative population and area within 120-minute time threshold were 2.0 and 3.6 times higher than in the BTT scenario. ⑥ The changes of the accessibility from residential cells to administrative centers and large hospitals were also available to promote at various time interval periods. In addition, this paper can obtain more complete and real route time access to urban service facilities for other modes of transportation (e.g., cars, electric vehicles, bicycles, walking), and also provides reference for further studies to promote the sustainable development of public transportation.
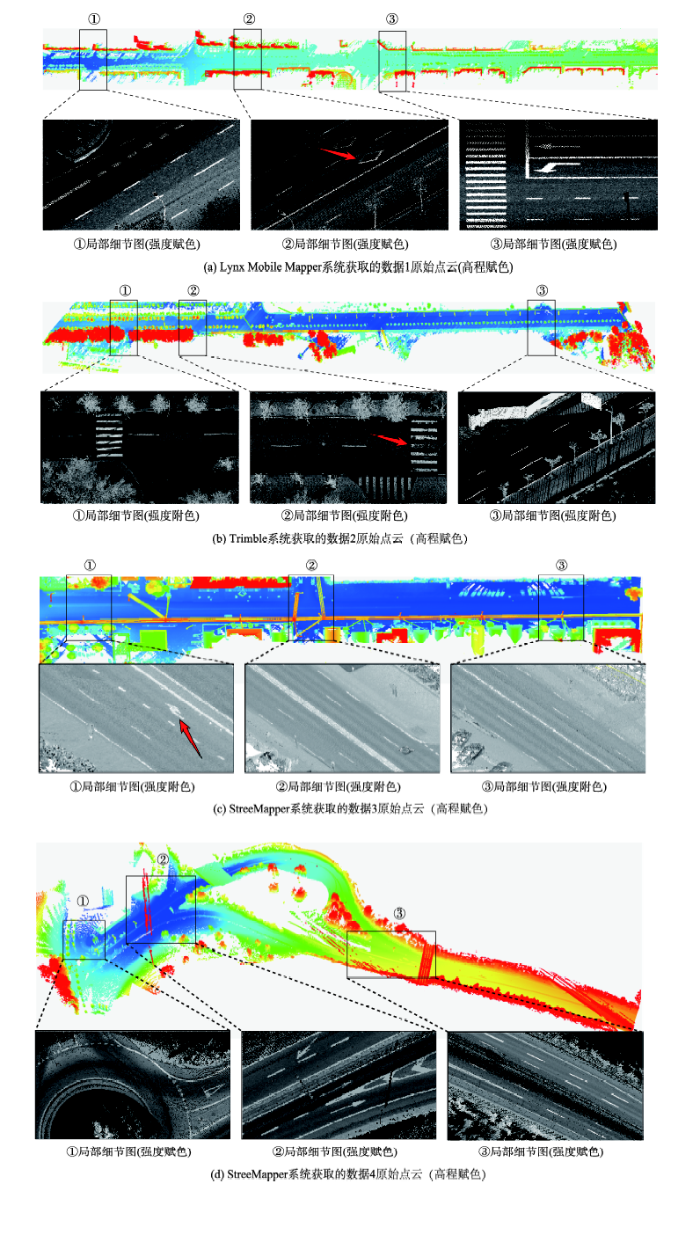
This paper presented a novel method for identifying road markings from mobile LiDAR point clouds by integrating Support Vector Machine (SVM) and graph matching. Firstly, the road surface point cloud was extracted using the scanline method, and then, was used to generate independent marking objects by a marking segmentation method combined with intensity correction. Next, hierarchical classification was conducted to identify smaller size markings as the basic objects for further processing. Considering the shape varieties of different types of marking objects, Hu invariant moments, Solid Shape Context (SSC), the area of Minimum Bounding Rectangle (MBR), and extensibility were extracted to construct the marking shape feature vector. Subsequently, with the shape feature vector of the above-mentioned samples, a training sample set was manually established to fit SVM model parameters. In the classification section, the SVM model was conducted for the preliminary classification, where there were situations including cross misclassification of markings with similar shapes and ambiguity between dotted marking and zebra crossing. Building upon the graph structure including certain types of interactive relationship (e.g., arrangement of road markings, direction relationship, and distance between markings in the local area) and the shape feature of markings, we used the inherent characteristics and spatial neighborhood information of objects to synthetically describe the geometric feature and spatial semantic information of road markings. Since the partial absence of markings' semantic structure, we developed an inexact graph matching method based on the graph structure of markings, which could optimize the preliminary classification result. The refined classification results of all six types of road markings included the straight arrow, the crosswalk warning line, the one-way steering arrow, the two-way steering arrow, the dotted marking, and the zebra crossing. To verify the validity of the proposed method, we conducted experiments using four test data sets acquired from different MLS systems. The verification results show that the six marking types have a respective precision of 100%, 100%, 94.12%, 100%, 94.94%, and 99.25%, and a respective recall rate of 100%, 100%, 88.89%, 100%, 98.21%, and 99%, and a respective F1-Measure value of 100%, 100%, 91.43%, 100%, 96.59%, and 99.12%. The experimental results demonstrate that the proposed method could accurately identify multi-class road markings. In conclusion, our algorithm is superior and robust for extracting road markings in even complicated cases where road markings may exhibit significant shape differences or high similarity (e.g., the straight arrow and linear marking, the dotted line and zebra crossing).
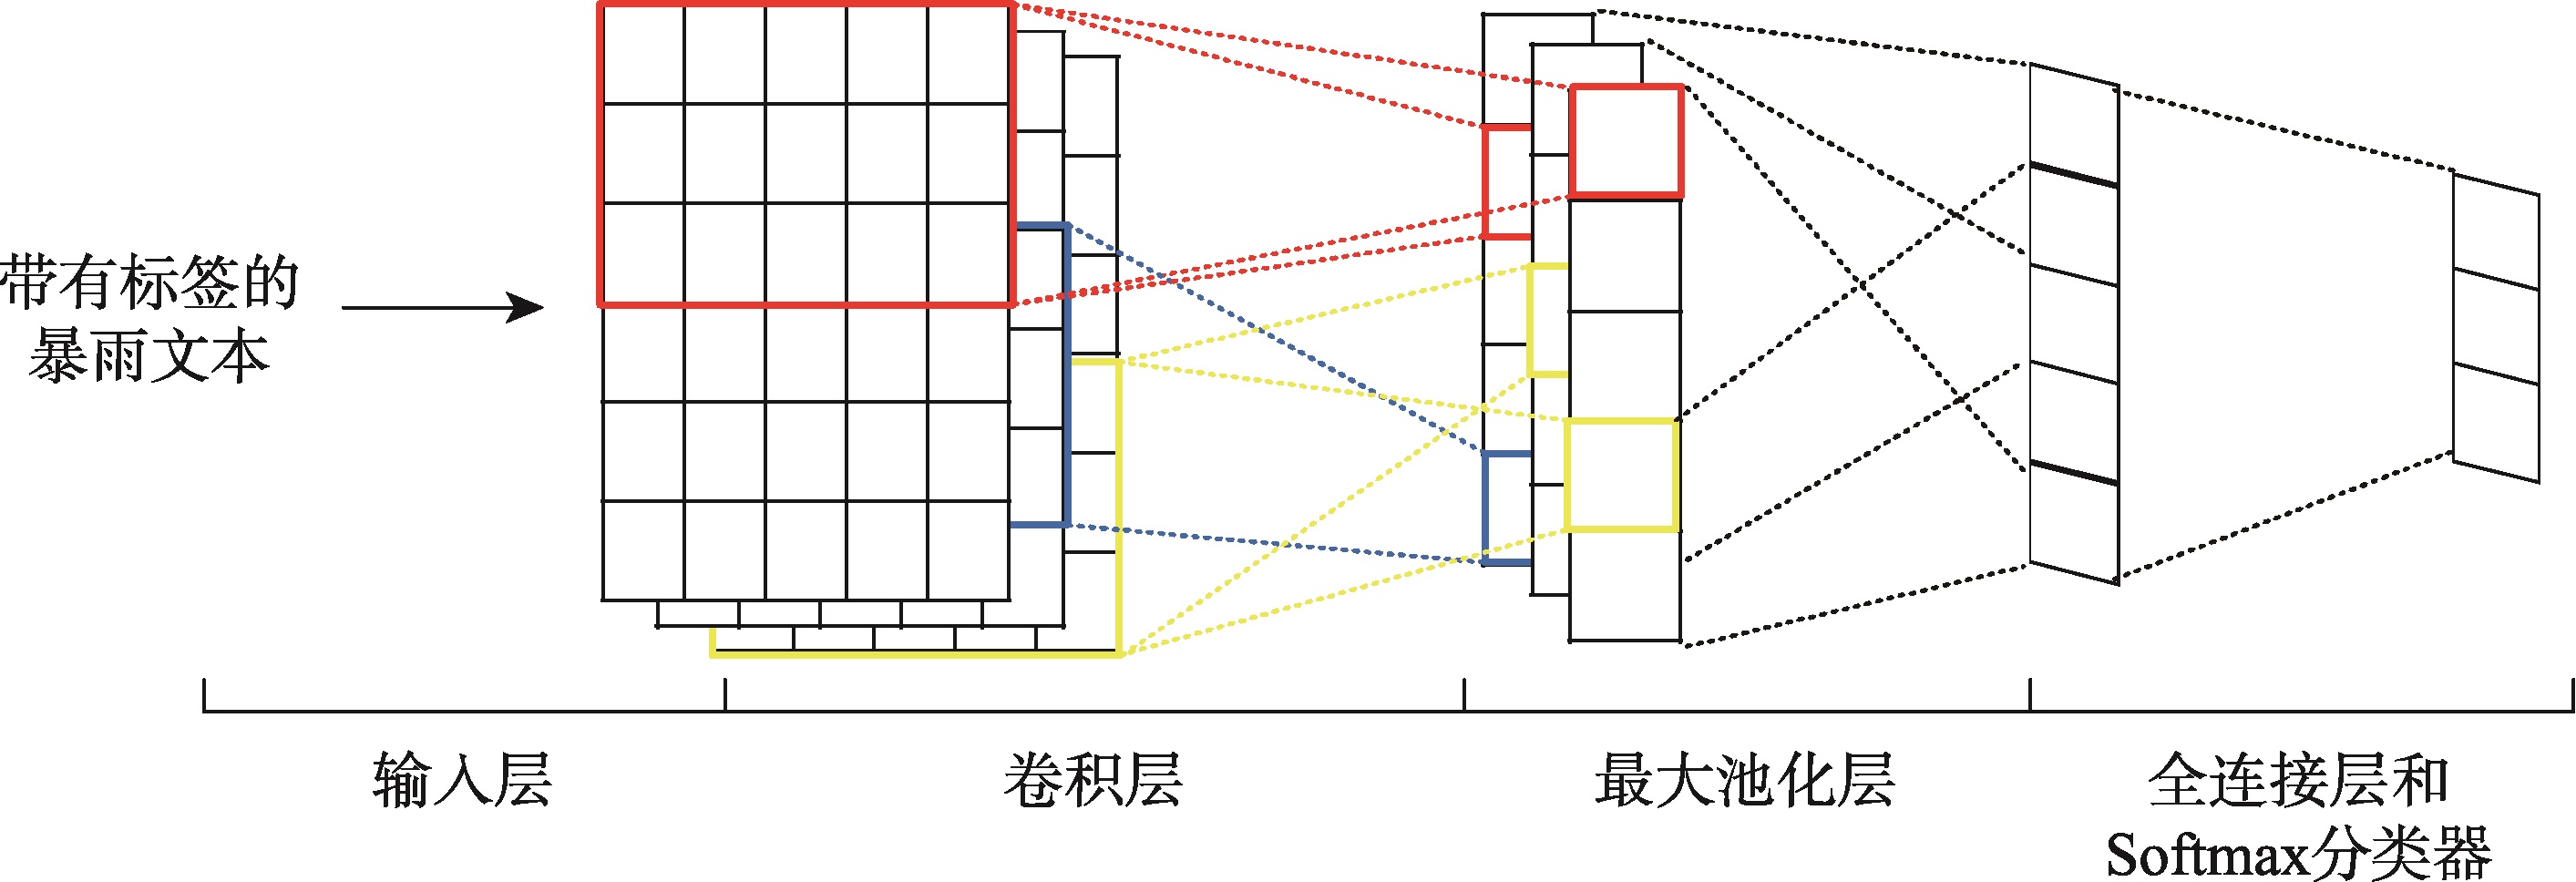
Nowadays social media has played an increasingly significant role in disaster management, thanks to its real-time nature and location-based services. When a disaster happens, a large number of images and texts with temporal and geographic information quickly flood in the social media network. Complementary to the traditional disaster management, social media could provide a lot of dynamic, nearly real-time disaster information to researchers. Current studies place more emphasis on using machine learning to deal with social media disaster data. Yet, in many cases deep learning has a better performance in automatic feature extraction than the traditional machine learning, and it can be used to extract and classify disaster information from social media. This paper focused on a method of extracting the disaster information from social media data using Convolutional Neural Network (CNN). To obtain the word vector corresponding to social media texts, a corpus of disaster events by using social media data was trained by word2vec model. Then, the vectorized microblog sentences and their corresponding disaster categories were used as input to the multi-classification model, which is based on convolutional neural network. After training and optimization, we used this model to extract disaster information from a large number of social media data streams. For an experiment, we combined Sina Weibo API and web crawler, and got over twenty thousand microblog texts with the theme of "Beijing Heavy Rainstorm" happened in 2012. Besides the irrelevant texts, we divided the data into seven categories. The topic classification model of rainstorm disaster information was built and trained based on a small number of tagged Sina Weibo data. The experimental results achieved the F-value of over 80% and the precision of over 90%, proving the validity of applying the model to our dataset. Moreover, this model when used to classify the data on Beijing's rainstorm in 2016 newly crawled form Weibo also had a good performance. According to the different rainstorm emergency topics classified by model, we carried out the deep mining of time series and spatial features to detect the phases of disaster development. Through visualization and statistical analysis, it was found that the time series analysis of disaster was consistent with the development of actual disasters, indicating the effectiveness of the CNN-based method in monitoring Beijing rainstorm. The study shows that using deep learning to extract disaster emergency information from social media is effective and feasible, which provides a new approach to real-time disaster emergency management.
With the rapid urbanization in the recent years, the deterioration of urban eco-environment and consequent impacts on human health have raised increasing concern. Air pollution, especially PM2.5, has become one of the most serious problems which threaten public health. As the key of air pollution health assessment, exposure risk assessment needs accurate data of air pollution concentration. However, it is impossible to get intra-urban PM2.5 concentration in random places based on existing monitoring data. Additionally, most PM2.5 risk exposure assessment studies take air pollution concentration as the evaluation index, without considering the spatial distribution of population. Coupling population-weighted assessment method is one of the feasible solutions to solve this problem. To this end, PM2.5 monitoring data, land use data, road data, and meteorological data were applied to developed the PM2.5 Land Use Regression (LUR) model in the Guangzhou-Foshan metropolitan area from December 1, 2013 to February 8, 2014. Then, the population density data were coupled to assess the population-weighted exposure risk of PM2.5. The results reveal that: (1) LUR predicted the spatial distribution of PM2.5 with good performance (R2 of 0.786-0.913). (2) From December 1, 2013 to February 8, 2014, the mean simulated PM2.5 concentration of the Guangzhou-Foshan metropolitan area changed fluctuatingly and the highest concentration was 97.91 μg/m3 (from December 29 to January 11) while the lowest was 53.40 μg/m3 (from January 26 to February 8). PM2.5 exposure in 99.8% of the study area was above the WHO require exposure standard. (3) The spatial distribution of PM2.5 concentration varied from place to place. High-concentration areas were located in Tianhe District, Yuexiu District, north of Panyu District, north of Huadu District, Chancheng District, middle of Nanhai District and middle of Sanshui District, while low-concentration areas included mainly Baiyun District, south-east of Panyu District and south of Shunde District. There were two high-level centers of population-weighted exposure risk located at the Guangzhou and Foshan downtowns. (4) After coupling the population weighted model, the high risk areas of PM2.5 in the Guangzhou-Foshan metropolitan area changed. The old high concentration areas focused on Nanhai District, Tianhe District, Yuexiu District, and Chancheng District, while coupling the population density data resulted in a more concentrated PM2.5 exposure centers, since the high risk areas tended to centralize around the downtowns of Guangzhou and Foshan.
Affected by global warming, extreme heat has become a serious climate disaster in the recent years. Human health, ecological environment, and socioeconomic development have all been affected by heat waves to varying degrees. This study describes the selection of risk factors for heat wave risk assessment and the method of model construction in the recent years. According to the existing literature, we sorted out the basic steps of risk identification and assessment of heat waves. Then we discussed the framework of heat wave risk assessment. The spatial assessment system, which can be used to construct heat wave risk in the future, was proposed. This space system was based on remote sensing technology. The exposure of hazard-bearing body,the hazard of disaster, the vulnerability of pregnant environment and the comprehensive prevention capability of the region should be combined to build a comprehensive evaluation system. Moreover, the selection of evaluation factors was discussed. Based on the literature, we compared various methods for determining the weight of each indicator, such as the graph stacking method, subjective weighting methods, objective weighting methods, and subjective-objective combined weighting methods. We discussed the merits and demerits of each approach. Through comparing the methods, stacking method combined with H-AHP, stood out with its simple addition and subtraction or the multiplication and division, and can be used in the construction of comprehensive evaluation models. And the TOPSIS method, which determines the relative merits of the object based on the distance between the evaluation object and the ideal target,will be the optimal choice for multi-city heat wave risk rating in the future.We provided a reference for constructing a reasonable heat wave disaster risk assessment system in the future. This paper was intended to serve as a basis for further understanding the heat wave hazard and establishing the monitoring, evaluation, and reporting system, as well as for further fostering the establishment of a heat wave disaster warning system in the future.
The Shanxi-Shaanxi-Inner Mongolia region is China's energy production base and also a major carbon emission area. It is very difficult to estimate the carbon emissions of in Shanxi, Shaanxi, Inner Mongolia. How to obtain the spatiotemporal dynamic information of carbon emissions accurately and quickly has important application value for making more informed regional carbon emission reduction plans. In this paper, the Shanxi-Shaanxi-Inner Mongolia region was selected as the study area. Based on nighttime light imagery, the spatial distribution of carbon emissions in Shanxi、Shaanxi and Inner Mongolia were simulated, and then the spatial distribution characteristics and rules of carbon emissions were systematically described. The results showed that the correlation coefficient between the total value of night light pixels and energy consumption carbon emissions was relatively high in the three provinces of Shanxi, Shaanxi and Mongolia during 1997-2016, which all passed the significance test of 1%. From 1997 to 2016, the carbon emissions increased year by year in Shanxi、Shaanxi and Inner Mongolia. Ordos is a "high carbon" area; Tongchuan, Ankang, Shangluo, Hanzhong, Alashan, and Yangquan are "low carbon" areas. The distribution of the carbon emissions presented a distinct pattern ? smaller in southern Shaanxi than in the central areas. The analysis of spatial distribution patterns of carbon emissions in energy rich areas can better inform the formulation of feasible carbon emission reduction policies.
Analyzing the spatial heterogeneity of land surface temperature (LST) is important for understanding the spatial structure of LST. This study retrieved LST by the atmospheric correction method, and constructed a spatial heterogeneity model of LST by using the semi-variogram function. It then took a multi-scale perspective to discuss LST’s spatial heterogeneity in the study area of Chongqing. A Landsat 8 OLI imagery in June 16, 2013 was the primary data source. Results show that: ① The LST’s spatial heterogeneity was exponentially distributed at different spatial scales. ② At the 30 m spatial scale, the spatial heterogeneity was mainly caused by spatial structure, though the proportion of spatial variation caused by random factors accounted for 0.45, showing obvious nugget effect; thus, random factors cannot be ignored at this scale. ③ On the whole spatial scale (30~1500 m), the spatial heterogeneity was mainly caused by spatial structure, and showed obvious spatial scale effect. As the spatial scale increases, the nugget (C0), the partial sill (C), the sill (C0+C), and the nugget-sill ratios (C0/(C0+C)) gradually decreased, indicating that the spatial heterogeneity declined and the spatial autocorrelation gradually increased. Meanwhile, the range (A) gradually increased, indicating that spatially autocorrelated regions gradually enlarged. ④ On one hand, the proportion of spatial variation caused by random factors ranged from 0.23 to 0.46, showing obvious volatility, because the LST also had spatial heterogeneity within each pixel. On the other hand, the spatial variability caused by spatial structure was relatively flat, because the change of spatial scale did not affect the topographic structure. ⑤ From the scale effect perspective, both sill and nugget showed large fluctuations, and the trend was similar from 690 m to 1500 m, indicating that the change of the LST's spatial heterogeneity was related to random factors. In summary, choosing the appropriate spatial scale is very important for analyzing the spatial structure of LST. When the scale is small, the spatial distribution of LST is easily disturbed by random factors, which affects the variability in spatial structure. When the scale is large, the spatial heterogeneity of LST is weak and unstable.
Land Use and Land Cover (LULC) classification products play an indispensable role in ecosystem assessment, climate change simulation, national geographical condition monitoring, and macro-control policy analysis at the global scale; consistency analysis is the precondition of applying various LULC classification products. This paper assessed the area consistency and spatial consistency of five LULC classification products - MCD12Q1-2010, GlobCover2009, CCI-LC2010, FROM-GLC2010 and GlobeLand30-2010- in the global coastal zones. The five products were compared in terms of the deviation coefficient, correlation coefficient, error matrix, and spatial confusion of LULC types. The main findings are as follows: (1) The spatial patterns of LULC in five products demonstrate relatively strong overall consistency, but can have significant local inconsistency. (2) The five products are qualitatively consistent yet quantitatively inconsistent in classifying the LULC in the global coastal zones ? in terms of structure, water ranks top one, followed by forest and unused land, next are farmland, grassland and shrubland, and lastly wetland and artificial surface, yet the exact area of each LULC type differs among different products. (3) For the correlation coefficient, overall accuracy and Kappa coefficient, MCD12Q1-2010/GlobCover2009 have the minimum values, 0.8814, 67.46% and 0.5748, respectively; while GlobCover2009/CCI-LC2010 have the maximum values, 0.9869, 81.50% and 0.7505, respectively; it is because GlobCover2009 and CCI-LC2010 obtained from the same production organization have the same classification system, while MCD12Q1-2010 is different from GlobCover2009 in terms of the production organization, data source, classification system, and classification method. (4) For the spatial confusion/misclassification between any two different products, grassland, shrubland, and wetland have the highest mix-up ratios, followed by farmland and artificial surface, and lastly forest, unused land, and water; this difference is because forest, unused land, and water have distinctive spectral characteristics and clear spatial textures, while grassland, shrubland, and wetland have similar spectral characteristics and fuzzy spatial distributions. (5) There are 28.81% land area in the global coastal zones with relatively low consistency, i.e., with severe spatial confusion; specifically, the misclassification of farmland, forest, grassland, shrubland, wetland, and unused land has direct influence on the spatial consistency of the five products. This paper is hoped to serve as a reference of selecting data from the five available LULC products for researching coastal zones.
The Defense Meteorological Satellite Program Operational Linescan System (DMSP/OLS) nighttime light (NTL) imagery can objectively reflect the impacts of human activities on the scope and intensity of urban built-up areas. Therefore, the DMSP/OLS imagery have been widely used in monitoring urban expansion dynamics. In this paper, the invariant region method was used to calibrate the DMSP/OLS time series NTL imagery. Then, we used the calibrated DMSP/OLS imagery to extract the urban built-up areas in China's east coast from 2001 to 2013. The result shows that the built-up areas in China's east coast increased from 7550 km2 in 2001 to 21 650 km2 in 2013, with a net increase of 14 100 km2. Although the built-up areas have increased year by year, the increase rate has slowed down. The gravity center of the built-up areas has gradually moved south. The Beijing-Tianjin-Tangshan area, the Yangtze River Delta, and the Pearl River Delta are the three major urban agglomerations in the east coast. The Beijing-Tianjin-Tangshan area was unbalanced in regional development, where the small and medium sized cities faced shortage of development resources. The relationship between urban expansion and economic growth was explored. We conclude that population and economy are the two main driving factors for the expansion of urban built-up areas in China's east coast. The rapid urban growth in China's east coast has caused land resource waste to a certain extent. Moreover, we also found that the edges of urban built-up areas were easily mis-extracted, due to the coarse spatial resolution and saturation problem in DMSP/OLS NTL imagery. The new generation of Suomi NPP/VIIRS NTL imagery has greatly improved in spatial and spectral resolutions. In future studies, the advantages of Suomi NPP/VIIRS should be fully explored to provide more accurate monitoring of urban expansion dynamics.
The warming effects caused by urban expansion have always been a hot topic in climate thermal research. Firstly, this study obtains the average proportion and expansion rate of urban-land area of 58 meteorological stations in Beijing-Tianjin-Hebei region within the radius of 2 km based on the 7 periods of remote sensing monitoring data of urban expansion from 1980 to 2015; builds expansion degree index of each meteorological station by entropy method. Then divide these meteorological stations into three types (these are lowly urban-expanded meteorological stations, moderately urban-expanded meteorological stations and highly urban-expanded meteorological stations) by quartering the expansion degree index of all stations. Finally, this study reveals the effects and its contributions of urban expansion through the comparative analysis of the annual and seasonal average temperature change trend of three types of meteorological stations. The results show that: (1) the surrounding of almost all meteorological stations has experienced urban expansion in Beijing-Tianjin-Hebei region during 1980-2015, the average of urban expansion degree index of 58 meteorological stations is 0.377, and the average of urban expansion degree index of C3 meteorological stations is 0.650; (2) the annual and seasonal average warming rates of three types of meteorological stations show as C1 < C2 < C3, and the annual average warming rate of C3 meteorological stations is 0.536℃/10a; the seasonal average warming rate of C1, C2 and C3 meteorological stations are the highest in spring, and the seasonal average warming rate of C3 meteorological stations is 0.637 ℃/10a, while the three types of meteorological stations have the lowest warming rate in summer or autumn; (3) The effects and its contribution rate of urban expansion on annual and seasonal mean warming rate of C3 meteorological stations are higher than that of C2 meteorological stations, the effects and its contribution rate of urban expansion on annual mean warming rate of C3 meteorological stations are 0.342 ℃/10a and 63.81% respectively; the effects of urban expansion on the seasonal average warming rate of C2 and C3 meteorological stations are the highest in winter, these are 0.229 ℃/10a and 0.410 ℃/10a respectively, while that of C2 and C3 meteorological stations are the lowest in spring or summer; the contribution rate of urban expansion on the seasonal average warming rate of C2 and C3 meteorological stations are the highest in autumn, these are 73.24% and 82.96% respectively, while that of C2 and C3 meteorological stations are the lowest in spring.
With the acceleration of urbanization, urban heat island (UHI) effect has become an increasingly serious problem, which poses a great threat to public health and urban sustainability. Vegetation can lower the air temperature by reflecting direct sunlight and through the process of evapotranspiration, and hence plays a key role in improving local thermal environments. Investigating the effect of vegetation on regulating building temperature is very useful for understanding the principle of urban heat island and mitigating the deterioration of urban thermal environment. However, most previous studies are based on remote sensing imagery, which lacks three-dimensional information on vegetation structure. Additionally, these studies are mainly carried out at the urban scale due to the limitation of spatial resolution. Therefore, it remains challenging to quantitatively investigate the effects of vegetation canopy structure on building temperature at small and medium scales. In this paper, we quantitatively investigated the relationship between the LiDAR-derived 3D vegetation structure (canopy density, CD) and the rooftop surface temperature (RST) at the city-block (medium) and individual building (small) scale. We improved the Building Thermal Functional Area model (BTFA). Considering the spatial and quantity characteristics of buildings in Santa Rosa, the optimal sizes of the small and medium thermal function areas were estimated. Then the vegetation canopy density around the buildings at two scales were calculated. The cooling capacity of CD was analyzed by nonlinear fitting model and other statistical methods. Moreover, we used spatial autoregression model to analyze the contribution of CD to lower the rooftop temperature under the interaction of various factors. Results show that the cooling effect of vegetation on buildings is closely related to the canopy density around them: the minimum threshold of 17% is required to achieve effective cooling effect, while 30% and 40% are the optimal thresholds at medium and small scales, respectively. Additionally, changes of RST vary at different scales with the same canopy density. The decrease of RST at the medium scale is on average 0.89 ℃ lager than that at the small scale. The findings suggest that the planning of urban green space should be considered comprehensively in different scales. Moreover, the RST changes at small and medium scales are affected by not only the vegetation structure nearby the buildings but also the overall thermal environment. The methods and results of this paper are helpful to better plan green spaces on the limited urban land resources and build a more sustainable human livable environment.
Traditional methods for monitoring goaf landslides cost manpower and material resources, while optical remote sensing is difficult for quantitatively identifying potential landslides. This paper used InSAR to monitor the slopes of a mountane area in Kafang Town of Yunnan Province that is affected by goafs. To date, there have been some methods for identifying the occurrence of (potential) landslides, but most of them are based on the line-of-sight (LOS) direction deformation or slope direction that is converted from the LOS direction. Yet, when landslide is monitored based on the LOS direction, the actual deformation trend of the landslide cannot be captured. The deformation based on the slope direction is limited by the different slopes of mountains during the conversion process, and cannot reflect the specific landslide deformation. In this context, this paper proposed a new method that integrated the ground monitoring data of SBAS-InSAR, slope, and aspect. The deformation rate of LOS was obtained by SBAS-InSAR, and then it was converted into the vertical deformation rate. Based on the SRTM DEM data of 30 m resolution in the study area, the GIS analysis tool was used to generate the slope and aspect maps. Combined with the satellite parameters of Sentinel-1A, the radar visibility of the study area was partitioned to obtain effective observation values. The slope and aspect were re-extracted to detect areas where landslide is likely to occur, and then they were integrated into the vertical deformation rate to identify potential landslides. The identified potential landslide areas were compared with historical records to evaluate the accuracy of our method. The result showed that the surrounding areas of Kafang town were notably affected by goafs, and that the vertical deformation rate of most areas was more than 10 mm/a. With the proposed method, we found that 16 of the 21 historical landslide points in the study area were identified as potential landslides while 5 were not identified (but also located in the deformation region). We conclude that our proposed method for identifying potential landslides was highly accurate and feasible. This study provides a way to detect potential landslides near the goafs, by determining whether mountain slopes are in a potential and inconspicuous sliding state or not, and accordingly, helps provide early warnings of landslide disasters.
As the cutting-edge technology of modern information technology, remote sensing has the advantages of large coverage, short detection period, strong current situation, and low cost, which makes it possible to quickly and accurately extract large-scale crop planting information. Accurate crop type identification and spatial distribution information can provide basic and necessary information for subsequent crop monitoring applications. Identification of crop spatial distribution by remote sensing is the frontier and a hotspot of multidisciplinary research in geography, ecology, and agronomy. Multi-source remote sensing data plays an important role. Combining the characteristics of winter wheat and rapeseed during their planting and growing stages, this study took Hefei City in Anhui Province as the study area, and used multi-source remote sensing imagery such as ZY-3, Sentinel-2, and GF-1, with elevation and slope data as auxiliary information. Utilizing the object-oriented classification method with multi-scale segmentation, nearest neighbor method, and threshold method as the main steps, the spatial distribution information of winter wheat and rapeseed planting in Hefei City was extracted. Ground truth data from the GVG agricultural sampling system and Google Earth high-resolution imagery were combined to verify the accuracy of the classification results. By confusion matrix analysis, the overall accuracy and the kappa Coefficient were calculated, the values of which were 94.43% and 0.914, respectively. The results show that, to a large extent, the proposed method can effectively distinguish the planting areas of winter wheat and rapeseed in the mixed planting regions and the combination of those various strategies can be applied to the crop classification in other regions with similar characteristics and at even larger scales. Future research can explore the feasibility of using multi-source remote sensing data to map winter wheat and rapeseed for remote sensing monitoring, and can establish a suitable technical system.
Reasonable construction of PM2.5 concentration prediction models is the key to scientifically and accurately predict PM2.5 concentration dynamics. The traditional EEMD-GRNN model predicts PM2.5 concentration with good prediction accuracy, but focuses more on research data and less on its physical meaning. Based on the time series data of PM2.5 concentration in Nanjing duing 2014-2017, this study analyzed the multi-scale variations of PM2.5 concentration and its scale response to meteorological and atmospheric pollution factors. Additionally, the EEMD-GRNN model was reconstructed and validated based on time scale reconstruction. Results show that: ① based on scale reconstruction, the improved EEMD-GRNN model was scientific in predicting the PM2.5 concentration as it considered the variation of PM2.5 concentration and its multi-scale responses to atmospheric pollutants and meteorological factors. The PM2.5 concentration of Nanjing’s sample data had obvious inter-daily and inter-monthly variations. Thus, it is more practical to construct GRNN modeling at the reconstruction scales (i.e., daily and monthly). Meanwhile, PM2.5 was sensitive to factors such as PM10, NO2, O3, RH, and MinT. Thus, choosing these factors as input variables in the GRNN model can be more explanatory for time-series. ② the improved EEMD-GRNN model was more accurate in predicting PM2.5 concentration. The MAE, MAPE, RMSE, and R2 of the improved models are 6.17, 18.41%, 8.32, and 0.95, respectively, which are superior to the validity test results of the traditional EEMD-GRNN model. Furthermore, for the prediction of high-concentration days (i.e., PM2.5 concentration greater than 100 μg/m3), the improved model was more comprehensive than the traditional EEMD-GRNN model. With the new EEMD-GRNN model, the MAPE is 12.02%, 9.03% higher than the traditional model. Our findings indicate that the improved EEMD-GRNN based on scale reconstruction is an efficient method to scientifically and accurately predict PM2.5 concentration, especially in days with high PM2.5 concentration.