The total water resource in the Tibetan plateau is abundant. However, some areas within the plateau are faced with severe water scarcity due to the spatial mismatch between available water resources and demands of population and industries. In this study, multiple sources of data were used to evaluate water supply and demand relationships in Qinghai and Tibet. Water scarcity degrees were assessed at the county, prefecture, and province levels in the Tibetan Plateau for 5 year, 10 year, 20 year and 30 year return periods. The effect of spatial scales on water scarcity assessment was analyzed by comparing water scarcity levels based on analyses on different spatial scales. The spatial pattern of water scarcity in the Tibetan Plateau was characterized, and the population and areas that suffered from water scarcity were identified. At the provincial level, no water scarcity occurred in the Tibetan plateau. Three out of 15 prefectures in the Tibetan Plateau were faced with water scarcity. Twenty nine out of 115 counties had water scarcity problems. Water scarce counties were mostly located in relatively highly populated and urbanized areas including River Huang Valley, Qaidam Basin and the basins of Yarlung Zangbo River, Lhasa River and Nianchu River. Overall, the population and areas faced with water scarcity at the county level were larger than at the prefecture and provincial levels. This can be explained by the spatial difference of water uses between counties. At the county level, 56.4% population and 10.4% areas were faced with water scarcity based on 30 years return period. The rank correlation coefficients of water scarcity degrees in different years in water-scarce counties indicate that counties in the same province are likely to experience water scarcity in same periods, while the chance of counties in different provinces experiencing water scarcity in the same year is rather random. Our findings provide useful information for sustainable water resource exploitation toward coordinated urbanization and resources and environmental management in the Tibet Plateau.
Alpine vegetation change has been a hot topic for climate and ecology related studies. Based on the vegetation coverage data derived from MODIS NDVI and high resolution meteorological data, the spatial pattern and temporal changes of the vegetation coverage in Qinghai Lake basin during 2001-2017 and its response to climate change, human activity and permafrost degradation were analyzed in this study. Results showed that the vegetation coverage of Qinghai Lake basin presented an increasing trend in the last decade. There were differences among different vegetation types, with the largest increase of 6.1%/10a in grassland and 2%~3% in other vegetation types, indicating that grasslands are highly vulnerable to climate change and human activities. Vegetation degradation occurred in some areas of the basin, the area of vegetation degradation increased first and then decreased during the study period. The areas of severe degradation were concentrated in the east coast of Qinghai Lake during 2006-2011, and in the northwest of the basin during 2011-2017. These are the desert areas with low vegetation coverage in Qinghai Lake basin, key for future ecological restoration. Climate change is the leading factor of vegetation coverage change in the watershed, contributing 84.21% to vegetation coverage change of main vegetation types in the Qinghai Lake basin, 81.84%, 87.47% and 75.96% to vegetation coverage change of grassland, meadow and shrub, respectively. At different altitudes, air temperature and precipitation have different influences on vegetation coverage change. Precipitation was mainly positively correlated with vegetation coverage change when the altitude is below 4000 m, but mainly negatively correlated while altitude is above 4000 m. With the increase of altitude, the areas where air temperature is positively correlated with vegetation coverage decrease, while the areas where air temperature is negatively correlated increase. The contribution rate of human activities to vegetation coverage change of major vegetation types in the watershed was 15.79%, and that of grassland, meadow and shrub was 18.16%, 12.53% and 24.04%, respectively. Human activities in the area around Qinghai Lake had a promoting effect on vegetation restoration, but in the northern part of Qinghai Lake basin, human activities were still more destructive than construction. The degradation of permafrost had little effect on the change of vegetation coverage of meadow and shrub in Qinghai Lake basin, mainly affecting the change of grassland vegetation coverage. The growth rate of grassland vegetation coverage decreased by 1.2%/10a due to the degradation of permafrost. However, the interaction mechanism between permafrost, hydrology and vegetation is complex, it is hoped that this gap will be filled later.
The formation and development of the urban system play a vital role in regional urbanization process and socio-economic development. They also have a significant impact on the eco-environment. Due to the special geographical environment and relatively poor socio-economic foundation, the urban system of the Tibetan Plateau seems less developed. Moreover, the relevant literature in Chinese and English are both scarce, hindering the construction of national ecological security barriers and the sustainable development of the Tibetan Plateau. Therefore, based on statistical data, remote sensing data, and GIS spatial analysis methods, this paper took city proper and urban districts (i.e., the core urban areas of cities and officially established towns in China) as the research object, and analyzed the spatiotemporal evolution patterns of the spatial structure and scale structure of the urban system in the Tibetan Plateau during 1990-2015. Meanwhile, based on the urban gravity center movement model, the spatial patterns of the gravity centers of the urban population and urban construction land in the Tibetan Plateau during 1990-2015 were analyzed. We have four major findings. Firstly, the urban spatial distribution of the Tibetan Plateau shows an overall pattern of "intensive in the southeast, sparse in the northwest" and "globally dispersed, locally agglomerated." Secondly, the number of officially established towns increased with different speeds in three stages. The distribution of the urban system as a whole has been more and more agglomerated and the level of spatial imbalance has been on the rise. However, the upward trend has slowed down markedly since 2005. Thirdly, though the number of officially established towns has increased significantly, the urban populations in 96.88% of them are under 50 000. Large, medium, and small cities are underdeveloped. Fourthly, the gravity centers of the urban population and urban construction land during 1990-2015 were all located in the southeast region of the Tibetan Plateau. The gravity centers of the urban population during 1990-2015 shows a movement direction of "first to the southwest, then to the northeast and southwest." It has moved 116.6 km to the southwest during the entire period. The gravity centers of the urban construction land during 1990-2015 shows the movement direction of "first to the southeast, then to the northwest and northeast." It has moved 43.5 km to the northeast during the entire period. Our findings provide basic data to studies of the new type urbanization and the optimization of urban spatial pattern in the Tibetan Plateau. This paper also provides a method for urban scale estimation under the conditions of data deficiency and statistical caliber inconsistency, which will help advance China's urbanization studies.
The Qinghai-Tibet Plateau has a vast land area, but the space suitable for human habitation is highly concentrated on parts of the plateau. The middle reaches of the Yarlung Zangbo River Basin is the most important population residing area on the Qinghai-Tibet Plateau. In this case study of the middle reaches of the Yarlung Zangbo River Basin, the kernel density analysis, space hotspot detection, the Geodetector, and other methods were applied to reveal the spatial differentiation characteristics of the size, shape, and density of urban and rural settlements and to detect the influence of physical factors from the perspective of multiscale feature units of "point-polyline-polygon". The results show that: (1) At the basin scale, there is a large difference in the scale of townships in the middle reaches of the Yarlung Zangbo River Basin, basically forming a North-South symmetry with "Pengcuolin-Zengshi Township" as the axis. Moreover, the pattern of the urban and rural settlements is generally regular and the density is generally low. (2) At the transect scale, only the density distribution of the Lhasa River strip is linear, while the size, shape, and density of the Yarlung Zangbo River and Xiangqu-Nianchu River, and the shape and scale of the Lhasa River are nonlinear in their respective directions. In other words, in the east-west direction of the residential area, the distribution scale and shape are characterized by "large and small at both ends" and the distribution density "small and large at both ends". However, the scale, shape, and density of the north-south direction are characterized by "large in south and small in north". (3) At the patch scale, the size of settlements is generally small, with an area of less than 1000 m 2, up to 19 099, accounting for 55.14%. The shape of the settlement is relatively regular; there are 21 256 plaque shapes for the rule type, accounting for 61.37%. Finally, the overall distribution density is low (only 0.34/km 2). (4) The size, shape, and density of urban and rural settlements are affected by many physical factors, but the influence degree of each factor is different. Among them, precipitation has no significant impact on the size, shape, and density of residential areas, altitude has the greatest impact on the size and density of urban and rural settlements, while topography and river proximity have significant impact on the morphology. Our findings can provide theoretical basis for rational optimization of the population distribution pattern on the plateau and the formulation of scientific plateau development strategies, so as to better serve the national ecological security and the economic development of Tibet.
The magnificent natural scenery, magical cutrual landscape, and unique ethnic culture have made the Tibetan Plateau a paradise for tourists from home and abroad, and it is urgent to further explore the interactive coupling relationship between tourism economy and ecological environment. This paper constructed a comprehensive index system for assessing the tourism economy and eco-environment system in the Tibetan Plateau, and usedthe panel data of 15 cities and states in Qinghai Province and Tibet Autonomous Region from 2000 to 2017 to examine the coordination effect and interactive stress between tourism economy and eco-environment system. Results show that: (1) From 2000 to 2017, only Lhasa and Xining's tourism economyindex showed a rapid growth trend, while the other cities and states showed a slow growth trend. The overall eco-environment index of the Tibetan Plateau was relatively high, only Xining and Haidong showed a fluctuating growth trend, while the other cities and states showed gentle changes; (2) The coordination between the tourism economy and the eco-environment in Tibetan Plateau manifested a fluctuating growth trend over time, and presented a core-peripheryspatial pattern of "high in the south and low in the north, high in the east and low in the west" in Qinghai (with Xining as the core) and Tibet (with Lhasa as the core). (3) The dominant type of synergistic effects of the composite system in the Tibetan Plateauis" tourism economy lagging behind eco-environment." Lhasa and Xining both show the trend of thee stages: tourism economy lagging behind eco-environment-balanced development of the two systems eco-environment lagging behind tourism economy; (4) Based on the double-exponential coupling function relation model, it was confirmed that there was interactive stressbetween the tourism economy and eco-environment in the Tibetan Plateau.
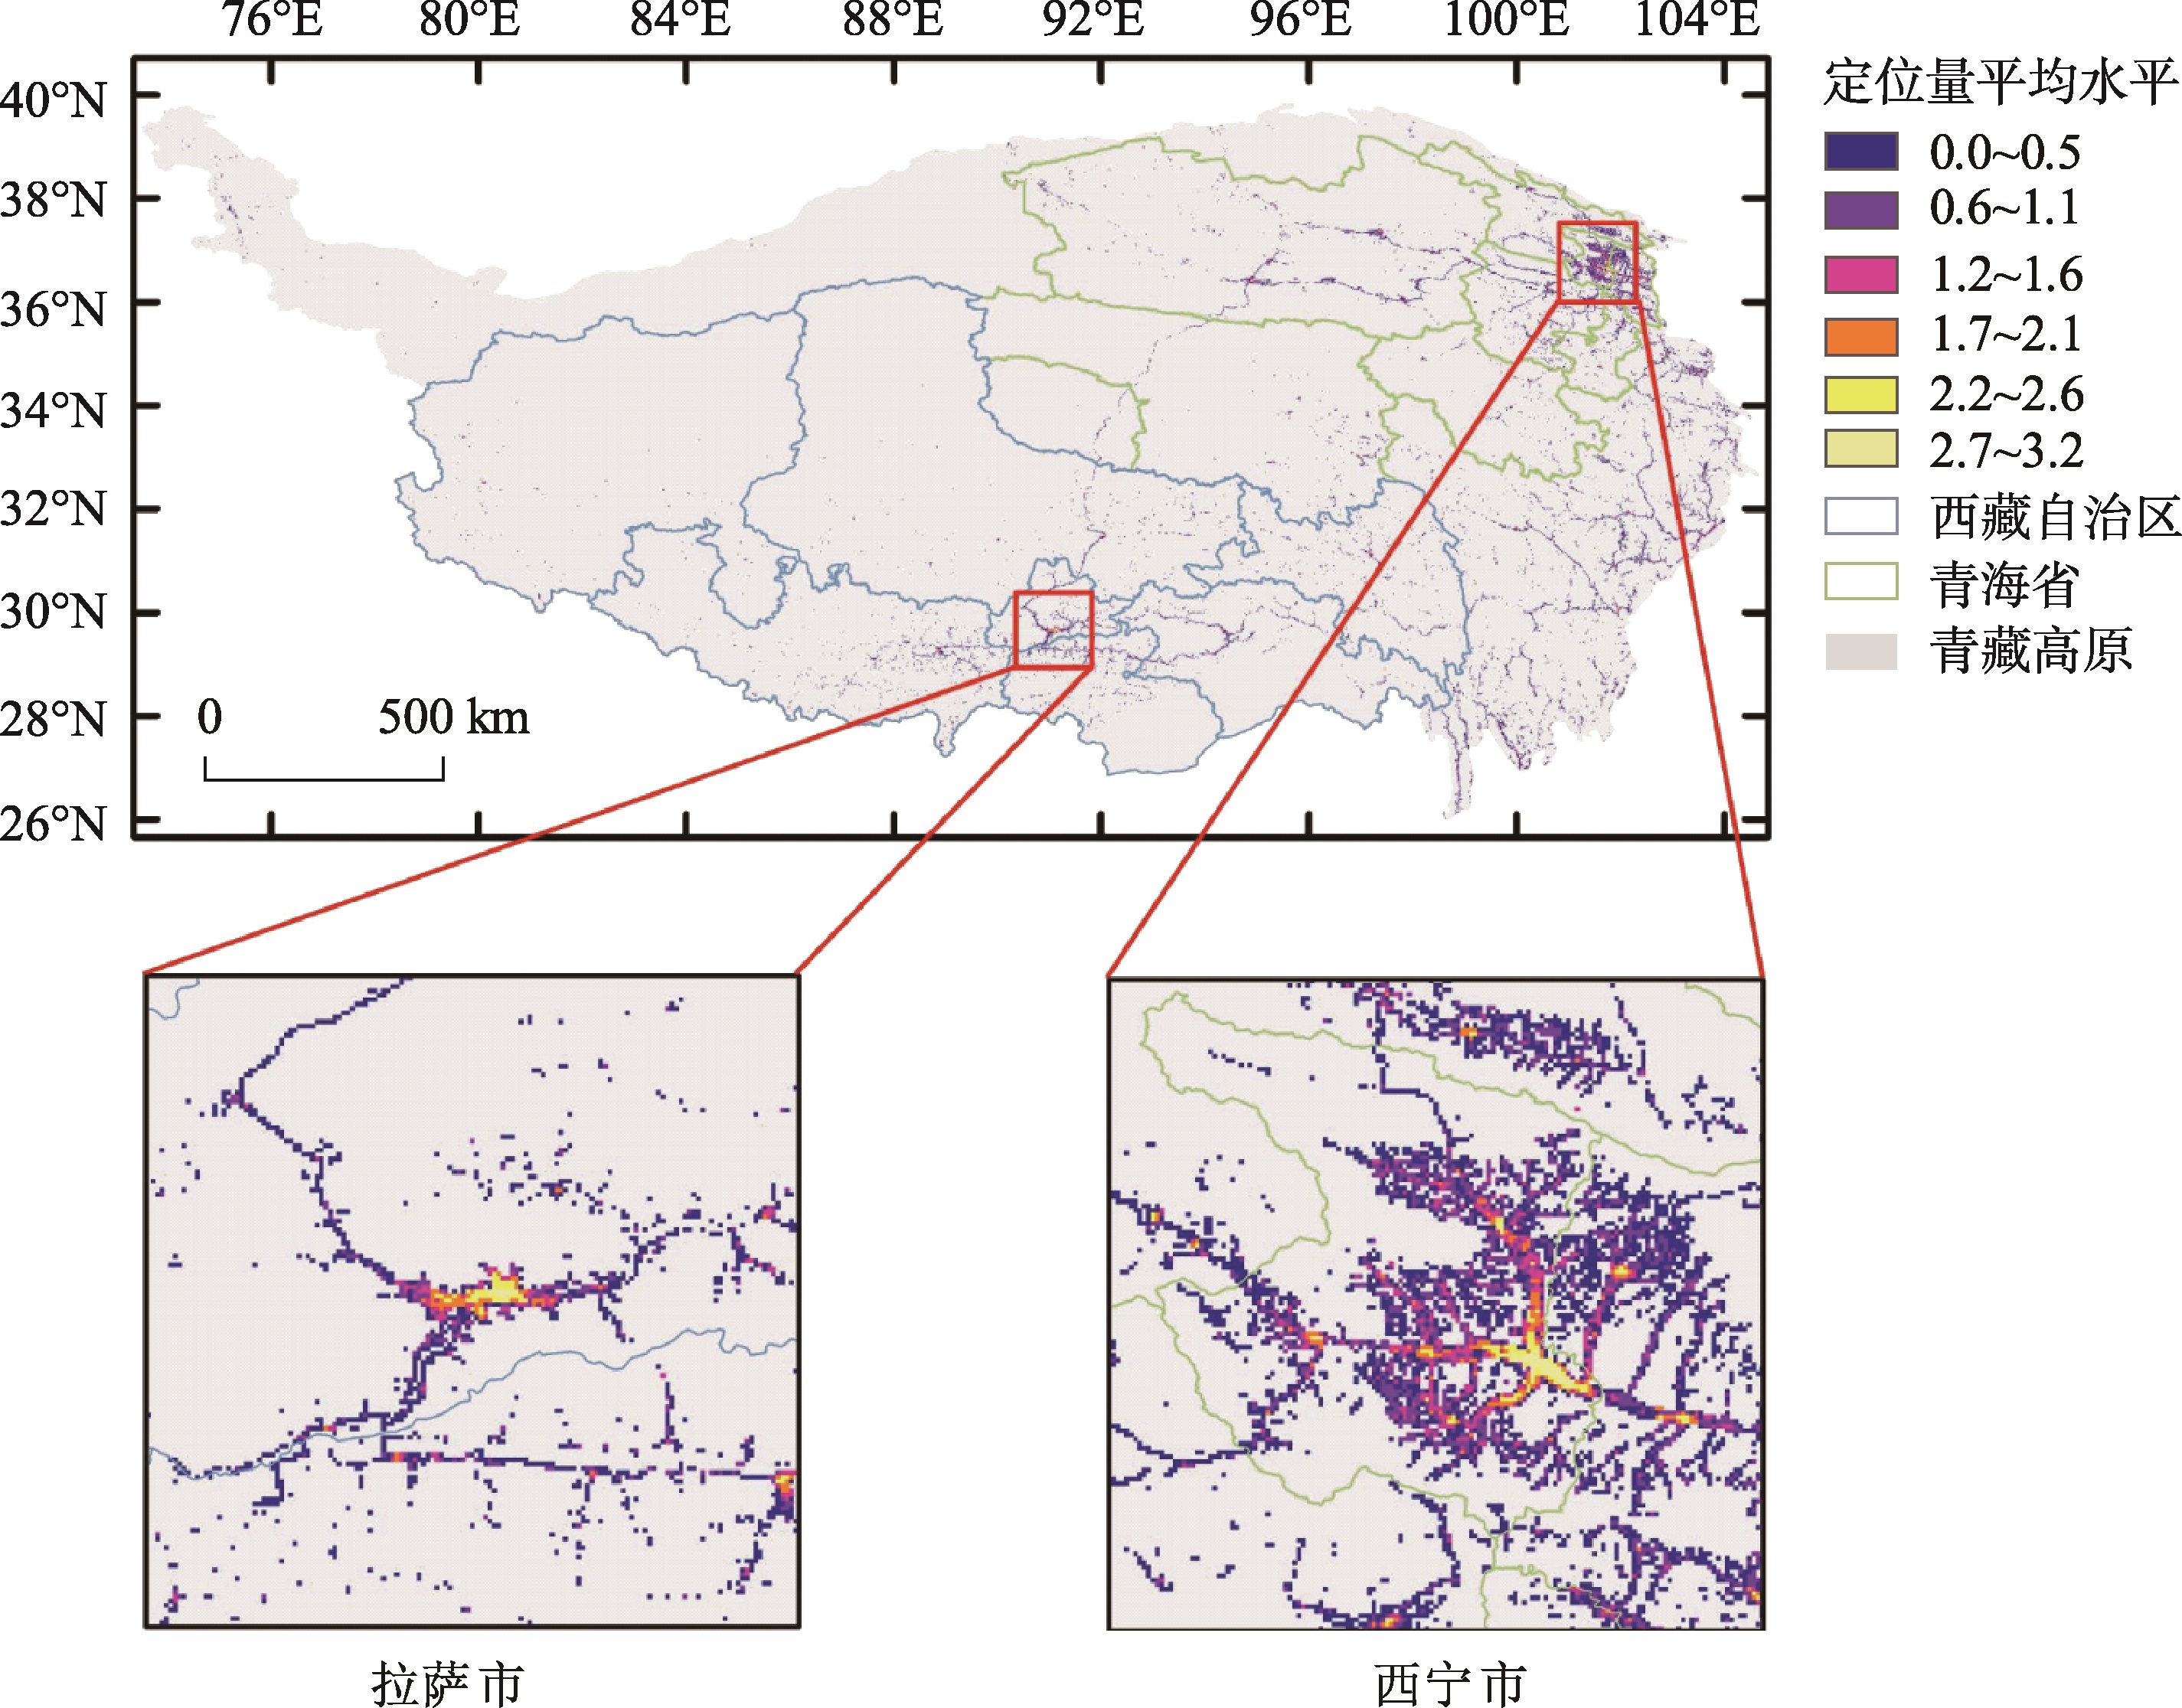
Human activities play an important role in transforming the eco-environment of the Qinghai-Tibet Plateau (QTP). Extensive studies have been conducted on the human activities in the prehistoric QTP and on population distribution and migration in the recent decades, yet, most of them rely on limited demographic materials of coarse spatial resolutions. It remains understudied regarding the fine-scale spatiotemporal pattern of human distribution in the QTP. In this context, geospatial big data generated from ubiquitous mobile communication technology and internet provide a great opportunity to investigate the dynamic human distribution at very fine scales. This study took the advantage of the geospatial big data, including the mobile phone location requests (LR) and population migration, and employed time series decomposition and anomaly detection approaches to explore the population distribution changes in the QTP during the 2017 National Day holidays. Results show that, at the provincial and prefectural scales, Qinghai, Tibet, and their provincial cities exhibit a featured "tidal change" pattern that the LR first decreased then increased. Such fluctuation in Qinghai were stronger than that in Tibet, and cities in the same province demonstrated significant differences. At the grid scale, the LR in the surrounding areas of Xining and Lhasa displayed a spatially “decentralized pattern” that the LP dropped in the central areas yet increased in the peripheral. Based on the anomaly detection approach, we found the number of anomaly grids and deviation magnitude increased in Xining, Haidong, Haibei, Hainan, and Huangnan of Qinghai since the holiday. More positive anomalies were observed than the negative ones, and the negative anomalies were concentrated in cities of large population densities such as Xining and Lhasa. Further analysis combining the population migration data reveals that the travel behaviors potentially drove people swarming to the nearby scenic spots and that the massive migration between cities was an important reason for the increase of LR in areas surrounding Xining and Lhasa. The decrease of LR in the central areas of cities could be partly attributed to significant population migration, but the different daily routines and location request frequencies during holidays may also be important reasons. Our findings demonstrate the potential of using geospatial big data to improve our understanding of human distribution and migration, which could further support fine management and decision-making for plateau urbanization and ecological protection.
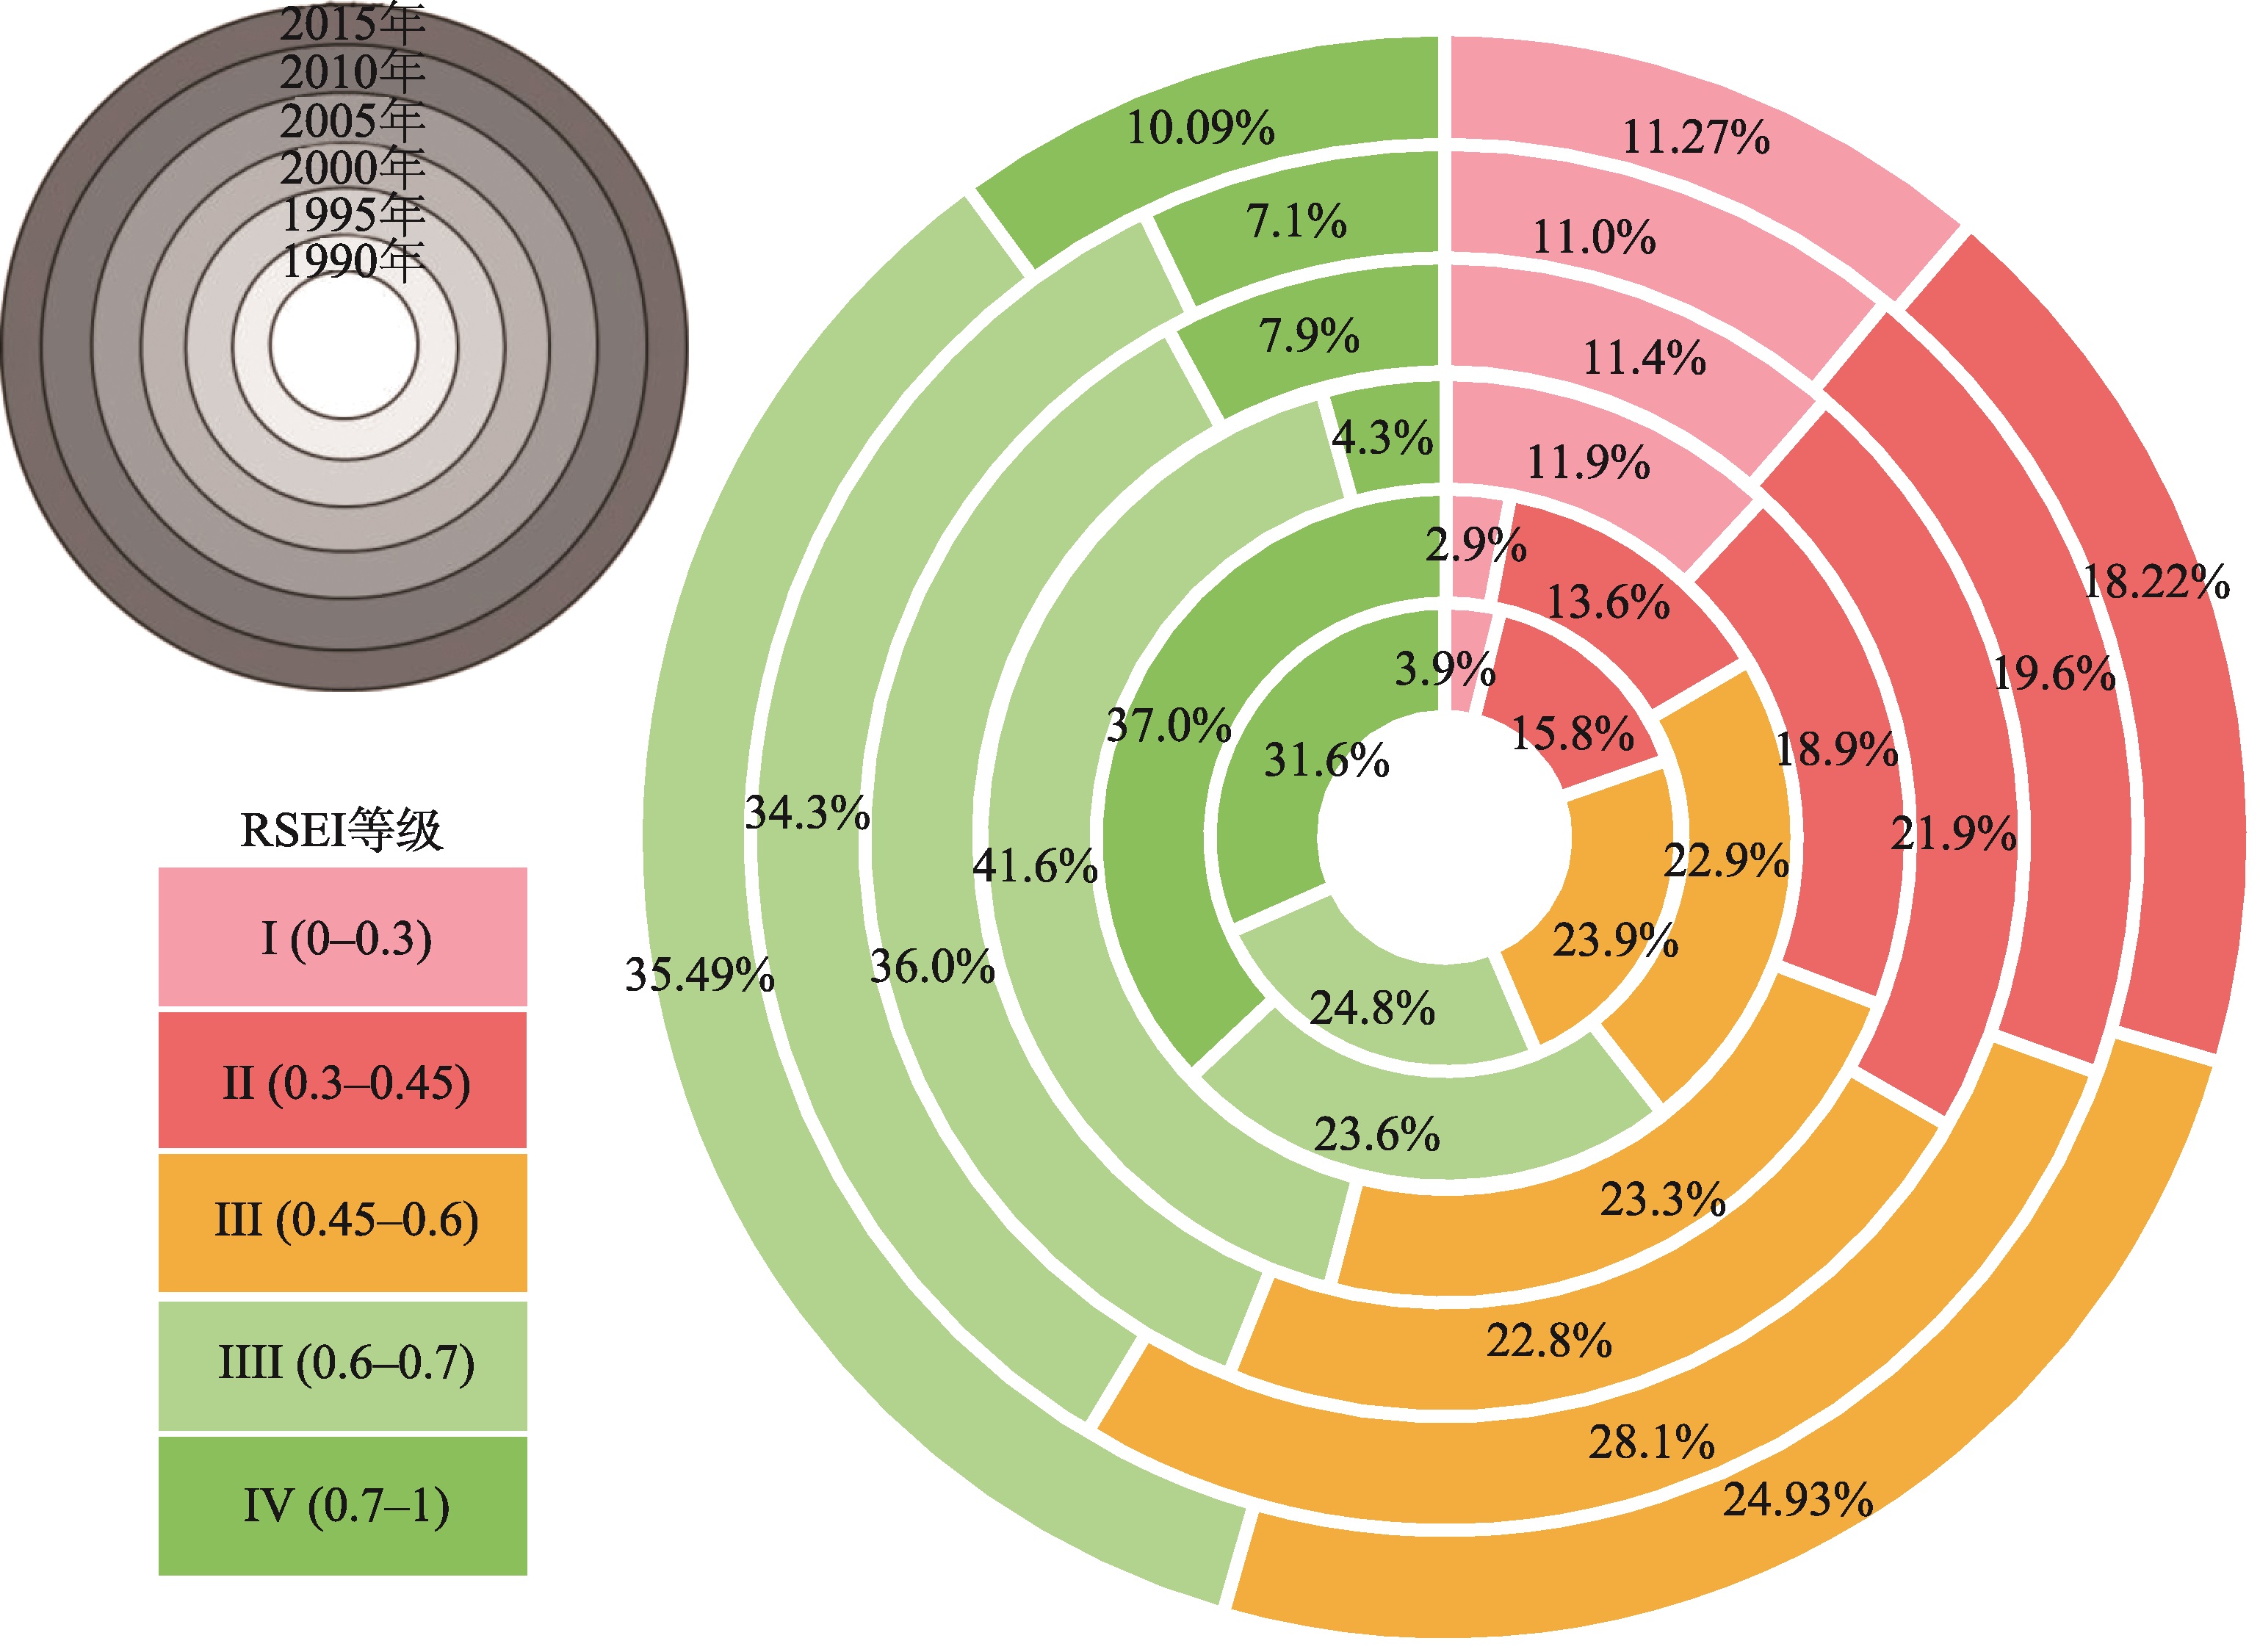
The Sanjiangyuanregion is known in China forits fragile and sensitive terrestrial ecosystem. Degradation of its ecosystem is often irreversible, to which remote sensing based monitoring has much to offer. However, due to the cloudy and other adverse meteorological conditions there, obtaining cloudless Landsat imagery of the same season in the large region remains a big challenge. In this study, based on the Google Earth Engine platform (GEE), an image composite method was applied and 3766 tiles of Landsat TM historical images were employed to generate the same seasonal clear imagery with the lowest cloud possible composited at the pixel level. With the help of parallel cloud computing ability in GEE, a remote sensing ecological index (RSEI) was calculated directly and efficiently in GEE to reflect regional eco-environment quality. Specifically, we monitored and assessed the eco-environment quality of the Sanjiangyuan region in Qinghai Province during 1990-2015. Results show that: (1) During 1990-2000, the eco-environment quality dropped quickly (RSEI average value dropped quickly from 0.588 to 0.505), and his region suffered from mainly mild degradation; (2) During 2000-2015, degradation of the eco-environment quality slowed down toward stabilization and the eco-environment quality showed upgrade tide from 2015, and the areas of mild degradation significantly decreased. Moreover, the eco-environment quality in this region showed a spatial gradient of west-to-east degradation. Our findings provide comprehensive information for improving the eco-environment of the Sanjiangyuan region, and demonstrate the potential of using GEE for monitoring and assessing eco-environment quality at large scales.
Knowledge Graphs (KGs) are crucial resources for supporting geographical knowledge services. Given the vast geographical knowledge in web text, extraction of geo-entity relations from web text has become the core technology for constructing geographical KGs. Furthermore, it directly affects the quality of geographical knowledge services. However, web text inevitably contains noise and geographical knowledge can be sparsely distributed, both greatly restricting the quality of geo-entity relationship extraction. Here, we proposed a method for filtering geo-entity relations based on existing Knowledge Bases (KBs). Specifically, ontology knowledge, fact knowledge, and synonym knowledge were integrated to generate geo-related knowledge. Then, the extracted geo-entity relationships and the geo-related knowledge were transferred into vectors, and the maximum similarity between vectors was the confidence value of one extracted geo-entity relationship triple. Our method takes full advantage of existing KBs to assess the quality of geographical information in web text, which helps improve the richness and freshness of geographical KGs. Compared with the Stanford OpenIE method, our method decreased the Mean Square Error (MSE) from 0.62 to 0.06 in the confidence interval [0.7, 1], and improved the area under the Receiver Operating Characteristic (ROC) Curve (AUC) from 0.51 to 0.89.
In traditional indoor positioning field, there are many technical difficulties need to be solved. For instance, it is true that most researchers in their studies have neglected the accuracy of base map which is an indispensable factor and essential foundation of the overall accuracy of indoor positioning. On top of that, current indoor positioning system needs auxiliary facilities and multiple additional modules to assist the whole system to achieve positioning. Furthermore, beacons which are used to locate where the user is have the disadvantages of poor confidentiality while radiating strong signals at the same time. Aiming at those problems, this article proposed a fusion indoor positioning algorithm which was based on Visual Light Communication technology and Pedestrian Dead Reckoning algorithm. Particularly, we combined the information of high-precision indoor map and designed a high-precision indoor map-assisted positioning system to improve the accuracy of the positioning results. To be specific, abandoning the traditional mapping method which was generated by manual drawing, we used the Turtlrbot platform (an indoor drawing robot equipped with two-dimensional laser scanning radar) to construct the high-precision indoor map while it was moving in the interior space. In the process of indoor map construction, the Gmapping algorithm in the platform was run to build a two-dimensional grid map in a quite fast speed. Based on this, we used the Extended Kalman Filter algorithm to combine the Visual Light Communication technology with Pedestrian Dead Reckoning algorithm to achieve fusion positioning which was assisted with the high-precision map information. As shown in the experiments, the fusion positioning algorithm actually managed to combine the technical advantages of both Visual Light Communication and Pedestrian Dead Reckoning algorithm. Besides, the fusion algorithm realized a fairly ideal state where VLC positioning was able to combine with the information of high-precision map to provide adaptive and dynamic correction to the positioning results of Pedestrian Dead Reckoning algorithm, thus further providing better theoretical support and technical reference for the new kind of high-precision indoor positioning which had the characteristics of low-cost, no signal radiation, strong confidentiality with a small number of auxiliary facilities and additional modules. The experimental results showed as follows: Firstly, the ranging resolution during map construction was less than 0.5 mm; Secondly, the overall accuracy of fusion positioning was 1.33 m; Lastly, the average positioning response time was 0.58 s.
With the rapid development of urbanization in China, urban scale is increasing. The urban population is increasing rapidly, and public emergencies occur frequently, which raises new requirements for emergency management and decision-making of public emergency departments. In cities, the population density is very large and the speed of population flow is fast. Once an emergency occurs in the crowd, there will be so many people involved. Therefore, relevant departments are required to take scientific and efficient emergency response actions timely. It is an important aspect of emergency response for urban emergencies to select and allocate emergency medical institutions. In the process of emergency decision-making, the selection of medical institutions should meet two requirements. On one hand, it should enable the injured to reach the selected medical institutions quickly; On the other hand, it requires the selected medical institutions to have the ability to deal with emergency events and realize the accessibility of emergency medical services. However, geographic location of medical institutions and real-time traffic are the main factors affecting the spatiotemporal accessibility of medical institutions. Meanwhile, the availability of medical services is determined by the matching degree between the resource quantity in medical institutions and emergency assistance need. Based on existing research and the theory of spatiotemporal accessibility, this paper focused on the needs of urban emergency relief, and studied the method to recommend emergency medical institutions for decision-makers. So, the location of medical institutions, real-time traffic, the grade and resources quantity of medical institutions, and the need for emergency assistance were used as choice indicators to define the spatiotemporal accessibility of medical institutions. A medical institution selection model suitable for emergency assistance of city emergencies was proposed, which can recommend medical institutions that meet the emergency response requirements for emergency decision-makers. On this basis, an algorithmic flow for the model was designed, and its feasibility and the role of key steps were verified experimentally. Compared with the traditional accessibility measurement method, the emergency medical institution selection model and algorithm proposed in this paper consider the impact of real-time road traffic situation and the matching degree between emergency rescue demand and emergency resource. Meanwhile, this algorithm can complete the route planning while selecting the most suitable medical assistance institution, which can improve the decision-making efficiency. It is of great practical significance for improving emergency response.
Impervious surface is an important indicator of urban ecological environment, which is of great significance for urbanization and environmental quality assessment. The complexity of urban land use and the diversity of impervious surface materials make it a challenge to extract impervious surface directly from high-resolution remote sensing imagery. To meet the requirement of impervious surface extraction from high-resolution remote sensing imagery at the urban scale, a model of impervious surface extraction based on deep learning was proposed in this paper. Firstly, deep convolution neural network was used to extract image features. In extracting impervious surface of complex cities, a convolution layer and a pool layer were retained. While the void convolution was introduced to increase the field of receptivity and reduce the loss of information, so that each convolution output contained a larger range of information. Secondly, a probabilistic graph learning model was constructed according to its neighborhood relationship, and high-order semantic information was introduced to optimize the features to achieve accurate extraction of impervious surfaces. This paper choosed Wuhan as the experimental area, and took GaoFen-2 satellite remote sensing imagery as the data source to implement the proposed model for the extraction of impervious surface thematic information. The automatic extraction accuracy was 89.02% in the construction area and 95.55% in the urban-rural junction. Compared with the traditional machine learning algorithms such as random forest and support vector machine, the efficiency and accuracy of the proposed deep learning method were better. Statistics and analysis of the impervious surface information of the main administrative regions in Wuhan showed that the proportion of impervious surface in the whole territory of Wuhan was 11.43%, and the proportion of impervious surface in the core main urban area was close to 70%. Additionally, the present situation and development planning characteristics of Wuhan were analyzed and discussed. The impervious surface can be used as a link between urban development level and environmental quality. The distribution of impervious surface in Wuhan development planning of various administrative districts is closely related to the sustainable development of the city. Our findings suggest that the deep learning method is effective for the extraction of impervious surfaces from high-resolution remote sensing imagery, and can provide technical support and data reference for the construction of sponge city and ecological city.
Geographic Object-Based Image Analysis (GEOBIA), as a new paradigm, can achieve higher accuracy than pixel-based image analysis for high-resolution remote sensing imagery. Image segmentation plays an important role throughout the course of the GEOBIA. Multi-resolution segmentation (MRS) algorithm is widely used to segment an image into meaningful objects. It is a bottom-up region merging process integrated into eCognition software, which includes three key parameters (i.e. scale, shape, and compactness) to determine the size and boundary of the image objects. As a key step of GEOBIA, how to select the appropriate segmentation parameter values in MRS remains a challenge, and has an important influence on the subsequent segmentation and classification results. Previous studies focused on segmentation parameters optimization using either unsupervised or supervised methods. However, which method (i.e. unsupervised and supervised) is more suitable for analyzing specific land covers of high-resolution remote sensing imagery is still underexplored. To close the gap, we compared the optimal segmentation and classification results based on unsupervised and supervised methods. Meanwhile, we tested with three land cover types (i.e., farmland, residential area, and pond), and choose two representative segmentation parameter optimization methods for unsupervised and supervised methods, including Estimation of Scale Parameter 2 (ESP2) and Euclidean Distance 2 (ED2). The multi-source high-resolution remote sensing data (i.e., Quickbird, Worldview-2, and ALOS) were used to validate the robustness and generalizability of the unsupervised and supervised methods. We found that for a certain land cover category, the boundary of segments obtained by the supervised method seemed more consistent with the geo-objects in real world, while the optimized parameters were too large to extract the small area of geo-objects for the unsupervised method, leading to the lower classification accuracy. The supervised method performed better in analyzing the segmentation parameters optimization of the geo-object using the referenced data of land cover categories, at the same time which can break out the effect of different landscape and image resolution via reference dataset optimization, while the unsupervised method depended on image features, the artificial visual interpretation and had lower recognition accuracy due to higher subjectivity and uncertainty in land cover category identification. Although the overall classification accuracy is still above 90.08%, the omission rate is 1.43~4.65 times to the supervised method. Comparing the two methods, the supervised method obtained the optimal segmentation results with higher efficiency and accuracy using fewer segment datasets in both segmentation and classification results than the unsupervised method. Our findings suggest that the supervised method is more suitable for mapping specific land covers with high-resolution remote sensing imagery.
The development of modern agriculture is directly related to the transformation of the traditional agriculture. The recognition and extraction of typical objects of modern agriculture (TOMA) through remote sensing imagery has many advantages and has become the mainstream of current applications. Since traditional recognition methods are easily affected by external environmental factors (e.g., the shape, size, color, and texture of TOMA, and the distance, angle, and weather conditions for obtaining the remote sensing imagery), the accuracy of recognition results is usually difficult to meet application requirements. In the recent years, deep learning methods have seen wide applications in many fields, which greatly promote the advancement of artificial intelligence. Convolutional Neural Network (CNN) has acquired breakthrough research results in image classification, object detection, semantic segmentation, and so on. Based on the structure of CNN, many excellent network structures have been developed, such as Regions with CNN, Fast R-CNN, Mask R-CNN, etc. In particula, Faster R-CNN is one of the mainstream algorithms for target detection. However, when directly applied to the recognition of TOMA, the Faster R-CNN still has some drawbacks to be improved, especially the problem of small targets with large background. By taking the image features of TOMA into account, a DRTOMA (Deep Residual TOMA) algorithm was proposed in this paper based on the idea of deep residual network and Faster R-CNN. Firstly, the deep residual network was used as the basic feature extraction network to obtain deeper features and suppress the network degenerate problems. Secondly, an improved spatial pyramid pooling layer was added between the residual unit and the fully connected layer to remove the fixed size limit of the input image while increasing the sensitivity to the scale of the network. Lastly, a dropout layer was added between the fully connected layers to reduce the complexity of the network and improve the over-fitting effect. Simulation results showed that compared with some existing algorithms, the average recognition accuracy and recall rate of the DRTOMA algorithm were optimal, being 91.87% and 90.643%, respectively. The recognition accuracy of the DRTOMA algorithm and that of Faster R-CNN were similar. However, the DRTOMA algorithm had a recall rate of about 2% higher than the Faster R-CNN algorithm, and the network was easier to converge and can be trained for a shorter time. Our findings suggest that the DRTOMA algorithm is an effective and feasible TOMA detection method.
With the implementation of the Great Western Development Strategy and the Belt-Road Initiative, urban development in northwest China has undergone tremendous changes. Extracting built-up land information in northwest China more accurately by remote sensing imagery is important for sustainable urban planning. By using Landsat TM/ETM + imagery, this paper proposed a new method for extracting built-up land information in the urban districts in Lanzhou City and Xining City. By detailed spectral signature analysis of the image, the Normalized Difference Bare Land Index (NDBLI) was calculated, which was then synthesized with the Ratio of Residential area index (RRI) and the Modified Normalized Water Index (MNDWI). In so doing, a new type of three-index synthetic image NRM (NDBLI, RRI, MNDWI) was generated. Meanwhile, following the idea of ensemble learning, the first band of principal component analysis(PC1), the Normalized Difference Built-up Index (NDBI), and the Ratio of Residential area Index (RRI) were synthesized to enhance urban built-up land information, which formed another three-index synthetic image PNR (PC1, NDBI, RRI). Then, the maximum likelihood based supervised classification was performed on the new synthesized image NRM (NDBLI, RRI, MNDWI) and the new synthesized image PNR (PC1, NDBI, RRI). Finally, the urban built-up land was extracted by masking out non-built-up land classes. These classification results were compared with the results of the maximum likelihood classification based on the three-index synthetic image NMS (NDBI, MNDWI, SAVI) synthesized by the three indexes of the Normalized Difference Built-up Index (NDBI), the Modified Normalized Water Index (MNDWI), and the Soil Adjustment Vegetation Index (SAVI). Under different spatiotemporal conditions, the three-index synthetic image NRM (NDBLI, RRI, MNDWI), three-index synthetic image PNR (PC1, NDBI, RRI), and three-index synthetic image NMS (NDBI, MNDWI, SAVI) were used to extract the urban build-up land information of Lanzhou City and Xining City. Results show that the overall accuracy and kappa coefficient of classification using the three-index synthetic image PNR (PC1, NDBI, RRI) were higher than those based on the three-index synthetic image NRM (NDBLI, RRI, MNDWI) and three-index synthetic image NMS (NDBI, MNDWI, SAVI). The urban built-up land information was thus extracted by the three-index synthetic image PNR (PC1, NDBI, RRI), with the overall accuracy above 90%. Our findings suggest that the three-index synthetic image PNR (PC1, NDBI, RRI) is suitable for extracting urban built-up land in northwest China.
Nanning is the core city of the Beibu Gulf Economic Zone and the permanent venue of the China-ASEAN Expo, which is undergoing the construction peak of urban subways. Nanning is located in the central and western part of the Nanning Basin, where the geological and hydrological conditions are complicated. The construction and operation of subways may cause potential risks such as surface subsidence. However, it remains understudied regarding the surface subsidence along Nanning subways. In this paper, 54 Sentinel-1A images of Nanning city from April 2017 to December 2018 were processed by Permanent Scatterers Interferometric Synthetic Aperture Radar (PS-InSAR), and then the surface subsidence information was extracted. Results showed that the surface deformation rate was -23.8~9.0 mm/a during the monitoring period, and most of the study area was stable, and the settlement point distribution was sporadic. There were four key subsidence areas , including Pumiao Town, Jiuquwan Farm, Jiangnan Subway Station, and Beihu- Wanxiu Village- Huqiu. The deformation curve of key settlement areas showed an uneven decline trend with time; the reason causing settlement may be attributed to the expansion characteristics of expansive soil, spoil landslide, construction operation, excessive train flow, and drop in the groundwater level. The sedimentation value of the five subways were all within the safe range. The rainy season precipitation of Nanning is rich, and the topsoil of the subway construction area is mainly composed of loose Quaternary overburden, where the underlying bedrock is mainly composed of Tertiary expansive soil with certain instability of engineering mechanics. Therefore, our findings suggest that the PS-InSAR technology should be used for long-term monitoring of key settlement areas and subways of Nanning for safe metro operation.
Aberdare National Park is one of the important landscapes and rare species natural protection zones in Kenya, which is located in the Aberdare mountain area, an important water tower of Kenya. To monitor the dynamics of the eco-environment, evaluate its quality and evolution is essential and important, which will help design government policies for Kenya's water resource protection and sustainable development. In this research, a synthetic Remote Sensing Ecology Index (RSEI) was adopted to analyze the eco-environment quality dynamics in Aberdare National Park during 1987-2018, by using time series Landsat imagery. To calculate RSEI, four remote sensing indexes were extracted from every image, including Normalized Differential Vegetation Index (NDVI), Wet Index (WET), Land Surface Temperature (LST) and Soil Index (SI). These indexes reflect the spatiotemporal variations in the study area from four aspects: greenness, humidity, heat, and dryness. After deriving the four indexes, the Principal Component Analysis (PCA) was used to generate RSEI. Finally, trend line analysis was used to do spatiotemporal dynamic analysis of the eco-environment condition of Aberdare National Park. The results show that the remote sensing ecological index contains most of the characteristics information of the four remote sensing indexes, which can exactly reflect the eco-environment quality of Aberdare National Park. Specifically, NDVI (Greenness) and WET index (humidity) are positively related to the eco-environment quality, while LST (heat) and SI (dryness) are negatively related. The average RSEI of Aberdare National Park decreased from 0.62 to 0.51 during 1987-2018, and the area of eco-environment quality degradation was 551.52 km 2 which covered the 71.85% of the total national park area. The important deterioration reason of ecological environment was climate change combined with human activities. Further analysis shows that the region experienced severe eco-environment deterioration mainly located in the sub-alpine vegetation area and low-altitude forest area eastern of the park. The ecosystem of the sub-alpine vegetation area was fragile and had poor stability because of its simple community structure, which made this area more sensitive to climate change and human activities. On the other hand, the eastern region suffered from over-exploitation and illegal deforestation, and had higher tourist development intensity. So, the eco-environment deterioration of this area was closely related to human activities, the pollution and soil erosion caused by tourist infrastructure construction and repeated rolling of tourist guided vehicles were the main reasons for the degradation of the eco-environment quality.