Previous researches have paid little attention to the multi-level spatial distribution dynamic estimation of the inter-regional migrant population. Preventing the spread of COVID-19 is the most urgent need for society now. Before the closure of Wuhan on Jan 23, 2020, more than 5 million people had left Wuhan to other regions. A better understanding of the destinations of those people will assist in the decision making and prevention of the coronavirus spread. However, few studies have focused on the dynamic estimation of multi-level spatial distribution of inter-regional migrant populations. In this study, by using multi-source spatiotemporal big data, including Tencent location request data, Baidu migration data, and land cover data, we proposed a dynamic estimation model of multi-level spatial distribution of inter-regional migrant population, and further characterized the spatial distribution of the population migrating from Wuhan to other regions of Hubei Province. The results showed that: (1) During the Spring Festival, the average ratio between the number of population increase in the rural areas and the total population change was 124.7% in the prefecture-level cities in Hubei Province. At least 51.3% of the population moving from Wuhan to prefecture-level cities has flowed into rural areas; (2) the spatial distribution of migrants among cities and counties in Hubei Province exhibits a 3-ring structure. The 1st ring is core area of disease, ncludes Wuhan and its surrounding areas, which are mainly characterized by population outflows. The 2nd ring is primary focus area, includes Huanggang, Huangshi, Xiantao, Tianmen, Qianjiang, Suizhou, Xiangyang and parts of Xiaogan, Jingzhou, Jingmen, Xianning, where the total population and the population in rural areas increased significantly during the Spring Festival. The 3rd ring is the secondary focus area, includes Yichang, Enshi, Shennongjia, and parts of Jingzhou and Jingmen, which are located in the western part of Hubei Province and are mainly characterized by a small inflow of population. We suggest higher attention to those rural areas of the counties located in the 2nd ring to better control and prevent the coronavirus spread. The research was completed in 2-3 days, showing that big data can quickly respond to major public safety events and provide support for decision-making.
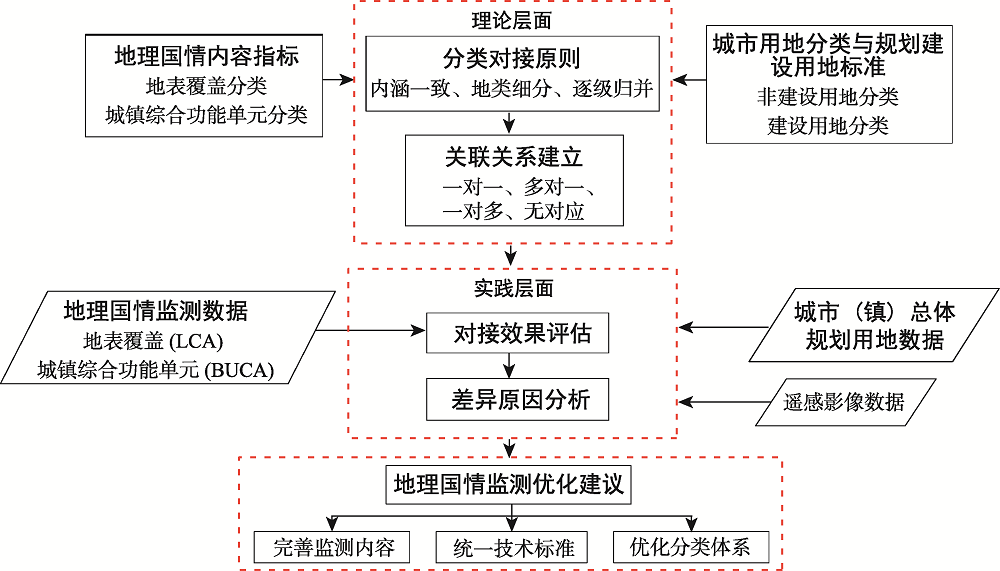
In the context of institutional adjustments and planning system reform, spatial planning has become a prominent approach to effectively supporting land resource management in a more scientific and sustainable manner. However, new requirements arise for basic map data of spatial planning to better settle the overlaps and contradictions among land use planning, urban master planning, and major function zoning. Integrating geographical condition monitoring data, which has the advantages of objectivity, precision, and accuracy, as an important data into the basic information platform of territorial space can greatly improve the solidity and authority of spatial planning. Firstly, this paper analyzed the differences between the two classification systems of geographical condition and land uses for urban master planning. Then, the overall framework for the association and conversion between geographic condition monitoring data and land use data of urban master planning was constructed, and specific methods were proposed from four aspects: the correspondence principle, corresponding relationships, consistency evaluation, and difference analysis. Finally, suggestions for optimizing geographical condition monitoring were proposed by taking an urban-rural fringe area in Wuhan for experimental study. Results show that the method of association and conversion between geographical condition monitoring data and urban planning land use data could be used to establish the relationship between the two classifications and to realize the conversion from geographic monitoring data to land use data for urban master planning, but the conversion effect of different land use types varied to some extent. The many-to-one corresponding relationship mainly existed between the classification of geographical condition and the classification of urban-rural land uses, thus difficult to implement the direct conversion. A clear corresponding relationship could be established between urban comprehensive functional unit and some types of urban construction land, and there was a relatively high consistency between them. To realize seamless connection and effective conversion between geographic national condition monitoring data and land use data for urban master planning, we should further improve monitoring content, optimize land use classification, and unify technical standards, so as to better apply geographical condition monitoring data in spatial planning. Our findings provide an effective reference and scientific basis for optimizing and improving the affairs of geographical condition monitoring in the future and for promoting its applications in natural resource management and spatial planning.
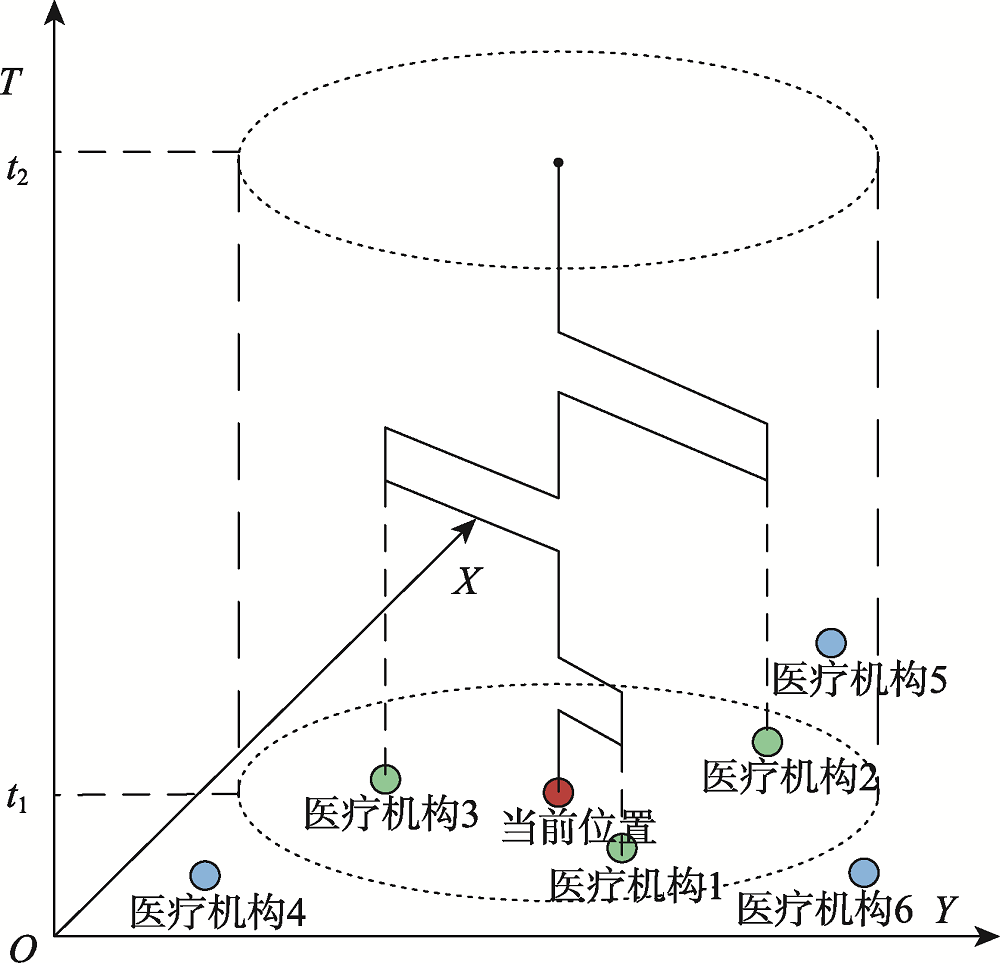
It is a practical need to select suitable medical sites from a large number of medical institutions for patients based on their needs and space-time constraints. Different from the common methods for personalized medical site recommendation, this paper proposed a new method of individual space-time accessibility analysis for the recommendation of medical sites, which considered the quantity of real-time resources of medical institutions, the personalized demands of medical users, and the space-time constraints to medical institutions. Next, this method was applied to select medical institution for urban residents. The proposed individual space-time accessibility analysis method is based on the gravity model, which is appropriately improved to enhance the method's metrizability and comprehensiveness. The method also integrates the time-geography science theory to enhance its practical applicability. Meanwhile, the path impedance factor in the model is interfaced with the AMap API, which enables the model to perform personalized real-time path calculation based on route preference and real traffic conditions. After obtaining data on relevant health care websites and open interface, this paper took Jinan as the research area and set up six scenarios, including two university libraries, two residential areas, and two large transportation stations with different users, different time, and different geographical locations, to test the effectiveness of the method. Results indicate: (1) The individual space-time accessibility analysis method in this paper considers several factors, not only emphasizing the objective constraints of real-time space-time resources, but also highlighting individuals' personalized demands. (2) The individual space-time accessibility analysis method in this paper is able to effectively measure the accessibility between individual medical users and medical sites based on the actual situation, not only adapting to different space-time situations, but also providing guiding strategies for improving the quality of medical travels. (3) By the individual space-time accessibility analysis method in this paper, the suitability of each medical site can be ranked and travel advices in different space-time situations can be made, i.e., the method has high applicability of recommendation. In addition, our individual space-time accessibility analysis method for medical place recommendation integrates the Location Based Service and medical treatments, bring a new approach to digital medical services, not only providing methodological support for the functional construction of the related wise information technology of 120, but also having good application prospects.
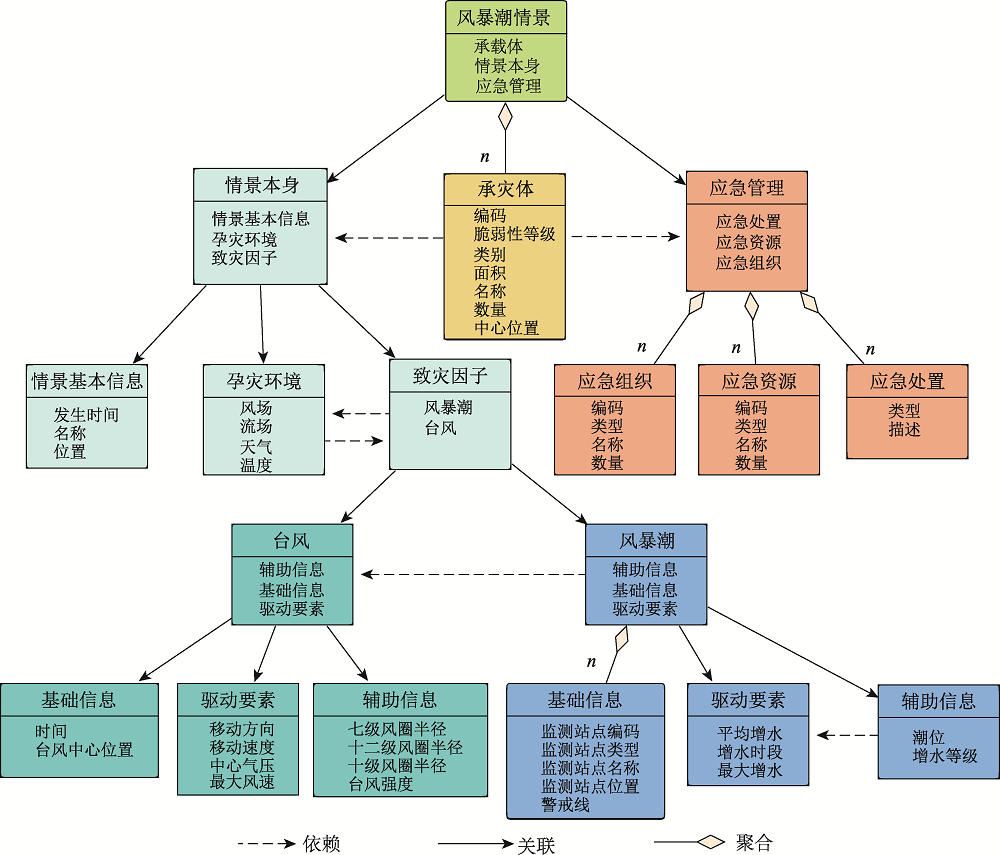
Due to abruptness of typhoon storm surge, continuity of the evolution time and uncertainty of the path, it is hard for emergency decision-makers to make correct decisions in emergency rescue. To solve this problem, this article applies "scenario-response" to the typhoon storm surge. Firstly, based on the analysis of the typhoon storm surge scenarios and the conceptual model of the scenario elements, we extract the key scenario elements by means of data collection and attribute recognition. Then, we construct the dynamic scenario network of the typhoon storm surge by the method of frame representation. Secondly, we analysis the evolution and path of typhoon storm surge. Thirdly, we construct dynamic scenario network of typhoon storm surge with the dynamic Bayesian network method. Finally, we calculate the state probability of scenarios with the prior state probability and conditional probability and realize the key scenario deduction of the typhoon storm surge. In the end of the essay, we simulated an experiment for the influence of typhoon on the coastal cities of Guangdong Province from 11 to 17 on September 16 in 2018. The experiment results show that the probability of dykes, seawater inversion, floods and landslides respectively are 85%, 81%, 74%, 54%. The conclusion is drawn as follows: (1) The structure and content of each scenario element in the scenario construction process are different and interactional. Frame representation can reasonably characterize complex heterogeneous scenario elements data. (2) The evolution path of the situation is determined by many factors such as the situation itself, the disaster-bearing body, and emergency management. Decision makers need to comprehensively consider the emergency team and the rational use of resources when making decisions. (3) From the construction of the storm surge scenario to the deduction, the whole process has clear ideas and intuitive results, which is conducive to the promotion and application in marine disasters. The tentative application of "scenario-response" in storm surge events provides new emergency ideas and solutions for storm surge control.
AIDS is an infectious fatal disease caused by HIV, which is class B in infectious disease in China. Since the first case of AIDS reported in 1985, AIDS has been rampant in China. Exploring the spatial pattern of AIDS and its spatiotemporal evolution characteristics will help improve AIDS prevention and control. In this study, we adopted GIS spatial statistical methods to analyze the provincial incidence data of AIDS in China from 1997 to 2016. First, we used spatial autocorrelation technology to detect the spatial pattern of the AIDS epidemic. Then, we explored the spatiotemporal evolution process by using the centroid transferring curve model. Results show that: (1) The epidemic of AIDS in China has strong spatial dependence at the provincial scale. From 1997 to 2016, the global spatial correlation of AIDS increased, and is likely to further increase. The development and diffusion process of the AIDS accorded with the first law of geography. (2) The AIDS epidemic in China showed a general pattern of "high in the south, low in the north, and random in the middle." The regions where local spatial autocorrelation occurred could be divided into two areas: the northern low-low clusters represented by Inner Mongolia and the southern high-high clusters represented by Guangxi. The cold spots area of AIDS in the north experienced fluctuations and increased slightly, and extended to the northeast and central China. The hot spots area in the south had a growing trend. (3) The overall prevalence of the AIDS epidemic has been expanding from 1997 to 2016 gradually, with obvious regional differences. In the process of diffusion, thespatial pattern of AIDS became increasingly unbalanced. Our findings suggest that, to achieve regional synergy and precise control of AIDS in the future, in addition to the traditional prevention methods, we should focus more on the spatiotemporal patterns of AIDS diffusion. Also, it is necessary to strengthen the control of hot spots in the epidemic and the direction of high-risk transmission. The present study demonstrates the importance and reliability of the spatial statistical analysis methods in improving medical and health services, and could be used as a scientific reference for the work of AIDS prevention and control in China. In future studies, we should scale down the research unit when more detailed data is available.
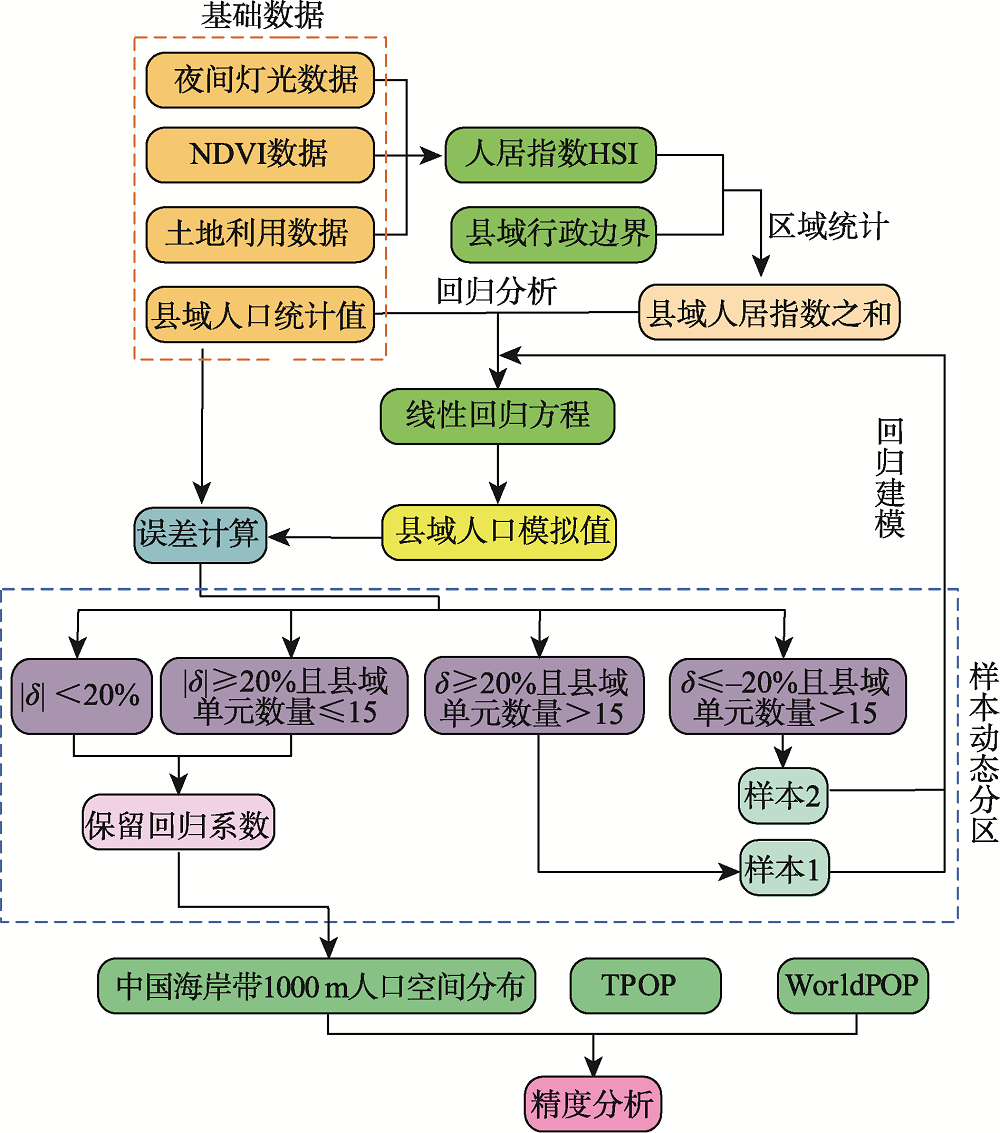
Coastal zone is not only the hotspot of population aggregation and rapid economic growth, but also eco-environmentally sensitive, vulnerable to natural disasters. Detailed spatial distribution information of population is of great significance for solving resource allocation and disaster risk management in the coastal zone. This paper took the coastal cities in China as the study area. We combined the NPP - VIIRS data and NDVI data to construct Human Settlements Index (HSI), and selected the proportion of residential area per unit grid as a parameter to enhance the inter-demographic difference. Then, we used the dynamic partitioning samples and model to obtain the 1000 m grid population distribution data in the coastal zone of China (POP). To show the advantages of our proposed modeling approach, the published Chinese 1000 m grid population data (TPOP) and world population data with 100 m resolution (WorldPOP) were used to compare with our simulated POP data. For the comparison, three indicators were chosen: the macroscopic distribution characteristics, difference between urban and rural area, and population distribution within city. Results show that all the three data can reflect the macroscopic distribution characteristics of population in China's coastal zone, while POP has the best performance of depicting urban and rural differences in population distribution and the most detailed features of population distribution within city. According to the census and POP data, due to the influence of the coastal terrain and regional to national economic development strategies, the population distribution in China's coastal zone has obvious regional characteristics: (1) Topographically, the population density of montane and tidal flats areas is generally low (below 5 person/hm 2), while that of plain and estuary delta areas is generally high (over 10 person/hm 2). (2) At macroscopic scale, areas with high population density (over 25 person/hm 2) are mainly concentrated in coastal plain areas such as the Circum Bohai Sea region, the Yangtze River delta and the Pearl River delta; the population distribution in the north of the Yangtze River has the pattern of large dispersion and small concentration, especially in the provinces of Shandong and Jiangsu, the population distribution in the south of the Yangtze River is relatively concentrated, mainly in the coastal lowlands and plains in Zhejiang, Fujian, and Guangdong. (3) Regarding the urban and rural differences, the higher the urban level is, the more significant the gradient characteristics of population distribution will be; meanwhile, there is a huge difference in population density among urban, suburbs and exurban areas.
It is significant for promoting the revitalization of beautiful rural areas while exploring the spatial correlation between sustainable development and agglomeration characteristics of rural areas based on the perspective of vulnerability. Taking remote sensing imagery as data source, we interpreted and identified the rural settlement patches of Jiangsu Province in 2016. While using the average nearest neighbor, kernel density estimation, and standard deviation ellipse method to clarify the rural agglomeration pattern in Jiangsu Province at the county scale, we constructed a comprehensive evaluation model of rural total vulnerability from the perspective of resources, economic, and social vulnerability. Furthermore, we explored the relationship between spatial agglomeration characteristics and vulnerability level in rural areas at the county scale. Results show: (1) The distribution of rural areas in Jiangsu Province decreased gradually from the core to the outer edge. Besides, rural settlements were densely distributed in the adjacent areas of southern and central Jiangsu as well as in the central part of northern Jiangsu. The overall spatial heterogeneity and directional characteristics of agglomeration patterns were obvious. (2) There was a regional imbalance in the rural vulnerability of Jiangsu Province at the county scale. While apart from a weak subsystems' correlation, the spatial coupling characteristics were not obvious. (3) There was a significant negative correlation between economic vulnerability, social vulnerability, and resource vulnerability, of which the latter two had weak links of rural development in Jiangsu Province. (4) The single vulnerable subsystems of resources, economy, and society in rural areas of Jiangsu Province at the county scale showed obvious agglomeration characteristics, while the comprehensive vulnerability and agglomeration characteristics had not achieved a benign spatial resonance.
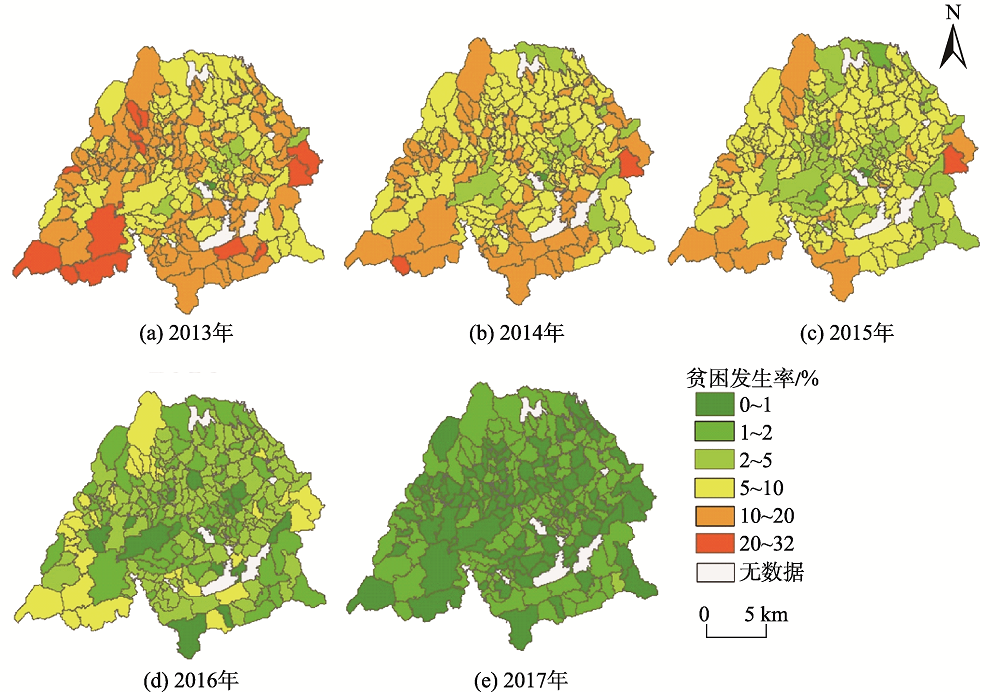
Exploring the spatio-temporal changes of poverty and identifying the factors that cause poverty can provide reference for the formulation and implementation of poverty alleviation policies.Poverty is caused by many factors. Geographically Weighted Regression model (GWR) can analyze the spatial differences in the influence of various factors on poverty,but there is a strong correlation between the factors causing poverty,which leadsto multicollinearity. Principal Component-based Geographic Weighted Regression method (PCA-GWR) is usedin this paper by combining the natural, economic and social attributes toanalyze the characteristics of the spatial pattern of poverty.In order to explore the spatio-temporal changes of poverty, this paper analyzes the temporal and spatial patterns of village-level poverty incidence from 2013 to 2017. Spatial autocorrelation analysis was performed using global Moran's I index and local G coefficientrespectively.Selecting Yongxin County of Jiangxi Province as the research area, the results show that: (1) There is a high correlation between independent variables affecting poverty. When these variables are put together in GWR model, the multicollinearity problem is easy to occur, and the results of GWRanalysis are not reliable. In order to eliminate the multicollinearity problem, Principal Component Analysis (PCA) was performed on the variables that were significantly correlated with the dependent variables. Three principal components were extracted by principal component analysis, including self-development ability of rural subjects, topographic and vegetation index. The Variance Inflation Factors(VIF)value of the variable in the PCA-GWR model is significantly lower than that in the GWR model. The PCA-GWR model effectively solves the multicollinearity problem in the GWR model. (2) The result of PCA-GWR found that the poverty in Yongxin County is the result of the combination of natural factors such as topographic factors and vegetation distribution and the self-development ability of rural subjects such as low-education, lack of labor, disease. And the effects of these factors presented different spatial patterns. This can provide a reference for the formulation of government poverty alleviation policies. (3) From 2013 to 2017, the incidence of poverty in Yongxin County decreased from 11.27% to 0.97%, showing a downward trend year by year, and the poverty gap between villages decreased year by year. The incidence of poverty from 2013 to 2015 was high in the west and low in the east. The overall value in 2016 and 2017 was low. (4) From the perspective of spatial correlation: on the whole, the spatial correlation between 2013 and 2016 is positive, and it is randomly distributed in 2017; Locally, the distribution of cold and hot spots did not change much from 2013 to 2016, the cold spots were distributed in the middle, and the hot spots were concentrated in the southwest. In 2017, hot spots are distributed in the south, and cold spots are scattered in the north.
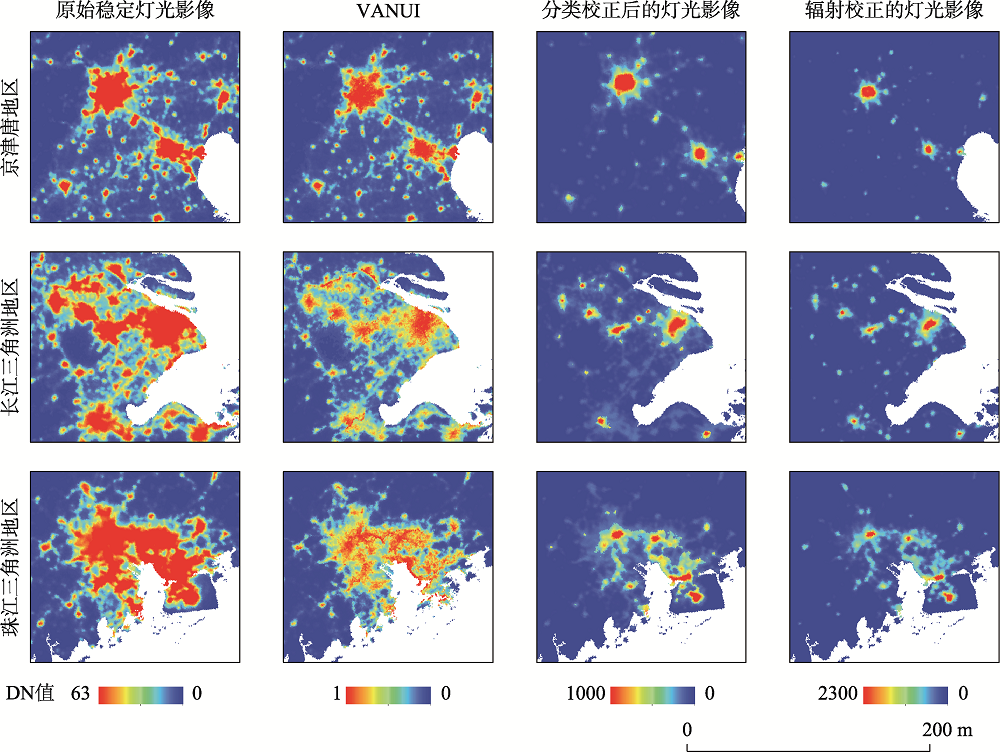
Long-time series stable DMSP/OLS nighttime light data lack comparability and include a lot of saturated pixels in the bright cores of urban areas. The two problems have limited applications of the dataset in spatial analysis and temporal comparison. To help address the two problems, this article developed a classified correction method for Stable Nighttime Light (SNL) imagery across China by using invariant regions for calibration. The SNL images are divided into saturated pixels and unsaturated pixels. For saturated pixels, five cities such as Beijing were selected as the invariant regions, and the radiance calibrated nighttime light images (RCNTL) without saturated pixels were selected as the reference. Based on the assumption that the correlation between unsaturated pixels of the invariant regions could also be applied to saturated pixels, the reference images were used to correct saturated pixels of the SNL images. Meanwhile, the saturation corrected saturated pixels were calibrated based on the interclibration relationship between the different RCNTL images. For unsaturated pixels, 13 cities including Changsha were selected as the invariant regions. According to the overall time change trend of the sum of the unsaturated pixel values, the 13 SNL images were determined as the references, and other SNL images were intercalibrated based on the correlation between unsaturated pixels in the invariant regions. To validate the accuracy of the calibration results, a variety of intercalibration and saturation correction methods were adopted for comparison. The classified correction method proposed in this paper was found better for the calibration of F10, F12 and F14 satellite imagery than the other two intercalibration methods. The other two methods had better calibration results for F15 and F16 satellite imagery. The three methods generally achieve intercalibration of the dataset imagery and make the intercalibrated images comparable. Compared with the Vegetation Adjusted NTL Urban Index (VANUI), the saturation correction result of the classified correction method solves the problem that the saturated pixels concentrate in the central area of cities. The result reduces the saturation of the pixels and is a closer fit to the RCNTL images. Besides, the corrected SNL images have relatively good correlations with GDP and power consumption values, and can reflect regional economic development differences more objectively.
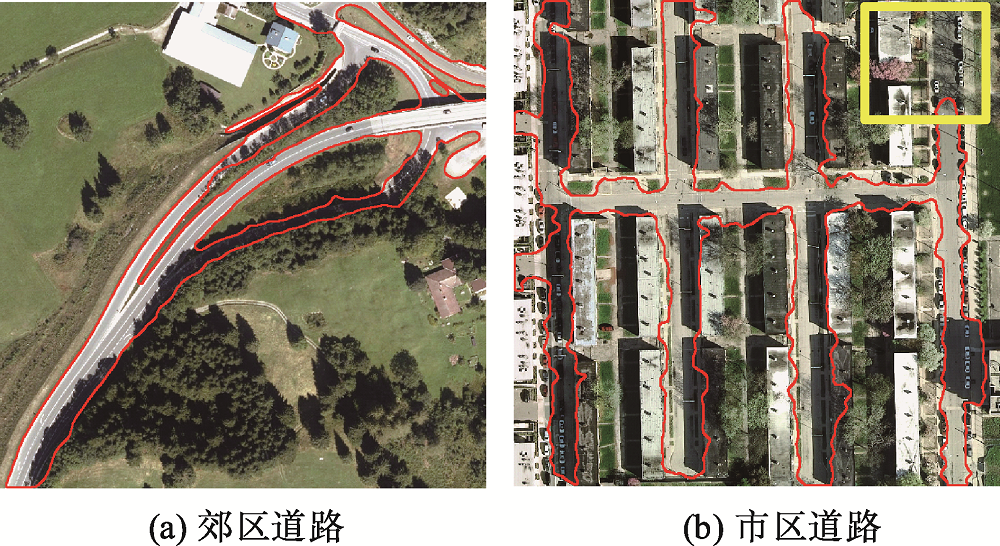
While extracting roads from high-resolution remote sensing imagery, shadow shielding is a main factor causing roads missing or defects, which could lead to difficulties for automatic road extraction. Therefore, developing methods for shaded road extraction with strong applicability has a great significance in map data production and research of geographical data. Traditional methods, such as the shadow coefficient amendment method, are difficult to remove the shadows of plants and buildings, and they would undermine the integrity of extracted roads. So, this paper proposed a feasible approach to extracting shaded roads based on brightness compensation and a high-performance segmentation method. First, after image preprocessing, a threshold segmentation method in HSI space was used to obtain the shadow area. Second, a combination of blue components suppression in the RGB space and divided linear strength was applied to enhance the pixel points in spatial domain and recover the information of the shaded areas, which made the difference between shaded roads and surrounding areas more obvious. Shaded roads were extracted by an efficient segmentation algorithm, and unshaded roads were calculated by K-means clustering segmentation. The initial value of clustering was based on color distribution in the HSI space. To ensure the integrity and details of extracted roads, the morphology method and contour repair algorithm were introduced into the extraction process after rough roads mergence. Results show that this method could extract shaded road successfully. For suburban roads, the integrity of extracted shaded roads was 96.84%. For urban roads, the accuracy was also higher than 80%. Compared with traditional methods based on the threshold segmentation in HSI, this method decreases the fragmentation of road patches while extraction, and keeps the integrity of the roads. This approach could be used for smart manufacturing and mapping of internet map data in high-resolution remote sensing imagery.
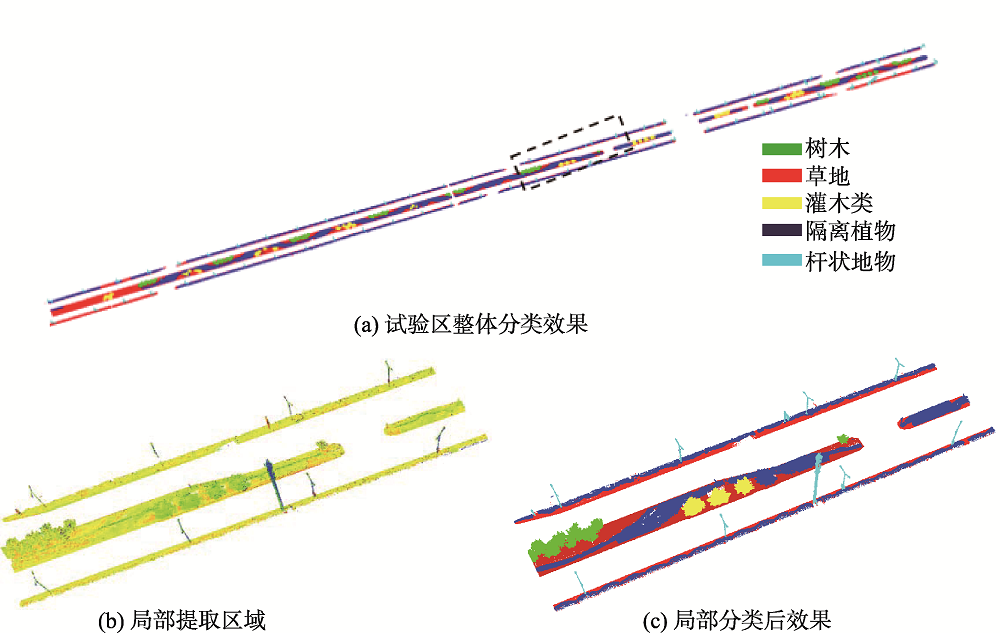
Road green belt is an important part of urban green-land system, which not only can beautify the urban environment, but also has the function of organizing and maintaining urban traffic as well as other eco-environmental services. Fine classification and extraction of road green belt information and the dynamic analysis of green belts are of great significance to road management. Based on the vehicle LiDAR technology, this study proposd a algorithm for automatic extraction and fine classification of road green belts. To verify the effectiveness of the algorithm, a road section of Fengtai District, Beijing was selected as the experimental area. The data collection time of the first and second phase tests were June 2015 and September 2015, respectively. The vehicle LiDAR points cloud data were taking as the original data. To improve the speed of the algorithm, data points within a certain range on both sides of the road were reserved according to the GNSS track line. After removing the distant points cloud data and compressing the data amount, the reserved points cloud was preprocessed by clipping and partitioning. Firstly, ground, low ground features, and high ground features were classified for each section of the road points cloud data, and then low ground features and ground points were combined. Secondly, the green belts in each segment of the points cloud data were extracted according to the points cloud features and spatial characteristics of the green belt, and the extracted green belts were identified twice to improve extraction accuracy. Based on the extracted green belts, the classification scope was determined. Based on the different characteristics of the points clouds of various ground features, the high and low ground features in green belts were classified in detail. Finally, the data of multiple green belts in the same area were compared, so as to determine whether the green belt area and the types and quantities of various ground features in the green belts have changed, which provided data support to the garden and city management departments. To verify the accuracy of the proposed algorithm, the green belts were extracted by means of manual interaction, and all kinds of ground objects in the green belts were manually classified. Using these as reference, the artificial statistical information was compared with the automatically extracted green belts and the information of each classified ground features. The total green belt areas extracted by manual and automatic extraction in the experimental area were 13 027 and 12 749 m 2, respectively, with a difference of 278 m 2 between the two groups of data and a relative error of 0.02. In the scene of the experimental area, the detectivity of pole-like objects, trees, and shrubs by the automatic classification algorithm were 83.52%, 81.81%, and 73.91%, respectively. By comparing the two phases of green belt data, it was found that the area was reduced by 129.5 m 2, and three new shrubs were added. Our experimental findings suggest the high accuracy of the proposed algorithm.
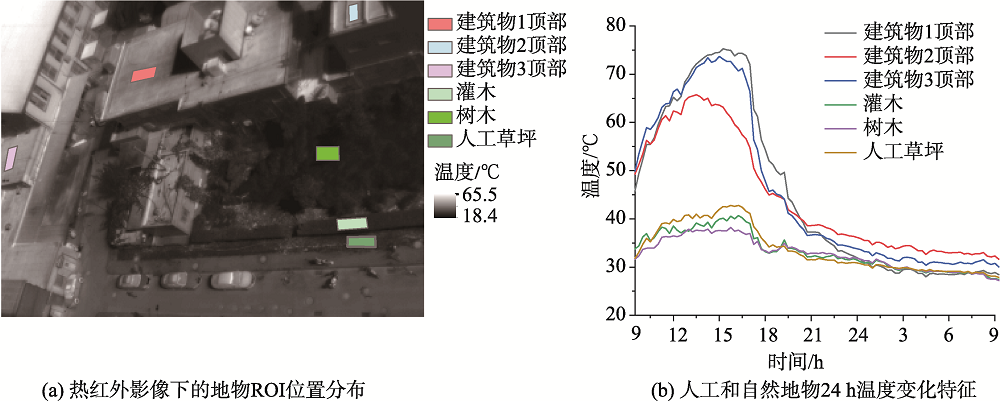
Along with acceleration urbanization, the urban heat island effect is increasingly intensifying due to urban construction. In particular, the thermal environment of residential areas has a profound influence on the local micro-climate. Therefore, studying the thermal environment characteristics of residential areas is of great significance for understanding and improving the local micro-climate. To reveal the thermal environment characteristics of residential areas, this study focused on a residential area in a campus of Beijing by using thermal infrared imagery, and obtained 24 hours thermal infrared data under different weather conditions (clear sky, cloudy, overcast sky) in summer, then selected typical urban ground objects (buildings, iron sheds, asphalt roads, bare soil, trees and shrubs, etc.), and systematically analyzed the diurnal variations of objects in different regions. Finally, the interactive features of the ground objects' temperature were revealed by using a tangent method to determine the boundary ranges of the ground objects. The main results are as follows: (1) The surface temperature curve of artificial ground objects (such as buildings and iron sheds) shows continuously violent ups and downs because of the dramatic changes of solar radiation. It indicates that solar radiation is the main factor affecting the temperature change of ground objects during the daytime, with positive correlation with the temperature of ground objects. In the cloudy weather, the maximum temperature of ground objects occurs after 16:00. Cloud movement increases the temperature fluctuation of ground objects, especially in the cloudy weather. Asphalt roads have higher temperatures at night than other ground objects, and continue to radiate heat at night resulting in ambient temperature increases. Shadow could effectively reduce the amount of solar radiation absorbed by ground objects and reduce the surface temperature. Vegetation canopy thickness is negatively correlated with the temperature of ground objects. Therefore, in residential areas, increasing the vegetation canopy thickness and expanding shadow areas will improve the local micro-climate. (2) The strong temperature interaction between trees and bare soil at 06:00 and 14:00 indicates that significant heat exchange occurs throughout the day at the junction of ground objects. At 06:00, the temperature at the junction of lawn and sidewalk has a significant interaction, indicating that there is heat exchange between the lawn and the pavement from night to early morning. It helps relieve the high temperature of the road and the surrounding environment.
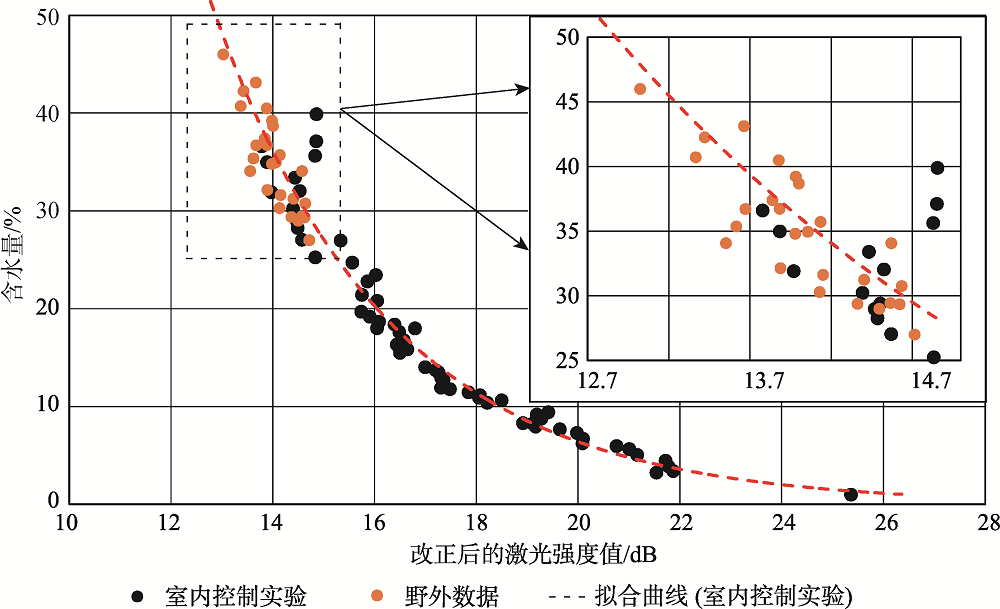
Estimation of surface soil moisture and distributions play a key role in the ecological, environmental, and topographical investigations for intertidal mudflats, which are characteristically wet and periodically submerged by sea water. Unfortunately, existing techniques of large-scale surface moisture monitoring have measurement limitations, and the efficiency and accuracy of traditional methods are difficult to be ensured simultaneously. Thanks to the advantages of high precision, high resolution, and strong flexibility, Terrestrial Laser Scanners (TLSs) have been widely used to study the geomorphological features of intertidal mudflats. However, merely geometrical information is not enough to derive the physical characteristics of a mudflat, it is also necessary to mine intensity data of points cloud. Aside from the 3D points cloud, TLS can record the intensity value of each point, which contains spectral characteristics of the scanned target and is of vital importance to the improvement of TLS data classification and feature extraction. Most TLSs emit near-infrared lasers that can be strongly absorbed by water. Thus, the intensity values of areas with high water moisture are theoretically smaller than those of the regions with low moisture. In this study, the intensity data of TLSs were corrected for the incidence angle and distance effects, and the corrected intensity data were utilized to quantitatively estimate the surface soil moisture of intertidal mudflats. The Riegl VZ-4000 long-distance terrestrial laser scanner with a near-infrared wavelength of 1550 nm was used to establish the indoor moisture model and to conduct a case study of a tidal flat in the Chongming Island, Shanghai, China. Additionally, 26 sediment samples were also collected by the traditional way of gravimetric measurements to get moisture. Results show that there was a power function relationship between the corrected intensity data and surface moisture, with the correction coefficient being 0.961 and the estimation accuracy reaching 91.94%. Our findings show that, compared with the traditional technique (i.e., gravimetric measurements), the corrected intensity data of long-range TLSs are effective for quick, accurate, and detailed estimation of surface soil moisture over large areas.
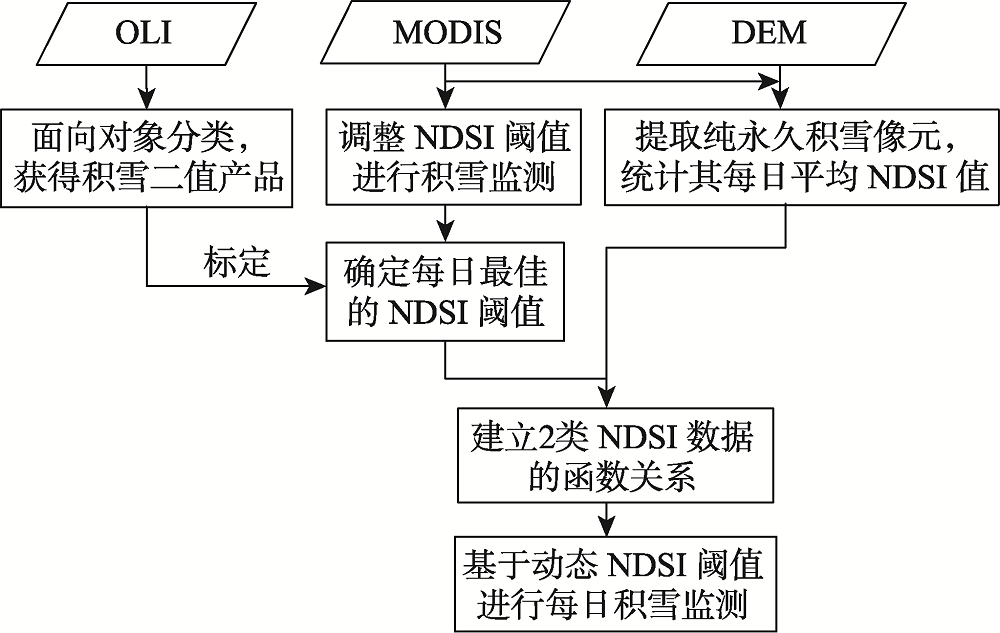
Accurate snow cover information is of great significance to the study of meteorology, hydrology, and global climate change. Remote sensing techniques play an important role in large-scale and high-frequency snow cover monitoring. Nowadays, SNOMAP algorithm is the most common method for remote sensing monitoring of snow, which mainly uses fixed NDSI (Normalized Difference Snow Index) thresholds to identify snow. However, this method ignores the temporal variations of snow spectral information, leading to monitoring errors of snow cover. In this study, we proposed an adjusted method to monitor snow cover by dynamic NDSI thresholds. This method adjusts fixed NDSI thresholds by using the average NDSI value of pure permanent snow as reference to reduce the influence of spectral fluctuations. Snow cover in the Sanjiangyuan area was identified and monitored by this method. There were four steps: (1) OLI and MODIS data of the same region, the same period and cloud-free were selected. The OLI NDSI threshold of the best snow cover recognition was determined by human-computer interaction. (2) The snow area monitored based on OLI data was used as the true value of the ground to calibrate the optimal MODIS NDSI threshold on the same day. (3) The average NDSI value of the pure permanent snow in the Sanjiangyuan area on the same day was counted. The elevation of the pure permanent snow pixels was more than 5800 meters and the FSC (Fractional Snow Cover) of them was 100%. (4) The functional relationship between the optimal MODIS NDSI threshold and the average NDSI value of the pure permanent snow was established. The dynamic MODIS NDSI threshold was obtained by the linear regression and varied with the average NDSI value of pure permanent snow. Results show that: (1) Based on daily MODIS data, there was a good linear relationship between the optimal NDSI threshold for snow cover monitoring and the average NDSI value of pure permanent snow on the same day, and the determinant coefficient R 2 reached 0.86. (2) The dynamic NDSI thresholds of Sanjiangyuan area were between 0.29 and 0.37, and the average value of NDSI threshold was about 0.33, indicating that 0.40 as the NDSI threshold would underestimate the snow cover area of the Sanjiangyuan area. (3) The average values of the approximation ratio, the overall classification accuracy, and F of dynamic NDSI threshold method were 96.61%, 94.62%, and 91.99%, respectively. Compared with the monitoring method with the fixed NDSI threshold of 0.33, they were improved by 5.17%, 0.70%, and 1.14%, respectively. Our findings demonstrate the effectiveness of the proposed method.
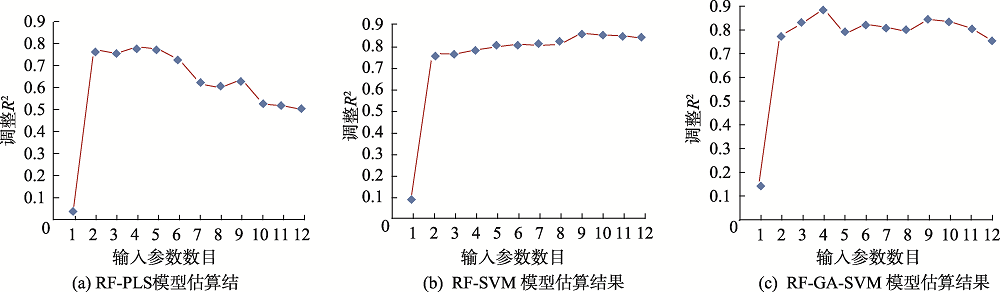
Vegetation water content is an important evaluation index for vegetation health monitoring. The Equivalent Water Thickness (EWT) of vegetation is of great significance for the monitoring and evaluation of the ecological conditions in the road area, it could provide a guideline in road area environment management. Taking the Litan highway in Hunan Provinces as an example, this research used field data of canopy reflectance and equivalent water thickness of vegetation on the ground, and simulated reflectance and simulated equivalent water thickness established by PRO4SAIL. In total, 12 kinds of water indices were established by using the simulated reflectance of the PRO4SAIL canopy model and the ground measured reflectance. The random forest algorithm (RF) was introduced to analyze the importance of the 12 water indices and equivalent water thickness. We determined the ordination between water indices and equivalent water thickness as well as the optimal number of input water index in the equivalent water thickness estimation model by using the adjusted coefficient of determination. Based on the selected water index, the water index and equivalent water thickness were calculated by the PRO4SAIL simulation reflectance as the training set. Three equivalent water thickness estimation models were constructed: Random Forest Coupled Partial Least Squares (RF-PLS), Random Forest Coupled Support Vector Machine (RF-SVM) model, and Random Forest coupled Genetic Algorithm to optimize the Support Vector Machine (RF-GA-SVM) model. The applicability of 12 water indices in the estmation of equivalent water thickness in road-area of vegetation was also analyzed. The accuracy of the model was validated by measured equivalent water thickness on the ground. The experimental results show: (1) The adjusted determination coefficient of RF-SVM model was the highest, established by Normalized Difference Water Index (NDWI), Normalized Multi-band Drought Index (NMDI), Simple Ratio Water Index (SRWI), Simple Ratio (SR), Normalized Difference Infrared Index (NDII), Water Index (WI), Dattwater Index (DWI), Moisture Stress Index (MSI) and Soil Adjusted Vegetation Index (SAVI), with the determination coefficient of verification set reaching 0.8877. (2) The RF-PLS and RF-GA-SVM models with the four water indices of NDWI, NMDI, SRWI, and SR had the highest adjusted determination coefficient, with the validation set's determination coefficients reaching 0.8053 and 0.8952, respectively. (3) Among them, the RF-GA-SVM model was the best for estimating equivalent water thickness, which met the requirements of vegetation equivalent water thickness monitoring in road area. Our findings provide an effective and accurate method for the estimation of equivalent water thickness, and provide support for road area environment monitoring based on hyper-spectral remote sensing.
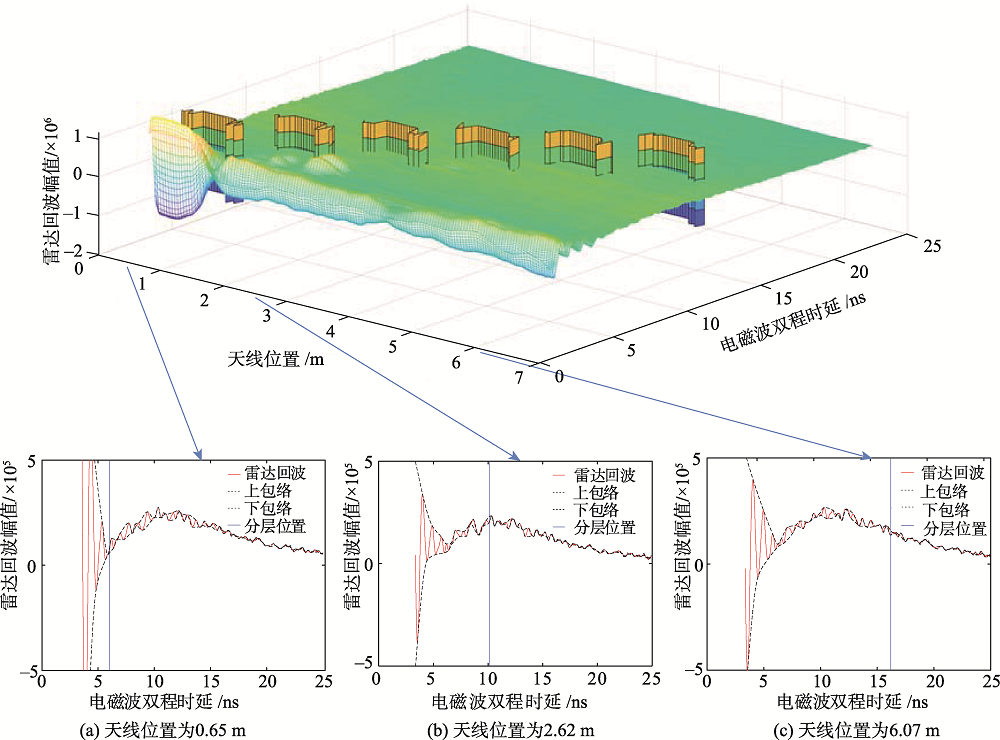
Soil stratification information, especially surface soil structure, has important impact on land productivity and is an important index for evaluating soil quality. The present study aimed to obtain the information of soil layers quickly and accurately, for which Ground Penetrating Radar (GPR) technology was used. The echo signals of GPR were processed in both the time and frequency domains. In the time domain, the envelope detection method was used to determine the transience of the echo signals and therefore to get the location of soil layers on the time axis. To get the soil layer location in spatial coordinates, the velocity of electromagnetic wave propagation in soil was needed. Considering the velocity of electromagnetic wave propagation in soil layers varying with the soil dielectric constants, the Short-Time Fourier Transform (STFT) method was applied to the echo signals for dielectric constant analysis in the frequency domain. Soil layers with different dielectric constant exhibited different characteristics in the STFT signals. After clustering analysis of the soil layers, the relationship between STFT characteristic value and dielectric constant in a certain layer was established based on regressive analysis. Then, the velocity of electromagnetic wave propagation in each soil layer was determined using the dielectric constants. After the electromagnetic wave velocity of Ground Penetrating Radar (GPR) was estimated, the location of layers' interface was further determined and then the thickness of each soil layer was computed. To valid the effect of the above-mentioned methods, the echo signals of soil, for both the ideal simulated experimental environment which has obvious layered interface and the farmland environment whose layers have changed naturally, were collected. The experimental results show that, with the envelope detection method, layers not deeper than 70cm in the ideal simulated experimental environment were 100% detected and for both the ideal simulated experimental environment and the farmland environment, the detection rate of ground penetrating radar echo information reached 94.5%. The estimation of ground penetrating radar echo velocity using STFT spectrum analysis shows that the calculation error of soil thickness above 70 cm depth was mostly below 10%. Our findings suggest that the proprosed methodology can effectively identify the stratification information of shallow soil and estimate the thickness of the soil. However, surface vegetation, film mulching, soil voids, soil salinity, moisture heterogeneity, gradual change of soil layers, and soil layer depth will all affect the accuracy of the detection. For example, with the increase of soil depth, the error becomes larger. So, if the data acquisition spot is selected rationally, the proposed methodology can be applied to plough layer thickness detection in practical fileds.
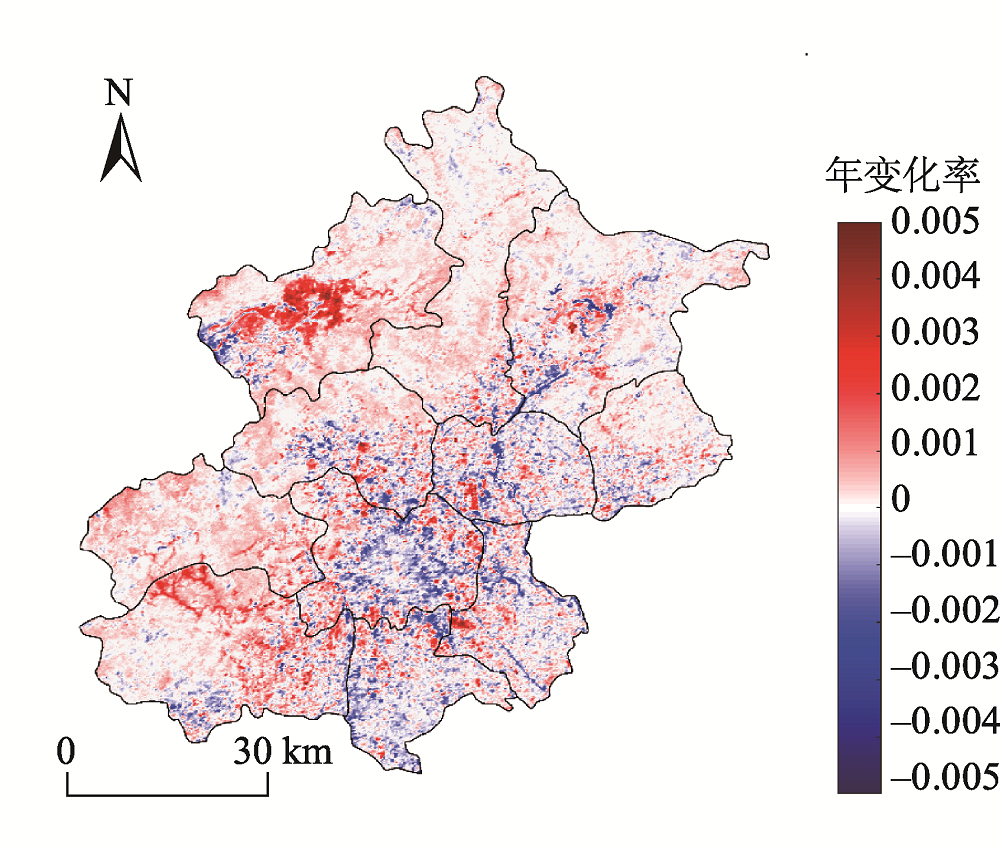
Albedo is an important parameter in surface energy balance, and it is also used in the research of global change and weather prediction. In recent years, due to the abnormal weather changes and the increase of extreme weather, there emerged a great demand for high-quality observation data in environmental and climate research. To better understand albedo, researchers have been constantly updating albedo products. The purpose of this paper is to develop a 250 m albedo product based on the 1 km resolution Global Land Surface Satellite (GLASS) albedo product. Compared with GLASS 1km albedo product, our product has higher resolution and precision. The main idea is to use the texture information from the 250 m band data of Moderate-resolution Imaging Spectroradiometer(MODIS) to scale down the 1km resolution GLASS albedo.There are three steps for the algorithm: simple direct inversion, simple combination of primary products, and downscaling fusion algorithm. Followingly, the 250 m albedo product was validated by comparing to the ground data from 30 sites in North America. It is found that the 250 m albedo product data is closer to the ground measurements. The accuracy of GLASS 1km product is 0.0257, while that of the 250 m product is 0.0235. Finally, an application of the product was demonstrated through analyzing the inter-annual albedo change trend of Beijing based on the 250m albedo product from 2003 to 2013. The results show that the urbanization of Beijing decreased the average albedo rather than increased, and that albedo changes caused by natural processes or changes in planting patterns and varieties were more significant than those caused by urbanization. Besides, the result shows that the 250 m albedo product is not only with better visual presentation and clearer texture, but also capable to reveal the spatial details of albedo changes.