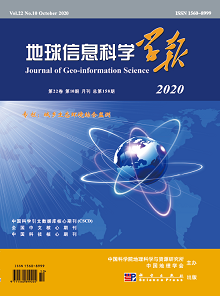
More and more people have paid attention to the severe problems of urban ecological environment in recent years, such as air pollution in key urban agglomerations, water pollution, urban black and odorous water, risk of drinking water source, urban heat island, soil pollution, municipal solid waste, and so on. As a vital part of environment protection, with the rapid urbanization, the monitoring of urban ecological environment is becoming more and more important and the demand is getting higher and higher. Many studies have documented the monitoring of urban ecological environment at home and abroad, however, these works are discrete and unsystematic. There is a lack of general technical system in China, including key technology system, index system, and technical standards. The integrated space and ground monitoring is very urgent and necessary, and it is badly need to establish its technical system to guide and normalize the development of comprehensive monitoring of urban ecological environment. Given the national demand, this work (1) designs and constructs the technical system framework, index system framework, and standard system framework of urban ecological environment comprehensive monitoring from three aspects: urban polluted gas, water quality, and ecological resource; (2) puts forward the series concerned key technologies, gives the current monitoring status and accuracy of main indies of urban ecological environment; (3) on the untangling basis of key science problems, in combination with the characteristics of remote sensing data and the needs of national ecological environment monitoring, the study subsequently designs the operational application scheme of ecological environment comprehensive monitoring, gives the main monitoring emphasis of urban polluted gas, water quality, and ecological resource, plots the application scheme which includes the region demonstration, application products and services based on the constructed information service platform of urban ecological environment comprehensive monitoring, and provides the application examples of theme maps of PM2.5, urban black and odorous water, and urban island effect. The work will provide important support for the state and local government monitoring and management in urban ecological environment.
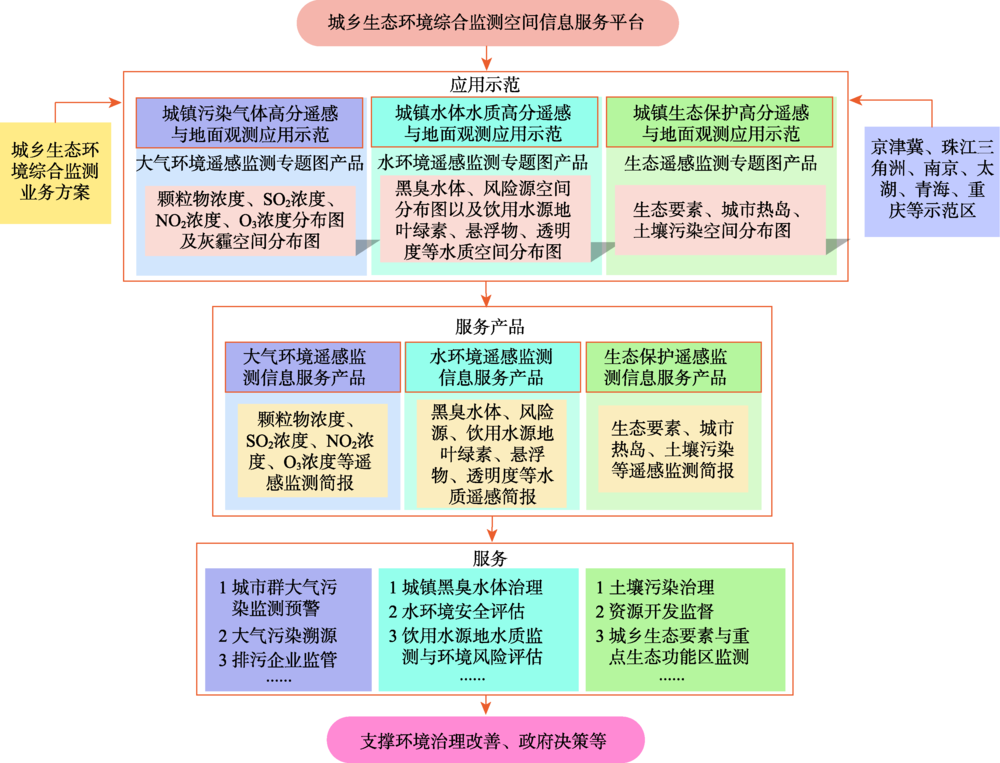
Due to the influence of water temperature and nutrient concentration, phytoplankton phenology can reflect the growth of phytoplankton and the changes of lake ecosystem. Because of the serious eutrophication in Lake Taihu, the effect of water temperature on phytoplankton growth is more and more significant. Thus, it is of great significance to study the relationship between phenology and water temperature for understanding, controlling and improving the ecosystem of Lake Taihu. This study firstly calculated the phytoplankton phenology metrics and the Temperature of Water Surface (LSWT) by MODIS data from 2003 to 2018, and then explored the phenological characteristics of different regions by analyzing the temporal-spatial distribution variation of phytoplankton phenology. At last, the response of phytoplankton phenology to LSWT change was revealed by combining the LSTW and the phenological characteristics. The results showed that: ① Different phytoplankton phenological indexes had different spatial distribution characteristics. The number of blooms, the peak value of Chlorophyll a (Chla) concentration and the total duration of algal blooms showed a decreasing trend from the western coast to the center of lake; the dates when the phytoplankton began to grow and the Chla peak appeared were complex in the lake. However, the date was relatively early in the coastal area; ② Lake Taihu could be divided into four types of areas with different phenological characteristics. The Type I area was mainly located in Gonghu Bay, eastern coast and the central part of Lake Taihu, where the fluctuation of Chla concentration (50~60 μg/L) was gentle, the number of blooms was the lowest, the start date was the latest, and the duration was the shortest. Type II area was mainly distributed along the western coast, with the violently fluctuating Chla concentration (50~90 μg/L), the most frequent blooms, the earliest onset, and the longest duration. Types III and IV were the transition areas. The former was mainly distributed in Meiliang Bay, Zhushan Bay and their exits, while the latter was mainly located in the southern coast and central lake. ③ The response of phytoplankton phenology to LSWT changes was affected by the level of nutrients. When the nutrient level was high, the promotion effect of LSWT on phytoplankton growth was more significant. The increasing trend of inter-annual LSWT had obvious influence on the advance of phytoplankton phenology and the increase of biomass. On the contrary, the effect of LSWT on the growth of phytoplankton was weakened.
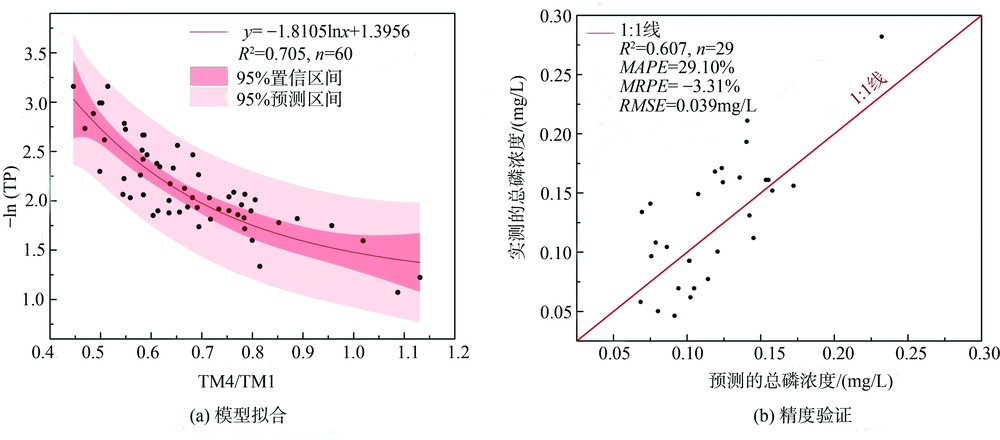
Dianchi Lake, the largest plateau freshwater lake in China, is an important part of the ecological security pattern in the upper reaches of the Yangtze River. In order to restore the ecology of Dianchi Lake and its lakeside, farmland along the lake has been converted to grasslands and forests on a large scale since 2008. The influence of vegetation in the lakeside on the total phosphorus concentration in Dianchi Lake is a long-term process, and it needs to be evaluated through long-term continuous monitoring data based on remote sensing. In this paper, Dianchi Lake and its lakeshore are taken as research areas. From the perspectives of spatial distribution and seasonal differences, combined with the annual change of total phosphorus load of the rivers flowing into the lake, the effect of the spatial and temporal changes of the vegetation in the lakeside on the total phosphorus concentration in Dianchi Lake from 2005 to 2018 was studied. The main conclusions in this paper are as follows: (1) In terms of the spatial variation, the multi-year average of total phosphorus concentration in the Dianchi Lake gradually decreases from the edge of the lake to the center, and it is higher in the north and south. From the aspect of temporal changes, the annual average of total phosphorus concentration in the Dianchi Lake shows a significant downward trend from 2005 to 2018. (2) The significant reduction of total phosphorus concentration in Dianchi Lake from 2011 to 2018 is closely related to vegetation in the lakeside , and the growth of vegetation has a certain degree of interception on the input of total phosphorus. (3) The results of vegetation extraction show that the area of herbs and woody plants in the lakeside of Dianchi Lake increased significantly from 2005 to 2018, and the period with the most dramatic increase in both was from 2010 to 2011. (4) Compared with the normal water period and the high water period, the NDVI of herb and woody plants has the strongest negative correlation with the total phosphorus concentration in the strongly affected area during the low water period, and the negative correlation between the NDVI of woody plants and the concentration of total phosphorus in the strongly affected area is stronger than that of herbs. This paper studied the response relationship between the total phosphorus concentration in Dianchi Lake and vegetation on its lakeshore based on long-term remote sensing data, and provided scientific basis for the ecological restoration of Dianchi Lake.
The shadow on black and odor water interfere with the spectral information of the water surface and seriously affects the accuracy of water quality monitoring with high spatial resolution remote sensing data. Therefore, it is necessary to remove the shadow before evaluating river water quality. This paper tries to constructan objective and efficient shadow recognition algorithm on black and odor water to reduce the interference of adjacent object and improve the accuracy of remote sensing monitoring and evaluation of river water quality. In this study, the shadow and water pixels were sampled based on the hyperspectral remote sensing data of Unmanned Aerial Vehicle (UAV).The spatial distribution of different band combinations was analyzed by means of spectral feature spatial analysis to obtain spectral band combinations that can effectively distinguish water and water surface shadows, and the coefficients of band combinations were calibrated to obtain the best discrimination effect. By comparing the discernibility of shadow and non-shadow water by various band combinations, it was found that the ration of remote sensing reflectance Rrs(666)/Rrs(791) combining with Rrs(492) has a higher discrimination between water pixels and shadow pixels. Therefore, remote sensing reflectance at 492 nm, 666 nm and 792 nm were selected to establish the River Surface Shadow Index (RSSI). In general, the threshold of distinguishing shadow and non-shadow pixels needs to be adjusted according to different images. In this case, manually adjusting the threshold may produce errors, which are difficult to apply to other images. In order to reduce the error caused by artificial threshold calibration, the maximum category variance method (OTSU)was adopted to automatically determine the threshold of shadow recognition. According to the complexity of the riverbank object, the reflectance spectra of the shadows were classified to two types: umbra and penumbra. The magnitude difference between penumbra and umbra reflectance was similar to that between penumbra and water reflectance. Therefore, in order to highlight the difference between penumbra and water, the number of classification recognition types was set as 3. Firstly, the OTSU method was used to automatically determine the recognition threshold of umbra, penumbra and water, and then the extracted umbra and penumbra were combined to produce the final shadow distribution map. The algorithm was tested by using the hyperspectral remote sensing images of Jinchuan River and Longjiang River in Nanjing. The results show that the RSSI shadow index can highlight the difference between shadow and water. The threshold determined by OTSU adaptively can better distinguish umbra, penumbra and water, and the overall recognition accuracy of shadow can reach more than 85%. This algorithm can effectively identify the water surface shadow on black and odor water and provide the technical support of data preprocessing for the subsequent qualitative and quantitative remote sensing monitoring for water.

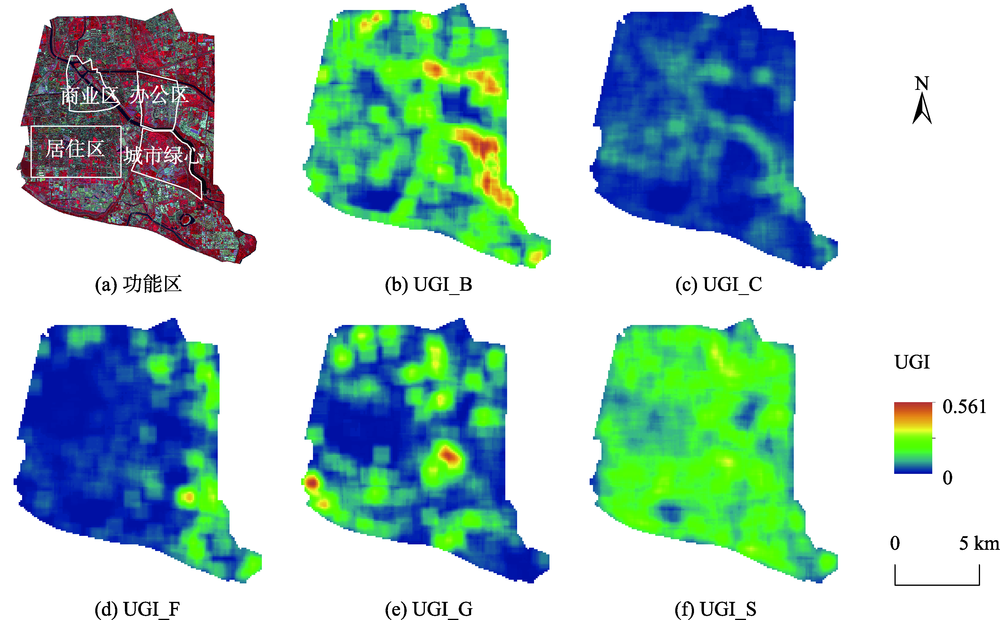
Urban vegetation is an important component of an urban ecosystem, which provides important ecological service including purifying urban air, regulating urban climate, and beautifying urban landscape. Different types of vegetation provide different ecological service. To date, there have been many studies on characterizing urban green space landscape pattern and analyzing its spatiotemporal dynamics. However, the green space landscape patterns of different vegetation types have not been well quantified. In this study, we took Beijing Vice-City Center as the study area and focused on different types of urban vegetation (broad-leaved trees, conifers, farmland, grasslands, and shrublands). Due to the small size of urban vegetation patches and their high spatial heterogeneity, the object-oriented classification method was adopted in this study. Specifically, the image objects using multi-resolution segmentation were generated first. Then, combing the field sampling data, we applied random forest in feature selection and classification using GF-2 images in summer and winter. Based on the classified vegetation map with detailed information, landscape metrics and moving window approach were used to quantify the landscape pattern of urban green space at functional scale and grid scale, respectively. Our results show that, for GF-2 images, the spectral and textural features of image objects after multi-resolution segmentation can effectively improve the extraction of different vegetation types. Multi-temporal images can also provide phenological information of different vegetation types. Compared with the classification results using either summer images or winter images, our classification accuracy was improved to 87.7%. In our study area, the fragmentation of shrublands was the highest. The area proportion of conifers was the smallest, but its patch shape was the most complex. While the distribution of broad-leaved trees, grasslands, and farmland was spatially centralized and contiguous with a regular shape. We found that the green space landscape pattern in different functional areas were quite different. The urban green center had the most abundant vegetation. While the commercial area had less green space that was also fragmentized. The landscape diversity and the distribution of different vegetation types showed a spatial heterogeneity in the Beijing Vice-City Center. At present, the landscape pattern of green space in Beijing Vice-City Center has formed the basic outline of planning, but the construction of urban green center and the public green space in city center are still insufficient. Our study evaluates the current situation of green space patten in Beijing Vice-City Center and proves that GF-2 can be applied in urban ecological environment monitoring, which provides a useful reference for the future monitoring and optimization of urban green space.
After 2013, several serious haze pollution events in China have attracted wide attention from the public. Therefore, the Chinese government has developed a series of policies, measures, and laws for air pollution prevention and control. We select the air quality index and six key air pollutant observations in the national air environmental monitoring station network of China to analyze the changes trend and spatial pattern of the country-scaled atmospheric quality from 2015 to 2019. The annual and seasonal average concentrations of these parameters were used to investigate their relationships by using the ratios and correlation coefficients among them. The results showed that the concentration of PM2.5, PM10, SO2, CO, NO2, and AQI all decreased significantly. The annual average concentrations of them in 2019 decreased by 4.5%,3.84%,7.86%,3.74%, 0.95%, and 19.31%, respectively, compared with that in 2015. Only O3 significantly increased by 0.79% in the same period. The average annual concentrations of PM10, PM2.5, O3, NO2, SO2,CO, and AQI in northern China all are higher than those in southern China by 25.2%, 18.73%, 4.95%, 17.6%, 32.74%, 16.17%, and 28.3%, respectively. Besides, AQI and all six pollutants showed the seasonality. The seasonal variation pattern of O3 exists with a higher concentration in summer and a lower concentration in winter, while the other five pollutants and AQI present the inverse seasonality. In general, PM2.5 and O3 are the most severe air pollutants in China during these five years. Furthermore, the relationships among different pollutants were found in the study period. The PM2.5 concentration is significantly positively correlated with NO2, SO2 and CO (r>0.85, p<0.01), and O3 is negatively correlated with its precursor NO2 and CO (r>0.8, p<0.01).
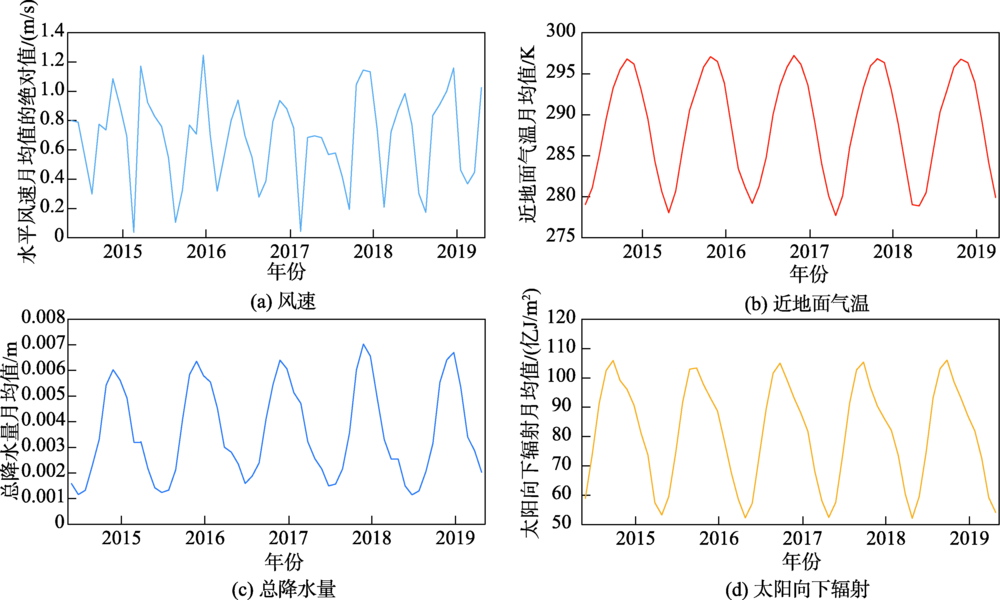
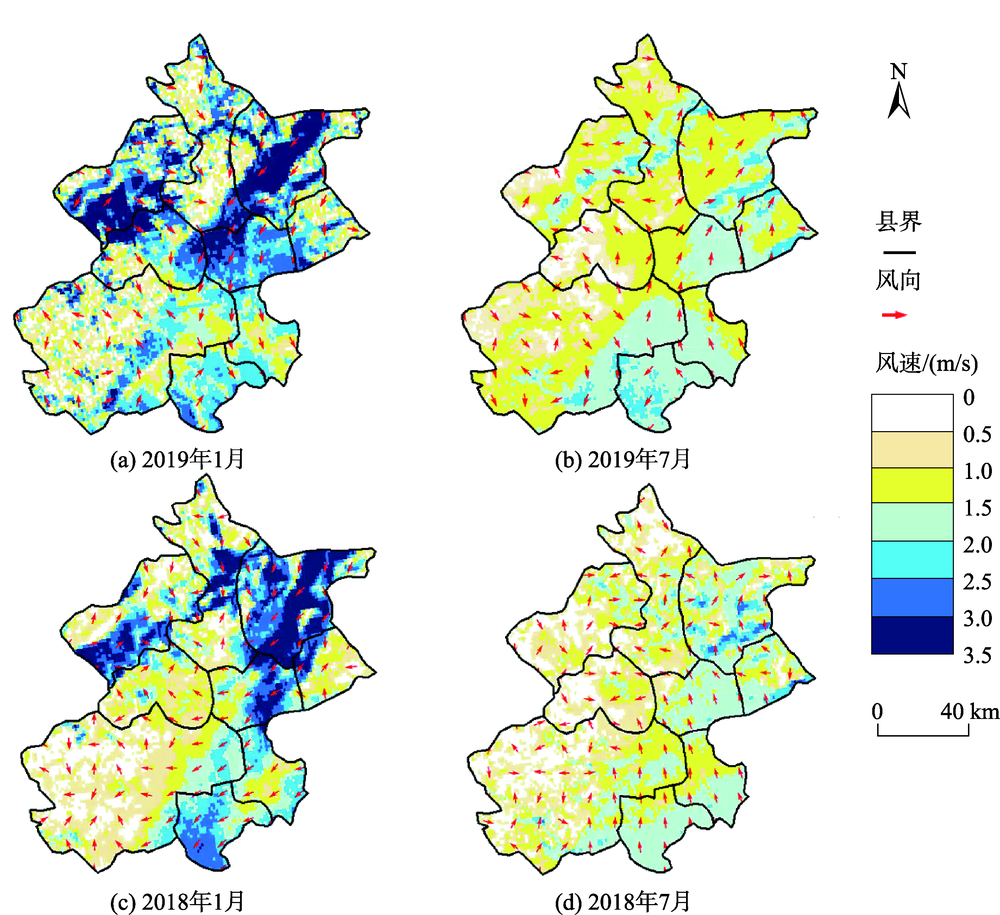
From the perspective of local and micro scales, construction of ventilation corridor in urban area was proposed by optimized planning and architectural design in previous studies. However, for contemporary megacities and urban agglomerations, both urban heat island and pollutant transport may involve a larger scale of regional impact. It may have more practical significance to integrate regional natural geographical resources to identify and plan ventilation corridors in urban peripheral areas to be developed. Taking Beijing as an example, potential ventilating areas is preliminarily identified by drawing the map of aerodynamic roughness length in this study. First, monthly mean wind fields from numerical simulation outputs of January and July demonstrate that, in winter with strong background wind, the distribution of horizontal wind speed is highly consistent with the distribution of underlying surface roughness. There is an obvious wind path in the northeast of urban Beijing. Wind speed drop significantly when passing through the urban area due to the high surface roughness, and partially recoveries in the urban downstream. Second, thermodynamic analysis suggests that the low temperature area outside the city in summer is contrary to prevailing wind direction; both the size of the compensation space and thermal gradient between the compensation and the action space are smaller than that in winter, hence the available wind resources to refresh the city are scarce. Third, a dimensionless ventilation index is estimated by integrating the weighted surface temperature and roughness length. In Beijing, the index is in between 0 and 0.25 in winter, and is in between 0 and 0.60 in summer. The smaller the value is, the stronger the ventilation capacity. The ventilation capacity in winter is significantly better than that in summer due to the effect of seasonal thermodynamic difference. Fourth, the simulated velocity is further combined to divide the ventilation performances into 4 grades, and the potential ventilation corridors in Beijing are identified in winter and summer, respectively. In winter, the length of the ventilation corridor running through Beijing is about 200 km; it introduces wind resources from the periphery of the city to improve the self-purification capacity of the city. In summer when the background wind is weak, the connectivity of the wind path is poor and the ventilating capacity is weak. Optimizing urban agglomeration planning will be hence practical helpful.
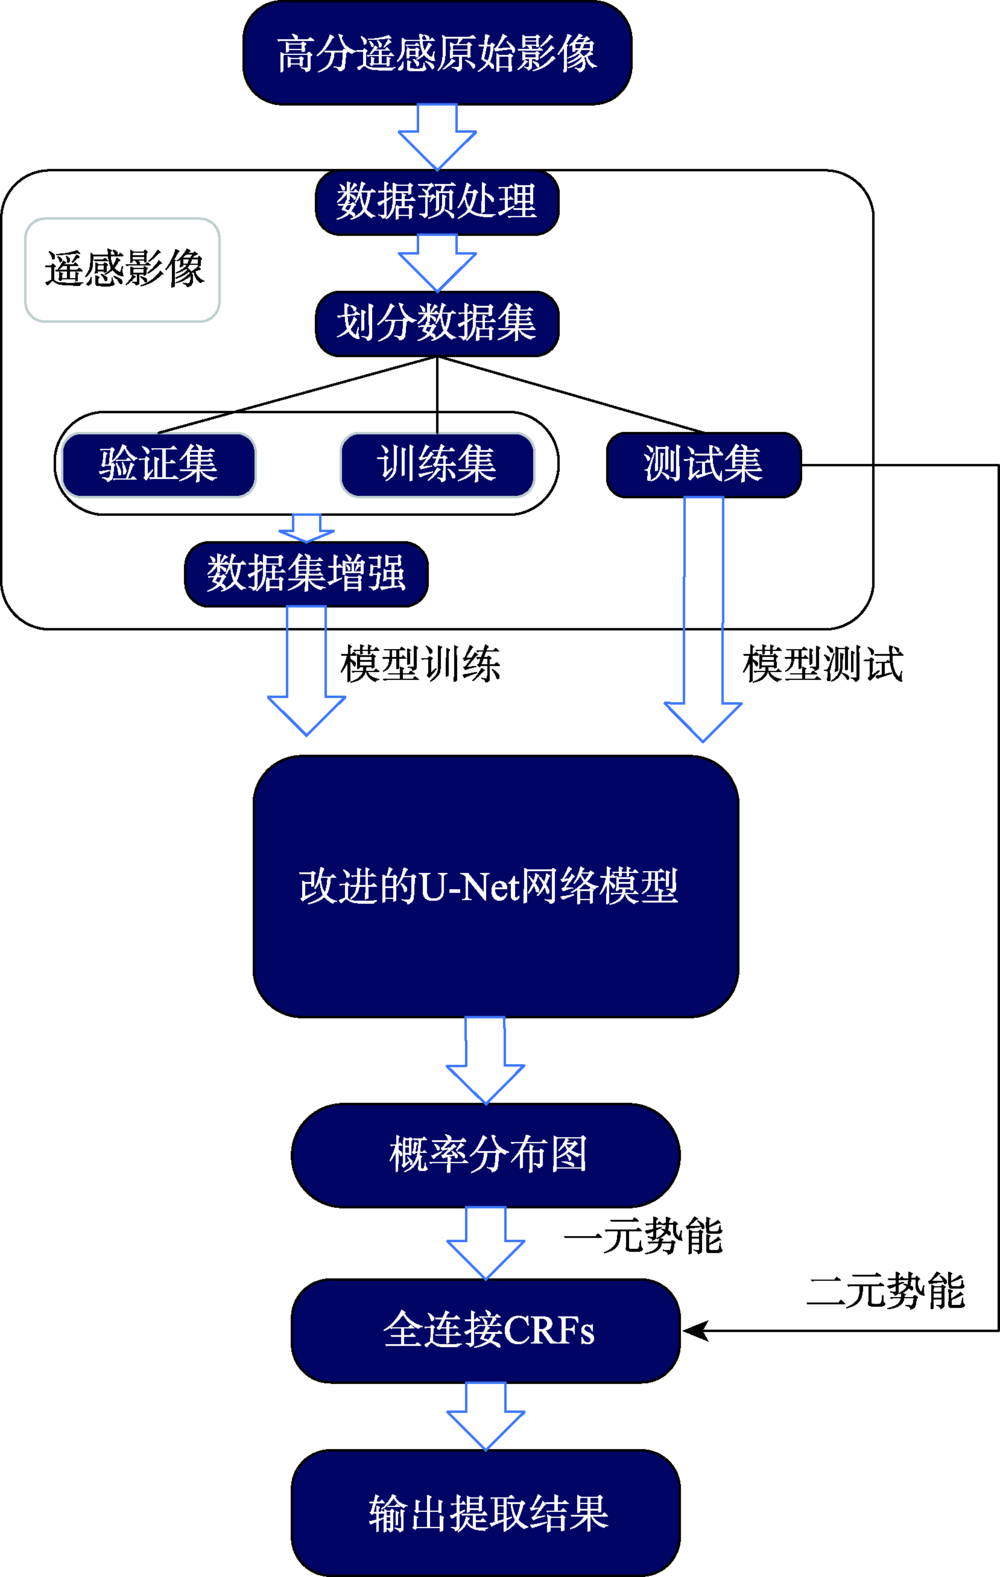
There are two main methods of traditional water body extraction: a method based on spectral information and a method based on classification. Traditional water body extraction methods based on spectral information fail to take into account features such as water body shape, internal texture, water body size, and adjacent relations of water body. Also, there is a common phenomenon of “same object with different spectra and same spectrum with different objects”, which could result in low accuracy of water body extraction. Thus, the traditional methods that design features based on classification to extract water body is complex and impossible to capture the deep information of water body features. This paper proposed an improved U-Net network semantic segmentation method, which uses the de-encoding structure of the classic U-Net network to improve the network: ① Use the VGG network to shrink the path and increase the depth of the network to extract deep features of the water; ② Strengthen the low-dimensional feature information in the expansion path, fuse the feature map on the next layer of the shrinking feature pyramid with the feature map on the corresponding expansion path in the next layer, and enhance the model's low-dimensional feature information to improve the classification accuracy of the model; and ③ The Conditional Random Feld (CRF) was introduced in the post-classification process to refine the segmentation results and improve the segmentation accuracy. In the study of Qingdao area, SegNet, classic U-Net network, and improved U-Net network were selected as controlled experiments while maintaining the same training set, validation set, and test set. The test results show that the improved U-Net network structure performed better than SegNet and classic U-Net networks in terms of IoU, accuracy rate and Kappa coefficient. Compared with SegNet, the three indicators increased by 10.5%, 12.3%, and 0.14, respectively. Compared with the results of the classic U-Net network, each indicator increased by 5.8%, 4.4% and 0.05, respectively. The results demonstrate the effectiveness of the improved method in this paper. In addition, the method proposed in this paper has more advantages than the other two networks in the extraction of small targets in the test area, the completeness of water body extraction, the distinction between shadows and water bodies, and the accuracy of boundary segmentation. In order to verify the space-time scalability of the model, this paper chose western Qingdao and Xining, Qinghai as the verification areas. The verification results show that the water body extraction was good for areas similar to the geographical environment of the experimental area, and the effect of water body extraction needs to be further improved in places that differ greatly from the geographical environment of the experimental area. In general, the improved U-Net network can effectively achieve the task of water extraction.
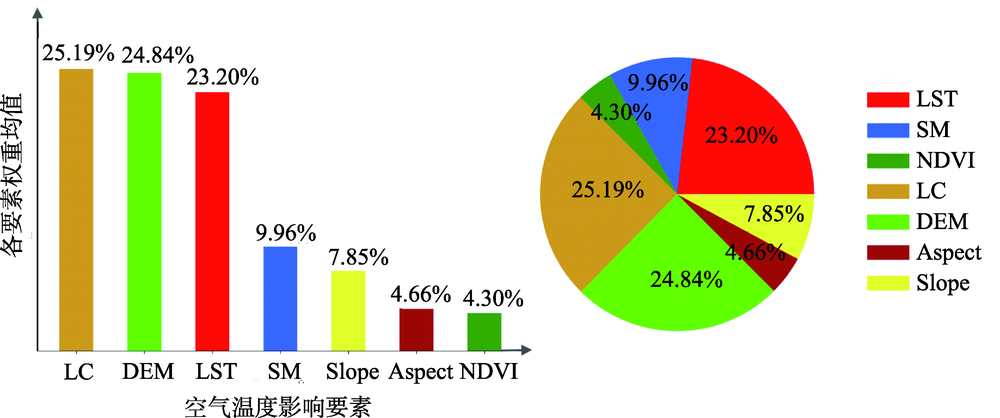
Air temperature is an important attribute for evaluating the living environment, and its studies and observations are closely related to human production and life. Air temperature observation data is of great significance for the study of hydrology, environment, ecology, and climate change. Traditional description of large-scale air temperature is generally obtained through meteorological stations. As affected by land surface condition and atmospheric state, the air temperature is spatially heterogeneous. However, due to the sparse spatial distribution of meteorological station sites, the data obtained from these meteorological stations cannot accurately describe the continuous spatial variation of air temperature across large areas. Hence, accurate inversion of near-surface air temperature based on remote sensing data is regarded as an effective and reasonably practicable solution. There are already some studies about obtaining spatially continuous near-surface air temperature using land surface temperature and other remote sensing data. In this study, we have used the remote sensing data, specifically the precise surface coverage type and spatially continuous soil moisture data, as the new input to improve the accuracy of temperature inversion. On this basis, we built a near-surface air temperature spatialization model using Land Surface Temperature (LST), land cover, soil moisture, land surface temperature, NDVI, DEM, aspect, and slope as the influencing factors. In order to fit the complex relationship between air temperature and its influencing factors, we chose four widely used machine learning algorithms and compared their accuracy to select the most reasonable model. At the same time, we also validated the results and evaluated the contribution of the influencing factors. Based on the results of the designed experiments, we found that precise surface cover type and spatially continuous soil moisture data played the most important role in near-surface air temperature spatialization model. The surface cover type has the greatest influence on the near-surface air temperature, and soil moisture is the most active influencing factor. The model validation results showed that the spatialization model has a relatively high accuracy, with an R2value close to 0.85, and a RMSE of 0.5℃. Comparing with traditional methods, the results of near-surface air temperature spatialization model in our study could express more refined spatial distribution pattern. The high precision near-surface air temperature inversion model proposed by our research is expected to provide effective data support to the study on the dynamic monitoring of agricultural meteorological disasters, simulation of crop growth processes, and analysis of regional climate change.
OLCI (Ocean Land Colour Instrument) sensor, as a successor of MERIS (Medium Resolution Imaging Spectrometer) sensor, has better temporal resolution, spacial resolution and image width, so it has potential advantages in aerosol retrieval, but there are few studies on aerosol monitoring using OLCI data. In order to expand the application field and scope of Sentinel-3AOLCI image data, a high-precision OLCI cloud detection algorithm based on the multi-channel advantage and observation geometry characteristics of OLCI was first proposed, which can effectively and accurately detect thin and thick clouds. Secondly, dynamic lookup tables based on observed geometric features was constructed. Compared with the traditional lookup table, the efficiency of AOD retrieval using dynamic lookup table is improved significantly. The surface reflectance of MODIS and OLCI red and blue channels were also transformed in an equivalent manner through spectral convolution and obtain the fixed relation of surface reflectance of OLCI red and blue channels. Finally, OLCI Aerosol Optical Depth (AOD) retrieval at 550 nm over The Taiwan Island was carried out, and the spatial distribution of AOD we estimated is highly similar to MODIS (Moderate-resolution Imaging Spectroradiometer) AOD. The validation results of OLCI AOD and AERONET (AErosol Robotic Network) level 2.0 AOD at 550 nm show that the accuracy performance of different seasons and stations is different, and then compared with the same period MOD04_3K AOD at 550 nm products, the correlation between the retrieved OLCI AOD and the measured AOD at AERONET stations is more significant (R2=0.8199), the Root Mean Squared Error (RMSE) decreases from 0.175 to 0.113, the Relative Mean Error (RME) decreases from 33.6% to 26.7%, and 67.5% of OLCI AODS fall within Expected Error (EE), which is significantly greater than that of MOD04_3K AOD falling within the prediction error range (55.7%). Error analysis showed that when the actual AOD value is low, the misjudgment of the relationship between surface reflectance of red and blue channels will lead to relatively obvious relative error of AOD retrieval, which means that there are some potential difficulties in retrieving high-precision AOD in areas with good air quality, but for areas with severe pollution, OLCI AOD has significant precision advantage.

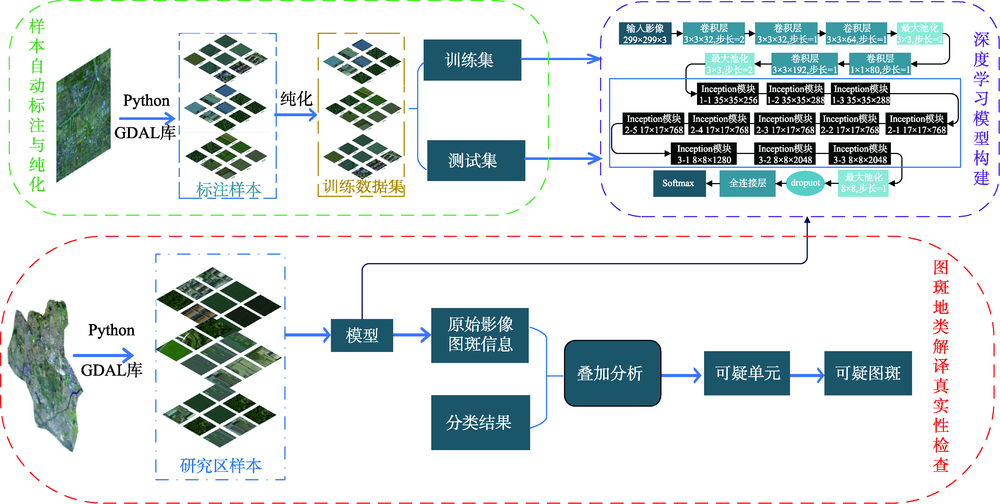
Spatial data quality check is important to guarantee the accuracy and reliability of remote sensing data. Current spatial data quality check mainly focuses on topological relationship, attribute consistency, and data correlation, ignoring the authenticity of land type interpretation in vector patches. Therefore, this paper proposes a method of checking the authenticity of land type interpretation in vector patches using deep learning and high-resolution remote sensing images, which is designed to meet the urgent need of authenticity check for vector patch categories in major national and industrial projects. In this paper, a method of automatic sample labeling and purification is proposed, which uses the geographic location information of the original map spot to realize processing unit labels automatically and uses two different classifiers combined with cross validation to achieve automatic sample purification, to obtain a large number of high-quality labeled samples for deep learning model training. The classic deep learning model (i.e., Inception_v3) is used for transfer learning to classify segmented images into automatic scene classifications. The overall classification accuracy of the deep learning model in the study area reaches 0.934, the average precision is 0.937, and the average recall is 0.928. Based on the scene classification results using high-resolution remote sensing images, the original vector patches are overlapped and analyzed. By connecting related fields, the segmentation units with inconsistent category information are automatically identified as suspicious patches. We further verified the authenticity check method of land type interpretation of vector patches in Qingshan Quan Town and Dawu Town, Jiawang District, and Xuzhou City. The experimental results show that the precision and recall of our method for these study areas are as high as 0.925 and 0.817, respectively. The method proposed in this paper provides a useful technical support for the check of the authenticity of the land type interpretation of vector patches.
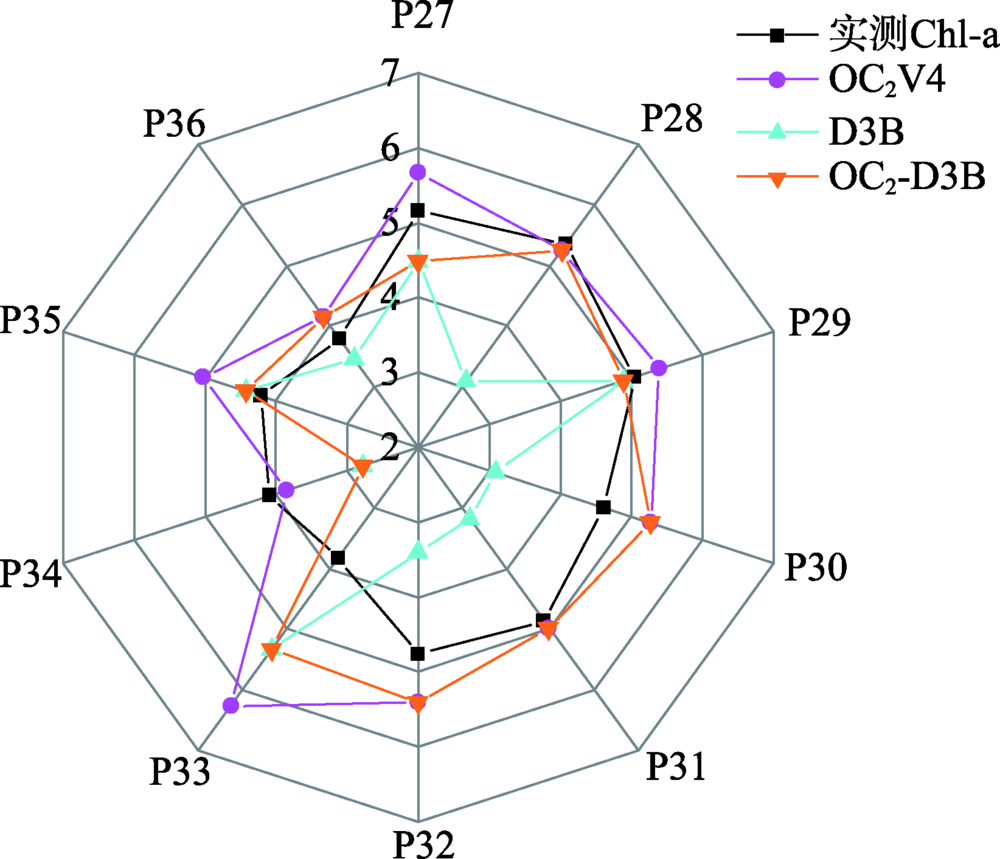
Chlorophyll-a (Chl-a) is an important indicator to evaluate water quality security. The accurate estimation of its concentration is of major significance to aquaculture development, aquatic ecosystem sustainability, and human drinking water safety. With the enhancement of the spatial and spectral resolution of earth-observed satellite sensor, remote sensing technology is exerting a growing important effect on monitoring the spatiotemporal changes of water quality in rivers. In this study, we synchronously measured water spectrum and collected water samples along the upper and middle reaches of the Kaidu River and around some small lakes in the Bayanbulak Wetland. Chlorophyll-a concentration and turbidity were measured for each sample in the laboratory. Based on the water reflectance spectrum and measured chlorophyll-a, we initially performed the sensitivity analysis of spectrum band to the concentration of chlorophyll-a, and then established various spectral index models, including band differences, ratios, and difference-sum ratios. Then Chl-a=4.50 mg/m3 was proposed as a hierarchical threshold for dividing waters samples into two groups and 11 empirical and semi-analytical chlorophyll-a retrieval models after calibration were applied to all sample datasets and the two separate datasets with relatively high and low chlorophyll-a concentrations to evaluate their accuracy. The optimal linear relationship between the independent variable (D3B) of three-band semi-analytical model and chlorophyll-a determined that D3B=-0.051 could be regarded as an indicator to classify waters with different chlorophyll-a concentrations. According to the performance of all the models, we ultimately selected the D3B model for high chlorophyll-a concentration waters and the blue-green band ratio model for low chlorophyll-a concentration waters, resulting in the hierarchical retrieval algorithm OC2-D3B. Its accuracy (R2=0.96, RMSE=0.32 mg/m3, MAE=0.24 mg/m3, and MRE=5.71%) was greatly improved compared with other single algorithms. Finally, we analyzed the spatial distribution and seasonal pattern of chlorophyll-a concentration in Bayanbulak Wetland using Sentinel-2 images from 2016 to 2019. The results indicate that the chlorophyll-a concentration in lake was higher than that in river, and the highest chlorophyll-a concentration usually appeared in summer, followed by spring and autumn, while the lowest chlorophyll-a concentration occurred in winter. Based on observational data from the Bayanbulak meteorological station, we further analyzed the effects of three environmental factors of temperature, precipitation, and sunshine duration on the chlorophyll-a concentration in the wetland river. The results show that the correlation coefficient between temperature and chlorophyll-a concentration reached 0.88, which was much higher than the other two factors. Thus, it seems that temperature was the main factor affecting chlorophyll-a concentration to some extent. In addition, this study could provide technical support for water environmental protection and water resource regulation in Bayanbulak.
Coastal wetlands are dynamic and fragile ecosystems, and they have taken place obvious changes, which affected by siltation and erosion, coastal development and utilization, therefore it is of great practical significance to timely monitor coastal wetlands changes. Remote sensing change detection technology can obtain the changes occurred in different times by mathematical model analysis, so it provides an effective way to monitor the dynamic changes of coastal wetlands. From the perspective of analysis unit of remote sensing change detection technology, change detection methods can be divided into pixel-based change detection methods and object-based change detection methods. Pixel-based change detection methods are sensitive to image registration errors, and their salt-and-pepper phenomena are also serious, while object-based methods are affected by image segmentation parameters, and often complicated for users. In order to solve the problems above, saliency-guided change detection combining pixel-based and object-based methods is proposed, in which the scene characteristics of coastal wetlands are taken into account. Firstly, the brightness, Normalized Difference Vegetation Index (NDVI) and Normalized Difference Water Index (NDWI) features are extracted, and the feature difference images are then obtained. Secondly, the Maximum Symmetric Surround (MSS) saliency detection algorithm is used to generate the saliency maps of feature difference images, and then the combination of Fuzzy C-means (FCM) with Markov Random Field (MRF) is used to extract the initial change detection result at the pixel level. Finally, multi-scale segmentation algorithm is utilized for object-oriented image segmentation, in which Rate of Change of Local Variance (ROC-LV) is used to estimate the optimal segmentation scales. The uncertainty index of segmentation objects is constructed to adaptively select training samples, and these training samples are used to train random forest classifier which is used to obtain the final change detection results. The experiments are carried out using Ziyuan-3 images in Yancheng coastal wetlands, Jiangsu Province, the results show that the proposed saliency-guided change detection combining pixel-based and object-based methods obtains the best change detection result when the segmentation scale and the uncertainty threshold are 55 and 0.7 respectively, the proposed method obtains the highest overall accuracy and accuracy ratio compared with traditional pixel-based, object-based, SG-PCAK, and SG-RCVA-RF methods, overall accuracy of our proposed method is 93.51%, which is higher than SG-PCAK method of 5.95%, false rate is reduced by 35.96% and accuracy ratio is improved by 29.24%, compared with SG-PCAK method. False rate is reduced by 29.04% and 22.78%, compared with the pixel-based method and object-based method respectively. Accuracy ratio of our proposed method is improved by 14.23%, compared with SG-RCVA-RF method. Therefore, the experimental results demonstrate the proposed change detection method improves the accuracy of monitoring coastal wetlands changes, compared with traditional change detection methods.

At present, due to different classification methods, softwares, and samples used for classification which could introduce various systematic errors, the majority of studies for comparing the advantages and disadvantages of pixel-based and object-based classification are unprecise to a certain degree. To make a better comparison between the pixel-based and object-based approaches, pixel-based and object-based classification methods were adopted to classify the fused image of panchromatic and multispectral images provided by GF-1 satellite in the main urban district of Zhoukou on April 17, 2018, using the same hardware and software environments, classifier, training samples, and verification samples, namely four identical conditions. Subjective and objective evaluations of the pixel-based and object-based classification methods were made. For comparison, three machine learning algorithms including Classification and Regression Tree (CART), Support Vector Machine (SVM), and Random Forest (RF) were used as the classifiers in the pixel-based and object-based classification procedure. Results show that (1) both pixel-based and object-based approaches could recognize the main urban targets, which was consistent with previous research results. However, the object-based method had a better overall accuracy than the pixel-based method on average. For pixel-based image classification, RF produced the highest overall accuracy (78.02%) and the Kappa coefficient (0.72); for object-based image classification, RF also achieved the highest overall accuracy (93.40%) and the Kappa coefficient (0.92), which demonstrated that RF was the best machine learning algorithm for classifying Zhoukou urban targets; (2) due to similar spectral signature and cross-distribution, the Producer's Accuracy (PA) and User's Accuracy (UA) of building land, and traffic land were lower. However, the object-based classification produced much higher PA and UA than pixel-based classification in classifying building land and transportation land. Taking RF as example, the PA of building land increased from 56.18% to 92.13%, with the UA increasing from 69.44% to 87.23%, and the PA of traffic land increased from 72.15% to 89.87%, with the UA increasing from 72.15% to 92.20%; (3) compared with previous related researches, this paper conducts a more scientific and rigorous evaluation for pixel-based and object-based classification methods under the four identical conditions, which provides valuable references to classify urban targets using high resolution satellite remote sensing images in the future.

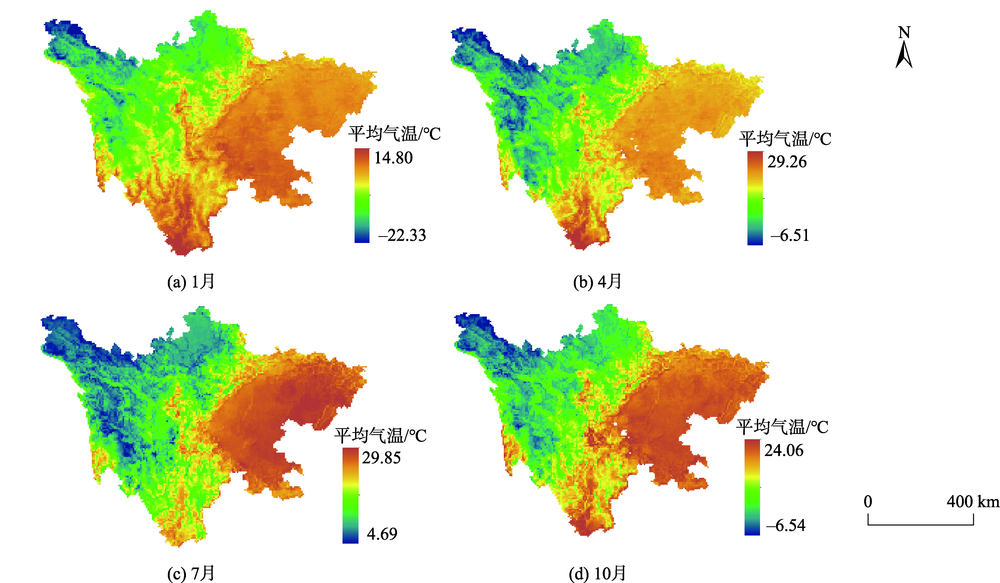
As a part of natural climate variability,Near surface air temperature is an indispensable parameter that drives the energy and water exchanges among the hydrosphere, atmosphere and biosphere. Spatially and temporally resolved observations of near surface air temperatures are essential for understanding hydrothermal circulation at the land-atmosphere interface, and have had significant ecological impacts on many parts of the natural ecosystems. Given the ecological significance of near surface air temperature, the demand for accurate spatial data has risen greatly. Unfortunately, the gridded near surface air temperature data is generally limited by station coverage of meteorological observations, especially in extensive mountainous regions. Moreover, the uneven spatial distribution of meteorological stations may not effectively capture the true nature of the overall climate pattern. Given the strong correlation between land surface temperature and near surface air temperature, recent efforts have developed an alternative method for retrieving spatially continuous near surface air temperature from satellite-derived land surface temperature data sets. However, the degree of accuracy for current applications in near surface air temperature estimation still has a large room for improvement. Here we introduce a novel approach that combines High Accuracy Surface Modeling (HASM) with Geographically Weighted Regression (GWR) model for improving estimation of near surface air temperature in a data-fusion context. In this approach, application of fusion methods using Moderate Resolution Imaging Spectroradiometer (MODIS) products and ground-based observations was used. By fusing the MOD11C3 land surface temperature products and the air temperature data observed at 190 meteorological stations in Sichuan province, this study combines HASM with GWR model for improving estimation of near surface air temperature. To assess the feasibility of this modified model, we use 175 stations for model development and reserve15 for validation tests with three repetitions. The performance of combining HASM with GWR model (HASM-GWR) is also compared with multifactorial Geographically Weighted Regression (GWR) and Ordinary Least Squares (OLS) methods. The results indicated that the best estimation was found in HASM-GWR model. Specifically, the validation results from HASM-GWR model show that 72% of the estimated residual error is between -1 ℃ and 1 ℃, 90% is between -2 ℃ and 2 ℃, and the Root Mean Square Error (RMSE) reduces by 25.42% and 39.83% in comparison with other techniques. In addition, the near surface air temperature map obtained from HASM-GWR is better than that obtained by using other methods. Therefore, the proposed HASM-GWR model demonstrated an effective proficiency in near surface air temperature estimation, and it can be seen as an alternative to the popular data fusiontechniques.