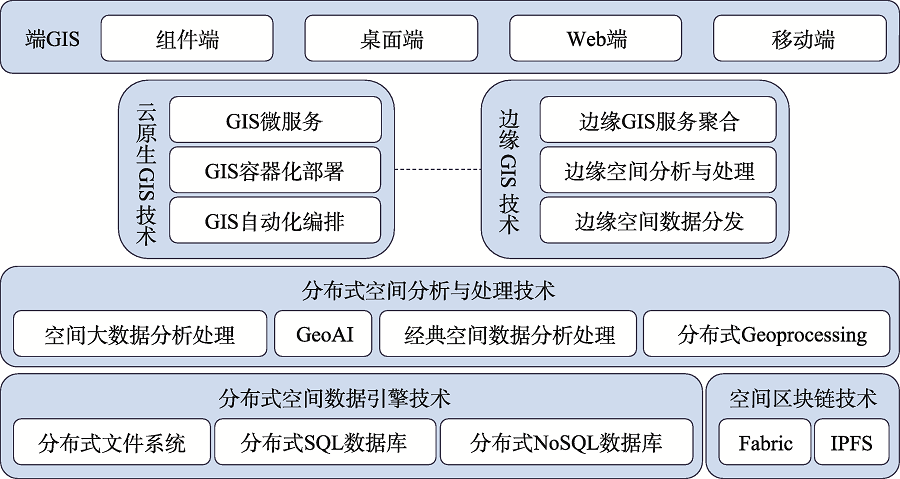
As an important part of the IT system, every advancement of GIS technology is closely related to the rise of the latest IT technology. With the development and application of cloud computing, big data, artificial intelligence and other technologies, nowadays GIS basic software has formed five major technology systems. The big data GIS technology increases the storage management, analysis, processing and visualization of spatial big data, enriching the connotation of spatial data. Artificial intelligence GIS technology enables GIS to enhance the analysis and prediction capabilities of GIS models by combining AI related algorithms. At the same time, the two empower each other. While enhancing GIS capabilities, AI also has spatial analysis and visualization capabilities and expands Its scope of application. The new 3D GIS technology realizes the integration of 2D and 3D GIS and the integration of multi-source heterogeneous data. It promotes 3D GIS from outdoor to indoor, from the macro to the micro. Distributed GIS technology breaks through the limitations of data types and resource capacity. The performance of GIS software is improved by orders of magnitude. It makes highly available and highly reliable GIS applications possible. Cross-platform GIS technology enables GIS software to run on different types of CPU structures and operating systems, meeting the increasingly diverse needs of multi-terminal applications. The five technologies complement each other, and they further expand the capabilities and application scenarios of GIS basic software. Taking SuperMap GIS as an example, this article introduces the specific content of the five GIS technology systems in detail and explains the difficulties and innovations of each technology. Finally, this article uses the hype cycle to divide the development stages of the five major technology systems and discusses the future development trend of GIS technology.
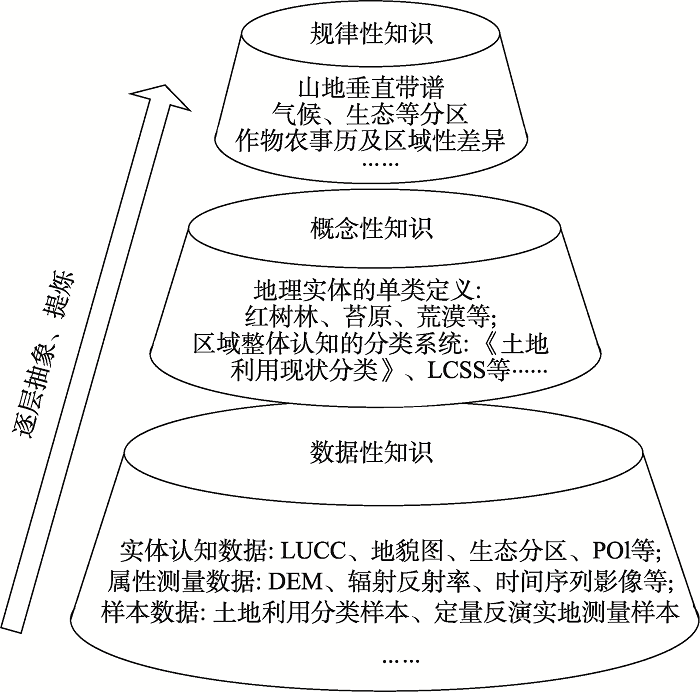
Due to the temporal and spatial heterogeneity of the complex earth's surface, the traditional idea of developing new intelligent interpretation algorithms to solve the remote sensing geoscience cognition based on the features of remote sensing images has hit the bottleneck in terms of accuracy and geographic usage when analyzing remote sensing big data. To overcome the bottleneck, we proposed the Geographic Knowledge Graph (GKG) that based on the geographic knowledge to analyze the remote sensing big data, which is inspired by the recently proposed Knowledge Graph from the geographic perspective. It expands the concept of the geographic knowledge and classifies the geographic knowledge into three levels: Data knowledge, conception knowledge, and regularity knowledge. Then, it represents and connects all geographic knowledge in Graph by nodes and edges and realizes the feedback iteration and update between different levels of the geographic knowledge. This representation enables GKG to perform well at knowledge inquiring, reasoning, calibration, and expanding. How to construct multiscale high-dimension geo-entities and how to connect different levels of the geographic knowledge with heterogeneous features are two key technologies. These functions make GKG promising in refining existing geographic knowledge in the era of remote sensing big data, promoting remote sensing interpretation accuracy and geographic usage, and promoting the development of geoscience.
Policing strategy of crime prevention is one of the important topics in crime geography.This paper systematically reviews the development and progress of policing strategy from three aspects: the characteristics of different types of crime prevention policing strategies, crime prevention experiments and the evaluation of crime prevention effectiveness. Our research shows that: ① Community policing, problem-oriented policing , hot spots policing and intelligent policing are the four main types of crime prevention policing strategies. Community policing takes the community as a unit and reduces crime through cooperation between the police and the local residents; Problem-oriented policing aims at identifying and solving social problems through a structured approach named SARA (Scanning, Analysis, Response, Assessment). Hot spots policing makes policing plan based on crime hot spots, and intervenes crime hot spots to reduce crime. Intelligent policing uses advanced technologies such as big data and artificial intelligence for more effective policing prevention. ② Crime prevention experiments compare the changes of crime before and after the intervention of police strategy between the experimental group and the control group. Most policing experiments are mainly focused on hot spots policing, which typically reduces crime in the experimental area, but may displace crime or diffuse the benefits of crime reduction to the neighboring areas; ③ Traditional police prevention evaluation mainly considers three aspects: detection rate, public security perception and social and economic benefit. To evaluate the effect of crime displacement or benefits diffusion, scholars put forward Weighted Displacement Quotient (WDQ), Spatio-Temporal Weighted Displacement Quotient (STWDQ), Difference in Differences (DID), Propensity Score Matching (PSM),integration of DID and PSM(PSM-DID)and DID-based quadrant method to measure the space-time benefits of policing strategies. In sum,while there exist abundant international research on policing strategy about crime prevention and evaluation of their space-time benefit such research in China still remain in its infancy. In the end, this paper further discusses the direction of future research on China's policing strategy.
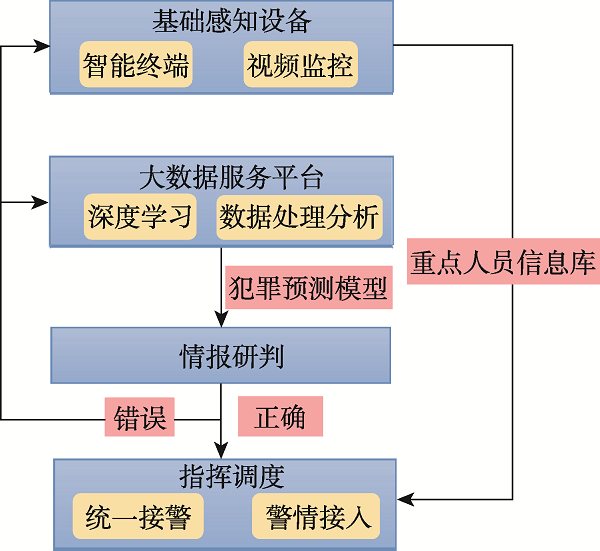
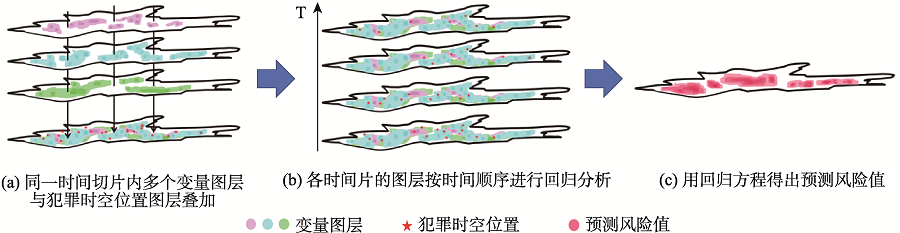
As the core technology of predictive policing, Spatial-Temporal (ST) prediction of crime has developed rapidly from around 2000 to the present. We introduce the basic theory of ST prediction of crime at the beginning. We regard the ST prediction method of crime as a process combining corresponding models to predict the ST distribution of crimes in the future and deconstruct it into relationships between three objects: case, ST backcloth, and individual behavior. Then, based on the input factors of prediction models, we sum up three current main methods, including ① the prediction method based on the information of cases' ST location, ② the prediction method based on the backcloth and the information of cases' ST location, and ③ the prediction method based on individual behavior, the backcloth, and the information of cases' ST location. We further summarize the mechanisms of different methods in detail respectively. In addition, we compare and analyze each method based on their applicable scenarios and predictive capacities. Finally, with the development of big data technology, we present solutions to improve current prediction methods, that are to construct a data-fusion system, refine data granularity, and integrate new types of data. For model optimization, we need to improve the ability of integrating heterogeneous data from multiple sources and balancing the interpretability and predictive ability of models.
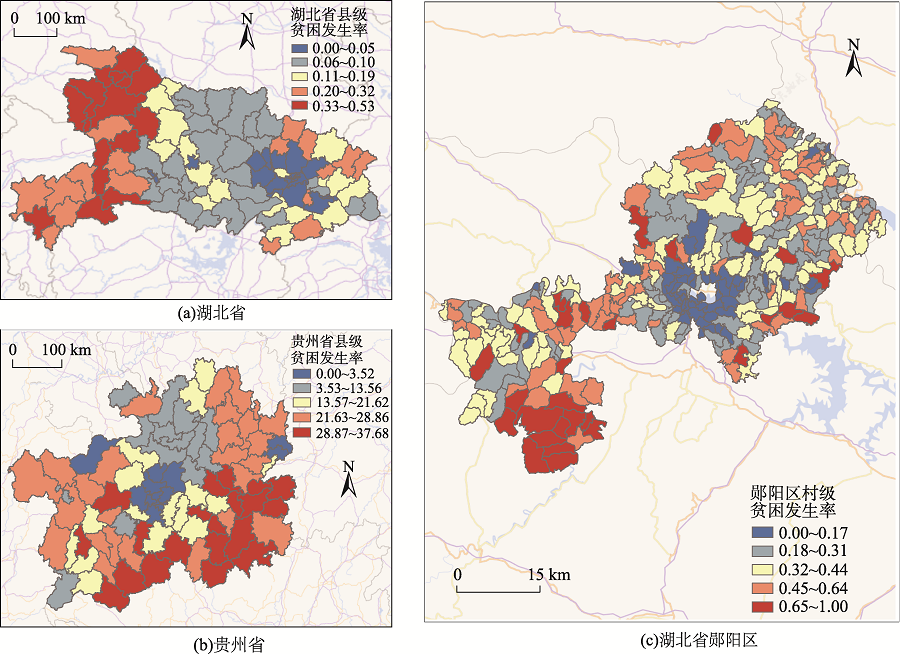
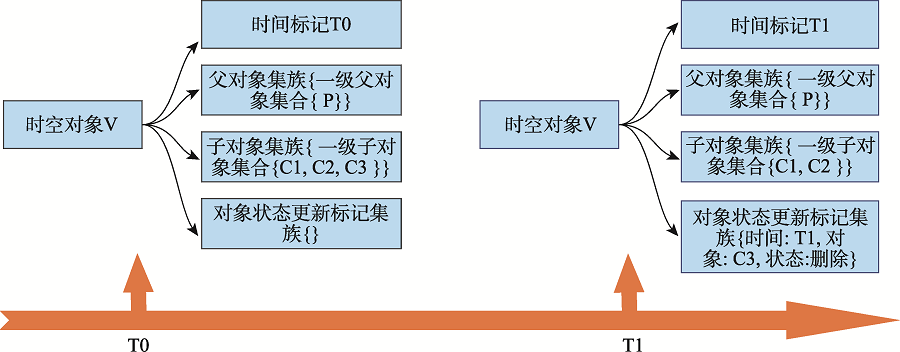
Eliminating poverty is a common goal of human society. Poverty has the characteristics of spatial heterogeneity and spatial autocorrelation. Spatiotemporal statistical methods dealing with georeferenced or spatiotemporal data have been widely employed for analyzing spatiotemporal poverty data. This paper reviews the applications of spatiotemporal statistical methods in spatiotemporal poverty analysis and classifies the applications into four categories: (1) exploratory analysis of poverty, mainly to identify and quantitatively analyze the spatiotemporal distribution pattern of poverty; (2) identification of spatial determinants of poverty, to analyze the influencing factors of poverty by constructing a model of the relationship between poverty and various geographical elements; (3) spatial mapping of poverty, to obtain the distribution of poverty in the entire region using sampling data; and (4) spatiotemporal analysis of poverty, to reveal the spatiotemporal changes of poverty and their driving factors. On the basis of explaining the principles of these methods, we give examples of recent applications to illustrate how specific spatiotemporal statistical methods are applied to spatial poverty research. On this basis, the shortcomings of current spatiotemporal poverty research and potential development on future poverty research are also summarized.
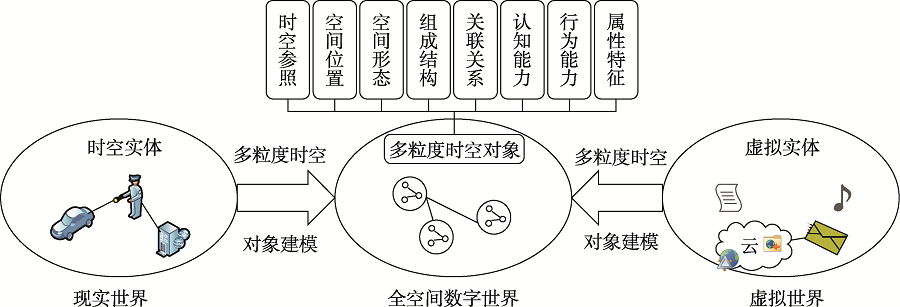
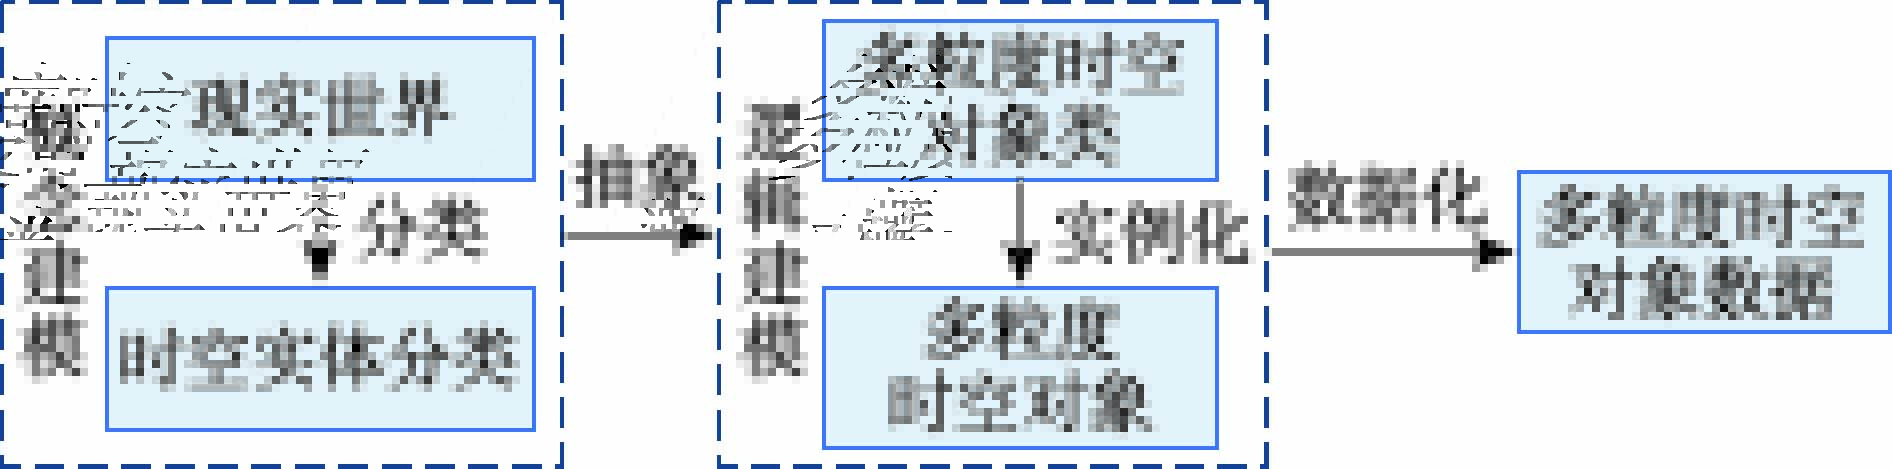
The pan-spatial digital world is a comprehensive data body composed of spatiotemporal objects describing various entities and elements in the real/virtual world in the computer system. It is an object-oriented description of the real/virtual world from macro to micro dimensions. Since the traditional management method using blocks and layers in GIS is not suitable for managing the complex and dynamic spatio-temporal objects in the pan-spatial digital world, an organization and management method of pan-spatial spatio-temporal objects based on spatio-temporal domain is proposed in this study. Based on analyzing the concept, composition, and characteristics of pan-spatial digital world, the concept of spatio-temporal domain is put forward. This study defines the data organization mode and essential characteristics in the spatio-temporal domain, and establishes a data organization system and management method including sub spatiotemporal domain, spatio-temporal object class, object relation class, and life cycle sequence of spatio-temporal objects in the spatio-temporal domain. The storage and management experiments of spatio-temporal data are carried out, which proves the practicability and feasibility of the organization and management of spatio-temporal objects based on spatio-temporal domain. This study provides an underlying support for the generation and processing, inspection and verification, visualization and output of spatio-temporal objects for future application scenarios.
At present, military combat data for modern warfare come from a wide variety of sources. However, the research on data modelling of military operations mainly focuses on the description of its spatio-temporal attributes. It lacks complete description for the diversified characteristics of combat entities and is difficult to mine multi-dimensional combat information. According to the framework of multi-granularity spatio-temporal object data model, spatio-temporal entities are simplified and abstracted as data models to summarize and express the complex real world. On the basis of analyzing the information and characteristics of combat entities, this paper builds the combat entity object classes and object models based on the idea of multi-granularity spatio-temporal object modeling, and carries out the preliminary study of the abstraction and expression of the characteristics of spatio-temporal entities, such as association relationship, composition structure, and behavior. We take the U.S. Kaiketi Task Force in the Afghan war as an example. The experimental results show that the multi-granularity spatio-temporal object modeling method provides a new idea for the expression of multi-dimensional characteristics of combat entities, and can mine the combat information precisely and comprehensively, which provides a theoretical basis for fine combat research.
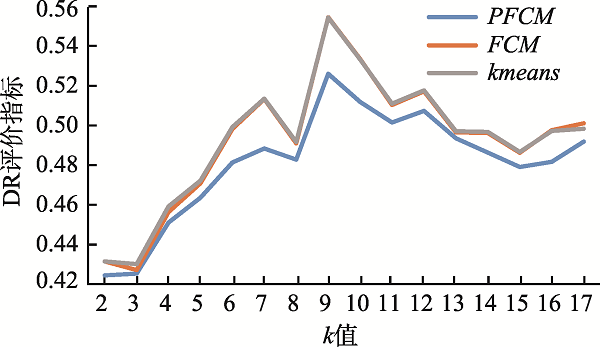
The rapid development of the geographic information industry has promoted the popularization of network geographic information services, providing the public with indispensable and convenient services such as spatial positioning, spatial query, and path planning, which penetrate all aspects of life. At the same time, the number of users is also exploding, how to provide users with on-demand and high-quality geographic information services has become one of the key issues to be solved. So it is meaningful to study the access behavior of users of network geographic information services, which is conducive to understanding users' geographic information interests and realizing on-demand services. Based on the theory of full spatial information system modeling, this paper constructs a user-visited city relationship network and studies the spatial aggregation of user access. Users' behavioral relationship strength generally involves many factors. This paper takes into account that the expression of behavioral relationship strength in relational network needs to consider user access behavior, city association relationship, and city structure at the same time, and there will be bias on a single user accesses behavior data. In order to solve this bias, this paper proposes a data fusion method based on matrix decomposition to integrate user access data, city associated data, and Point of Interest (POI) data in network geographic information services to express the strength of user-city access correlation. In the relational network, the fusion data are used to express the strength of behavioral relationship, and the distance between cities is used to express the strength of spatial relationship. On this basis, the clustering pattern mining of users is realized based on the relational network clustering method. The characteristics of users' preference to different cities will affect the clustering results. Given that clustering methods are usually based on spatial distance to achieve clustering, they cannot take into account the user's preference characteristics of different cities in the relationship network. On the basis of Fuzzy C-means Clustering algorithm (FCM), this paper proposes the PFCM algorithm based on the user's access probability to the city definition of access preference. At the same time, the spatial distance between cities and the strength of access behavior relationship in the relational network are taken into account to reduce the deviation of clustering results. This research expresses the spatial interest preferences of users through the spatial clustering of user visits. It helps to understand the relationship between user access behavior and cities and provides guidance for the performance improvement of network geographic information services in data caching and advance push so as to better serve user access.
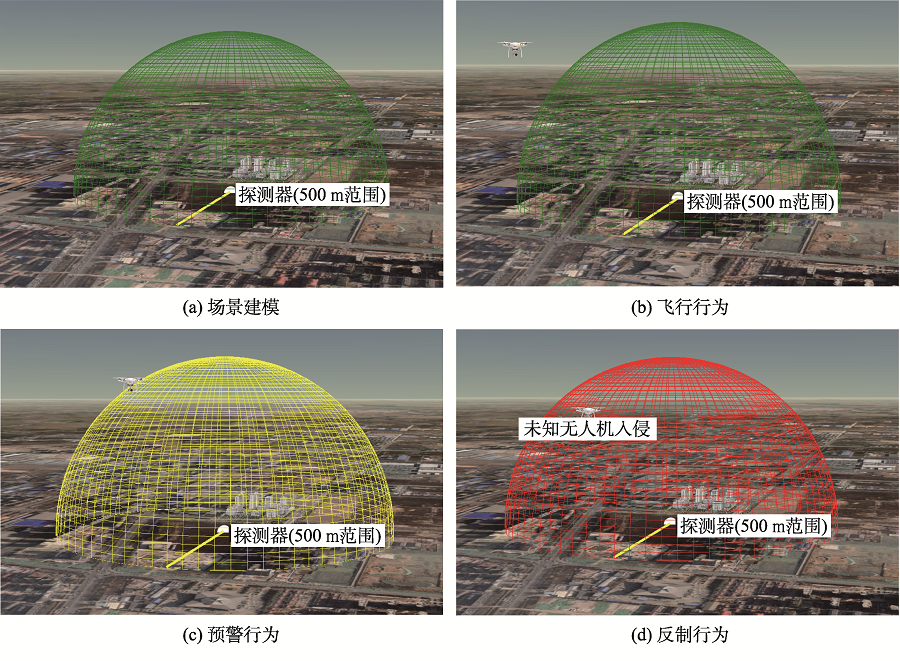
The description of spatial entities with dynamic change characteristics should include dynamic behavior as well as inherentl attributes. Traditional GIS models the inherent attributes and dynamic behaviors of spatial objects separately, which is essentially a static modeling idea based on map. However, the multi-granularity spatio-temporal objects take the behavior ability as the inherent attributes of objects, which is an important feature different from other objects, which makes the Pan-Spatial Information System (PSIS) be able to describe the "living" geographical entities with cognitive and behavioral capabilities. This paper focuses on the description and expression of spatio-temporal entities with regularized dynamic change characteristics, expounds the expression ideas of dynamic behaviors of multi -granularity spatio-temporal objects from the perspective of multi-granularity spatio-temporal objects, and proposes a dynamic behavior expression model of multi-granularity spatio-temporal object individual and object world, which provides a new viewpoint for comprehensive understanding and expression of dynamic changes of spatial objects. According to the feature of multi-attribute staggered change, multi-object complex linkage, multi-process dynamic autonomy, In order to carry out the actual modeling of multi-granularity spatio-temporal object dynamic behavior, this paper summarizes four different ways of dynamic behavior changing inherent attributes, and presents the expression methods of dynamic behavior based on dynamics, rules, data mining and intelligence agent respectively It is discussed. Finally, an empirical analysis is carried out in combination with practical application. The results show that it is no longer necessary to design additional data models to integrated model the internal attributes and dynamic behaviors of spatial entities, and the behaviors and objects are no longer separated; using the unified dynamic behavior expression model, the behavior is not only decoupled from the object, but also universal, inheritable and reusable; the combination of different behaviors of objects can In order to describe the complex dynamic change process of spatial entities, it provides useful experience and reference for object behavior modeling in the PSIS.
The construction of pan-spatial information systems and smart cities requires abstracting geographic entities from spatiotemporal objects. The multi-granularity of spatiotemporal objects is reflected as the multi-scale, multi-dimensional, and multi-level characteristics of spatiotemporal objects. In the era of big data, how to organize the information of multi-granular spatiotemporal objects has become a difficult issue in the research of spatiotemporal objects. Based on object-oriented thinking, this paper proposes a set of expression and operation methods for the composition of spatiotemporal objects, which provides a new idea for the orderly organization of spatiotemporal object information. This method is based on the concept of classification theory and divides the composition of spatiotemporal objects into entity object composition and relation. Then we construct the spatiotemporal object information set , object composition set, and relationship composition set to make a complete description of the composition structure of spatiotemporal object. Then we provide related operations on the composition and expression of spatiotemporal objects such as construction, update, destruction, combination, and decomposition to further improve the expression of multi-granular spatiotemporal objects. Finally, we take Luoyu Road in Wuchang District as the spatiotemporal object in this study, and the expression and operation of the structure of the spatiotemporal object are illustrated with examples. The proposed method realizes the expression of the composition structure of multi-granular spatiotemporal objects and reduces the redundancy of the composition of spatiotemporal objects.
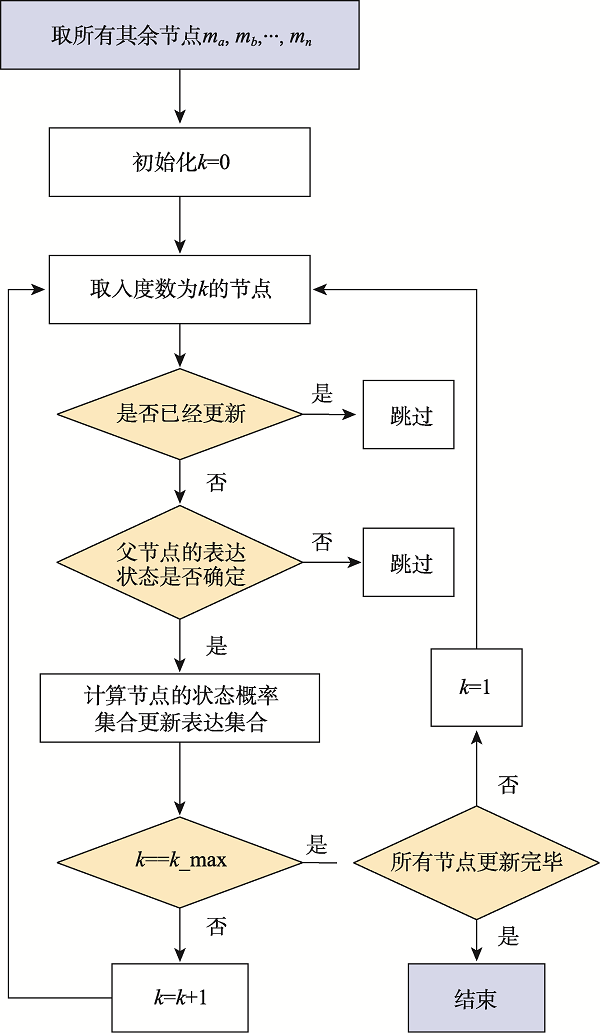
Spatio-temporal objects of multi-granularity have the characteristics of multi-granularity, multi-type, multi-form, multi-reference system, multi-relation, multi-dimensional dynamics, and multi-energy autonomy. It can be used to directly describe the real world from micro to macro. Based on the spatio-temporal objects modeling theory, constructing the integrated expression of the coupled evolution of multi-scale geographic objects is the key to supporting geographic analysis and modeling with spatio-temporal objects of multi-granularity model. Based on spatio-temporal objects of multi-granularity modeling theory, this paper develops a Bayesian network-based geographic process evolution expression and modeling method on the basis of probability diagrams and conditional probability tables. This method uses spatio-temporal objects of multi-granularity as Bayesian network nodes, and constructs Bayesian network according to the association relationship between spatio-temporal objects of multi-granularity. It uses Bayesian probability to express the strength of the relationship between spatio-temporal objects of multi-granularity. And it describes the dynamic changes of the feature state of the elements through the update operator and the probability graph model. Based on this method, the Xin'anjiang Model is selected to conduct the modeling and simulation experiment of the geographic process of spatio-temporal objects of multi-granularity. This paper uses the hydrological data of Chengcun Village from 1989 to 1995 as training data, and the hydrological data of 1996 as simulated data. Using precipitation surface, evaporation surface, runoff surface and confluence surface to construct Bayesian network and simulate the state of runoff and sink flow. The experimental results show that the method can not only model the evolution of hydrological process, but also can simulate the changes of runoff and sink flow in the hydrological process, and the correct rate can reach 97.5% and 95.9%.
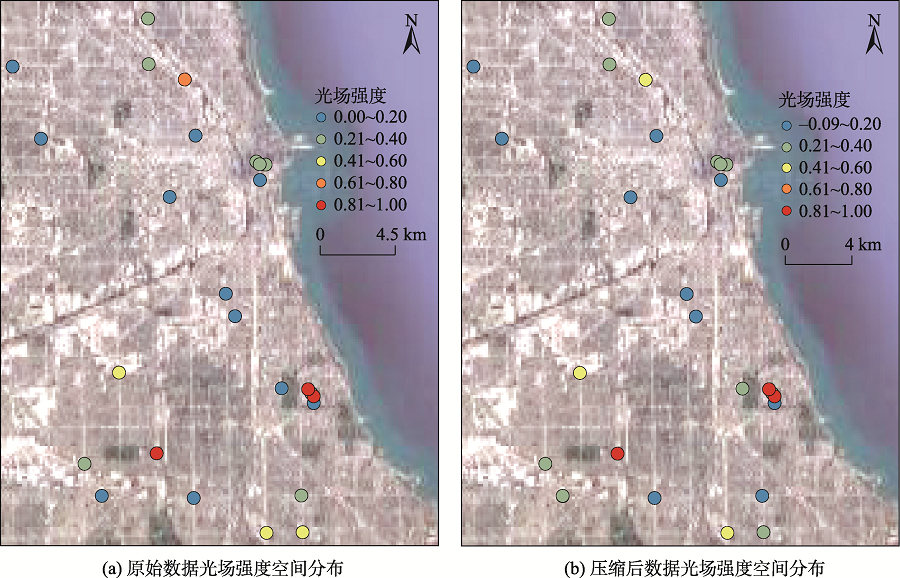
Array of Things (AoT) provides continuous and dynamic observations of urban systems through multiple sensors at a single location. How to utilize the limited computing resources to compress and transmit AoT sequence data becomes one of the key bottlenecks of the AoT application. Considering that most AoT sequence data are massive, high-dimensional and needed to be processed at the sensor side, a tensor decomposition method is introduced to the lossy compression for AoT sequence data in this work. This method first organizes the AoT sequence data as a high-dimensional tensor to preserve the multidimensional coupling relationship among the different dimensions. The CANDECOMP/PARAFAC (CP) decomposition, which has simple parameter, relatively simple principle and low algorithm complexity, is then utilized to decompose and extract the principal feature components in each dimension of AoT sequence data. Since these principal feature components are obtained by absorbing the multidimensional coupling relationship, they can be further combined with tensor reconstruction to approximate the original data accurately. Considering that the data approximation is obtained by removing the redundant information, it can achieve the data lossy compression with the feature preservation. The simulation experiment is conducted based on the acousto-optic electromagnetic data sensed within 24 hours in the downtown area of Chicago in the United States. The influences of different compression parameters on compression ratio, compression error, compression accuracy, compression time, memory usage under the conditions of different compression parameter are discussed. The experimental results show that, with the increase of compression parameter, the compression error obviously decreases and the memory occupation weakly increases, which demonstrates that tensor-based method can achieve lossy compression of AoT sequence data and both the memory occupation during the running process and the memory occupation of the final results can support the data compression of sensor segments. Compared with the original intensity of the light field, the compressed data maintain the spatio-temporal distribution characteristics of original data that would not affect the further data analysis. In addition, compared with the traditional vector quantization coding compression method, the compression ratio of this method is higher about 27%~76%, the compression time is less about 46%~73%, and the memory occupation of compression result is smaller about 17%~57%. Therefore, the tensor-based method has a higher compression ratio, less compression time and smaller memory occupation under the same compression accuracy. The tensor-based method can also be applied to the data with multidimensional features, such as spatial dimensions with different locations, time dimensions at different time nodes, and attribute dimensions of different variables (temperature, humidity, etc.), which could provide a feasible idea for large-scale lossy compression of massive multidimensional geographic sensor sequence data represented by AoT sequence data.
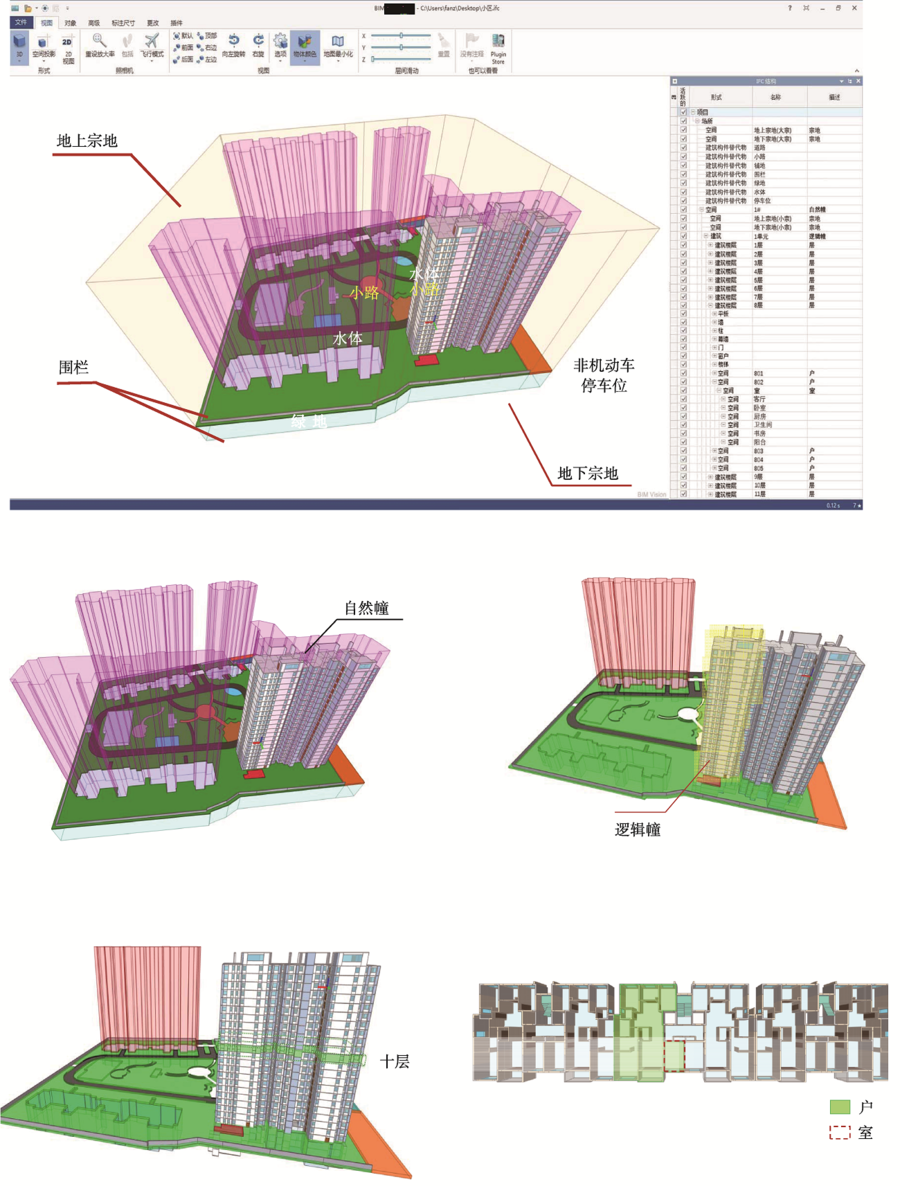
Accurately quantifying the three-dimensional (3-D) characteristics of real estate in a 3-D space is a key issue for the comprehensive development of urban above ground and underground spaces. The domestic and foreign scholars have proposed various real estate data models to improve the real estate management and the 3-D expression of space rights. By reviewing domestic and foreign researches, it is found that the real estate data models proposed by foreign scholars mostly focus on cadastre, which cannot be fully applied to the real estate management in China. Although the domestic scholars have considered the cadastre and real estate, they neglected the relationship between architectural entities, architectural space, and property right. Thus, the real estate information and the Building Information Modeling (BIM) have not been integrated together in domestic models, which limits the management of real estate. Based on this, this paper proposes a 3-D real estate data model which integrates the land and housing based on extended Industry Foundation Classes (IFC) and further confirms the model feasibility for management of the real estate. The model proposed in this paper clearly expresses the building objects and property rights. It can not only support the query of association for business, but also support the query and expression of topological relations in GIS. The 3-D real estate data model integrates architectural components and architectural spaces in BIM, which provides technical support for urban construction and operation.
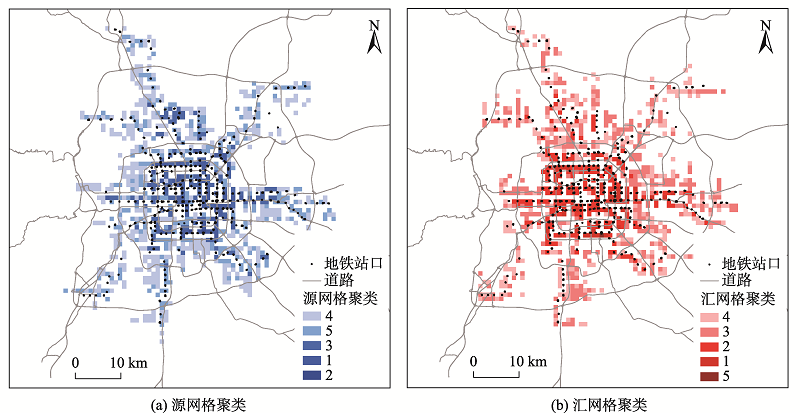
Dockless sharing bicycle is an effective transportation tool to solve the "last mile" traveling problem. However, when people use it to connect to the subway, there are usually no bicycles available or too much bicycles accumulated. Therefore, exploring the spatial and temporal distributions of the source and sink of the dockless sharing bicycles used to connect to the subway and analyzing their influencing factors are of certain significance to balance the bicycles’ supply and demand. Also, bicycle operating companies can make more timely and reasonable scheduling based on this. To understand the usage patterns of dockless sharing bicycles connecting to the subway in different regions, this paper used the K- Means clustering algorithm to classify the source and sink grids of the sharing bicycles used to connect to Beijing subway stations based on the passenger flow data at different times, and further used Geo-detector to explore the dominant factors of the spatial pattern. The results show that: (1) the source and sink grids of sharing bicycles were divided into five categories respectively, namely high-frequency low-outflow source, high-frequency abnormal source, medium-frequency low-outflow source, low-frequency high-outflow source, and low-frequency low-outflow source, and high-frequency low-inflow sink, medium-frequency low-inflow sink, low-frequency high-inflow sink, low-frequency differential inflow sink, and high-frequency abnormal sink, which describes the spatial and temporal characteristics of dockless sharing bicycle source and sink; (2) In different clusters, the dominant factors of the daily average flow values ??of bicycles were different. Bicycle clusters located in the city center were mainly affected by location attributes and traffic attributes, while in other clusters, they were significantly affected by multiple POIs as well. Besides, in different time periods, the influence mechanism of POI was often different; (3) For the rate of net inflows (outflows), the dominant factors of the source and sink grids of each cluster were approximately the same. The lack or surplus of bicycles was mainly related to the distance between the grids and the nearest subway station or the city center. (4) In terms of the overall source and sink rates, the distance between the grids and the nearest subway station, and the amount of residential POI were the most important factors, respectively.
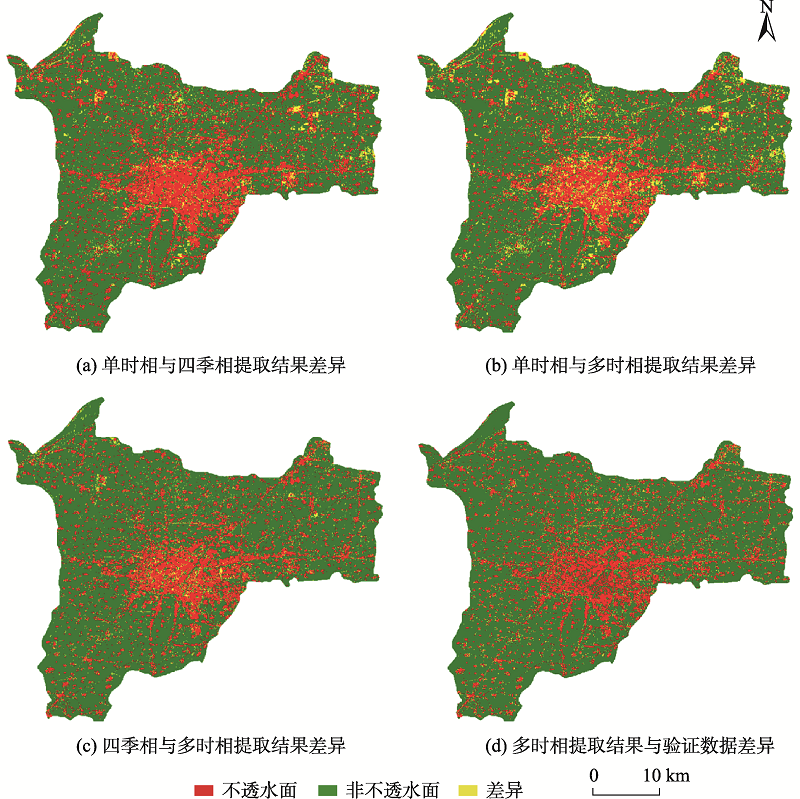
Impervious surface acts as an important technical indicator of urban characterization and regional urbanization dynamics. Its location, patch size, and spatial distribution are widely used by the communities of surface hydrothermal cycle and energy balance. However, traditional methods usually adopt a single time-phase image to retrieval the impervious surface information without considering the rich information implied in multiple time-phase images. Therefore, this paper presented a method to extract the impervious surface by integrating features in time-series images within a year. We generated the Normalized Difference Vegetation Index (NDVI), Modified Normalized Difference Water Index (MNDWI), and Normalized Difference Built-up Index (NDBI) from time-series Landsat-8 OLI surface reflectance images to analyze the intra-annual features of multi-temporal spectrum curves between typical objects and summarize principles in describing changes of impervious surface from multiple time phases. We also combined the prior knowledge of effective impervious surface information to improve the extraction accuracy. Finally, we used field survey data and the 30-m impervious map generated from the 2-m GF-1 image by screen digitalization to validate the accuracy of results using three combinations of images as input (i.e., single time-phase image, four images of seasons, and multi-temporal images). The results show that the impervious surface extracted from the single-phase image had the lowest accuracy, while the extraction accuracy using multi-temporal images was the highest with an overall accuracy of 93.66% and a Kappa coefficient of 0.81. The extraction accuracy using the four images of seasons was in the middle. Furthermore, the presented method showed potential advantages of effectively identifying impervious surfaces in rural areas. Our method provides a new idea for the impervious surface extraction through integrating temporal spectral features of impervious surface.