The COVID-19 pandemic is the most serious global public health event since the 21 st century, and has become a hot topic concerned by different disciplines. According to the bibliometric analysis, more than 13,000 papers related to the COVID-19 have been published since the beginning of the pandemic. Related researches include not only the pathogenic mechanism of the virus and the development of specific drugs and vaccines from the medical and biological perspectives, but also the non-pharmaceutical prevention and control methods for the pandemic. The latter is the focus of this paper, in which the research progress on the pandemic is discussed from six aspects: detection of transmission relationships, spatiotemporal pattern analysis, prediction models, spread simulation, risk assessment, and impact evaluation. The research on the detection of transmission relationship mainly includes the detection of cluster cases and transmission relations, among which individual trajectory big data have become the key to research. The progress of the analysis of spatiotemporal patterns of the pandemic shows that the spatiotemporal distribution of the pandemic has significant temporal and spatial heterogeneity, and the spatiotemporal transmission presents typical network characteristics. The prediction of the pandemic mainly relies on dynamic models scaling from macro to micro, in which the non-negligible impact of population migration makes the human flow big data become one of the key elements of model prediction accuracy. In the study of epidemic spread simulation, the focus is on evaluating the effects of controlling measures such as traffic restrictions, community prevention and control, and medical resources allocation through simulation methods. Results show that traffic interruption and community control measures are the most effective means among non-pharmaceutical interventions at present, and the guarantee and reasonable deployment of medical resources are the basis for pandemic prevention and control. After the pandemic is controlled under the effective measures, the resumption of work and production must be in an orderly manner. The research on pandemic risk assessment currently focuses on biological factors, natural factors and social factors. As to biological factors, researches show that the underlying disease and the male (due to their high mobility) are related to a higher risk of infection. Among natural factors, temperature, precipitation and climate have limited influence on the spread of the pandemic. As to social factors, human mobility, population density, and differences in medical conditions caused by social inequity have significant influences on the infection rate. Regarding the impact of the COVID-19 pandemic, we mainly focus on three aspects: the public psychology, natural environment and economic development. Specifically, the impact of the pandemic is mainly negative on the public psychology and economy, and positive on the natural environment. In conclusion, big data especially individual trajectories and population big data are indeed pervasive in research of non-pharmaceutical intervention. To prevent and control the major outbreaks, the intersection of multiple disciplines and the collaboration of personnel in different fields are indispensable. Although a great progress has been made on various aspects such as the effect of controlling measures and the influencing factors of the pandemic, the spatial traceability, precise prediction and future impact of the pandemic are still unsolved problems.
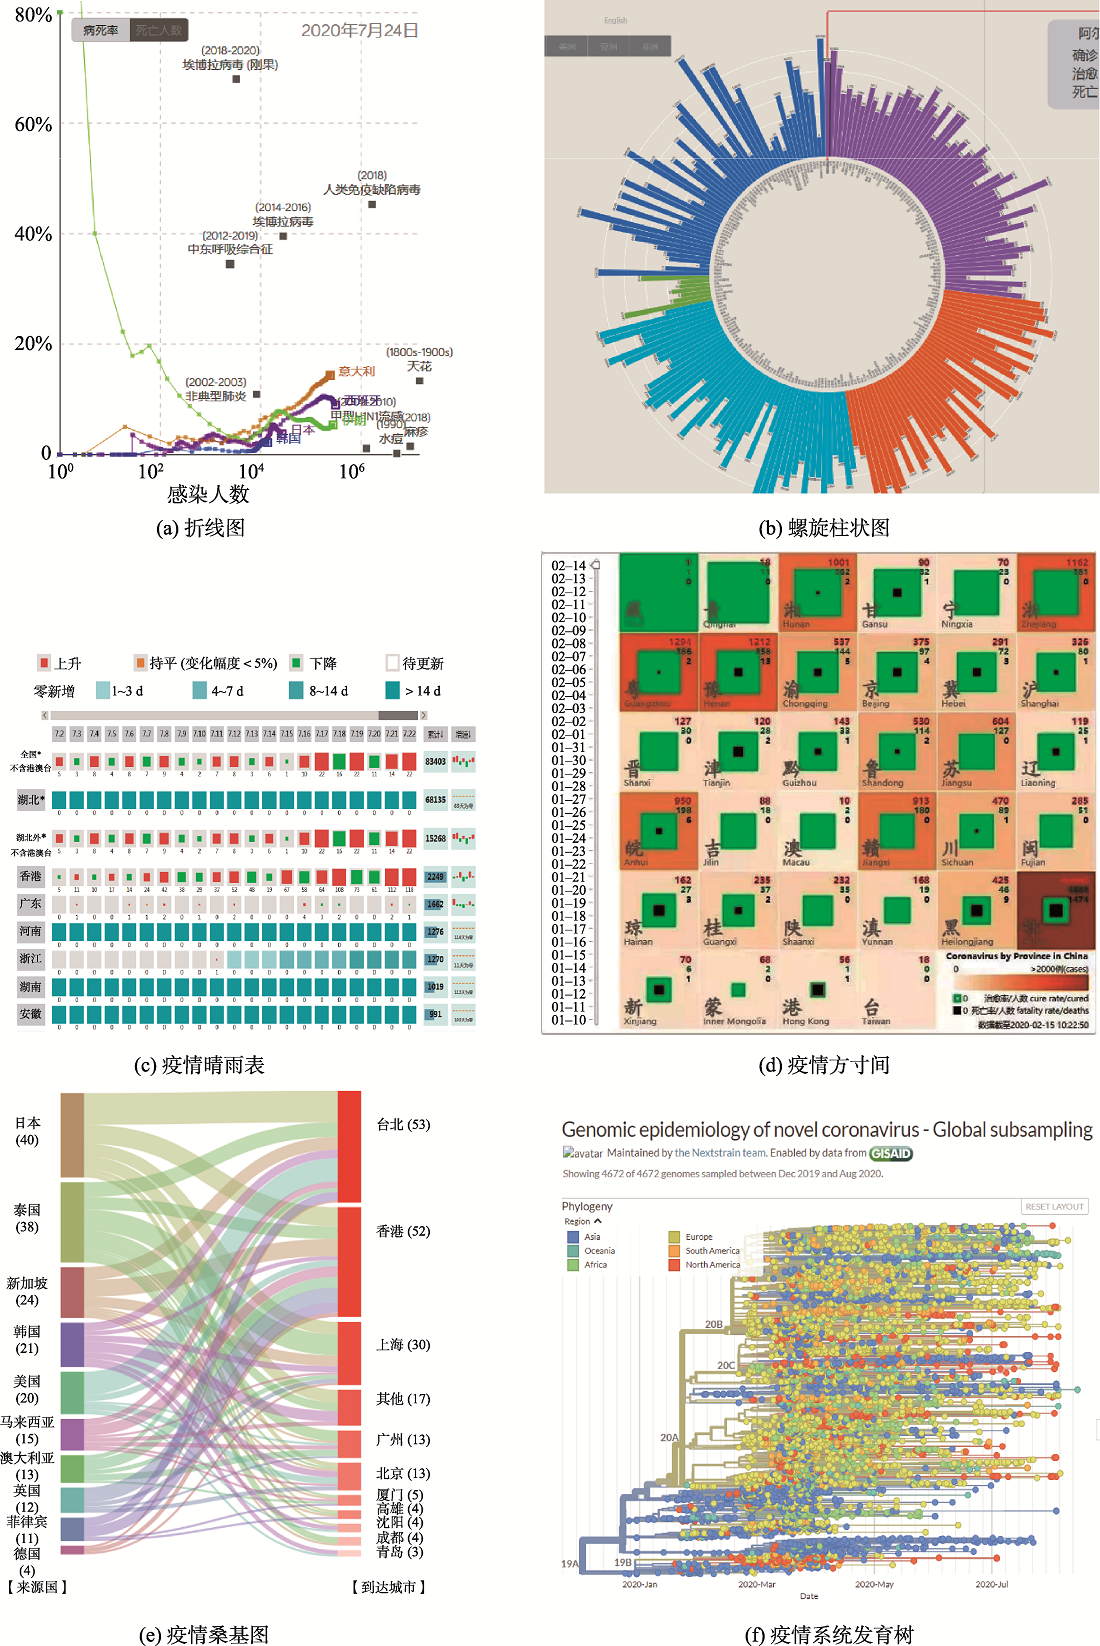
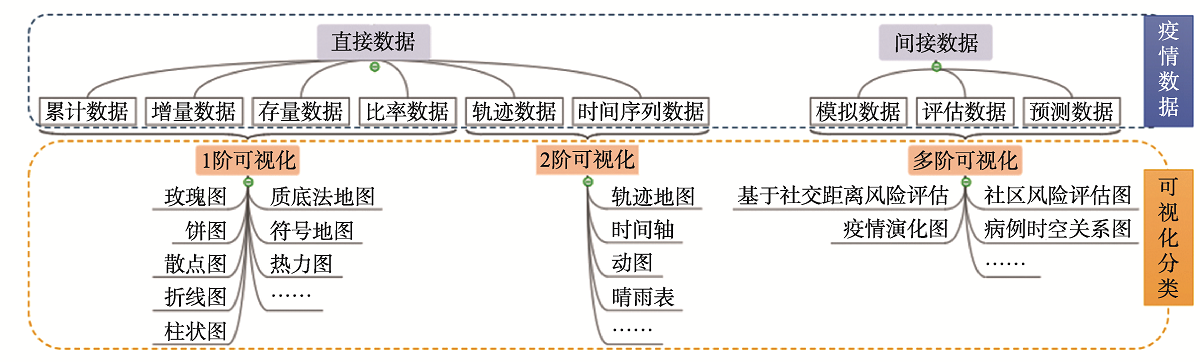
The COVID-19 epidemic has extremely attracted our attentions and lots of maps and visualization charts were created to represent and disseminate the information about COVID-19 in time, which exactly became a key role for the public to acquire and understand the quantitative information and spatial-temporal information of COVID-19. The paper analyzed the dimension of data for COVID-19 and processing levels about them, then divided the COVID-19 visualization into three types, that is 1-order visualization, 2-order visualization and multi-order visualization for COVID-19, based on direct data or indirect data of COVID-19 with the corresponding visualization methods, characteristics and information transmission Shortcomings and weakness of visualization methods for COVID-19 were analyzed in details, from the aspects of multiple scale unit in spatial data statistics, max value dealing in data classification, also many key design points were described including color connotation in disease visualization, the influences of area / unit size in visualization, symbol overlapping, multiple-scale heat maps and labels in statistical tables. The paper indicated the visualization traps of COVID-19, such as misuse of visual effects and excessive visualization, and reasonable abilities of COVID-19 visualization including map-story narrative methods and visualization pertinence for specific problems should be considered sufficiently to provide the references for cartographers to design the maps and for readers to understand the maps.
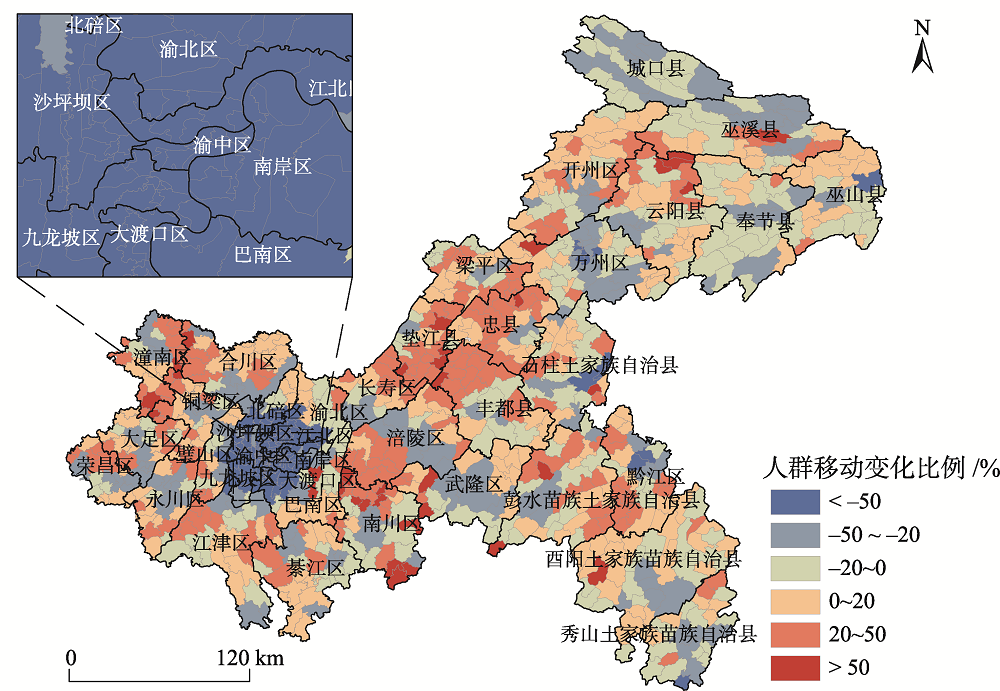
Based on the epidemiological investigation data of 545 COVID-19 cases and mobile phone trajectory data of 15 million users during the epidemic ( from 21 January, 2020 to 24 February, 2020 ), this paper analyzed the spatial-temporal characteristics of COVID-19 and the human mobility changes in Chongqing. Furthermore, the correlation relationship between them was explored to explain these characteristics and changes. The results show that: (1) The epidemic pattern in Chongqing can be divided into three stages ( i.e. imported cases stage, imported cases plus local cases stage, and local cases stage ) and the real time reproduction number (Rt) was high at early stage, but declined significantly after prevention and control measures were taken; The spatial distribution of cases presented a significant clustering, and the high clustering areas were mainly distributed in the northeastern and the southwestern of Chongqing; (2) After the epidemic, the total amount of human mobility decreased to 53.20% and the decrease was mainly concentrated in the main urban area, while that of in the suburbs and rural areas did not change, or even increased; (3) The relationship between human mobility and case occurrence lies in two aspects: The correlation coefficient between daily human mobility and Rt, daily increased number of cases after an average incubation period (7 d) were 0.98, 0.87, revealing the time correlation between human mobility and case growth; The correlation coefficient between total amount of human mobility and total number of cases, number of local cases in each street (township) were 0.40, 0.35, revealing the correlation between human mobility and spatial distribution of cases. The cases clustering area corresponds to the network community of human mobility, revealing the local clustering transmission is the major transmission model. By aggregating the big data and the epidemic data, we suggests that cutting off the connection between different human mobility network communities and blocking the local transmission inside the high risk communities is an effective measure for the prevention and control of epidemics in cities.
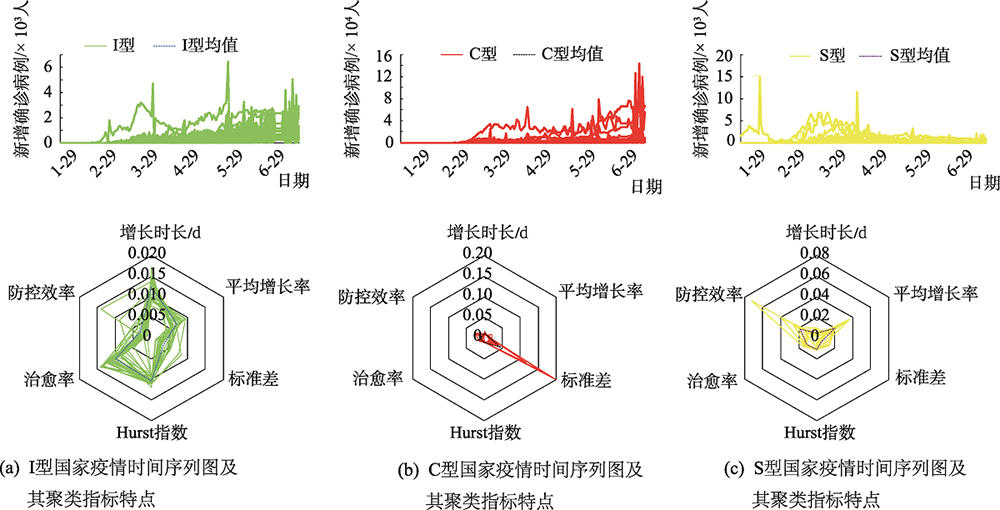
Since the outbreak of COVID-19, countries around the world have shown different time-series characteristics. Studying the characteristics of the development patterns of different countries and revealing the dominant factors behind them can provide references for future prevention and control strategies. In order to reveal the similarities and differences between the epidemic time series in different countries, this article extracts the standard deviation, Hurst index, cure rate, growth time, average growth rate, and prevention and control efficiency of the daily time series of new cases in the main epidemic countries for pedigree clustering. We also analyzes the causes of clustering results from the aspects of economics, medical treatment, and humanistic conflicts. The results show that the global epidemic development model can be divided into three categories: C-type, S-type, and I-type. The time series of C-type countries are characterized by continuous fluctuations and rising, and the cure rate is low. The reason is that humanistic conflicts are not conducive to epidemic prevention and control. Economic and medical resources have become scarce after a long period of large consumption. It is recommended to strengthen publicity and guidance in prevention and control, change concepts, and coordinate the allocation of economic and medical resources. The time series of S-type countries is characterized by a rapid rise and then an immediate decline, and eventually maintains a stable trend. The overall cure rate is relatively high. The reason is that these countries have domestic stability, high economic and medical standards, and timely prevention and control measures. It is recommended to strengthen international cooperation and scientific research, and prepare for the possible second epidemic. The time series of I-shaped countries is characterized by a slow rise, the overall development trend is unstable, and the cure rate is low. The reason is that its outbreak is relatively late and less severe. Most of the economic and medical levels and humanistic conflicts are not conducive to epidemic prevention and control. It is recommended to learn better prevention and control experience, implement strict isolation measures, try to meet the material needs during the epidemic, and optimize treatment methods.
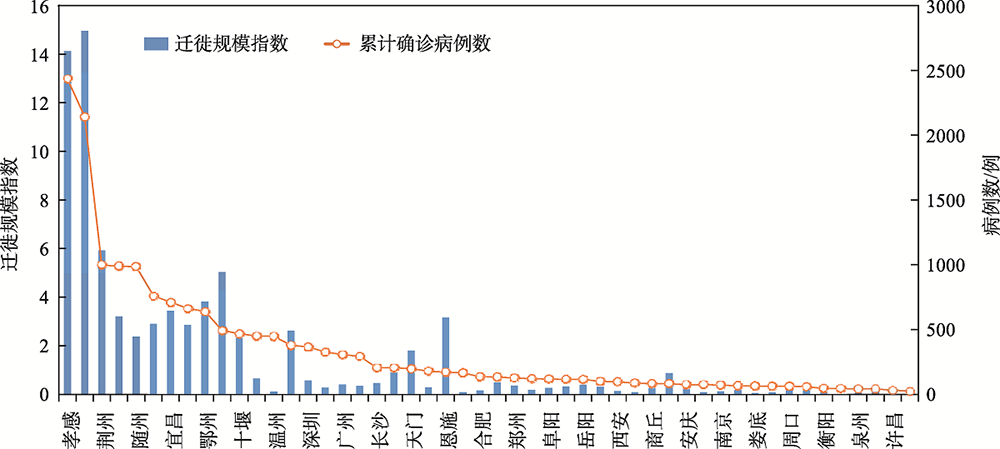
The spatio-temporal evolution of major public infectious epidemics during government's strict control period in prefecture-level city can effectively reflect china's comprehensive emergency prevention and control capabilities. Based on statistical data including number of active cases, total confirmed, deaths of COVID-19 in 312 cities in China from January 24 to March 5, 2020, this paper uses methods including exploratory spatial data analysis, optimized hot spot analysis, spatial Markov chain, spatial panel data model to analyze spatio-temporal evolution characteristics of COVID-19 epidemic in China under government's strict control.The study found that: (1) The number of active cases of COVID-19 in China experienced characteristics of "rapid growth and diffusion, basic control, gradual decline, and complete control in some areas" and reached its peak on February 17, with an average daily growth rate of 17.5% during rising period and an average daily decline rate of 5.1% during falling period, and the epidemic change characteristics of most cities are similar to Nationwide's situation;(2) The high population mobility during Spring Festival transportation period is main reason for rapid expansion of epidemic. The Baidu's migration scale index for the 14 days prior to Wuhan closure was significantly correlated with total confirmed cases of COVID-19 in some cities; (3) The method called optimized hot spot analysis has identified that spatial distribution of hot spots of epidemic is stable and mainly distributed in 36 cities with Wuhan as the center and a radius of about 350 kilometers, while no statistically significant cold spot cities were identified; (4) The results of Markov chain transfer probability matrix analysis of active cased of COVID-19 in 312 cities show that various types are more stable and the probability of maintaining original type is greater than 0.85. The average probability of downward transfer is significantly higher than the probability of upward transfer. The probability of each type of transition changes significantly under the influence of different spatial lag types; (5) The estimation results of the spatial panel data model show that the number of active cases of COVID-19 in cites has spatial-temporal autocorrelation. This paper analyzed spatio-temporal evolution characteristics of COVID-19 epidemic during government's strict control period at prefecture-level city level from multiple perspectives, the focus of COVID-19 prevention and control is to reduce its spatio-temporal autocorrelation effects, this study provides a decision-making reference for government's current and future response to major public infectious epidemics.
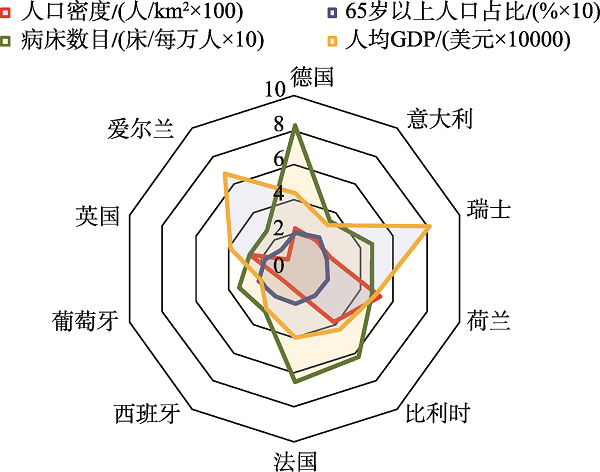
Public health emergencies can seriously affect public health and people's lives, and risk assessment and prediction provide a scientific basis for effective prevention and control of public health emergencies. This work proposes a new method for risk dynamic assessment and prediction of public health emergencies based on a revised SEIR model. This work combines transmission rules of public health emergencies with demographic, medical, and economic conditions and establishes rational and comprehensive indices of risk assessment by coupling hazard evaluation and vulnerability estimation. An integrated model of entropy-AHP is employed to implement risk dynamic assessments of public health emergencies. Moreover, this work establishes a modified SEIR model and combines infectious disease transmission dynamics and risk assessment to predict evolutional trends and dynamic risks. The COVID-19 epidemic at the end of December 2019 was an important public health emergency characterized by rapid spread, widespread infection, and great difficulty in prevention and control. The COVID-19 epidemic in 10 European countries is employed as a case study for risk assessment and dynamic prediction. Based on the epidemic data from the beginning to April 16, 2020, the epidemic evolutionary trends and dynamic risks are predicted in these countries from April 17, 2020 to May 10, 2020. According to the prediction results, the epidemic situation in 10 European countries will be severe by May 10, 2020. The goodness of fit R2 is larger than 0.92, and the prediction results are basically consistent with the real epidemic situation. Work resumption will be unfavorable for epidemic prevention and control in this case. The method proposed in this work may offer continuous epidemic risk assessments and predictions for countries and regions with serious outbreaks, support effective decisions for disease prevention and control, and also provide emergency risk evaluations and predictions in new epidemic outbreak periods and for other public security emergencies in the future.
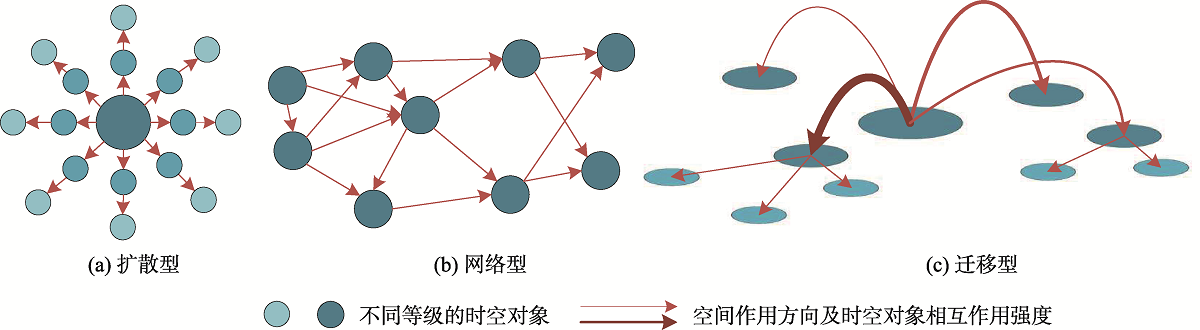
Coronavirus Disease 2019 (COVID-19) is still spreading all over the world. According to the early diffusion characteristics of covid-19 in China, From the perspective of geography, an epidemic risk assessment model considering spatial interaction of spatial-temporal objects was constructed. which realizes the correlation and dynamic analysis of the inter city transmission of epidemic risk on the basis of referring to the transfer mode of spatial interaction of spatial-temporal objects, and took into account the spatial-temporal process, spatial dependence and spatial heterogeneity. In the stage of empirical research, the epidemic risk and its dynamic evolution in Wuhan and its surrounding cities from early January 2020 to early April 2020 were evaluated based on this model. Compared with the real-time epidemic risk index and its spatial distribution calculated based on the urban object's own attributes, the effectiveness of the spatial interaction model based on spatial-temporal objects in epidemic risk assessment was verified. The results show that: on the one hand, The model took into account the spatial dependence and heterogeneity of epidemic transmission, and reflected the transmission process between cities of epidemic risk. It provides a new perspective and method for the study of epidemic risk assessment and related spatial problems. On the other hand, there is a significant positive correlation between the input epidemic risk from source objects and the spatial interaction intensity between objects. Therefore, comprehensive decision-making should be made in combination with the main influencing factors of spatial interaction in epidemic prevention and control.
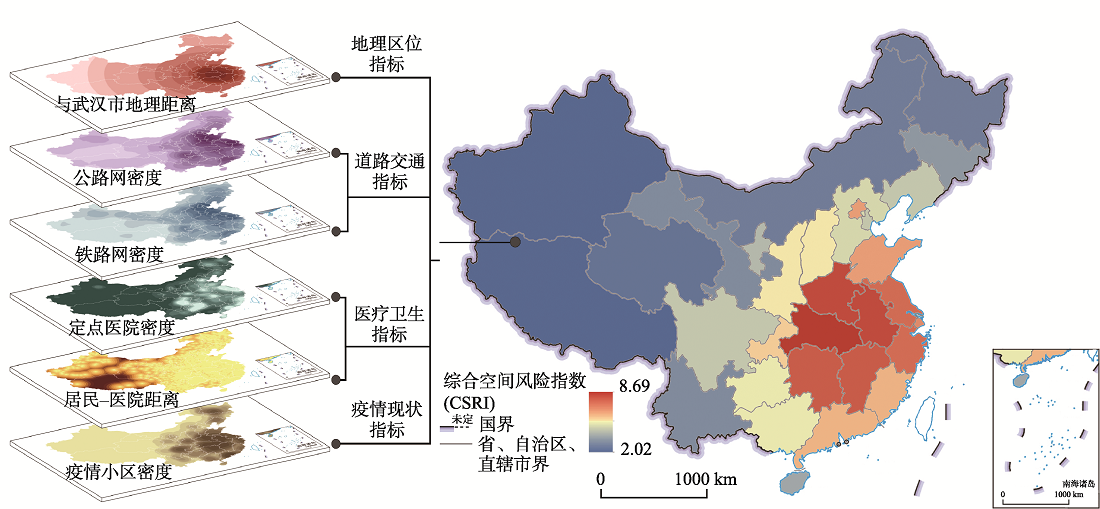
COVID-19 has a spatial transmission risk and poses a threat to the safety and health of the city. Preventing the spread of COVID-19 is therefore the urgent need for society now. The COVID-19 experienced a process that occurred, developed rapidly and stabilized from January 1 to April 11, 2020. Using the initial COVID-19 data for macro-level epidemic risk assessment can provide a certain reference for epidemic prevention and control measures. In this study, by using multiple data, including administrative division data, designated hospital data, epidemic community data, and road traffic data, we proposed a macro-level geospatial risk assessment and validated its effectiveness in China. Based on this, this study also analyzed the construction factors of geospatial risk assessment in order to explore its distribution rules. The following four conclusions showed that: ① Geospatial risk assessment of Covid-19 in China is effective to some extent. ② The spatial distribution of global Moran's I index of geospatial risk in China was 0.758, which had significant spatial agglomeration characteristics. At the same time, the LISA index in different provinces showed spatial differences. Some regions, including Hubei, Henan, Hunan, Jiangxi, Anhui, Zhejiang, Jiangsu, and Shanghai, were identified as high-high clusters and accounted for 25.81% of the provinces in China. The geospatial risk of these provinces was higher. Regions like Qinghai, Tibet, and Xinjiang, with a low degree of geospatial risk, accounted for 9.68% of the provinces in the country. ③ Some indicators, including geographic location indicators, road traffic indicators, medical and health indicators, and epidemic status indicators, were related to the distribution of geospatial risk. According to the statistical Pearson correlation analysis, there were differences in the correlation index R 2. In terms of numerical values, the epidemic status indicators, geographic location indicators, road traffic indicators, and medical and health indicators were ranked from highest to lowest. Different secondary factors were composed of four indicators, and they exhibited two effects of positive and negative correlation. Specifically, the factor of geographic distance from Wuhan, the designated hospital density factor, and the resident-hospital geographical distance factor showed significant negative correlations, with R 2 of 0.813, 0.545, and 0.436, respectively. However, the remaining factors showed significant positive correlations, including railway network density factor, road network density factor, and epidemic community density factor, and their R 2 were 0.751, 0.792, and 0.825, respectively. ④ The components of geospatial risk were intricate and complicated by multiple factors. According to the spatial stratified heterogeneity analysis, we found that there were interactions between different factors. Among them, the resident-hospital geographic distance factor interacted strongly with the railway network density factor and the road network density factor, and their q values were 0.9842 and 0.9837, respectively. This study not only explored the spatial resource allocation of major epidemics in urban management, but also provided a basis for regional spatial prevention and control strategies.
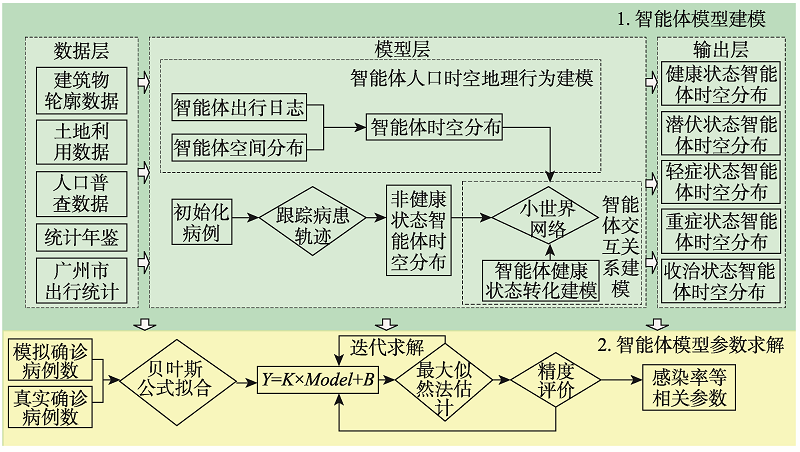
Since December 2019, a new type of coronavirus pneumonia has occurred in Wuhan, Hubei. The strong spread ability of the new coronavirus has led to the rapidly emergence of new coronaviruses throughout the country and even all over the world. In order to portray the spread line of the new coronavirus within the city and then provide reasonable suggestions for the prevention and control of the urban epidemic, this article constructs a new coronavirus intelligent simulation model by combining complex network theory and GIS technology based on the behavior and social relationships of individuals in the city. Considering to the facts that it is necessary to strictly prevent the import of overseas cases to prevent the local epidemic from rebounding in cities with complex composition of population. This agent model takes the first entry point for overseas entry, Guangzhou city, as the research object to review the development of the epidemic. The attributes and rules of the model was determined by collecting statistical data from the literatures. Then the parameters were fitted by the Markov chain Monte Carlo method to achieve an accurate review of the epidemic situation in Guangzhou. The model is of high accuracy whose MAPE value have achieved 0.17. Meanwhile, this model also has good applicability which can simulate the impact of imported cases from abroad on the development of urban epidemics. Since the agent model marks the individual's time and space location and social relationship, this paper proposes a method for epidemiological investigation through the agent model, which is more convenient and more efficient than traditional epidemiological investigations.This article also visually displays the results of the infection chain, which is convenient for analyzing the activity trajectory of virus carriers and close contacts. This model provides valuable decision-making information for urban epidemic prevention and control. Moreover, the simulation results show that if there is another epidemic outbreak in the city, the epidemic will be controlled within 14-20 days so the citizens don't need to be panic. However, it is still necessary to improve self-protection awareness and protect individuals finely, especially the children and the elderly. When the epidemic comes again, it is recommended that schools and enterprises should establish a joint health monitoring mechanism to strengthen the health monitoring of children and employees, respectively. Relevant governmental departments have to strengthened the spread of epidemic prevention knowledge and persuaded retired people to reduce gatherings and wear masks reasonably.
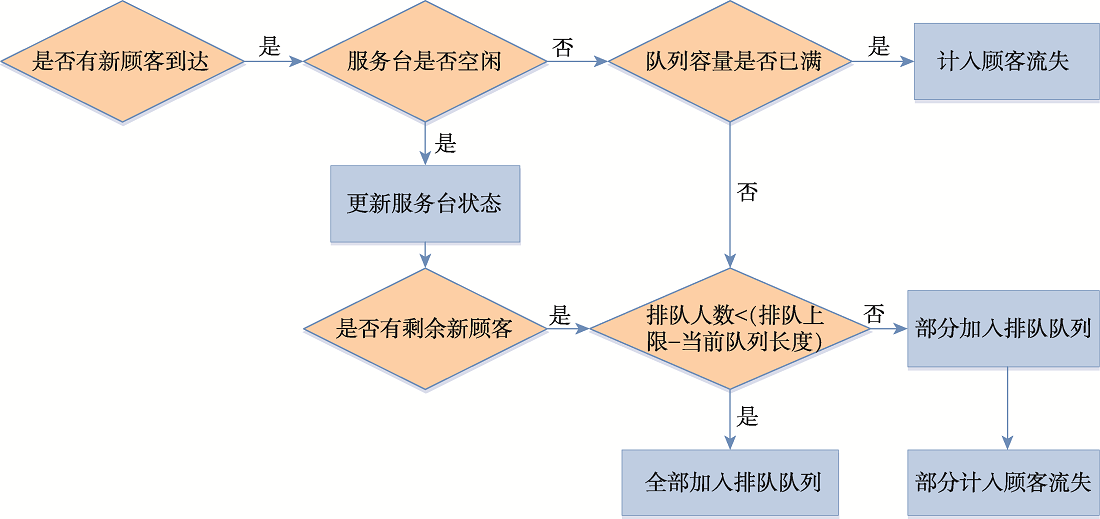
The spread of respiratory diseases among people is likely to cause large-scale public health events. During the epidemic prevention and control period, the risk of infection caused by the accumulation of drug purchase can be effectively controlled and reduced by restricting the time cycle of drug purchase. This paper focuses on the drug purchase needs of patients with chronic diseases at the early stage of closure and resumption of work in the epidemic prevention and control period and proposes an optimization method for the time cycle of drug purchase according to the scene in the drugstore. First of all, according to the principle of "no drug purchase across districts" during the epidemic prevention and control period in Wuhan, the possible service relationship between the drugstore and the community was constructed through a complex network model. Then, based on the order data of Shared bikes, the attenuation law of the drug flow along with the distance was extracted, and on this basis, the distribution mechanism of the drug flow in the community was established among the drugstores providing services for it, so as to determine the customer arrival rate at the pharmacy side and realize the coupling of the spatial distribution characteristics of the community and the pharmacy with the queuing theory model. Additionally, the discrete event simulation method was used to simulate the system state under different time cycles of drug purchase. Finally, based on the simulation results, the optimal time cycle was found by using dichotomy to maximize the consideration of patients' demands for drugs and the utilization rate of drugstores. In our study, we took Wuhan central city as an example. First, the number of patients with various chronic diseases was estimated through conditional probability, and then the optimal drug purchase cycle was obtained by using the above method for 28 days. Under the optimal time cycle, the patient's average waiting time was 8.55 min, close to the optimal duration of waiting, and the vast majority of purchasing medicine needs can be met. Also, drugstores can be fully used (More than 87% of drugstores were busy), and the daily stock quantity of drugstores was not more than 100 (bottle or box), which was within the drugstore's capacity. The methods and conclusions of this paper can be used to guide the purchasing decisions of patients with chronic diseases and the preparation of chronic diseases in drugstores.
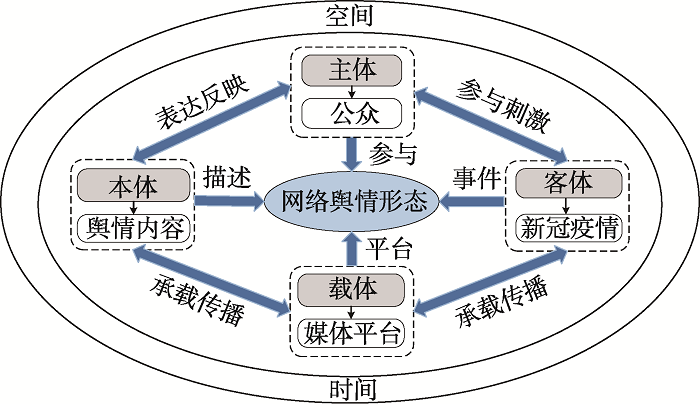
At the beginning of 2020, COVID-19 epidemic swept across China, and the development of COVID-19 attracted extensive attention from all sectors of society. Social media platform is an important carrier of online public opinion. In the process of epidemic prevention and control, it is very important to analyze the characteristics of network public opinion comprehensively and accurately. Firstly, from the perspective of spatiotemporal correlation between public opinion ontology and object, we construct a multi-dimensional analysis model of network public opinion during the epidemic period. We obtained the network public opinion data related to the covid-19 epidemic in multiple media platforms from January 17 to March 17, 2020. Secondly, from the perspective of epidemic spread, the spatial and temporal evolution and semantic characteristics of network public opinion in Wuhan, Hubei and the national scale are explored by comparative study and Spearman correlation coefficient. Finally, we use HowNet sentiment dictionary and emotional vocabulary ontology to analyze public opinion sentiment, and use interactive information chart to visualize the above results. The results show that: (1) The characteristics of time changes of public opinions are basically the same in Wuhan, Hubei province and China. There is a positive correlation between the number of daily public opinions and the number of new cases per day. With the rapid spread of the epidemic, the number of daily public opinions continues to increase. As the epidemic is gradually brought under control, the number of daily public opinions has shown a tortuous downward trend. (2) There is a positive correlation between the spatial distribution of public opinion data and the distribution of epidemic situation. The spatial distribution of the number of public opinions is similar to the distribution of the epidemic situation, and the areas with a large number of public opinions are mostly areas with severe epidemics. Changes in public opinions are spatially related to the development of the epidemic. (3) During the epidemic, the neutral sentiment of online public opinions was the most. Compared with forums, WeChat and Weibo, news platforms have a more positive overall sentiment. (4) At different stages of the development of the epidemic, the emotional characteristics of Weibo hot search data are quite different. The mood changed from anxiety in the early stage of the epidemic to excitement in the mid-term. And as the epidemic is gradually brought under control, emotions have also stabilized. Generally speaking, there are more positive emotions than negative emotions. Research shows that the multi-dimensional analysis model proposed in this article can visually show the public opinions situation, public opinions focus, and emotional changes at multiple scales during the epidemic.
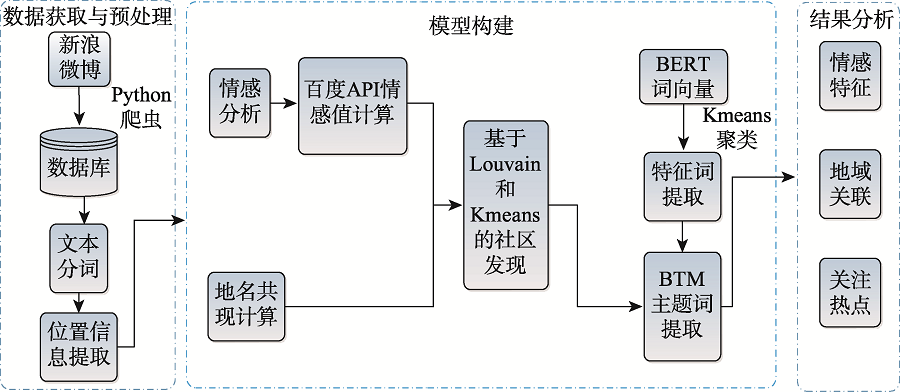
Since December 2019, COVID-19 has rapidly swept the world. As of May 10, 2020, 16:40 PM, Beijing time, the global confirmed COVID-19 cases reached 4,115,662, which has become a major global issue. Social media platforms such as microblog have become the important channel for information transmission and an effective sensor of public sentiment. In-depth mining and analysis of microblog information can not only characterize the public opinion, but also help the government to conduct targeted guidance on public sentiment and properly control public opinion. Therefore, this study collected more than 330,000 Sina Weibo data about COVID-19 from January 18, 2020 to January 28, 2020. Based on the spatial clustering method using Louvain and K-means and an improved BTM subject word extraction algorithm, users' attention information and emotional characteristics are labeled with their locations. Thus, the evaluation method of public opinion is constructed by integrating user's location information, which is able to analyze the characteristics of public opinion and the difference in the topics concerned at different regions. Our results show that the characteristics of public opinion in different regions can be comprehensively evaluated using the spatial clustering method based on Louwain and K-mean. The BTM subject word extraction method based on BERT word vector can effectively make up the disadvantages of traditional subject word extraction methods that need large computation and have data redundancy, and thus has stronger expression ability in user data mining. The hot topics concerned in different regions have certain differences. The public opinion analysis method proposed in this paper can effectively reflect the public opinion characteristics of different regions and provide reference for the public opinion analysis of major public health events.
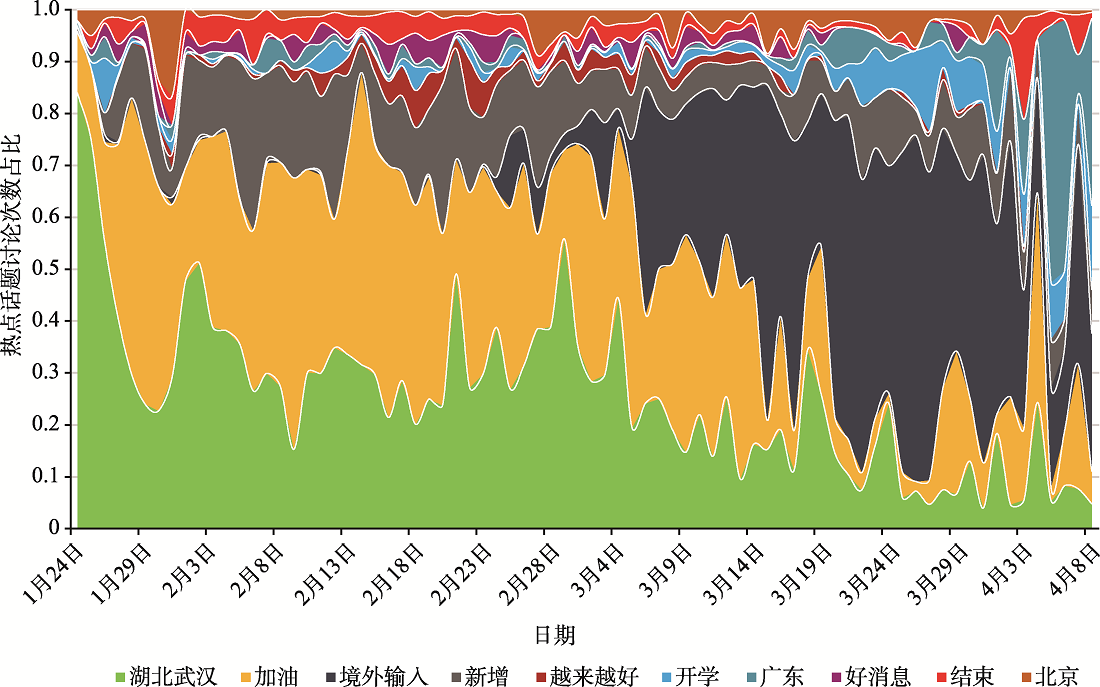
As a Public Health Emergency of International Concern (PHEIC), the COVID-19 pandemic caused great concern in social media all over the world. The content of Weibo comments is a collection of users' perceptions, attitudes, tendencies, and behaviors of the pandemic, and provides a high-timeliness and high-sequence text corpus for public opinion evolution research based on sentiment analysis. In this paper, we used a corpus obtained from People's Daily on Weibo during COVID-19 pandemic (January 23 - April 8, 2020) as our research data. First, we extracted emotional tendencies to classify text comments into positive and negative sentiments with SnowNLP, a Chinese natural language processing tool. Second, based on the Single-Pass clustering algorithm, we implemented text cluster analysis to explore hot topics about the pandemic situation. Moreover, we realized the information mining about public attention by using the Louvain community analysis algorithm. (1) On temporal dimension, the result of daily emotional trend analysis shows that the public has experienced three emotional phases, which are a period presenting anxiety and fear (January 23 - February 18), a period presenting steadiness and confidence (February 19 - March 15) and a period presenting tension and concern (March 16 - April 8). (2) On a spatial dimension, joint analysis of the number of users, the emotional states, and emotional projections among different provinces shows obvious differences in the public attention and emotional value of the COVID-19 pandemic. Additionally, for those Weibo users in COVID-19 affected areas, the level of their online participation is positively correlated with the pandemic severity and the value of the emotional state and emotional projection is lower. Meanwhile, those in worst-hit areas tend to have a higher impact on the evolution of public opinion. The results show that Weibo users in Guangdong Province and Heilongjiang Province have high levels of attention and low averages of emotional state and emotional projection. It can be judged the two provinces are still facing great pressure for pandemic prevention and control. Although Hubei Province is most affected by the pandemic, with a low emotional state value but a high emotional projection value, it is speculated Weibo users' comments on Hubei Province are more encouraging and praised. In addition, the number of confirmed cases in the northwestern region is relatively small, and the number of comment participation is less than in other regions, but the averages of emotional state and emotional projection are higher. The research applies natural language processing and network community detection algorithms to construct a methodological framework of public opinion analysis for social media comments. The developed framework has promising potentials, as it provides theoretical and practical support for related research on major public events.
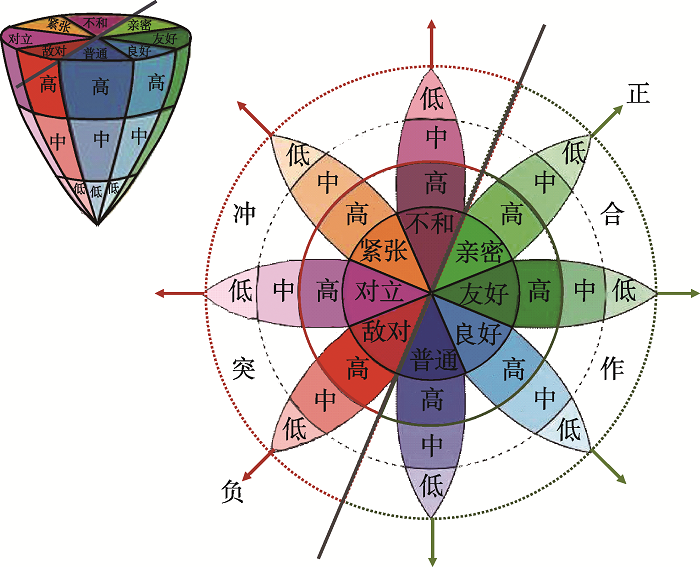
The outbreak of the COVID-19 event has been a major international concern since the first case was discovered in December 2019. After mid-to-late February 2020, the daily number of newly diagnosed cases abroad has increased rapidly, showing the characteristics of a pandemic disease. Under the deep impact of the COVID-19 event, the international relations are intricate and ever-changing. The instability and uncertainty of international relations have increased dramatically and have brought profound changes to the economy, security, and diplomacy. A comprehensive and timely analysis of "Global-China" international relations and its changing characteristics has important reference value for China's diplomatic development planning. Complex international relations can be split up into a series of event units. News data contains key information such as time, location, people, things, etc. It is the most direct and comprehensive source of information for constructing events. The GDELT ( Global Database of Events, Language, and Tone ) is a free and open news database which monitors news from print, broadcast, and online media in the world then analyzes the texts and extracts the key information such as people, location, organization, and event. From the perspective of "Global-China", this paper takes GDELT as the data source and uses global news data about the COVID-19 event from January to May 2020 to analyze the changes in international relations. First of all, the characteristics of international relations, such as intensity, similarity and polarity, are consistent with emotions. According to Plutchik's wheel of emotions, this paper provides a representation and calculation model of international relations to solve the problem of ambiguity in representation and the difficulty in calculation, using key variables including the number of events, the intensity of events, and the number of mentioned events. Then, the features of the changes in international relations are obviously displayed from the perspective of spatio-temporal visualization. Finally, this paper analyzes the causes of changes in international relations by important international events during the COVID-19 event. The results show that the analysis method can accurately reveal the development degree of the "Global-China" international relations during the COVID-19 event and find out the rules and causes of changes and has important application value. This paper can provide a new perspective for the exploration of international relations and a reference for the analysis of news data in the era of big data. And it shows the great potential and broad prospect of the research on international relations of big data.