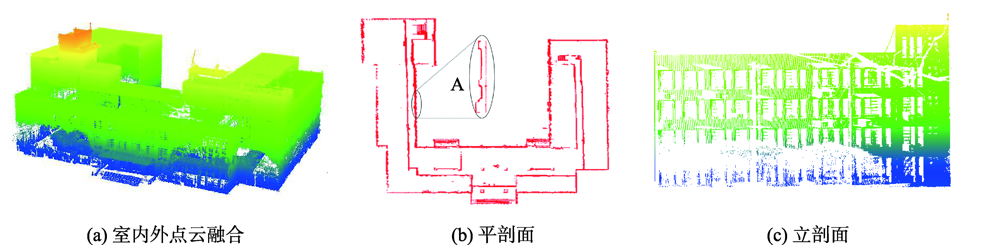
The wall, window, and other unit components are important parts of the building. It is of great significance to extract their geometric parameters and location information to express the overall model of the building. In view of the fact that a single point cloud data source cannot obtain the geometric parameters and location information of building unit components, but can fully and effectively express the problem of indoor and outdoor model reconstruction, this paper proposes a set of BIM model reconstruction technology that integrates indoor and outdoor multi-source point cloud data. In order to verify the effectiveness of this method, the teaching building of the School of Surveying and Land Information Engineering of Henan Polytechnic University was selected as the experimental area, and the data collection time of indoor and outdoor was May 2019. On the basis of preprocessing the airborne, vehicle-borne, and terrestrial laser scanner point cloud data in the experimental area, the conjugate feature points of each point set were selected respectively, and the high-precision terrestrial laser scanner point cloud was taken as the reference to fuse airborne and vehicle-borne point clouds with terrestrial laser scanner point cloud, so as to realize coordinate transformation and reduce the fusion accuracy by iteration. In order to improve the accuracy and processing efficiency of model reconstruction in the later stage, redundant data in overlapping areas were eliminated by means of minimum space distance between point clouds. The overall plane and elevation of the building were dissected, the profile was tracked in CAD to draw two-dimensional line drawings, the two-dimensional line drawings were imported into Revit software to draw axis network and elevation, and the extracted wall geometric parameters were used to edit wall family types for BIM model reconstruction. As for the facade window units, according to the extracted geometric parameters, the types were counted and the window family was edited, and they were classified into regular and irregular. Regular window units were found out by the repeatability law and position control parameters of each type, and irregular window units were placed one by one. The two were combined to optimize the BIM model. In order to verify the accuracy of model reconstruction, the representative facade of the building was selected. Taking the artificial measured facade side length as a reference, the corresponding facade side length and the model side length extracted from the point cloud data were compared and analyzed. The errors were concentrated between 0.0 and 0.2 m, with more than 0.2 m errors, but most of them were below 0.3 m. Experimental results show that the method is accurate.
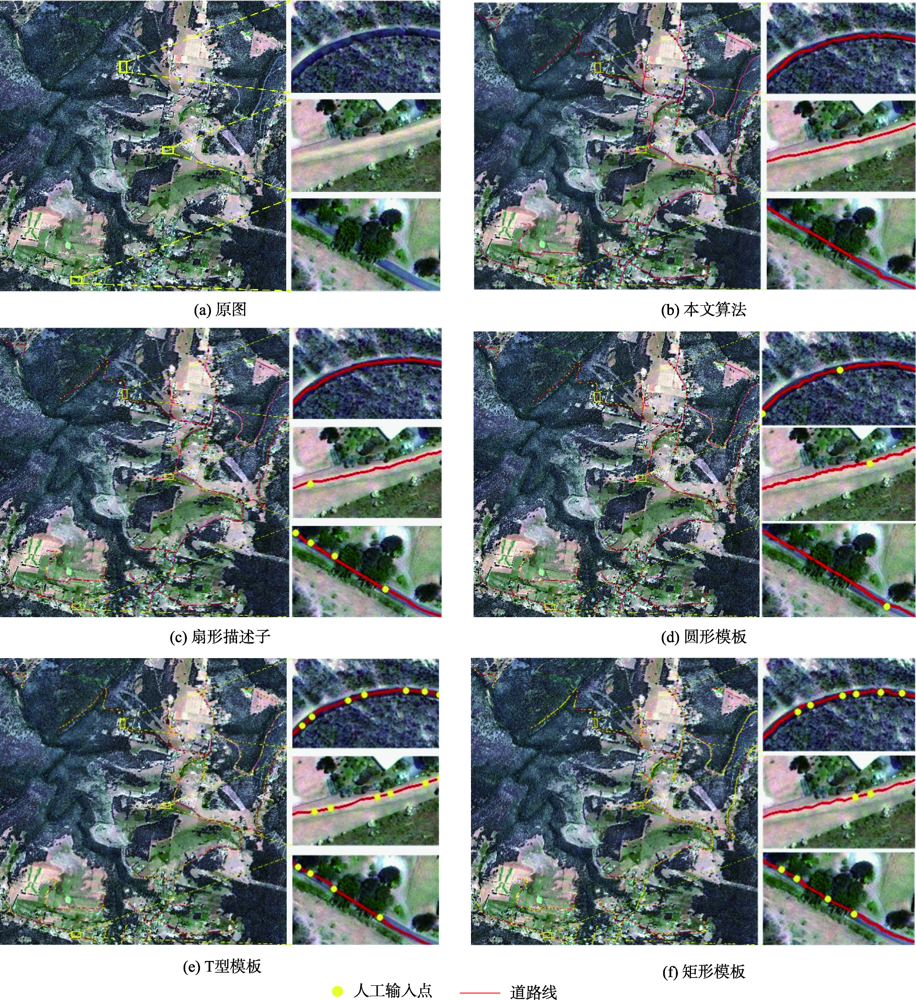
The agricultural machinery field work has developed rapidly. There is an urgent need for more accurate Mechanically Cultivated Road (MCR) network data in agricultural production scheduling. Thus, it is necessary to obtain accurate and effective rural MCR information. However, compared with other types of roads, the narrow pavement width and the small difference between pavement material and farmland are the typical characteristics of rural MCR, which are the main factors leading to the low degree of automation in existing template matching methods. In order to solve the problems mentioned above and improve the accuracy of the MCR extraction, the solutions are proposed as follows: Firstly, by improving the Multi-Scale Line Segment Orientation Histogram (MLSOH) model, we can not only predict the local road direction of MCR, but also reduce the probability of wrong prediction of road direction due to the interference of ridges. Secondly, the line segments of the image are extracted, which can clearly characterize the linear characteristics of MCR. The length of line segments in the local area is taken as the main factor of the dynamic weight distribution. The dynamic weight distribution is carried out for different road prediction directions, so as to solve the problem of the decrease in matching accuracy due to the narrow width of the MCR. Finally, the similarity analysis model of HSL color space is combined with the dynamic weight factor to form the HSL dynamic matching model to improve the contrast between the MCR and the farmland, so as to increase the accuracy of the MCR extraction. In this paper, in order to verify the effectiveness of the proposed algorithm, three high-resolution remote sensing images of different regions and data types are acquired. Two GF-2 images, with a spatial resolution of 0.8 m, covered areas in Tongliao City, Inner Mongolia, and areas in Enshi City, Hubei Province, respectively. One Geo-Eye image, with a spatial resolution of 0.5 m, covered the town of Hobart, Australia. Through qualitative and quantitative analysis of the proposed and comparison algorithms, the conclusions are as follows: the road extraction integrity, accuracy, and quality of the proposed algorithm are all above 95 %. The proposed algorithm has the advantage of high automation while ensuring the extraction accuracy of MCR. It can also be extended to other rural roads.
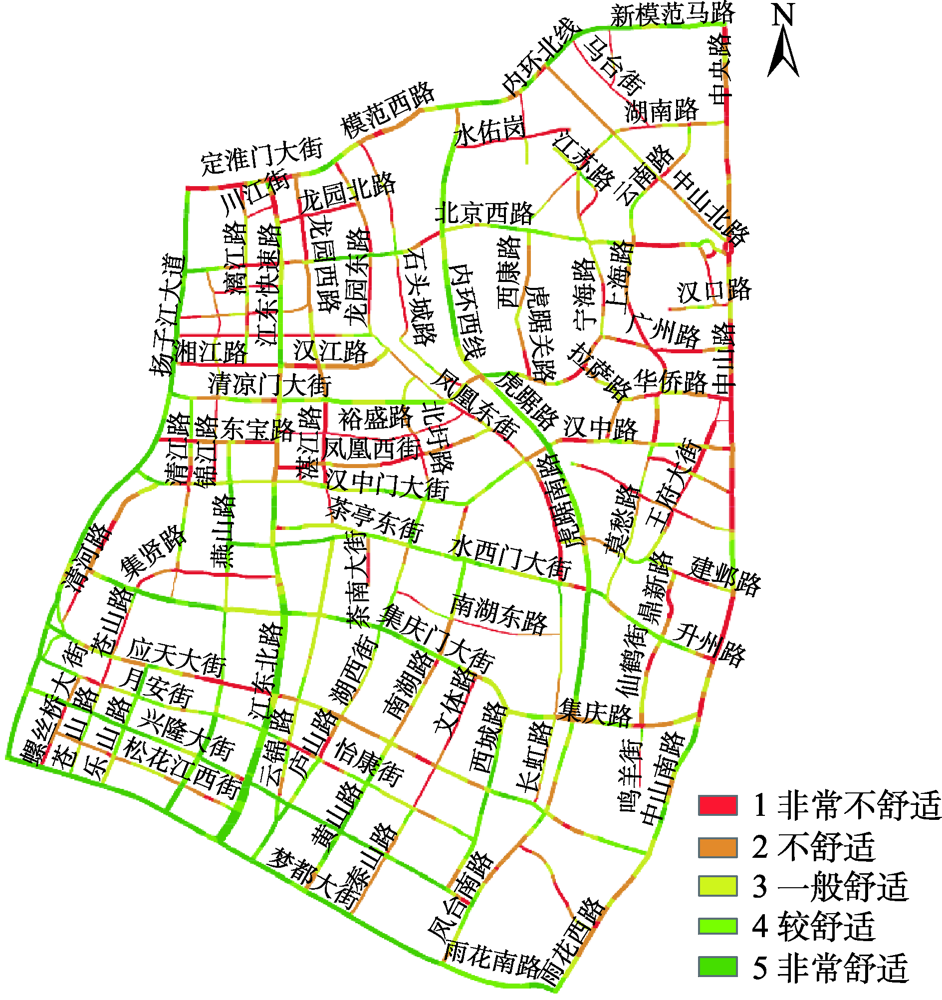
Urban road spatial comfort is an useful indicator to comprehensively quantify urban road environment, which plays an important role in urban-related researches such as construction planning, environment assessment, and traffic optimization. Based on the data of street view images, firstly, the concept of urban road spatial comfort is defined from the perspective of space vision. To represent the concept accurately, five quantitative indexes including road unobstructed degree, road spaciousness, greening degree of vegetation, proportion of sky view, and space openness, and a model to quantify urban road spatial comfort are constructed. Secondly, the urban road spatial comfort measurement method is established. To establish the model, an approach that comprehensively combines the semantic segmentation of street view images, weight assignment based on entropy weight, and analytic hierarchy process and dual-constrained interpolation is designed. Finally, we take the local urban area of Nanjing as the experimental area to assess the performance of the proposed approach. The results show that (1) The segmentation accuracy of the main elements meets the requirements, with an overall segmentation accuracy of 84.92% and a Kappa coefficient of 80.06%; (2) The 200-m sampling distance can comprehensively reflect the road spatial comfort degree in the study area considering the processing time and the quantitative expression; (3) The dual-constrained interpolation method proposed in this paper can eliminate the abnormal interpolation phenomena such as abrupt point, trapezoid shape, and disordered texture, and effectively maintain the directional characteristics of road spatial comfort; (4) The method proposed in this paper can effectively measure the urban road spatial comfort with an accuracy above 80%; (5) There is a positive correlation between the spatial comfort degree and the road grade, that is to say, the higher the road grade, the higher proportion of high-degree spatial comfort in roads. The spatial comfort of urban roads in the experimental area is higher in the south and lower in the north and is higher in Jianye district and lower in Gulou and historical old urban area.
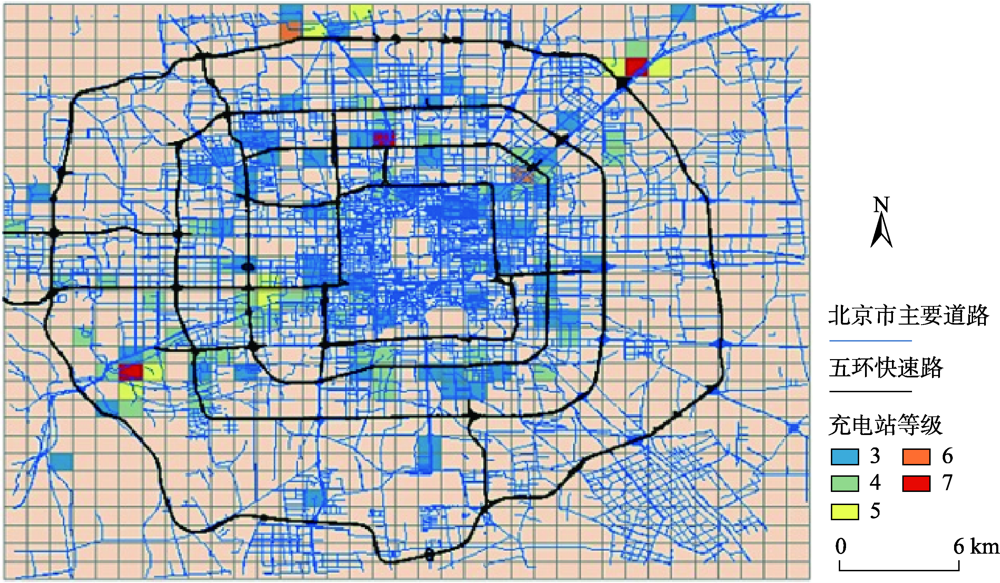
With the increasing shortage of energy and occurrence of various environmental pollution problems in recent years, low-emission, low-noise, energy-saving, and environmentally friendly electric vehicles have received more and more attention nowadays. In the field of electric taxis in China, the planning and construction of public charging facilities are imminent. At present, there are still deficiencies in the research on site selection of electric taxi charging stations, such as the lack of rich and detailed trip data, insufficient analysis based on trip characteristics and operation state of taxis, and insufficient consideration of the impact of existing charging stations. Thus, this paper proposes a reasonable and feasible site selection framework for taxi charging stations. Based on the statistical analysis of GPS data of taxis, the Monte Carlo method is used to derive charging demand. The influencing factors of charging station construction including the construction cost, charging time, and the impact of established charging stations are analyzed to establish the site selection model of charging stations. And this model is further solved using Multi-Population Genetic Algorithm (MPGA). We obtained the trajectory data of 12 000 taxis in Beijing in one week to derive the charging demand. The site selection model was further established based on the charging demand of 100000 electric taxis. Our results show that the site selection model was feasible, which can effectively reduce the cost of charging station construction and shorten the average wait time of taxi charging.
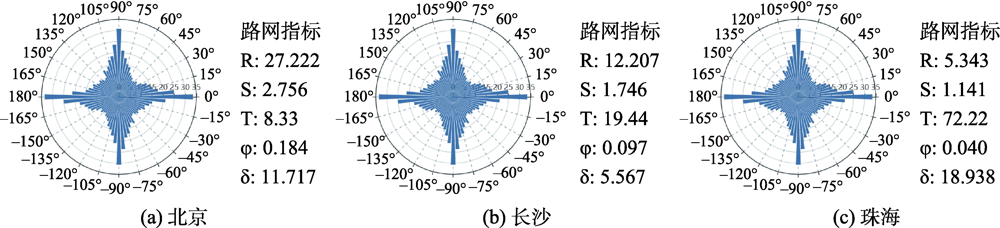
The rapid development of urbanization has promoted China's urban road network's continuous expansion and growth. The urban road network is a dynamic, open, and self-organized spatial complex network, which constitutes a city's structural framework. The study on urban road networks' structural characteristics can provide a significant application value for road network planning and urban construction. In the related studies of the structural characteristics of urban road networks, few scholars have paid attention to the whole urban road network structure from the perspective of road alignment in China. Besides, recent studies lack an overall evaluation on the road network of major cities in China. In this paper, 49 cities, including the first- and second-tier and first-tier new cities in China, are selected as study areas and the urban road network data in February 2020 are taken as experimental data. Firstly, we use the graph theory and rose diagrams to visualize the road network's directional characteristics in 49 cities. The complex structure of the urban road network is qualitatively analyzed. Then, we select five road network indicators including the maximum ratio R, the road primacy degree S, the ratio over threshold T, the orientation-order φ, and the road network density δ. Based on the five indicators, cluster analysis is carried out for the road networks of 49 cities in this paper. And the characteristics of the spatial distribution of urban road network in China are explored. The results show that the north-south and east-west roads are the main alignment of urban roads in China. Because of the influence of terrain, some cities plan routes along the direction, which is favorable to traffic and resident's living. Based on the clustering of road network indicators, four types of the urban road network are obtained, including cross orthogonal type, cross to windmill type, windmill to arc type, and mixed complex type. There are significant differences among four types of the urban road network in directional characteristics highlighted in complexity and order. In view of the spatial distribution of road network types, road networks of cross orthogonal type and cross to windmill type are mainly distributed in China's inland areas. In contrast, road networks of the windmill to arc type and mixed complex type are mainly distributed in coastal areas. This paper explores the current traffic layout in major cities in China by analyzing the characteristics of road network's distribution in the first- and second-tier and first-tier new cities in China. This study can provide a reference for road planning and optimization of road network layout in new urban districts.
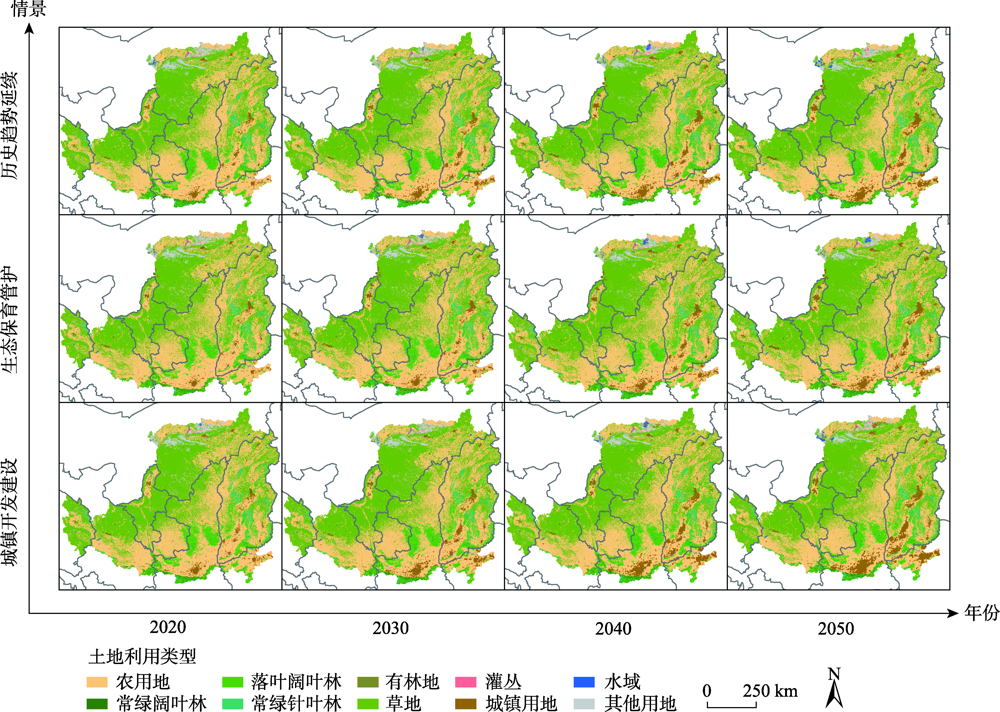
Simulating the spatiotemporal land use and land cover dynamic can provide a scientific support for regional ecological environment restoration and integrated ecosystem management. In this study, an improved Logistic-Markov-FLUS model was used to simulate land-use changes (2020—2050) under multi-scenarios in the Loess Plateau. Results show that the changes of land use area and spatial displacement were mainly concentrated in agricultural land, grassland, and urban land. In the historical trend scenario, a decreasing trend was observed in cropland with a decreased area of 15 205 km2, while an increasing trend was found in the grassland and urban land with an increased area of 2742 km2 and 16 007 km2, respectively. In the ecological conservation management scenario, the policy for vegetation protection had a significant effect on the increase of grassland (7076 km2), showing a significant trade-off ($r_{main forestland-grassland}=-0.66$) between grassland and forest growth due to the coexistence of land transformation. Ecological protection and construction should fully consider this ecological trade-off in specific regions. The reduction of cropland (20,256 km2) and urban land (22 032 km2) in the urban development and construction scenario was the largest. There was a strong trade-off ($r_{agricultural-urban}=-1$) between the expansion of urban land and the reduction of cropland in the southern regions. The improved Markov-FLUS model had better performance on multi-scale land use dynamic simulation in the Loess Plateau. The scenario-based method can also be used to explore the abrupt changes in ecological protection and urban expansion for better LUCC decision-making and trade-off management of ecosystems.
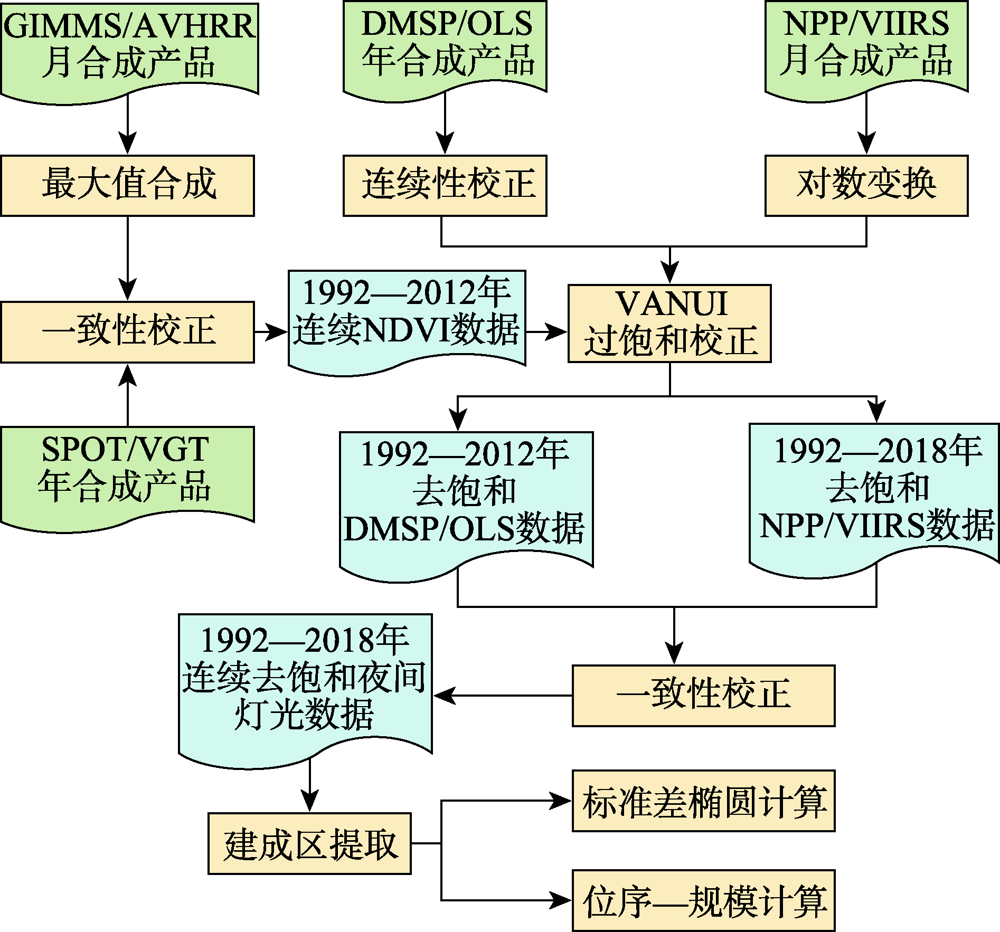
Accurately quantifying the spatiotemporal evolution of urban agglomerations is important for city management plan and urban agglomeration development strategy. In this study, the spatiotemporal evolution of the Yangtze River Delta (YRD) urban agglomeration was characterized based on the DMSP/OLS nighttime light (NTL) data from 1992 to 2012 and the NPP/VIIRS NTL data from 2012 to 2018. Considering that the discrepancy between the NTL data from different satellites or sensors and the oversaturation of DMSP/OLS NTL data in urban areas limit the applications of integrating NPP/VIIRS and DMSP/OLS NTL data in monitoring the urban expansion dynamics, discrepancy correction and saturation correction were conducted to produce a temporally consistent NTL dataset combining the two NTL datasets during 1992—2018. Using the city-level built-up data obtained from the statistical yearbook as the reference, the optimal threshold values were determined by a dichotomy method to extract annual urban build-up areas in the YRD urban agglomeration from the long-term NTL dataset. Based on the extracted annual urban build-up areas, the expansion rate, centroid (center of gravity), directional distribution, and city-size distribution of the YRD urban agglomeration were analyzed using the standard deviation ellipsoid method and the Zipf coefficient. Our results show that: (1) The discrepancy correction and saturation correction procedures employed in this study effectively improved the continuity and comparability of multi-source NTL data with less reference data. We produced a temporally consistent nighttime light dataset during the period of 1982—2018; (2) The annual build-up areas in the YRD urban agglomeration extracted by the dichotomy method achieved a good accuracy, with a mean relative error of 8.10% and a mean absolute error of 6.85 km2; (3) The city centroid of the YRD urban agglomeration was located along the Taihu Lake in Suzhou city and showed a trend of slowly moving southeast from 1982 to 2018. The YRD urban agglomeration was distributed along northwest-southeast direction, and the direction gradually shifted to the north-south then. The oblateness of weighted standard deviation ellipse gradually decreased, indicating a decrease of the directional distribution of the YRD urban agglomeration over time. This trend also suggested that the development of cities in this urban agglomeration had become more balanced in past two decades; (4) The Zipf index of the YRD urban agglomeration was close to 1 and slowly decreased, suggesting a relatively balanced pattern of the city-size distribution of this urban agglomeration.
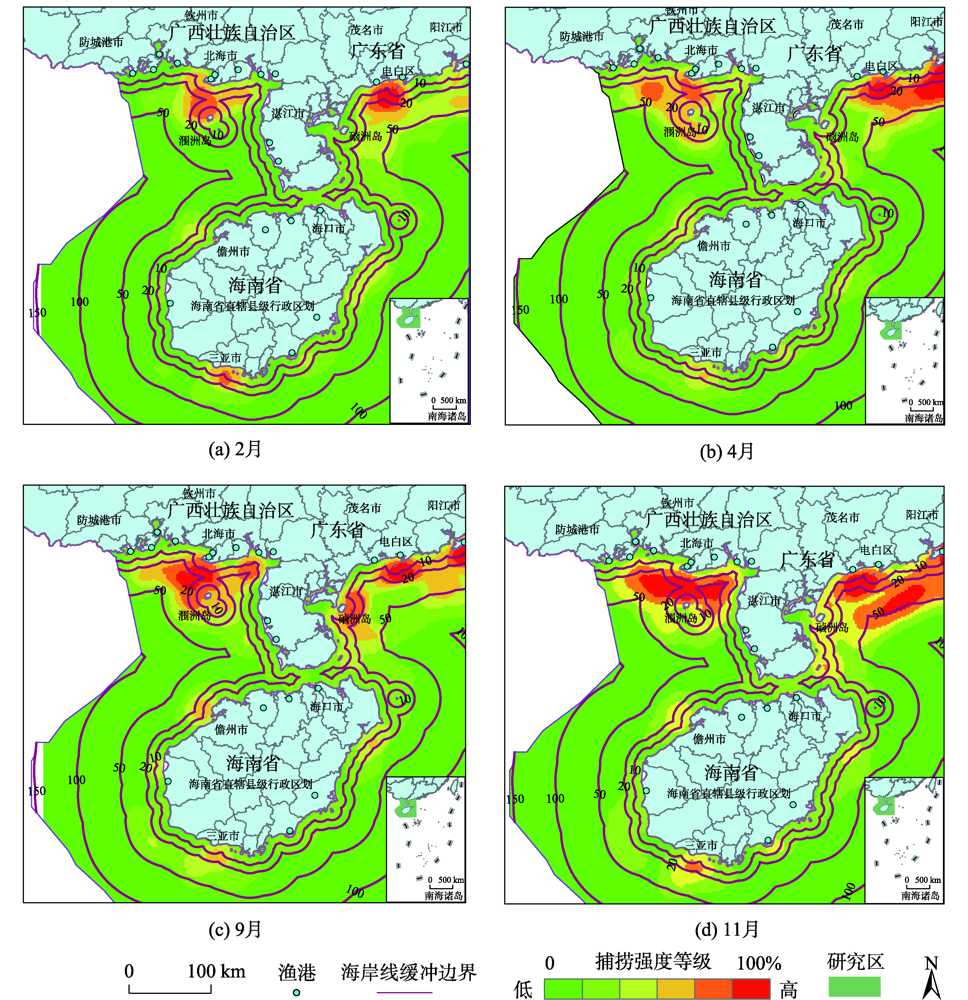
High-precision fishing intensity data in the fishery is the prerequisite and key to carrying out fishing quota management, as well as the significant guarantee for the sustainable development of marine fishery resources. Therefore, the paper selects 180 million records of high spatiotemporal multi-granularity data of 6364 fishing vessels with Chinese nationality in typical seasons including February, April, September, and November of 2018, aiming to mine the spatial characteristics of the fishing intensity in marine fishery. It leverages expert knowledge and experience and employs spatial statistics and data mining analysis methods to conduct a thorough mining and analysis of the spatial characteristics of the fishing intensity. We take Beibu Gulf fisheries on the coast of Guangxi, the coast of Guangdong, and the surrounding sea areas of the Hainan Island as the study areas. The results show that: (1) The high-intensity fishing in coastal waters of Guangdong and Guangxi (referred to as "Liang Guang") mainly presents the characteristics of "clumps" expanding outward and converging into "bands" or "larger clumps", while the surrounding area of Hainan island mainly presents the characteristics of "clumps"; (2) Influenced by fishery workers, the number of fishing vessels, marine fisheries, and marine environment, the fishing intensity in the coastal waters of "Liang Guang" is apparently higher than that of the surrounding waters of Hainan Island; (3) The high-intensity fishing area is mainly concentrated within 30~50 km near the shore, and the intensity of offshore fishing is higher than that of the far-sea area, which is attributed to the high proportion (up to 50.9%) of small and medium-sized fishing vessels in the study area; (4) Fishing activities are affected by the traditional Lunar New Year, the fishing moratorium, and other policy factors, thus the fishing intensity during the Spring Festival being the lowest in the selected data coverage time range. In addition, the fishing intensity after the fishing moratorium (September) is significantly higher than that before the fishing moratorium (April); (5) The large fishing ports near the coast of the study area have a certain radiation-driven effect on the high-intensity fishing in the coastal waters. This study can provide important data support for the analysis of the fishing intensity of offshore marine fisheries and contribute to the sustainable development of the marine fishery, by processing, analyzing, and deeply mining AIS data with high spatiotemporal multi-granularity.
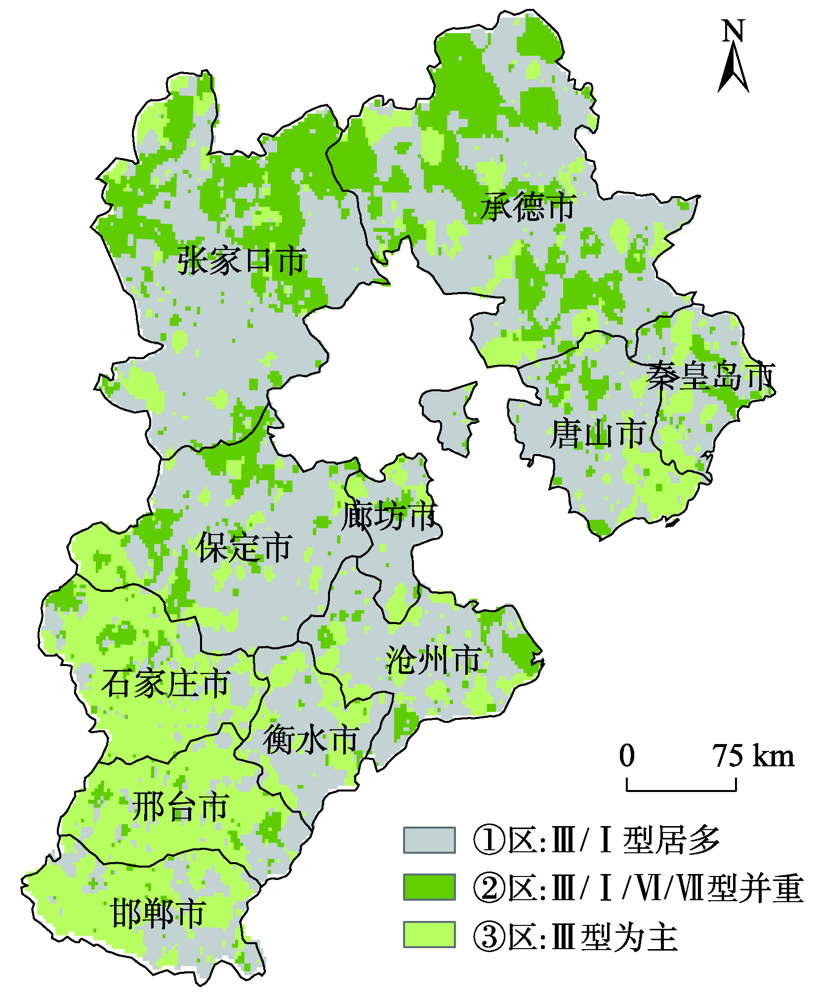
In-depth data mining of rainfall data and characterizing the rainfall events from meteorological records play an important role in formulation of flood disaster warning and mitigation measures. This paper analyzed a large number of hourly rainfall observations to quantify the rainfall pattern, cumulative rainfall, duration, and other indicators of rainfall events in Hebei province. First, we generated independent rainfall events based on the hourly precipitation data of 3189 stations in Hebei from 2005 to 2017. We counted the rainfall events for each station by calculating the time interval between rainfall events. Rainfall events with time interval less than 6h were counted as a single rainfall event. Otherwise, they were regarded as independent rainfall events. Then, we calculated the occurrence time, end time, duration, hourly accumulation, and total accumulation of each rainfall event. Finally, rainfall events were divided into seven types (I-Ⅶ), including three types of single-peak rainfall (i.e. single peak in the front, middle, and end), three types of double-peak rainfall, and uniform rainfall. The Dynamic Time Warping (DTW) algorithm was used for rainfall events classification. The results show that the rainfall in Hebei province was dominated by typeⅠ (single-peak rainfall in the front) and type Ⅲ (single-peak rainfall in the middle), which accounted for more than 70% of the total rainfall events with a significant spatial variation. The type Ⅳ (uniform rainfall) was the least with a proportion of less than 5%. The type Ⅱ (single-peak rainfall in the end) and three types of double-peak rainfall accounted for less than 25%. Through K-means clustering, the Hebei province was divided into 3 rain-type regions: district A, with type I and type Ⅲ rainfall mainly distributed in the Yanshan hilly climate region, the eastern Hebei plain climate region, and the piedmont plain climate region; district B, with type Ⅲ, type Ⅰ, type Ⅵ, and type Ⅶ rainfall scattered in the northern Hebei plateau climate zone and southern Chengde city; and district C, with type Ⅲ rainfall dominated in the southern part of Shijiazhuang City, Handan City, and most of Xingtai City. In this paper, the data mining method that combines DTW similarity algorithm and K-means clustering can be applied in future meteorological big data analysis.
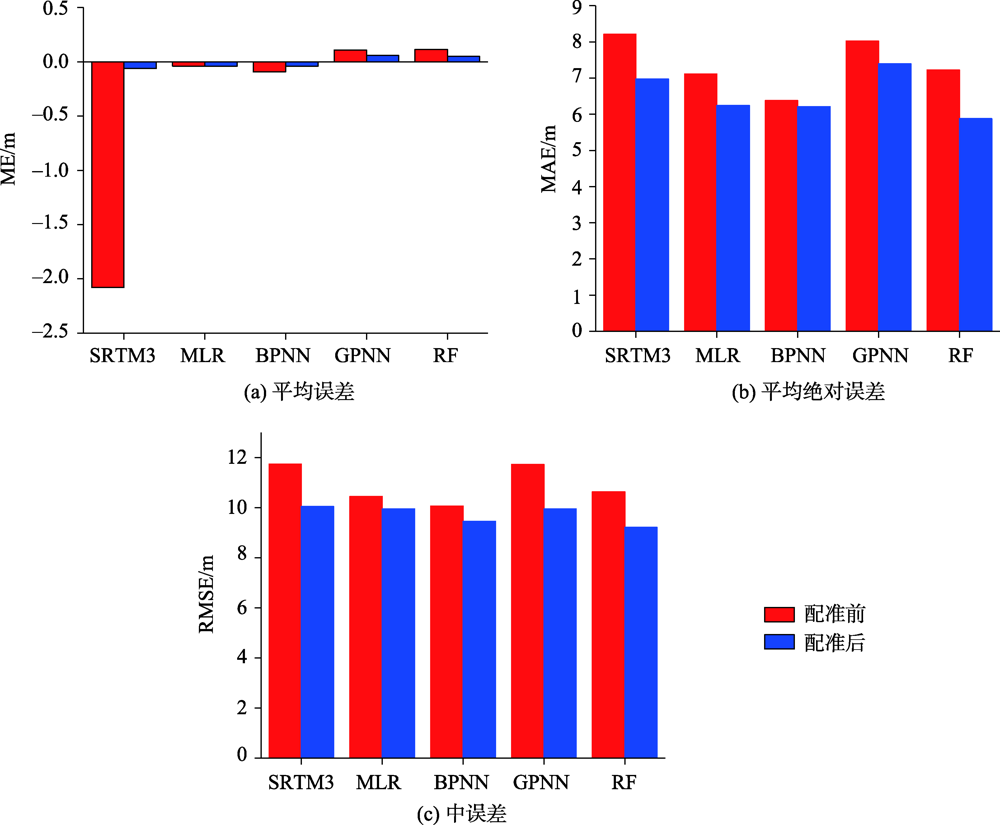
At present, ICESat/GLAS has become the main data source for large-scale SRTM DEM accuracy assessment. Nevertheless, almost all the existing methods neglected the effective coregistration of the two datasets. In order to evaluate the importance of data coregistration, this paper took Jiangxi Province as the research area and analyzed the overall accuracy of SRTM DEM before and after data coregistration. Results show that after data coregistration, the Mean Bias (ME) of SRTM DEM was eliminated significantly, and the DEM Root Mean Square (RMSE) was reduced by 14.4%. We further analyzed the effect of terrain factors (terrain slope, terrain aspects, terrain relief, elevation) and land use types on the accuracy of SRTM DEM. Specifically, this study area was divided into different sub-regions according to slope ranges (0~5°, 5~10°, 10~15°, 15~20°, >20°), aspect ranges (-1, 0~22.5°, 22.5~67.5°, 67.5~112.5°, 112.5~157.5°, 157.5~202.5°, 202.5~247.5°, 247.5~292.5°, 292.5~337.5°, 337.5~360°), relief ranges and elevation ranges (0~100 m, 100~200 m, 200~300 m, >400 m), and land use types (cultivated land, forest cover, grassland, water area, built-up area, unused land), respectively. Then, the ME and RMSE of each sub-region were computed and analyzed. We found that the terrain aspects with a sine-like shape were strongly related to SRTM DEM errors before data coregistration; however, this relationship basically disappeared after data coregistration. The SRTM DEM errors increased with the increase of terrain relief, slope, and elevation. Among the six land use types, SRTM DEM had different accuracy under different land use types. More specifically, SRTM DEM had the highest accuracy on unused land and the lowest accuracy on forest land. Finally, by incorporating terrain slope, aspect, terrain relief, elevation, land use, and ICESat/GLAS data randomly selected with the proportion of 90% into the revision models, the SRTM DEM was improved by use of Multiple Linear Regression (MLR), Back Propagation Neural Network (BPNN), Generalized Regression Neural Network (GRNN), and Random Forest (RF), respectively. Accuracy evaluation of corrected SRTM DEM by use of the remaining 10% ICESat/GLAS data demonstrated that the four correction models with data coregistration obviously outperform themselves without the coregistration. Among the four corrected models, RF produced the best result while GRNN produced the worst result. The RMSE of RF was about 3.1%, 2.7%, and 11.3% lower than those of MLR, BPNN, and GRNN, respectively. Therefore, RF was finally selected to enhance accuracy of SRTM DEM.
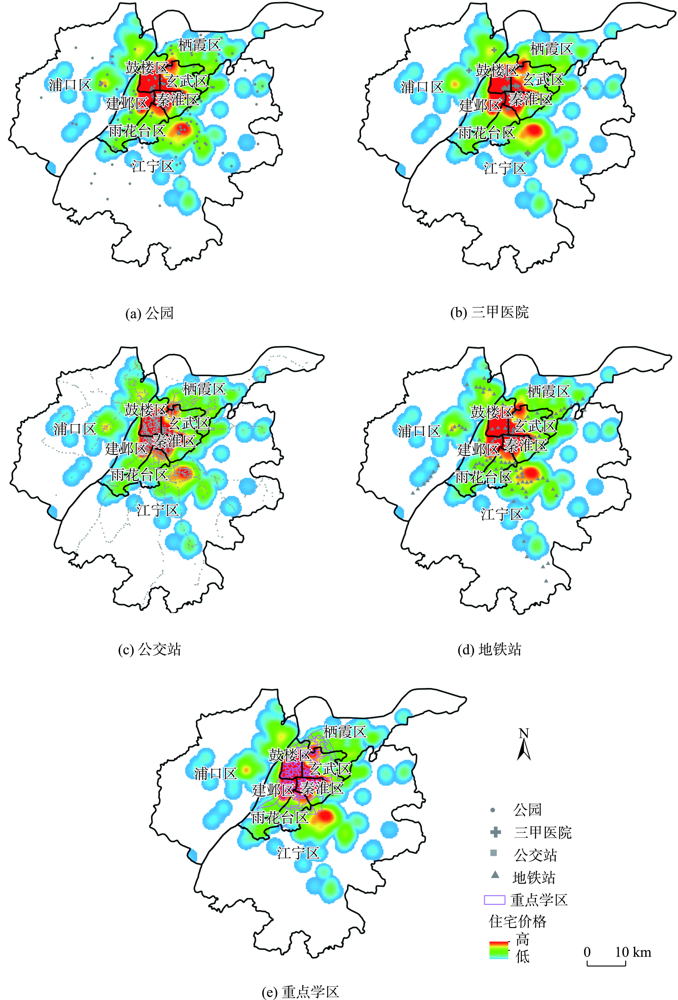
With the urbanization and the rapid growth of economy, the housing price of cities continues to rise and the spatial differentiation of housing price increases, which has attracted a widespread attention from the public and the government. Exploring the influencing factors of housing price is of great significance for understanding house-buying of the public and provides useful support for the government to formulate relevant policies. Until now, many researches have studied the influencing factors of housing price from a macro perspective and only a few studies are conducted from the micro perspective, which leads to inadequate understanding of the influencing factors of housing price. In addition, the method of establishing multiple regression equations is usually adopted to study the relationship between housing price and multiple influencing factors. However, the selection of influencing factors are usually subjective, which leads to an artificial regression that cannot characterize the influence of various factors accurately. To solve these problems, a hedonic price model combining both quantitative and qualitative methods is proposed from the micro perspective of structure characteristics, location characteristics, and neighborhood characteristics in this study. Moreover, a stepwise regression method is applied to modify this model by eliminating non-significant factors. To validate the proposed method, a case study in Nanjing city, Jiangsu is conducted, and 12 primary influencing factors are selected. The results show that the proposed method eliminates three insignificant influencing factors including secondary commercial centers, building types, and living facilities, and keeps the rest nine factors. Compared with traditional methods, this paper analyzes the influencing factors of housing price more quantitatively and provides a theoretical basis for house-buying of the public and policy making of the government. What's more, it is conducive to the real estate management department to have an in-depth understanding of the distribution of housing price, so as to strengthen the management of the real estate market.
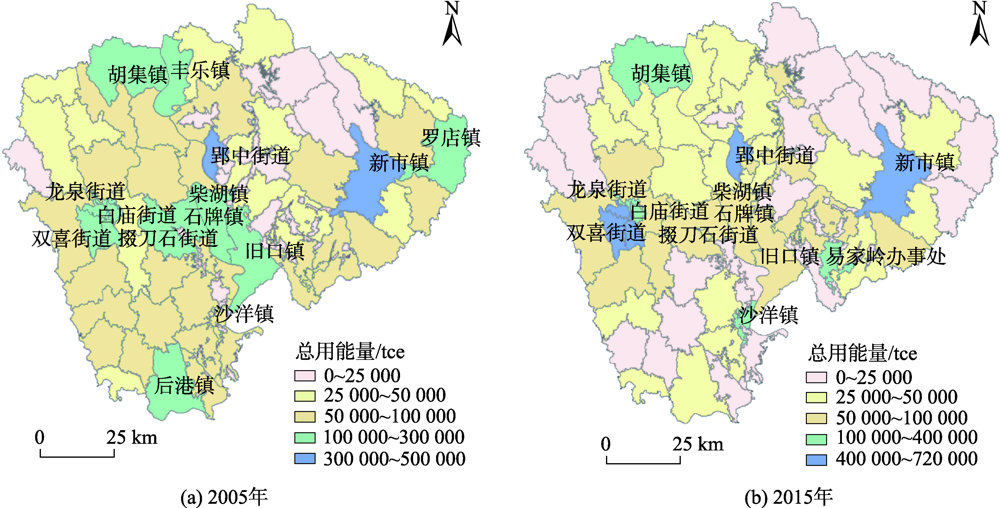
Climate change has become a major global environmental issue that is widely concerned by countries around the world. It has been a very clear scientific consensus that the global carbon emission has to be cut urgently under the context of the global warming and extreme climate. Currently, few studies on the urban energy consumption have been performed, especially the quantitative research on the scale of urban blocks, which is actually required by cities in order to adopt precise control, optimize energy structure, and reduce carbon emissions. This paper took Jingmen, a resource-based city, as a case city, and applied night-time remote sensing data, POI, and other big data. Quantitative analysis of the spatial data on key factors affecting carbon emissions in transportation, industry, and construction sectors, respectively, was applied to realize block-scale spatial visualization of urban energy consumption, and furthermore, to discuss the impact of urbanization and industrialization on urban energy consumption. It is found that the continuous growth of energy consumption in the industrial sector was the main driving factor of the city's total energy consumption growth. Among the 72 towns (blocks), 10 towns (blocks) were dominated by industrial energy consumption which accounted for up to 68% the energy consumption of Jingmen. From 2005 to 2015, the total energy consumption of Jingmen City increased by 828,200 tons of standard coal equivalent(tce), while the number of towns (blocks) with more than 10,000 tons of standard coal equivalent(tce) decreased by 4. Therefore, the energy consumption of Jingmen City showed a trend of increase and concentration. The conclusions of this study can fill up the problems that cannot be found in the energy consumption statistics of cities, and propose a more accurate way to reduce energy consumption in Jingmen City, which provide a reference for the green transformation of similar small and medium-sized resource-based cities.
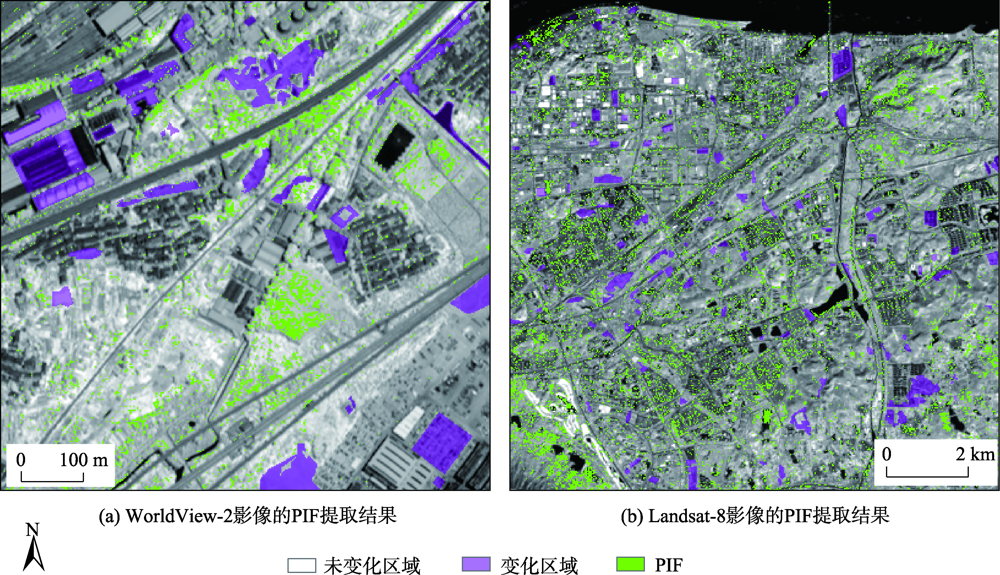
Relative radiometric normalization is an important process in the remote sensing image change detection. Identifying the Pseudo-Invariant Features (PIF) with invariant or near-invariant radiometric reflectance over a certain period in multi-temporal images is a key to radiometric normalization. This paper proposed a novel method for automatic extraction and optimal selection of PIF. First, the change vectors including brightness, and spectral and spatial domains of bitemporal images were generated. Then, the pixels of each change vector were sorted from the lowest to the highest value, and the majority vote algorithm was used to extract the initial PIF. Finally, the PIF was selected by the iterative linear regression and outlier analysis. Taking two multi-spectral high-resolution Tripesat-2 images acquired on November 27, 2016 and July 18, 2017 as example, two typical regions with different land cover types were selected to test the proposed method. The proposed method was compared with Multivariate Alteration Detection (MAD) and Iteratively Reweighted Multivariate Alteration Detection (IR-MAD) methods. The applicability of the proposed method was also validated by two WorldView-2 and Landsat OLI images. The results show that: (1) the accuracy of the PIF that extracted within two regions were 98.74% and 98.71%, respectively. The extracted PIF was distributed in the unchanged areas and covered the main land cover types in the images; (2) the linear regression models of the relative radiometric normalization using the PIF extracted by the proposed method were significant (p<0.000 1); (3) the differences in image brightness, spectral domain, and spatial domain were taken into account in this method with less parameters and high operability; (4) compared with MAD and IR-MAD, the proposed method showed a better performance in extraction precision and an significant linear regression model of the relative radiometric normalization; and (5) the proposed method was suitable for other medium- or high-resolution remote sensing images with same bands.
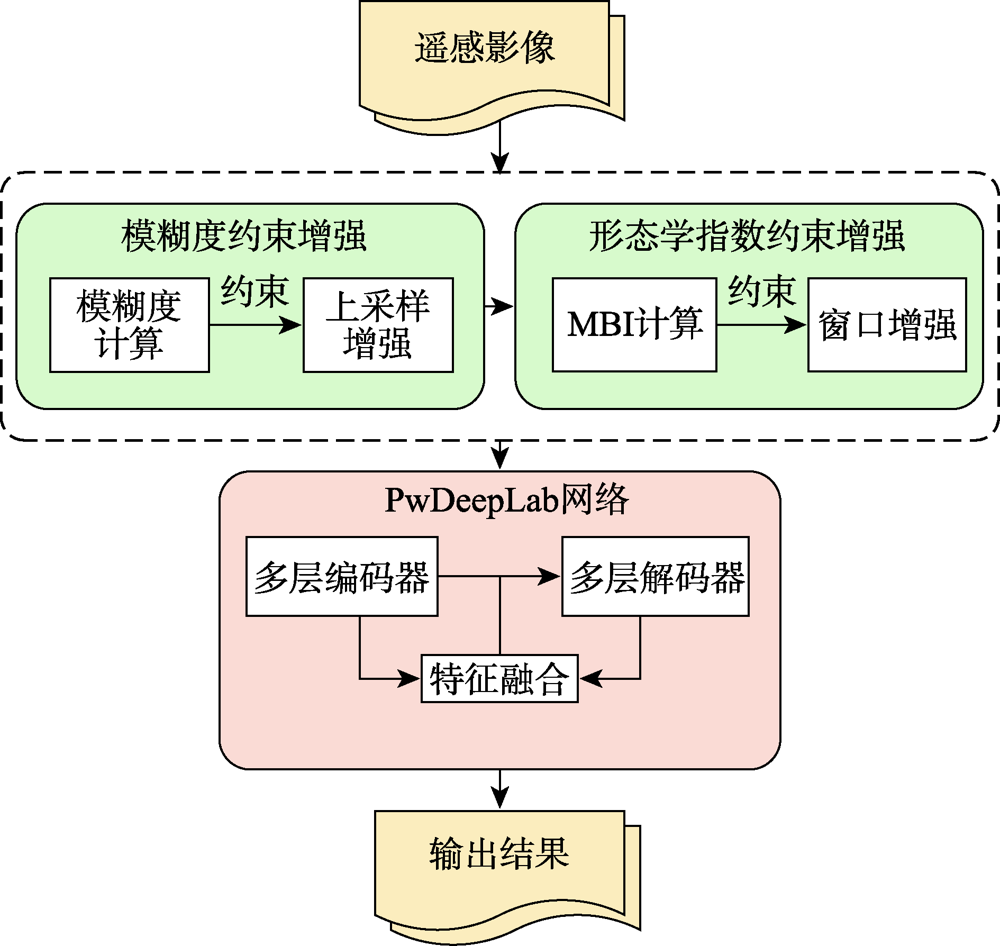
Extraction of buildings from high-resolution remote sensing images has been a hot topic. It is important to quickly and accurately extract the location and outline of buildings from high-resolution remote sensing images for earthquake disaster assessment, urban and rural planning management, smart city construction, and other fields. However, it is challenging to extract buildings accurately from high-resolution remote sensing images due to the complexity of ground features and the occlusion phenomenon. The classic building extraction algorithms usually have incomplete results with many wrong detections and missed detections. The deep-level feature extraction method of deep learning is very suitable for the extraction of buildings from high-resolution images. However, for the existing researches using deep learning algorithms, most algorithms are optimized by changing the network structure and are rarely combined with other methods. The pertinence of building extraction is not strong. This paper not only studies the influence of the internal structure of the convolutional neural network in deep learning on the extraction results, but also studies the combination of ambiguity, Morphological Building Index (MBI) with deep learning. The main improvements in this paper are as follows: (1) Based on the DeepLab v3+ network structure, we propose the PwDeepLab network which improves feature fusion methods and loss functions; (2) We propose a blur degree constraint method. We define a new blur degree formula to evaluate the image blur degree. In the case of a fixed image block size, the image is upsampled and enhanced by the image blur degree constraint; (3) We propose a morphological index constraint method. The pixels of the original image are stretched and enhanced where the Morphological Building Index (MBI) is above the threshold. Therefore, the building information can be highlighted with less changes to the original image characteristics. Our method is verified using the Massachusetts dataset and the satellite dataset II (East Asia) of Wuhan University. The main building types of the two datasets are quite different. As a result, the accuracy of the proposed method on the two datasets increases by 10.9% and 3.8%, respectively, compared with DeepLab v3+, and increases by 10.0% and 9.6%, respectively, compared with U-Net. The higher accuracy reflects the superiority and robustness of our method. Moreover, the extracted results match the real labels very well in details. The experimental results show that the method proposed in this paper can significantly improve the building extraction results.
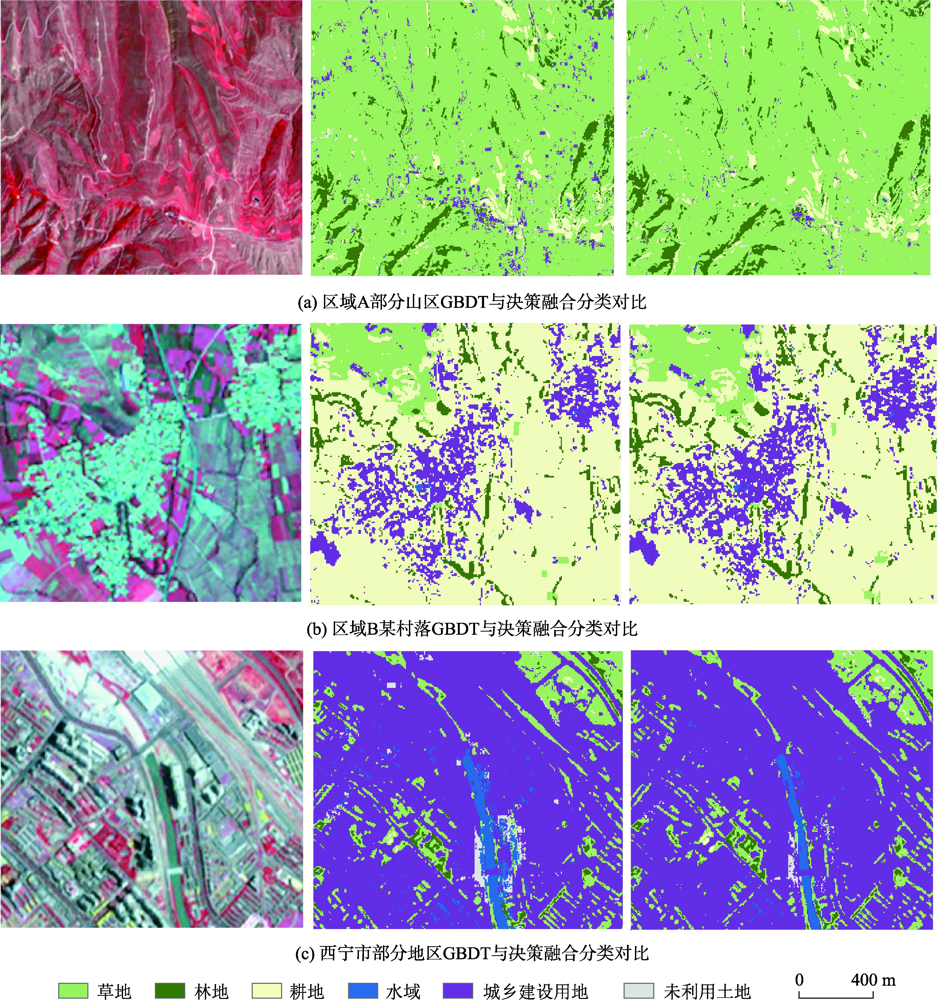
The decision fusion of multi-classifiers has shown great potential in improving the accuracy and reliability of remote sensing image classification. However, multi-classification of all pixels is usually time-consuming. In order to solve this problem, this paper puts forward the concept of master classifier based on existing studies. Firstly, two experimental areas were selected in the Huangshui river basin of Qinghai province: region A representing urban area with serious human activities and complex spectra, and region B representing rural and mountainous area with relatively simple spectra. To obtain a high classification accuracy, seven different commonly used classifiers were selected for decision fusion. Using the testing samples, the classifiers with low accuracy were excluded based on the average accuracy of two regions. Excluded classifies were Naive Bayesian (NB), K-NearestNeighbor (KNN), and Decision Tree (DT). The other four classifiers including Gradient Boosting Decision Tree (GBDT), Random Forest (RF), Support Vector Machine (SVM), and Multilayer Perceptron (MLP) were kept to establish the decision rules for SPOT-6 images classification. Particularly, the GBDT with the highest accuracy among all classifiers was regarded as the master classifier. After the classification by GBDT, the pixels with low confidence were classified again using the other three classifiers, and the decision fusion was made together with the result of GBDT to select the best classification result. The results show that, 38.10% and 65.26% of the pixels in the two regions were classified by the master classifier alone, respectively, and the misclassification rate was 1.57% and 2.18%, respectively. For the regions of decision making using multiple classifiers, the overall classification accuracy was respectively 2.49% and 3.66% higher than that using GBDT. On the whole, the decision fusion improved the overall classification accuracy of the two regions by 1.18% and 1.09% respectively, effectively reduced the "salt and pepper " noise in the results, and achieved a more homogeneous classification accuracy. Compared with the existing decision fusion researches, the use of the master classifier not only ensures the accuracy of classification, but also improves the classification efficiency and maintains a good consistency of the classification results.
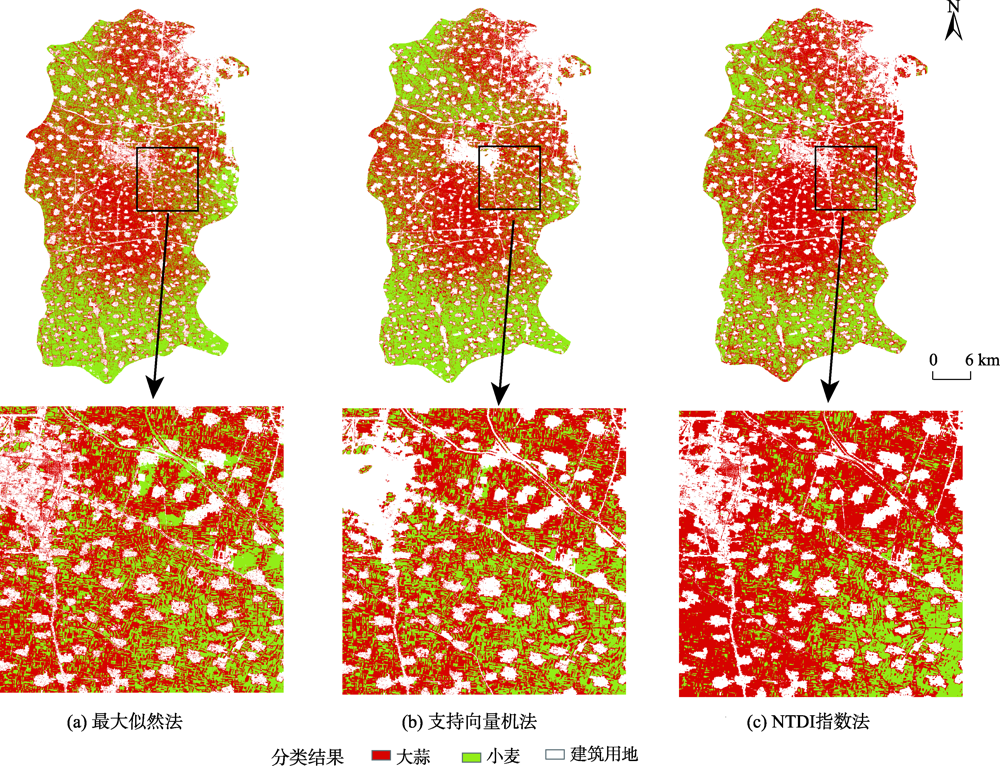
In order to improve the efficiency of remote sensing monitoring of crop planting and expand applications of remote sensing data, a method of crop planting area extraction based on NDVI time series difference index is proposed. With the development of remote sensing and cloud computing technologies, Google Earth Engine, as a global-scale geospatial analysis cloud platform, overcomes the disadvantages of traditional single-machine computing and brings new opportunities for rapid remote sensing classification. In this study, taking Qi County in Henan province as the study area, the NDVI time series difference index of different crops is constructed according to the characteristics of time series NDVI curve of each crop to extract crop planting information and distinguish different crop types using multi-temporal Sentinel-2 images in 2019-2020 based on the Google Earth Engine platform. The extraction accuracy is verified and compared with other existing methods. The results show that the NDVI time series difference index is based on crop phenology information and developed using GEE's high-performance computing capability, which forms a framework for rapid crop planting information extraction and has obvious advantages over traditional local computing. The winter wheat and garlic planting areas in Qi County have obvious spatial variation. The winter wheat planting areas are mainly concentrated in the northwest and southern rural residential areas of the study area. While the garlic in Qi County is mainly concentrated in the central and northeastern part of the study area due to the needs of transportation. Compared with other methods using support vector machine and maximum likelihood, the overall accuracy of crop planting area extraction using the NDVI time series difference index reaches 83.72%, and the Kappa coefficient is 0.67. The overall accuracy and the Kappa coefficient are 10.02% and 0.21 respectively higher than the maximum likelihood method, and are 4.18% and 0.09 respectively higher than the support vector machine method, which indicates that our method can extract crop planting information with high efficiency and high accuracy. We develop an efficient and accurate monitoring method for regional crop planting information extraction and expand the application of remote sensing data in the agricultural field, which has significant value for future agricultural applications.
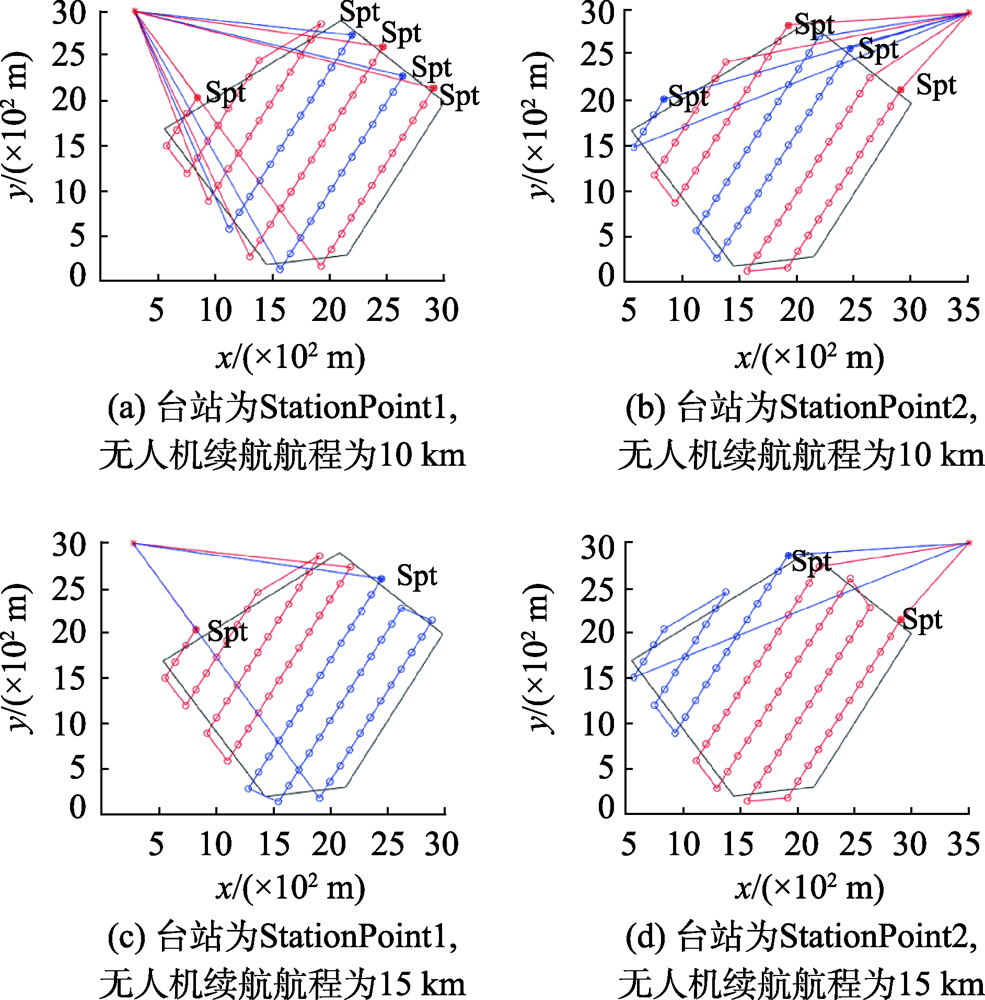
Unmanned Aerial Vehicles (UAVs) have been widely used in the field of remote sensing, due to the its flexibility and high resolution. However, the current remote sensing applications of UAVs are dominated by single UAV operations. There is still a lack of collaborative planning of UAV networking and the operation efficiency also needs to be improved. The UAV networking remote sensing can overcome these problems and provide high-frequency, multi-scale, multi-platform, and multi-load networking observations. The timely large-scale ultra-high-resolution data provided by the UAV networking remote sensing allow for large-scale ecological environment monitoring, flood disaster monitoring, and emergency monitoring of homeland security. Moreover, the UAV track planning can provide an optimal trajectory for high-frequency remote sensing observations. Thus, the research on UAV remote sensing track planning is of great significance. Given the increasing complex aerial tasks of remote sensing and increasing field station resources, a UAV networking remote sensing track planning model based on field stations is proposed in which the task assignment of the multi-unit network is carried out based on the optimized track planning of single UAV. Firstly, the optimization of track for a single UAV is carried out. The total flight of the drone is divided into effective flight and ineffective flight. By analyzing the remote sensing task constraints of a single UAV proves, we find that there is the highest efficiency when the ineffective flight is the shortest. The ineffective flight is determined by the turning flight and the flight of the UAV to and from the station. Therefore, the track optimization method to improve the efficiency of a single UAV is determined by reducing the turning distance and the distance that UAV to and from the station. The optimal flight direction is determined by the "minimum width" and the optimal mission starting point is determined by the principle that the flight of UAV to and from the station is the shortest. Secondly, based on the optimized track planning of a single UAV, a station-based task assignment algorithm for UAV networking is proposed. This algorithm takes into account the flight of each UAV to and from the station and takes full advantage of all flight. The task assignment is finally carried out by obtaining the track planning of UAV networking with the least number of UAVs. The feasibility of the model is verified by simulation examples in this study.