Scaling effects describe the observational differences caused by different observation standards. It is an important research topic in Earth science and quantitative remote sensing. Current studies mainly focus on estimating the errors caused by the scaling effects, but different opinions still exist about the scaling effects in some critical vegetation structural parameters and their scale transformation methods. This paper analyzes the scaling effects and the scale transformation methods of three key vegetation structural parameters, namely Leaf Area Index (LAI), Effective LAI (LAIe), and Clumping Index (CI), based on their definitions and acquisition methods. By definition, LAI is free from the scaling effects, whereas LAIe and CI have scaling effects. The scaling effects of CI is introduced by LAIe (CI=LAIe/LAI). LAI, LAIe, and CI can be obtained through field measurement and remote sensing inversion methods. In field measurements, LAI is obtained through the direct destructive method or the indirect optical method. LAI obtained through the destructive method has no scaling effects. The indirect optical method estimates the three parameters based on the Beer-Lambert equation with the canopy gap fraction. LAI-2200, digital hemispherical photography, and photosynthetic active radiation sensors are commonly used instruments. The non-liner gap fraction model has scaling effects in deriving these parameters. Remote sensing technology uses passive optical methods, Light Detection and Ranging (LiDAR) technology, and Synthetic Aperture Radar (SAR) methods to estimate LAI, LAIe, and CI. The classic passive optical methods can be divided into the empirical vegetation index estimation methods and the physical model inversion methods. The vegetation index methods establish an empirical relationship between vegetation structural parameters and vegetation indices. The physical model inversion methods are based on physical radiative transfer models. The scaling effects of the remote sensing methods depend on the linear or nonlinear characteristics of these methods. Currently, the major global LAI, LAIe, and CI remote sensing products are acquired from nonlinear inversion models, thus these inversion methods are subject to scaling effects. Nevertheless, the nonlinearity in the inversion process does not necessarily mean that the LAI products have scaling effects. The scaling effects of the LAI products still follow the basic LAI definition. Therefore, current remote sensing LAI products do not subject to the scaling effects at pixel level. On the other hand, both LAIe and CI products do have scaling effects, but the scaling effects are often ignored in practice. In the validation of the remote sensing products, the scaling effects need to be considered while homogeneous areas are preferred in the validation studies. In conclusion, attention should be paid to distinguishing the different scaling effects displayed by the parameters in their definitions, the field measurement and remote sensing inversion methods, and remote sensing products. For the scale transformation, it is more important to investigate the most suitable and efficient method rather than a universal method.
Cropping intensity refers to the frequency of crop planting in the same cultivated land in one year. It is a key parameter for grain yield estimation, land use intensity evaluation, and agroecosystem modeling. Understanding the spatiotemporal change of cropping intensity provides support for food security, land management, and eco-environment security. The demand for timely and accurate information of cropping intensity is expected to increase in the future. Traditionally, cropping intensity is calculated from the statistical data. However, there are several shortcomings in the output from statistics, such as time-lag effect, homogeneity in one administrative unit, and low accuracy. In the past two decades, remote sensing technology has been widely used to monitor cropping intensity at different scales due to its multiple advantages such as high-efficiency and low-cost. However, the performance of remote sensing in monitoring cropping intensity has not been well evaluated. In this paper, remote sensing data, extraction algorithms, and accuracy evaluation methods employed in cropping intensity researches are summarized elaborately: ① cropping intensity extraction algorithms can be grouped into the following types: feature discrimination algorithm, curve feature comparison algorithm, peak detection algorithm, temporal mixture analysis algorithm, hierarchical training algorithm, continuous wavelet transform algorithm, growth cycle judgment algorithm, and time-series banning algorithm; ② time-series data from a single sensor is still the main data source for cropping intensity monitoring and can no longer meet the requirement of higher precision. As a result, data fusion has gradually become an effective way to obtain high-quality time-series data from remote sensing; and ③ results from different extraction algorithms are evaluated by statistics, visual interpretation, field survey, and previous studies. Furthermore, we conclude the advantages and disadvantages of remote sensing data and compare different extraction algorithms and accuracy evaluation methods. Finally, we discuss the deficiencies of previous studies, and put forward several tips for future studies: ① a reasonable evaluation system is expected to be established for comparing different extraction algorithms; ② more attention should be paid to regions having complex terrain and smallholder farms; ③ to obtain higher quality time-series data from remote sensing and improve the efficiency of data processing, denoising algorithms, data fusion, big data, and cloud computing techniques should be considered; ④ multi-scale validation of results is needed if data is available.
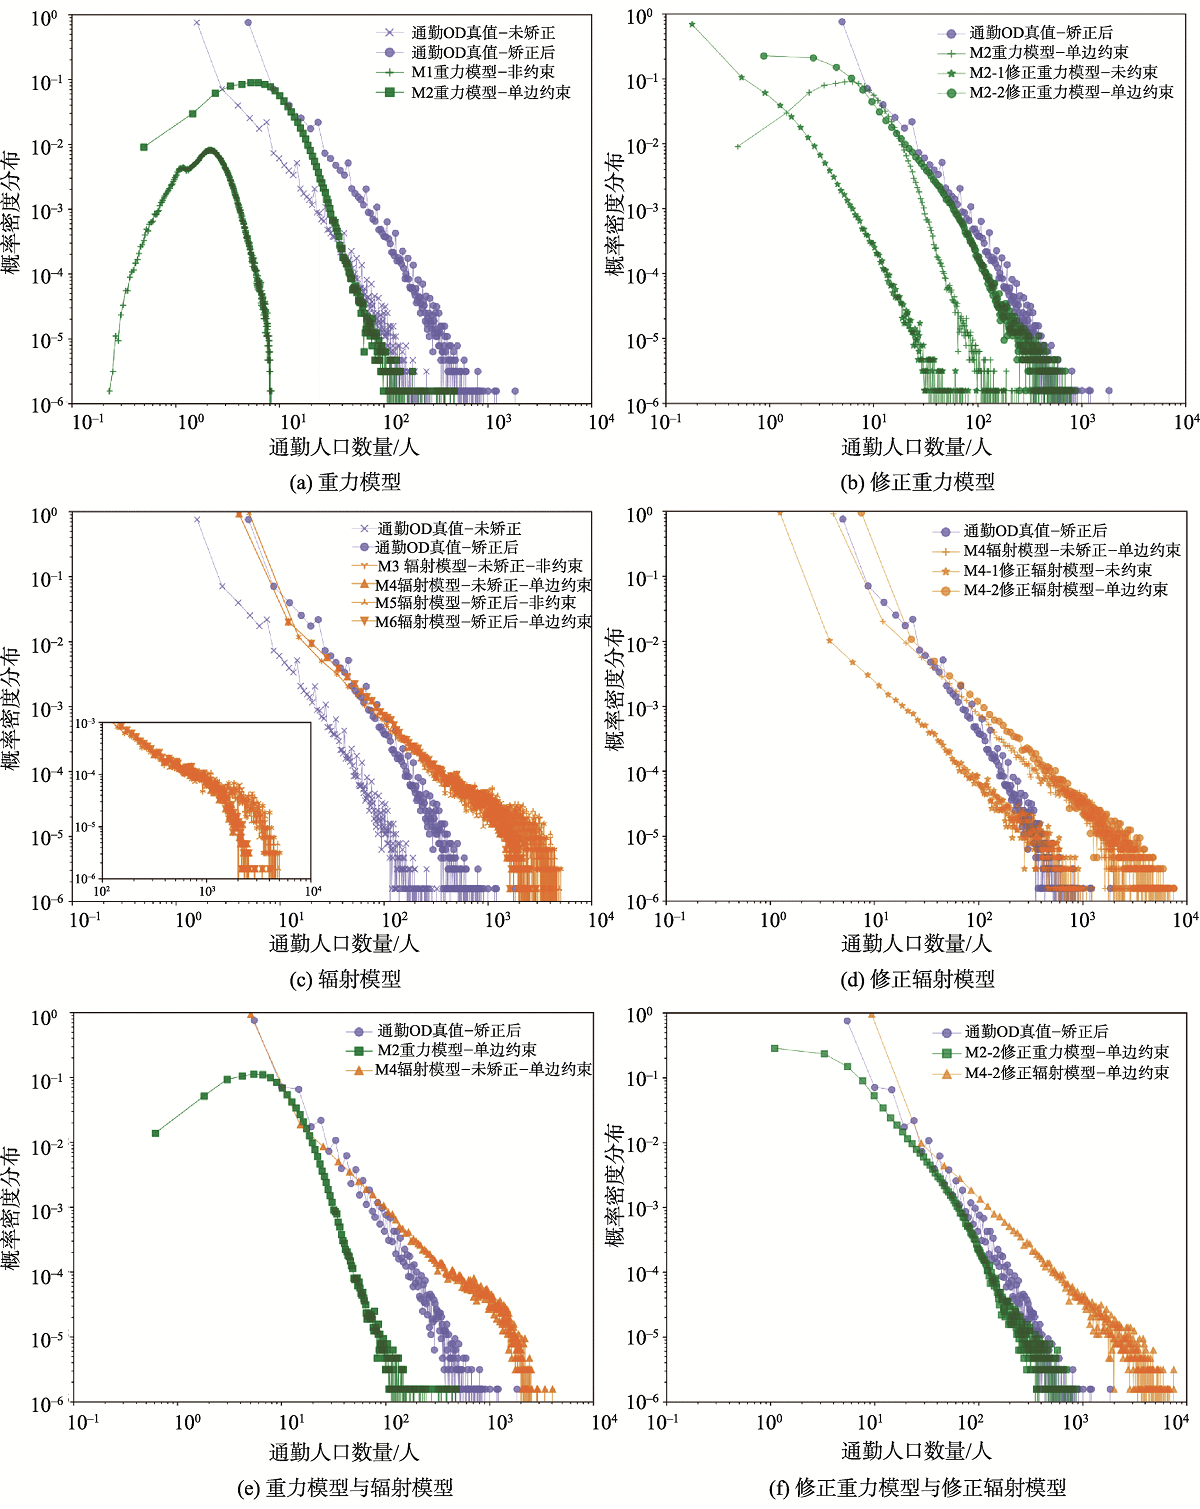
In recent years, big data has been widely applied in traffic analysis. However, they are mostly used for data visualization and phenomenon description. There is a lack of big-data oriented transport modeling, which leads to limited application of big-data in transportation planning. In this study, we propose a Location-Space Dependent Indicator (LSDI) based on the time-space interaction between transportation and land use. Based on this indicator, the urban commuting distribution model is developed, which improves the traditional gravity model. Taking Beijing as a study case, the developed model is applied and verified using mobile phone signaling big data derived from the communication service of an operator in September 2017. Travel generation and distribution models are constructed and verified respectively. Our results show that: (1) For the travel generation model simulations, commuter population and resident population show a good linear relationship. This model generates a significant prediction with a goodness of fit of 0.84; (2) For the travel distribution model simulations, a comparison analysis is conducted between gravity model, radiation model, and modified model with LSDI. The gravity model corrected by real commuting data performs best in regression analysis with a goodness of fit of 0.94. But large errors occur in the probability density distribution. The radiation model performs normal in regression analysis with a goodness of fit of 0.37. It has a better accuracy in the probability density distribution. The modified gravity model with LSDI has the best overall performance. The underestimation phenomenon is optimized in the commuter population distribution with a highest goodness of fit (0.85). Our findings provide new insights in developing big-data oriented transport prediction models and contribute to promote the application of big data in transport planning.
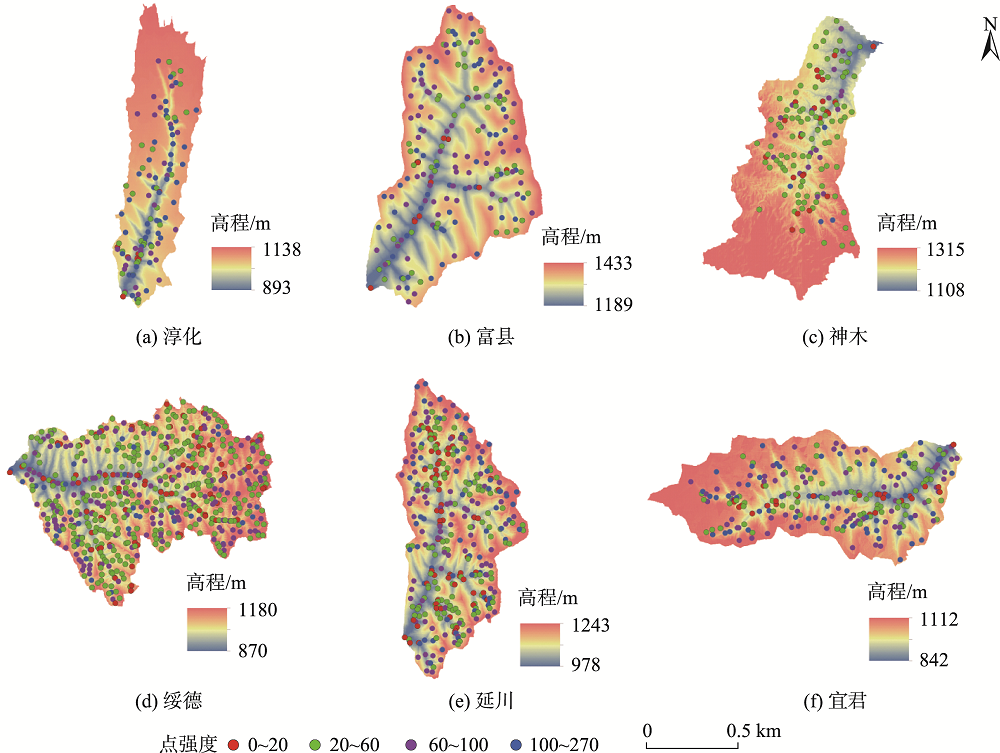
Gully erosion has been identified as a major driver of the formation of loess surface erosion, and the development process of the gully profoundly affects the development and evolution of the loess landform. In this study, six typical geomorphological plots of the Loess Plateau were selected, and the digital elevation model of these plots were used as the basic data source to extract the gully system. The weighted complex network model of the gully in the Loess Plateau was constructed using the gully nodes, gully source points, and water outlet points as the network nodes, the spatial topological relationship between the network nodes as the network edges, and the elevation difference as the weight. Through quantitative description and analysis of the nodal characteristics and spatial structure of the loess gully in the Loess Plateau, the spatial pattern and changes of the network characteristics of different landform types of the Loess Plateau were obtained. We further analyzed the development process and evolution mechanism of the loess valley landform. The results show that: ① The cumulative probability of the node strength of the gully weighted networks in the Loess Plateau was exponentially distributed. Correlation coefficients were all above 0.80, and the complex networks were in the transition period from random network to scale-free network; ② From the south to the north plots, the node strength values of the characteristic points of the gully showed a gradually decreasing trend, and the distribution was asymmetric, with higher erosion intensity and more node distribution on the right side of the gully; ③ The average path length and the network structure entropy in Suide area reached the maximum of 30.94 and 6.31, respectively, and gradually decreased at the north and south sides. The change curve of network density was the opposite. The connectivity, stability, and compactness of the network structure reflected the erosion degree of different gully geomorphic types and evolution mechanism of the geomorphic system; ④ The correlation coefficient between network index and traditional geomorphic index was more than 0.85. This parameter emphasized the attribute characteristics and spatial topological relationship of different valley feature points and the differences of feature points in spatial relationship. It can scientifically and accurately express the complexity and development stage of the geomorphology and is expected to be used as an important parameter to study the geomorphological characteristics of the gully. Our method considered the spatial topological relationship of the gully topography and the integrity of the system and provided a new idea for the research of complex surface morphology.
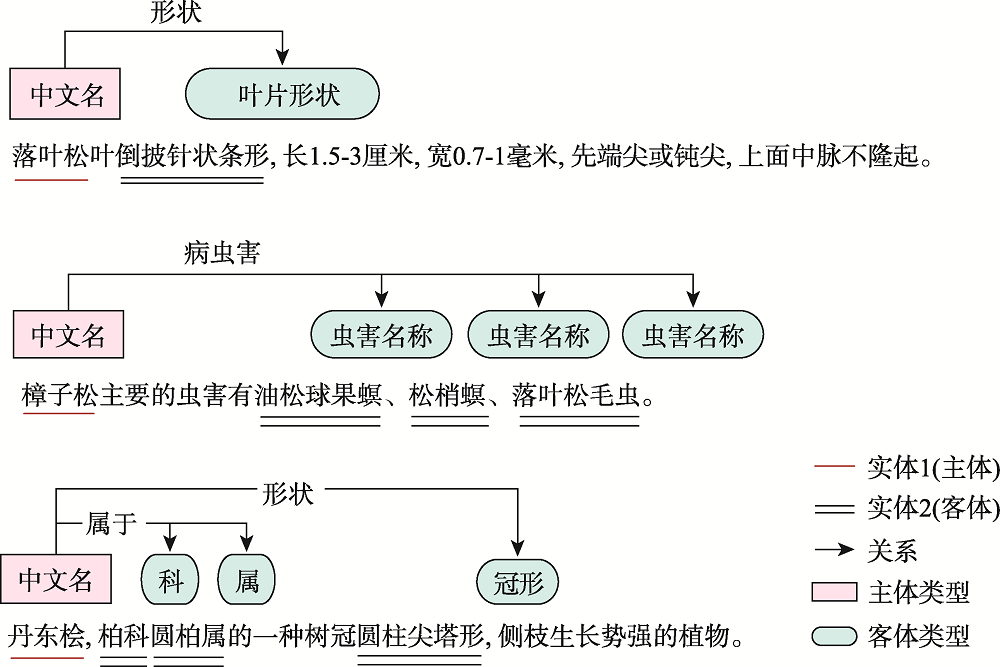
Knowledge graph of landscape plants provides potential uses in the selection of greening tree species considering regional adaptability, ornamental and ecological factors. Entity and relationship extraction of the plant's description text is a key issue in the construction of knowledge graph. Until now, there has been no publicly available annotated data set for the plant domain. In this paper, a conceptual architecture of landscape plants was defined and briefly described, and the landscape plant corpus was constructed. Existing language models such as word2vec, ELMo, and BERT have various disadvantages, e.g., they can't solve the problem of polysemous words and have poor ability of context fusion and computational efficiency. In this paper, we proposed a named entity recognition model, ALBERT-BiGRU-CRF, and a relationship extraction model, ALBERT-BiGRU-Attention, which were embedded with ALBERT (A Lite Bidirectional Encoder Representation from Transformers) pre-training language model. In the ALBERT-BiGRU-CRF model, the ALBERT model was used to extract text features, the Bi-GRU model was used to learn and excavate deep semantic features between sentences, and the CRF model was used to calculate the probability distribution of the annotation sequence to determine the entities contained in the description text. The ALBERT-BiGRU-Attention model was based on the results of the named entity recognition model. Similarly, the attention model was used to improve the weight of keywords to determine the relationship between entities. The proposed models have the following advantages: (1) The method can effectively identify and extract entities and relationships of landscape plants' knowledge; (2) The models can represent the semantic and sentence characteristics of characters with a good accuracy. The validity of the method was verified on the landscape plant corpus constructed in this paper and compared with other models. Our experimental results of quantitative evaluation show that: (1) The F1 index of the ALBERT-BiGRU-CRF model was 0.9517, indicating that it had good performance in named entity recognition task and can effectively identify 23 main entity types; (2) After comparative experiments and analysis of the relationship extraction results, the F1 index of the ALBERT-BiGRU-Attention model was 0.9161, indicating that it performed well in the relationship extraction of landscape plants; (3) By selecting 6 representative examples to further evaluate the extraction performance of this method, the results show that the method can well identify the knowledge triples of common single-relation and multi-relation texts. Therefore, the entity relationship extraction task based on ALBERT model can effectively improve the recognition and extraction results. It can be applied to the entity relationship extraction task of plant description text, providing a method for automatic construction of landscape plant knowledge graph.
PM2.5 is one of the major air pollutants that threaten human health. A large number of studies have focused on the monitoring of ground-level PM2.5 concentration and its spatio-temporal distribution, but there is currently a lack of research on the correlation between PM2.5 emissions and ground-level PM2.5 concentration. Based on the ground-level PM2.5 concentration grid data and PM2.5 emission grid data from 2000 to 2014 in China, a long-term sequence analysis method was used to analyze and compare the spatio-temporal changes of PM2.5 concentration and PM2.5 emissions from qualitative and quantitative perspectives in this study. Furthermore, combined with standard deviational ellipse analysis and trend analysis, the spatio-temporal variations of ground-level PM2.5 concentration and PM2.5 emissions and their correlation were analyzed. The results show that the spatial distributions of ground-level PM2.5 concentration and PM2.5 emissions were generally consistent, with dense populated areas concentrated in the east of the Hu Huanyong Line. However, there was still a situation of "low emission and high pollution" in parts of southern and central China. This was due to factors such as atmospheric transmission, topographical cumulative effect, and the conversion of PM2.5 concentration by precursors (SO2, CO, NO2, etc.). Temporally, there was a dynamic time difference between PM2.5 concentration and emissions, and the change of PM2.5 concentration was more obvious. The proportion of land area higher than 35 μg/m3 increased by 14.26% from 2000 to 2007, and decreased by 2.84% from 2007 to 2014. From the standard deviational ellipse analysis, the PM2.5 concentration ellipse and the emission ellipse were consistent with the distribution of population and economy in terms of the coverage area and azimuth, with the former having a larger area and a longer axis close to the east-west direction. There was a difference of about 17° between PM2.5 concentration ellipse and emission ellipse due to natural source pollution in the west and the diffusion of pollutants in the atmosphere. And the center positions of the two ellipses showed a clear trajectory and legacy characteristics over time. In addition, affected by factors such as meteorological parameters and point source emissions, the variations of PM2.5 concentration and the emission were not completely consistent in the east of the Hu Huanyong line. In some areas, the emission trend was decreasing while the concentration trend was increasing. Revealing the complex spatio-temporal correlation between PM2.5 concentration and the emissions in China can help formulate scientific prevention and control measures according to local conditions and effectively improve air quality.
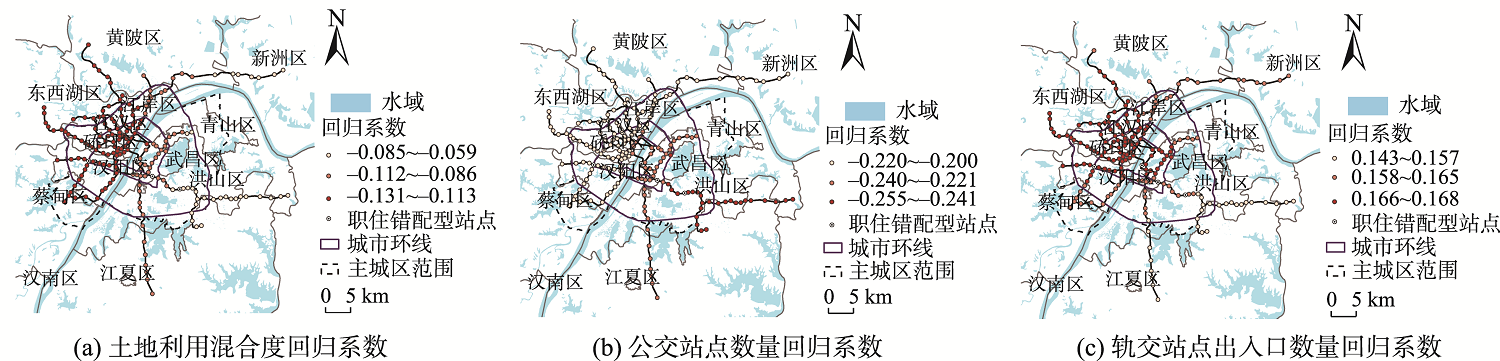
The rapid development of Urban Rail Transit (URT) has improved commuting accessibility. It is also considered to have a significant impact on the reconstruction of the urban jobs-housing spatial pattern and thus affecting the jobs-housing relationship. Exploring the relationship between on-site jobs-housing balance and built environment in the surrounding areas of URT stations contributes to promoting the "micro-balance" of jobs-housing in multiple areas and adjusting the regional separation of jobs-housing caused by rail transit. This article takes 189 rail stations in Wuhan as an example. Rail transit commuters were identified by constructing trip chain of each passenger based on data from the Automatic Fare Collection system (AFC) on weekdays. On this basis, we described the commuting characteristics of residents in Wuhan. Additionally, we used multiple stepwise regression model to select significant variables of built environment that affect jobs-housing balance. We further used Geographically Weighted Regression model (GWR) to explore the spatial heterogeneity of influence. The results are as follows: (1) From an overall perspective, centripetal commuting pattern is obvious at the municipal level. Due to the unique urban pattern of the two rivers and three towns, large-scale commuting across the river occurs between Hankou and Wuchang. Thus the river-crossing traffic is under pressure. The degree of jobs-housing balance in main city is better than that in the peripheral areas. The degree of employment agglomeration gradually decreases from the core areas to the peripheral areas. The living space is distributed around the second ring in the peripheral city. The city forms a separation pattern of "central employment - peripheral residence". (2) The result of multiple stepwise regression model showed that three of the variables have significant impacts while variables like the number of road intersections, parking service level, POI density, and other factors were statistically irrelevant to jobs-housing balance. Specifically speaking, land use mixing degree and the number of bus stops have a positive effect on the jobs-housing balance in the surrounding area of URT stations, while the number of exits of URT stations has a negative effect. Meanwhile, the influence of factors has obvious spatial heterogeneity. (3) The jobs-housing balance of non-initial stations is better than that of initial stations. Whether it is a transfer station or not, there is little difference in its jobs-housing balance. This study can provide references for the construction of "jobs-housing" balance of stations on the spot and promoting the coordinated development of rail transit and urban functions through compact space layout and intensive use of land.
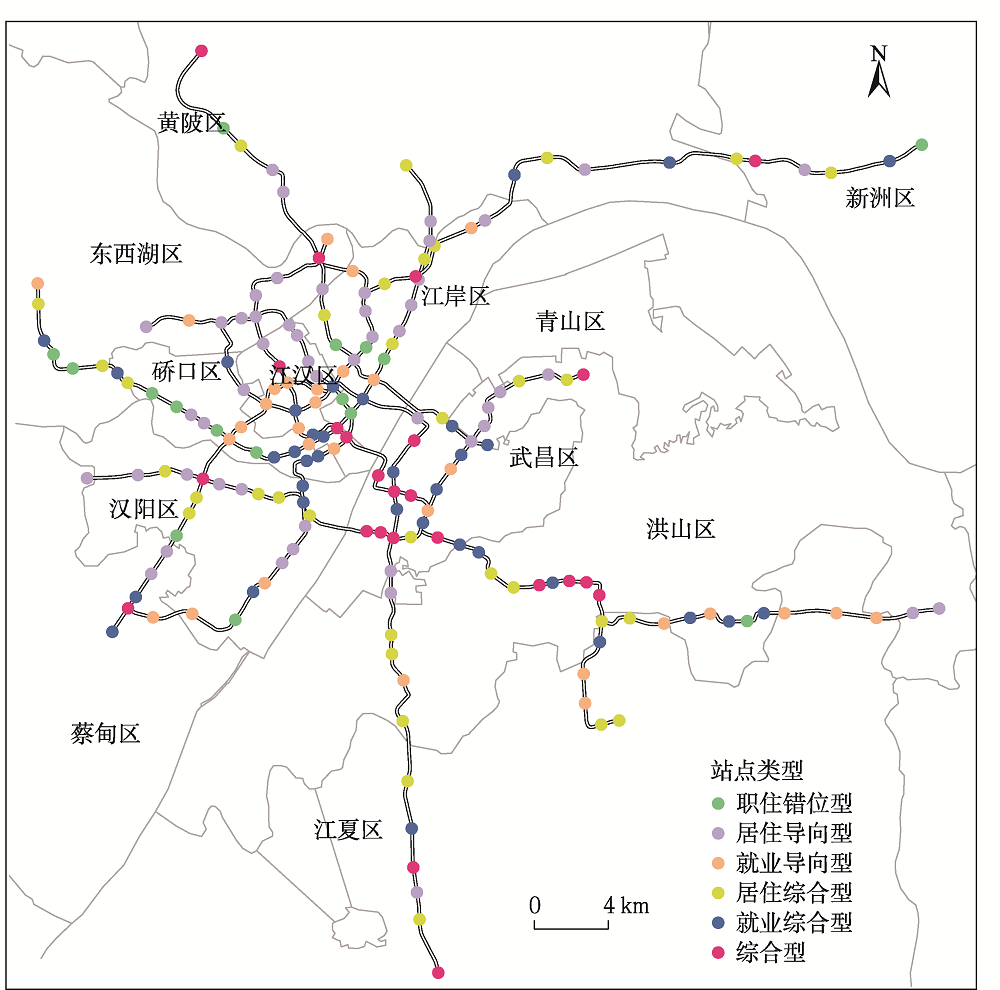
China has become the country with the longest urban rail transit construction mileage and the highest construction speed in the world. Thus, It is of great significance for the construction of rail transit to reasonably identify different types of urban railway stations and environmental building factors that affect the characteristics of passenger flow. In this study, we take Wuhan as an example. We divide rail transit sites into six types (jobs-housing mismatch, residence-oriented, employment-oriented, comprehensive residence, comprehensive employment, and integrated type) through analyzing automatic fare collection system data and using EM clustering method with the introduction of passenger flow characteristics. On this basis, a multinomial logistic regression model is established to quantitatively analyze the impact of built-in environmental factors on the characteristics of rail transit passenger flow at different types of stations within the passenger flow attraction range. Taking comprehensive stations as control group, the results are shown as follows: (1) The densities of road network and intersection have a significant impacts on the passenger flow characteristics of all types of stations. A lower road network density and a higher intersection density are more beneficial to jobs-housing balance. (2) The density of bus station is negatively correlated with the passenger flow characteristics of employment-oriented stations. (3) The proportion of commercial land is negatively correlated with the passenger flow characteristics of jobs-housing mismatch, residence-oriented, and comprehensive residence stations. (4) The proportion of service industry facility land is negatively correlated with the passenger flow characteristics of jobs-housing mismatch, residence-oriented, and comprehensive employment stations. (5) The proportion of land used for scientific research and education is negatively correlated with the passenger flow characteristics of residence-oriented and employment-oriented stations. (6) The degree of land use mixture is negatively correlated with the passenger flow characteristics of residence-oriented and employment-integrated stations. This study is of great significance to coordinated development of rail transit construction, rail transit, and land use in Wuhan.
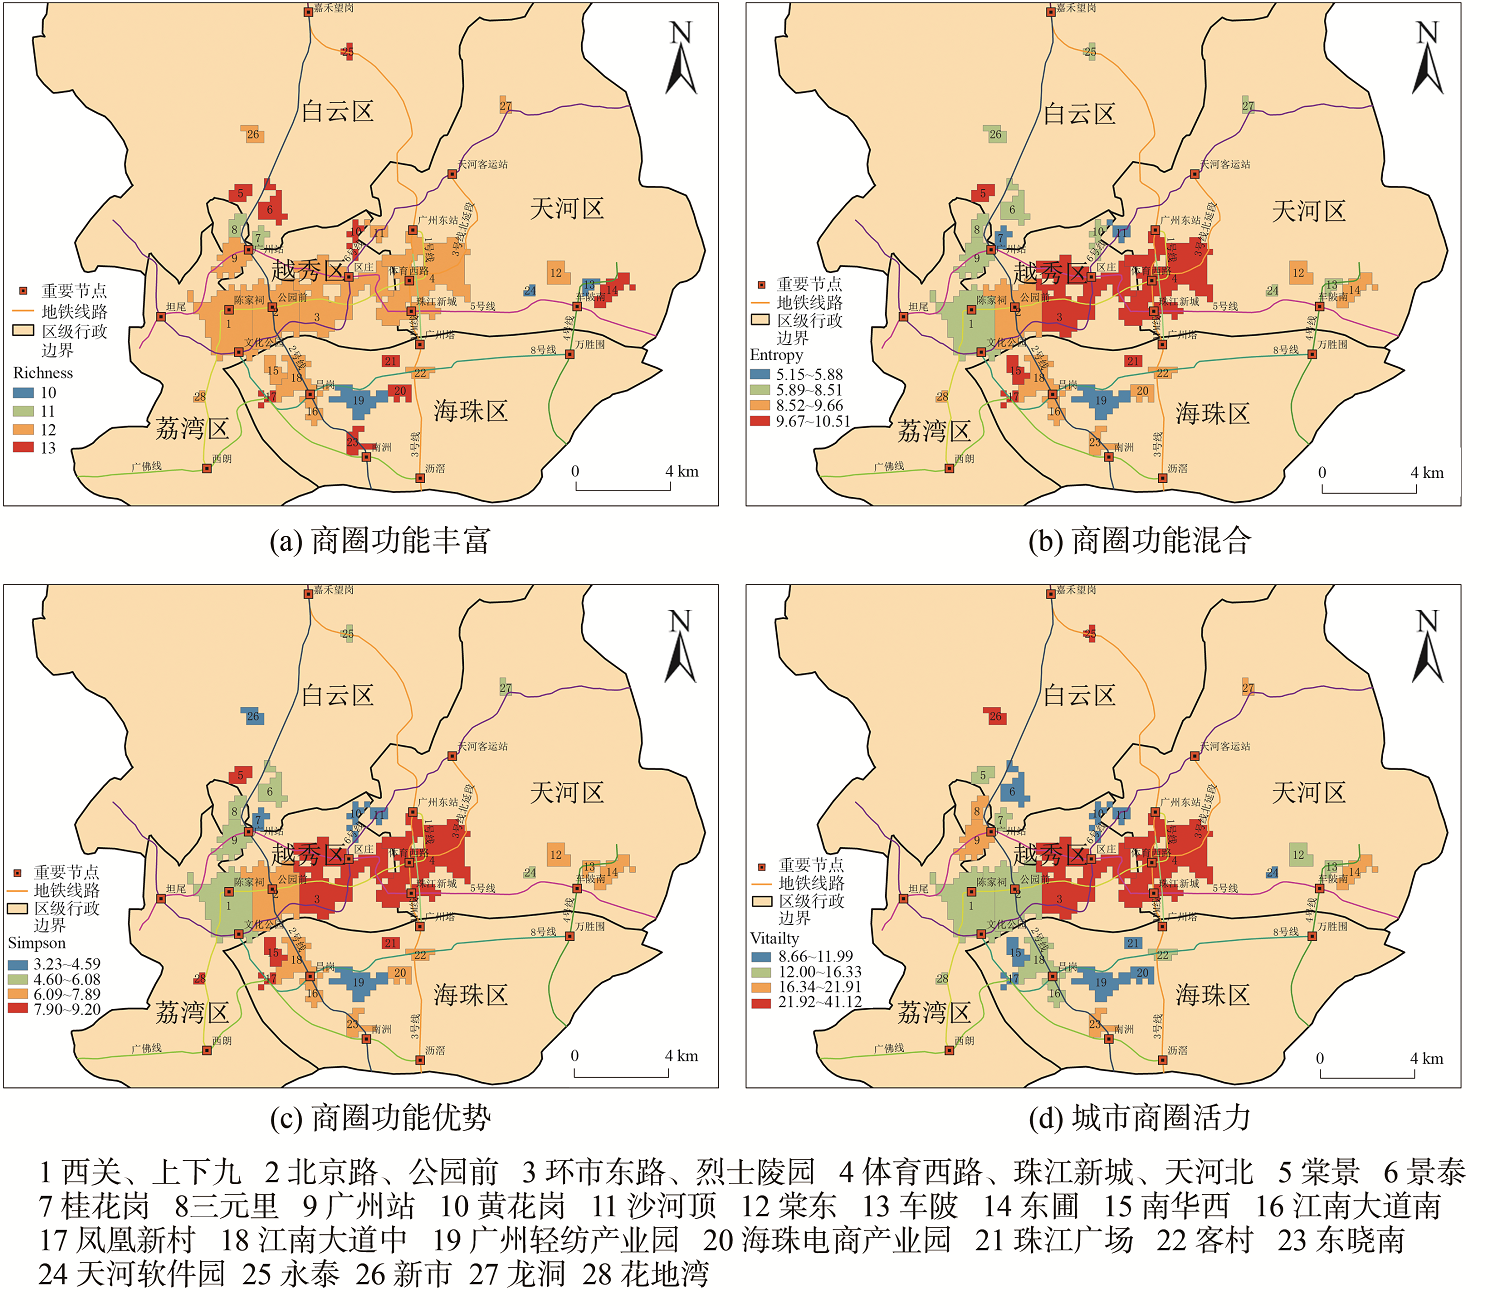
As the most active area of urban economic and social activities, business district provides a complex and mutually supporting diversity of functions to meet people's needs. Exploring how the functional diversity affect the vitality of business districts can provide theoretical support for the optimization and adjustment of urban land use functional structure and urban renewal, and then promote the mixed-use development and enhance its vitality. Taking the main urban district of Guangzhou as an example, this paper used Point of Interest (POI), google satellite images, high-resolution night light data of luojia No.1, spatial grid method, and hot spot analysis method to quantitatively identify the boundary range of business districts. At the same time, 28 business district were identified on the basis of comprehensive consideration of transportation railways, rivers, mountains, and historical development factors. Taking the business district as the basic research unit, the functional diversity of multiple and multi-dimensional features of the business district was measured using the Hill number model, and then the brightness of the corrected luminous radiation was calculated to represent the vitality of the business district. Finally, the method of partial correlation analysis was used to explore the relationship between single entropy index and functional diversity index with business district vitality. The main conclusions are as follows: (1) It is not enough to use entropy index only to reflect diversity, and it needs to combine with Hill number diversity index to measure the functional diversity of the business district from multiple perspectives to make up for the deficiency of the single entropy index measurement method. (2) The functional diversity index of the business district has a certain effect on business district vitality. Improving the functional richness index of the business district can help increase the complementarity, heterogeneity or mixing of functions, and to have enough diversified functions to stimulate the vitality of the business district. (3) The scale effect of business district can enhance its vitality more than agglomeration effect. The larger scale of the business district, the more stimulating on the vitality, while the functional agglomeration effect of the business district has relatively little effect on improving its vitality.
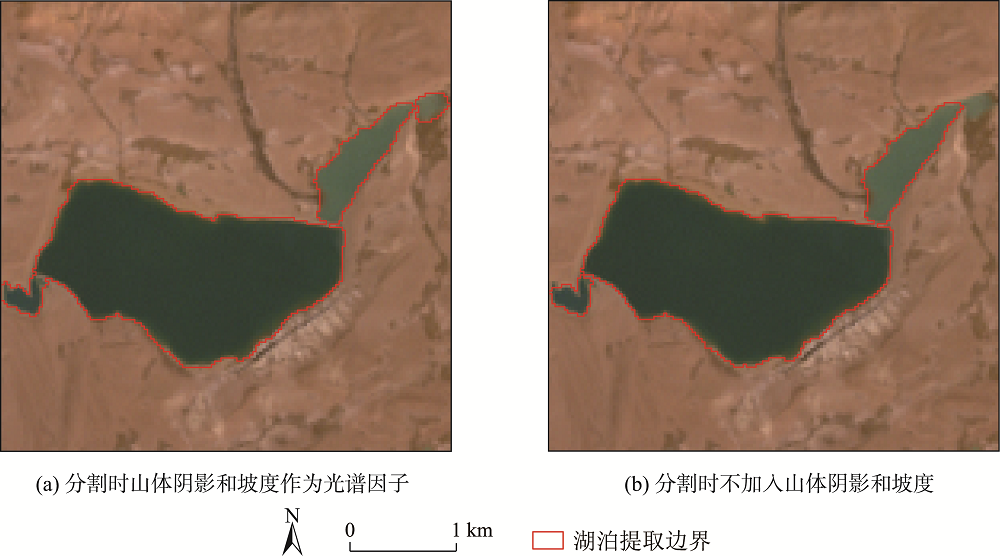
The object-oriented methods for lake extraction from remote sensing images often have the problem of inaccurately identifying lake boundaries. This paper proposes a method to solve this problem by integrating the object-oriented approach with watershed algorithm. First, this method segments the target image into lakes, potential lake zone, and unknown region. Then, the unknown region will be refined using watershed algorithm. This work selected three mountainous regions with abundant lakes in Kunlun-Kara and Himalayas as the study area and used the Landsat images to evaluate the proposed method. The results show that the user's accuracy, producer's accuracy, and overall accuracy were up to 99.59%, 98.47%, and 96.53% respectively. Compared with single object-oriented method, the proposed method was more suitable for lake extraction in mountainous regions. Meanwhile, this method can not only accurately delineate the actual boundary of lakes, but also reduce the effect of segmentation scale and classification threshold on lake extraction result.
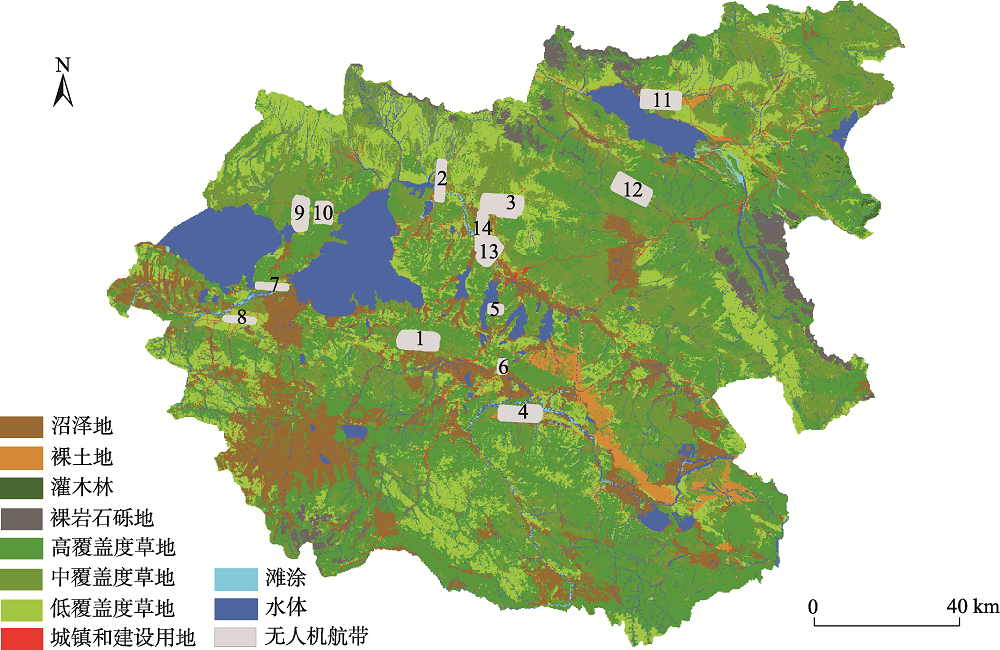
The source region of the Yellow River has a unique ecosystem and biological resources, which is an important water conservation area and ecological barrier in China. In recent years, the traditional husbandry in this area faces the development problems of overgrazing, grassland degradation, seasonal imbalance by the increase in the population of grazing livestock. It is important to scientifically grasp the situation of grazing livestock, we used UAVs to investigate the population and distribution of grazing livestock (yaks, Tibetan sheep and horses) in Maduo County. According to the library of UAV image interpretation of yaks, Tibetan sheep and horses, visual interpretation was carried out. Five methods were used to estimate the population of grazing livestock in Maduo County, and the relationship between distribution of livestock and environmental factors was analyzed by selection index. The results showed that: (1) Yaks, Tibetan sheep and horses were found in 9 of 14 UAV flight strips in April 2017, and the grazing livestock were all located in the cold season grassland. A total of 1351 yaks, 2405 Tibetan sheep and 19 horses were found. In the cold season, the densities of yaks, Tibetan sheep and horses were 4.12, 7.34 and 0.06 per km2, respectively. (2) According to the estimation method of five kinds of livestock, it is the most accurate to estimate the livestock quantity in Maduo County based on the grassland in cold and warm seasons. In 2017, there were 70 800 yaks, 102 200 Tibetan sheep and 12 000 horses, and the error of estimating the population of yaks, Tibetan sheep and horses were -0.93%, 2.27% and -13.23% respectively. (3) The environmental factors of the three livestock, which tended to slope was less than 12°, the grassland coverage was more than 0.6, the distance from residential area was less than 1 km, the water source was less than 3km, the road is more than 3 km. Yaks and Tibetan sheep were mainly group activities, and horses usually were not large clusters. UAVs remote sensing has great potential in animal husbandry, and provides new ideas for studying the characteristics and balance of grazing livestock in pastoral areas
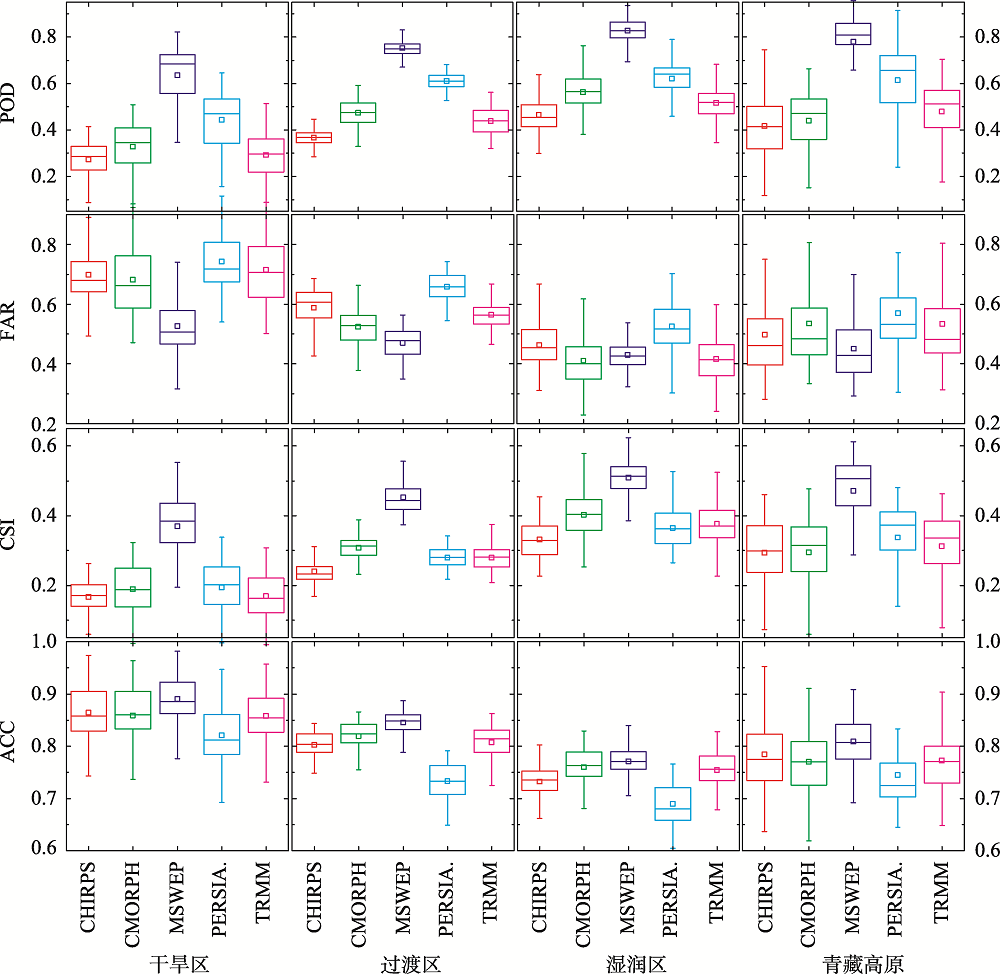
Compared with the observation data from meteorological stations, remote sensing precipitation products can be used to well present the spatial distribution of precipitation. So it is of great significance to make a comparative study on the differences of remote sensing precipitation products in different climatic regions. This paper selects the typical climatic regions in China for comparison analysis. Based on the corrected observations of 649 meteorological stations, the performance of five typical remote sensing precipitation products (CHIRPS v2.0, CMORPH v1.0, MSWEP v2.0, PERSIANN-CDR, and TRMM 3B42v7) are evaluated in different climatic regions. Results show that: (1) The performance of each product varies in different climatic regions; (2) The MSWEP product shows higher CC, KGE, and RMSE values in each climatic region. Based on BIAS, the MSWEP, CHIRPS, PERSIANN, and TRMM have better performance in arid, humid regions, the Tibetan Plateau, and transition regions, respectively; (3) In terms of POD, CSI, and ACC, the MSWEP has better performance in all climatic regions. In humid region, TRMM and CMORPH have advantages with lower FAR, while MSWEP is better in other climatic regions. Above all, MSWEP, the multi-source precipitation product, has better basic statistical performance and category performance in all climatic regions and can be used as a reliable precipitation data source for various hydrometeorological studies in China, which indicates that multi-source data fusion has a good application prospect in future.
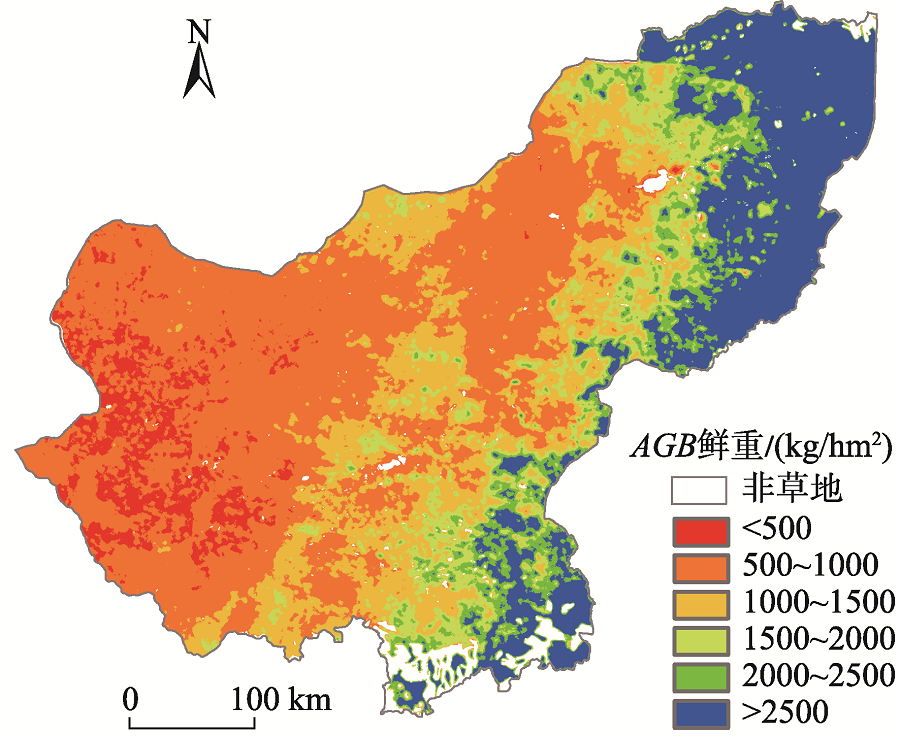
Grassland is the largest terrestrial ecosystem in China. Biomass is a key indicator of ecosystem quality and ecosystem function. It is of great significance for us to accurately estimate the grassland biomass for the effective and rational use of grassland resources, the restoration of damaged grassland ecosystem, and the high-quality development of animal husbandry. In this study, we took Xilinguole league of Inner Mongolia autonomous region as the research area. We used GF-1 satellite images, ground sample data of 216 sites, and Random Forest (RF) algorithm to estimate Grassland Aboveground Biomass (AGB) and explore the applicability of the algorithm in grassland biomass estimation. Moreover, in order to evaluate the applicability of random forest algorithm in aboveground biomass estimation, we carried out a series of analysis when using the algorithm, such as k-fold cross validation, multicollinearity diagnosis, partial effect and so on. Based this, we completed the construction of the random forest model and compared the modeling results with those from other models. Then, we selected the best model to realize the inversion estimation of grassland aboveground biomass in Xilinguole league. The main conclusions are as follows: (1) In the process of biomass model construction in Xilinguole league, random forest algorithm can avoid multicollinearity problem if there are multiple input variables; (2) The random forest model has better applicability than other models in the estimation of grassland biomass. The accuracy of the random forest model is 85% while the RMSE is 202.13 kg/hm2; (3) Using the random forest model, we estimated the grassland aboveground biomass of the whole study area in 2017. The results indicated that the spatial distribution had a decreasing trend from east to west. When grassland types are concerned, the grassland aboveground biomass yield of mountain meadow was the highest among all grassland types while the total yield of temperate grassland was the highest among all grassland types. The results are not only beneficial to the monitoring and evaluation of grassland ecosystem, but also have a certain reference value for grassland macro management.
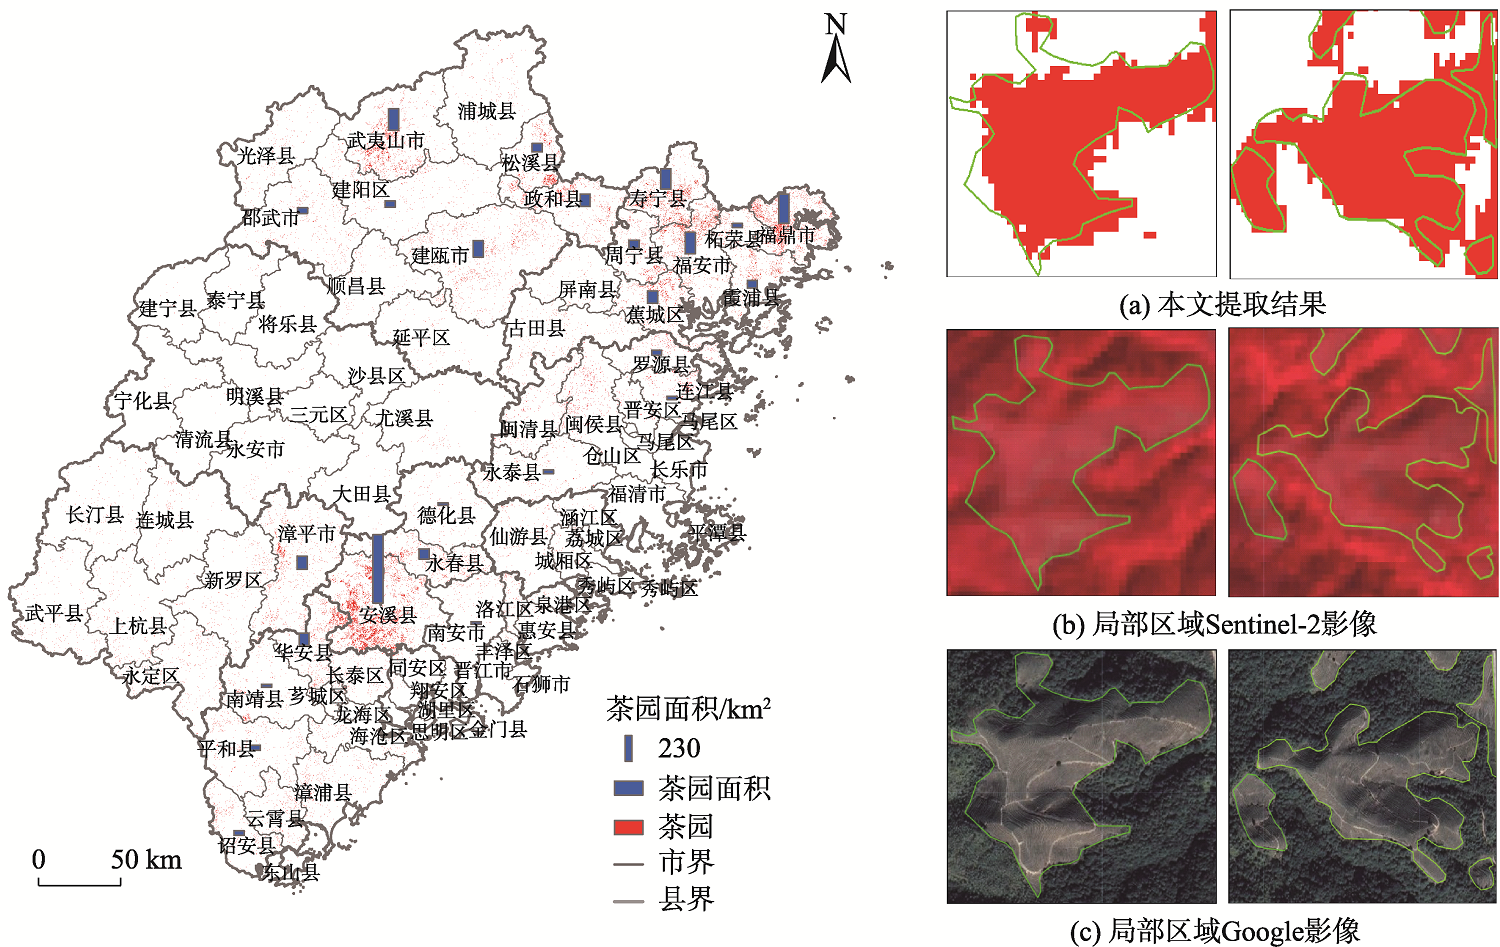
As a major tea-producing province in China, Fujian has a long history of tea culture. According to the National Bureau of Statistics in recent 10 years, the total planting area of tea in Fujian ranked the fifth among all the provinces in China. Rapid and accurate acquisition of tea plantation spatial distribution has important decision-making significance for agricultural economic development and ecological environment protection in Fujian province. However, it is difficult to obtain the spatial distribution of tea plantation in large areas accurately by traditional methods. Based on the GEE cloud platform, we firstly obtained Sentinel-1、Sentinel-2, and terrain data covering the whole province, and then extracted a total of 98 features including spectral features, texture features, and terrain features. Secondly, the Support Vector Machine-recursive Feature Elimination (SVM_RFE) was used to select features. Four groups of experiments were constructed according to different features and optimized feature subsets. Finally, the Support Vector Machine classifier (SVM) was used to extract tea plantation and obtain the spatial distribution map of tea plantation with a resolution of 10 m in Fujian province in 2019. The results show that: (1) Spectral features play an important role in tea plantation information extraction, followed by texture and terrain features. (2) It can improve the extraction accuracy by using SVM_RFE to select some features, that are useful to tea plantation extraction, from a large number of spectral, textural and topographic features. The overall accuracy is 94.65% while the kappa coefficient is 0.93. The producer accuracy and user accuracy of the tea plantation are 91.64% and 92.91%, respectively. (3) In 2019, the tea plantation area in Fujian province was 1913 km2. Tea plantations were mainly distributed in Anxi County, Fuding City, Fuan City, Wuyishan City, and Shouning County, with a total area of 910 km2, accounting for ~48% of the entire tea plantation area in Fujian province. The cloud computing technology based on GEE platform can overcome the problem of lacking computing power for large-scale tea plantation monitoring. This research can extract tea plantation distribution in Fujian province accurately, which has reference value for tea plantation and other crop extraction in hilly and mountainous areas of South China, and provides support for the government and related departments to manage tea plantation.