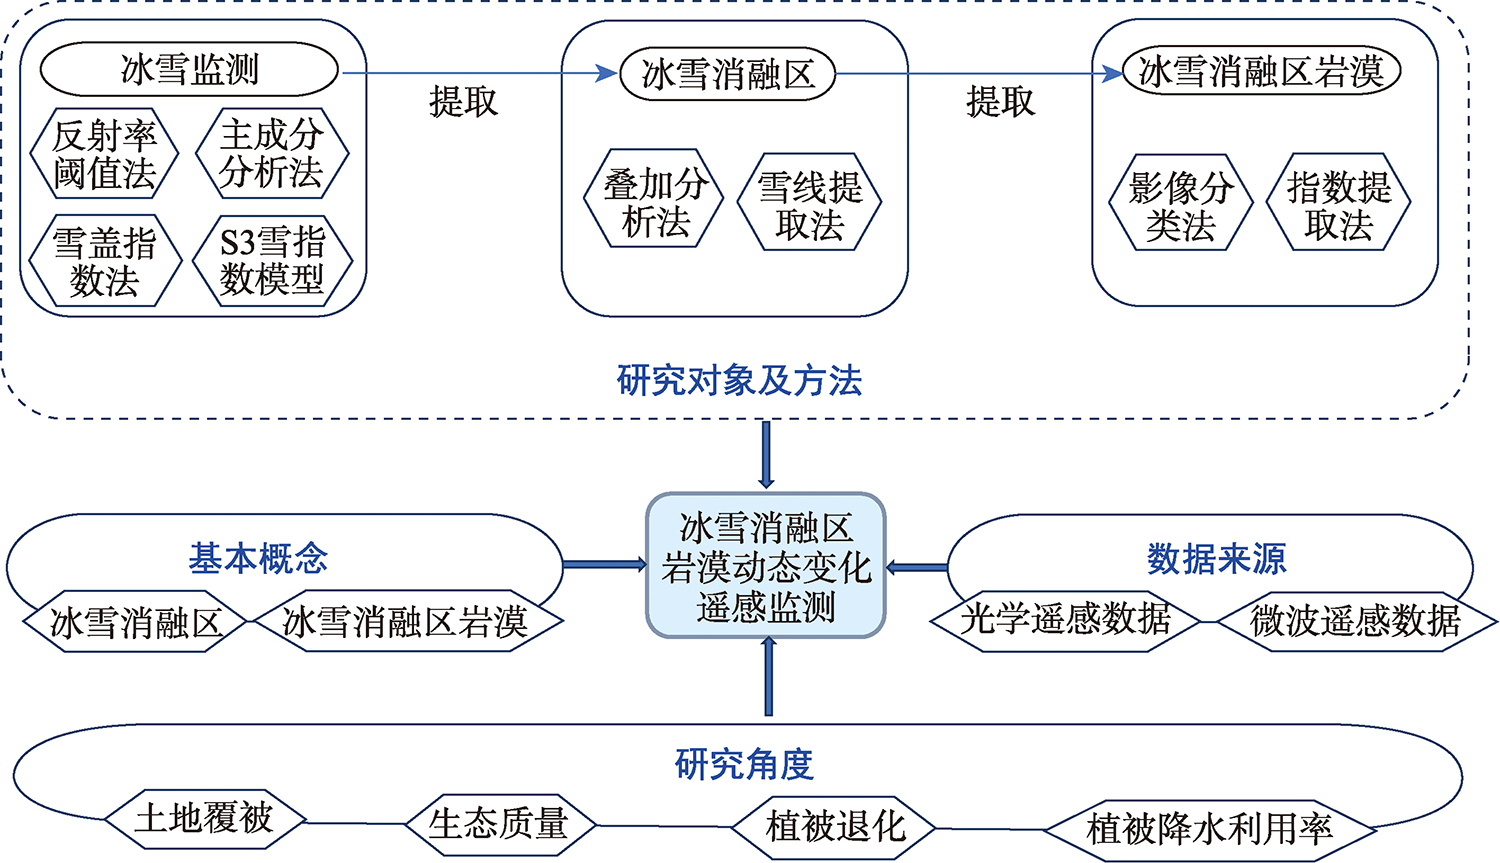
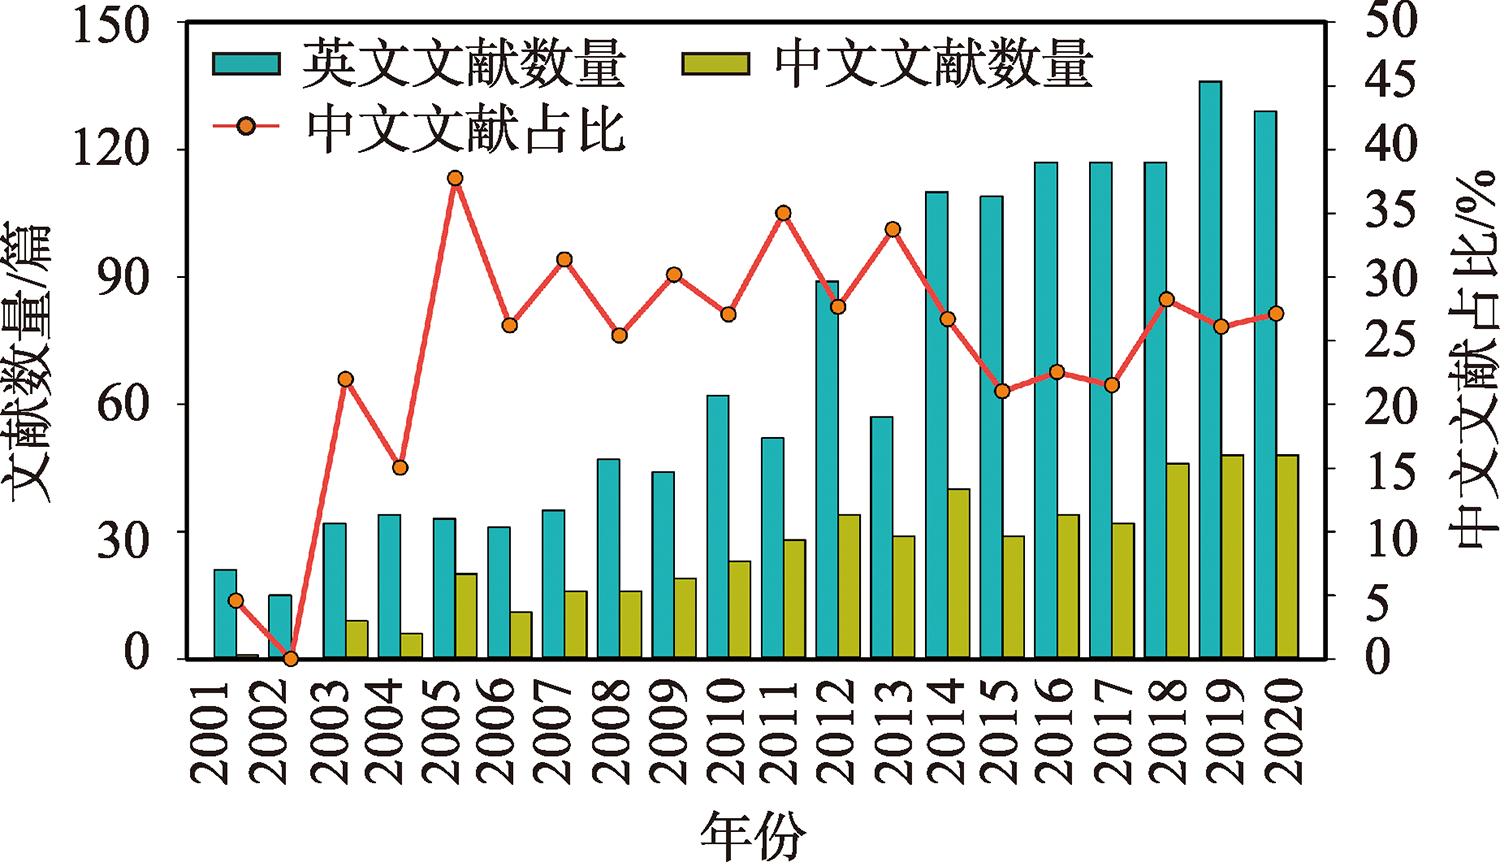
The Qinghai-Tibet Plateau is sensitive to climate change. At present, relevant researches mostly focus on the dynamic changes of ice and snow in the Qinghai-Tibet Plateau, and seldom pay attention to the dynamic changes of the rocky desert left by the melting ice and snow. Through the earth-atmosphere interaction, rocky desert may change the regional heterogeneity of climate at a large scale. This paper sorted out the extraction methods of remote sensing monitoring of ice and snow melting and rocky desert dynamic changes in the Qinghai-Tibet Plateau, and analyzed the advantages, disadvantages and applicability of various remote sensing data and extraction methods. We also summarized the data and research methods of the dynamic monitoring of ice and snow and the dynamic changes of the rocky desert in the Qinghai-Tibet Plateau. At present, the remote sensing monitoring data of the snow and ice dynamic changes in the Qinghai-Tibet Plateau are diverse and the research methods are mature. However, the remote sensing monitoring of the rocky desert dynamic changes left by the melting ice and snow has not yet formed a systematic study. Besides, under the condition of insignificant human disturbance, the dynamic changes of the rocky desert in the ice and snow melting area can also be used as a supplement to remote sensing monitoring of ice and snow dynamic changes.
Soil moisture is a key parameter to connect the land surface water cycle and the land surface energy cycle. Accurate soil moisture is great important to understand the climate change process, the land surface hydrological process, the mechanism of energy exchange between the earth and the atmosphere and so on. Due to its relatively suitable detection depth and strong theoretical foundation, microwave remote sensing has great advantage in observing land surface soil moisture. Combined with retrieval method, microwave remote sensing can obtain spatial continuous land surface soil moisture information easily, which is helpful to comprehend the spatiotemporal evolution mechanism of soil moisture more objectively. With the gradual enrichment of microwave remote sensing data, various soil moisture microwave remote sensing retrieval methods have been proposed one after another. In order to better investigate these soil moisture microwave retrieval methods, this paper summarizes the current satellite microwave remote sensing data which is commonly used in soil moisture retrieval research and analysis the development of these data source at first. Then the principles, development process, advantages and disadvantages of various soil moisture inversion methods are sorted out systematically from the three aspects of active microwave soil moisture retrieval, passive microwave soil moisture retrieval and multi-source collaboration soil moisture retrieval. Finally, three development trends of soil moisture microwave remote sensing retrieval method are summarized as follow. First, the space-time universality of soil moisture microwave remote sensing inversion method is gradually increasing. Second, soil moisture microwave cooperative retrieval methods for high spatial and temporal resolution are developing rapidly. Third, the intelligent level of soil moisture microwave inversion method is improving continuously.
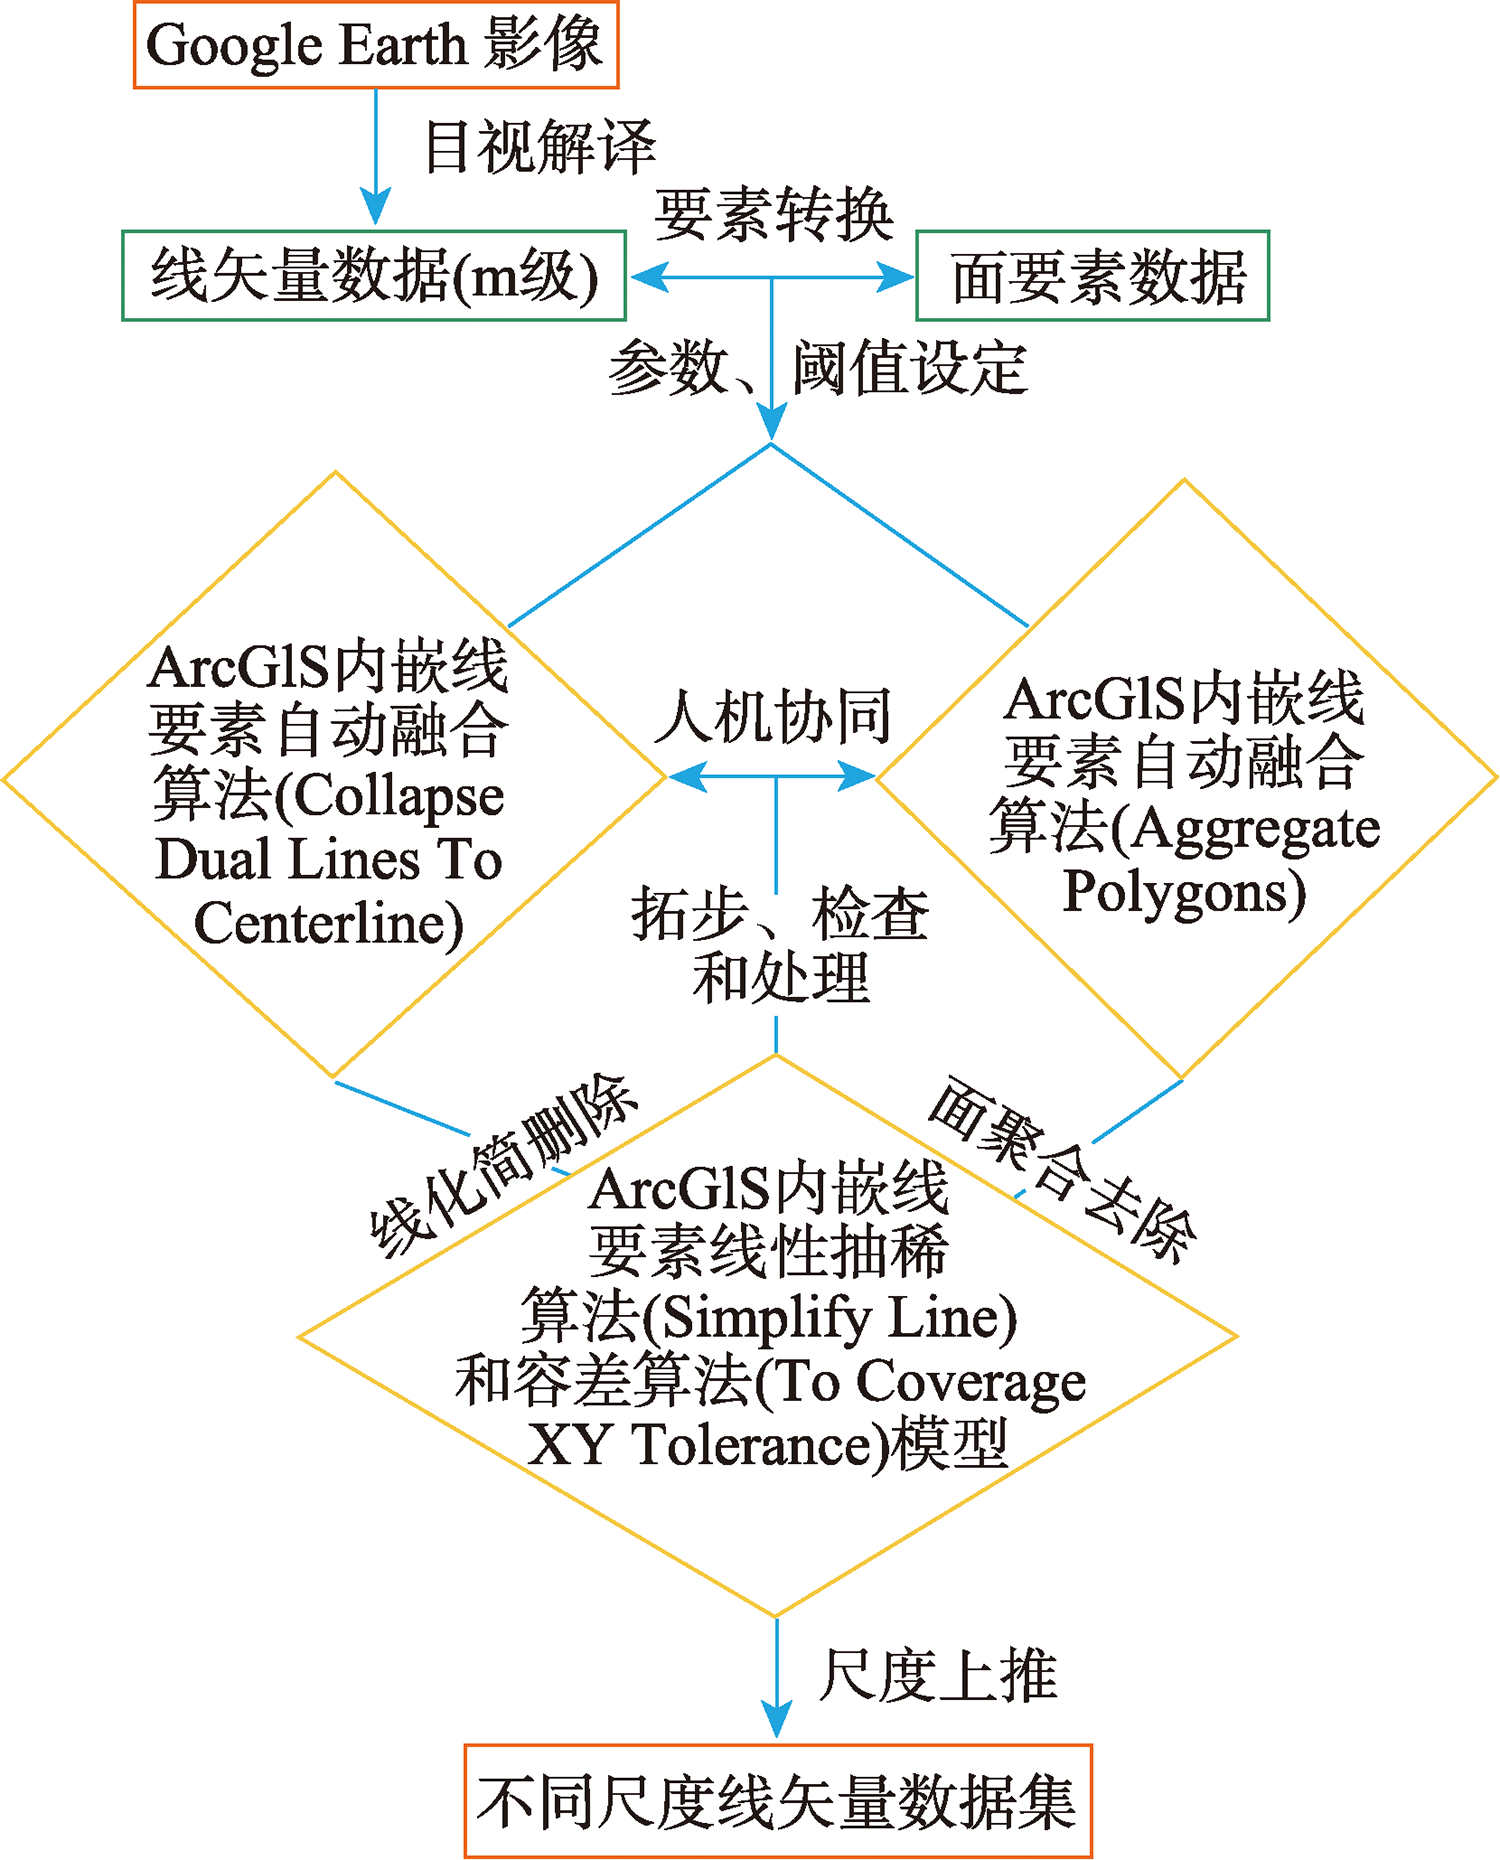
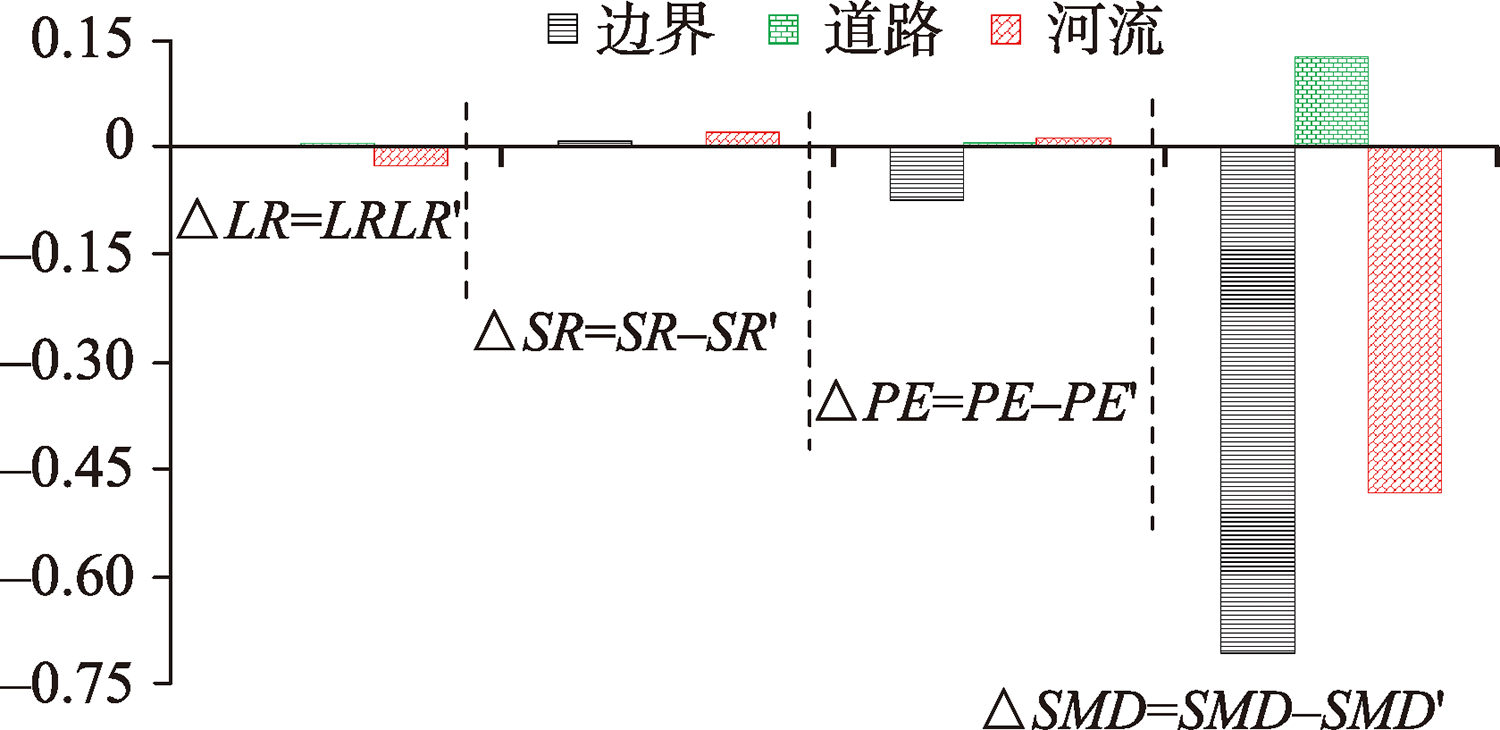
Multi-scale of geospatial data is the cornerstone of cartography, and plays a key role in supporting geographic element analysis and feature recognition. Multi-scale vector data can be generated by selecting, simplifying, aggregating, or other processing of geographic element vector data of a certain scale obtained from remote sensing images. However, a variety of comprehensive processing models and methods will also lead to various levels of information loss in multi-scale vector data. The global coastline is a geographic information element with a wide coverage area, complex curves, various island combinations, and complicated structures of land and water regions. The variation of coastline vector data attributes shows different properties at different scales. For the special coastline vector data, there are multiple influencing factors, and the relationships between them are ambiguous. Therefore, it is impossible to judge the attributes of the elements only based on the combinations of a single or a small number of characteristics of the node or line elements. Meanwhile, using a single mathematical model or algorithm for simplification, the drawing effect often has a large deviation from the actual situation, and it cannot meet the drawing needs of different regions and different scales. Thus, we used Geographic Information System (ArcGIS 10.6) technology to support the automatic comprehensive function of geospatial data mapping, integrated different embedded automatic algorithms and models, and combined human-machine collaboration to build a systematic scale-up method system to achieve different scales of coastline data. Based on fractal theory, the concept of line vector data complexity index was first proposed to characterize the coastline geographic elements and to compare the degree of declination of their information. With the m-scale coastline data interpreted by manual visual interpretation, the scale-up is used to generate coastline data on the scales of 30 m, 250 m, and 1 km, respectively. The information loss assessment was performed on the obtained 30 m, 250 m and 1 km coastline vector data, and the results showed that the mapping integration caused changes in the spatial attributes of land and water. There are significant differences in the fineness of geographic element information represented by different scales. Compared with the m-scale coastline data, the loss of the number of islands on the scales of 30 m, 250 m, and 1 km is 32.07%, 90.46%, and 98.61%, respectively, the information loss of the coastline length is 6.32%, 49.26%, and 75.47%, respectively, and the information granularity of the vector data of the coastline of South America is reduced by 1.97%, 25.33%, and 45.39%, respectively. With the processes of the up-scale of the coastline, it has an increasing trend of the median, mean of the islands area and their complexity index from the m-level to 30 m, 250 m, and 1 km scales. The scale-up method constructed in this paper to combine the computer automatic synthesis model with the artificial processing of the coastline vector data has the potential to efficiently realize the scale-up of the coastline vector data, and describe the information loss of vector data at different spatial scales.
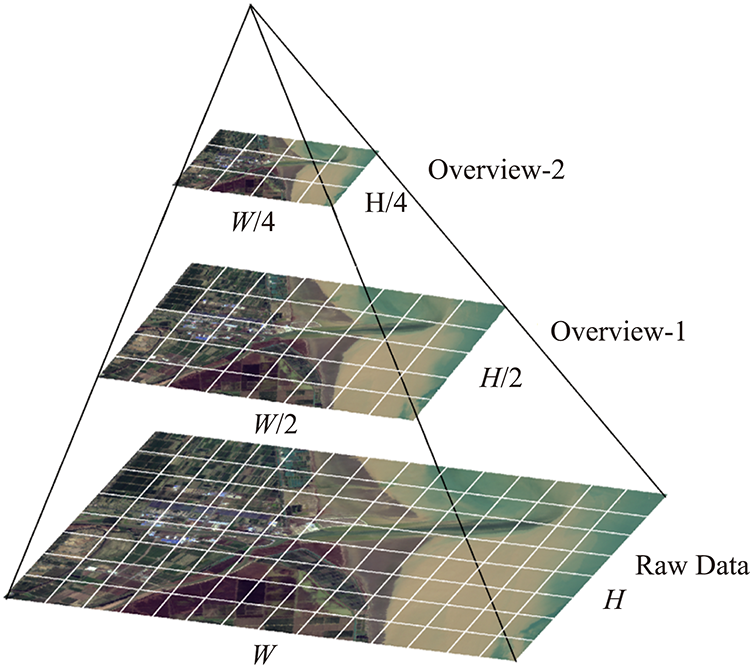
With the rapid growth of remote sensing data, greater challenges arise in raster data efficient processing and value mining. Traditional map services focus on content sharing and visualization, but lacking real-time image analysis and processing functions. In this study, the real-time analysis and processing capabilities of raster tile data are realized in the form of map service. The cloud optimized GeoTIFF (Cloud Optimized GeoTIFF, COG) is used as the data organization method. The distributed collaborative prefetching strategy is designed to realize the raster tile loading in a cold or hot way, which optimizes the efficiency of reading image data from the cloud. Based on the efficient raster tile data loading, an expression-based raster tile processing model is proposed. By converting the expression into a calculation workflow, the raster tile is processed in the request of the map service in real time. The massive remote sensing data stored in the cloud is quickly analyzed to realize the direct visual conversion from raw data to products. For scenarios where full data are involved, use appropriate resampling data to simplify calculations to meet the real-time performance of map services. Three types of different complexity models, NDVI, ground object classification, and fractional vegetation cover, are used to perform real-time calculation and analysis on Landsat 8 images in the map service. Experimental results show that the processing model can effectively analyze raster tiles, and can be extended in a distributed manner. It can provide stable map service capabilities in high-concurrency scenarios, adapt to calculations at various levels and scales, and contribute a new idea to the future development of map service.
Map generalization is in essence a spatial similarity transformation of maps. Studying the Douglas-Peucker algorithm and its parameter setting is in essence studying the relationship between the optimal distance threshold of the algorithm and map scale change. However, the quantitative relationship between them is still unknown, which leads to strong subjectivity in parameter setting and selection of simplification results. Therefore, in order to realize the automated simplification of polyline based on DP algorithm, this paper proposes to take the spatial similarity evaluation model of multi-scale polylines as the coincidence point, and determine the quantitative relationship between them using the principle of threshold parameter optimization. The results indicate that quadratic function is the optimal function to describe the quantitative relationship between the optimal distance threshold and map scale change. It is feasible to use the same optimal distance to automatically simplify the polylines from the same geographical feature area based on the Douglas-Peucker algorithm, such as the polylines from the Lower Yangtze River plain. The simplification results match well with the existing target scale data. However, it is unreasonable to use the same optimal distance threshold to simplify the polylines from different geographical feature areas, such as polylines from the Lower Yangtze River plain and the Jianghuai plain. Therefore, different optimal distance thresholds should be selected to realize full automated simplification of DP algorithm for polylines from different geographical feature areas.
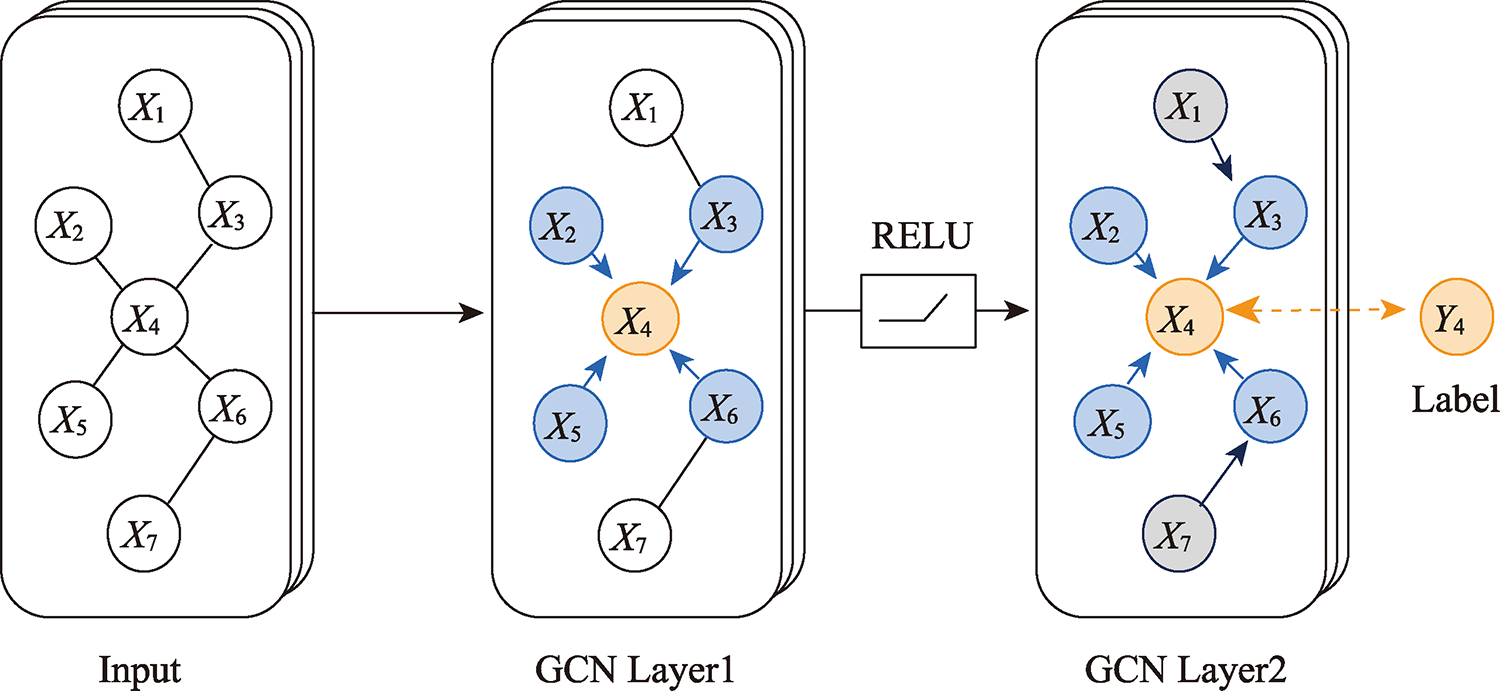
The home locations of social media users are essential for a wide range of applications in real-world. The social media text published by users from different regions possesses quite a few differences in expression mode, semantics, and other contents. In general, users with close social relationships live closer to each other. Therefore, both text and social network can be used to infer the home locations of users. The existing user’s home location prediction methods based on social network and text are not sufficient to mine the location indicative features in user text, while the location indicative information such as toponym in text provides the most useful location signals. Therefore, we proposed a location prediction method for social media users based on Geographic Entity Recognition (GER) and Graph Convolutional Network (GCN). Firstly, the user text was filtered by the geographic entity recognition method to highlight the location indicative words. Then, the social networks were extracted based on mentioned relationships and following relationships. After that, we combined social network and user text content that contains location indicative words. The method based on graph convolutional network was used to predict the user's home location. Finally, we compared the GER-GCN method with the GCN method and the latest research results, and explored the small sample learning ability of the model and its influencing factors. Experiment results based on the GeoText dataset and two datasets of microblog show that, firstly, GER text filtering method can significantly improve the accuracy of user location prediction. The improvement effect of this method is more significant for the dataset with more microblogs of users, which indicates that the GER text filtering method is more suitable for the social media dataset with more microblogs of users. Secondly, in the experiments of different datasets, the prediction accuracy of GER-GCN method is invariably the highest among all methods. In the experiment of GeoText benchmark dataset, the prediction accuracy of GER-GCN method is 1.03% and 1.87% higher than that of GCN and MENET methods, respectively, which indicates that the GER-GCN method is more competitive than the latest research results. Thirdly, in a realistic scenario with minimal supervision, we confirm that the GER-GCN model possesses a certain small sample learning ability, and find that the quality of social networks plays a decisive role in its small sample learning ability. The experimental results demonstrate the excellent performance of the GER-GCN method, and the method is in line with the application requirements of social media in the realistic scenarios.
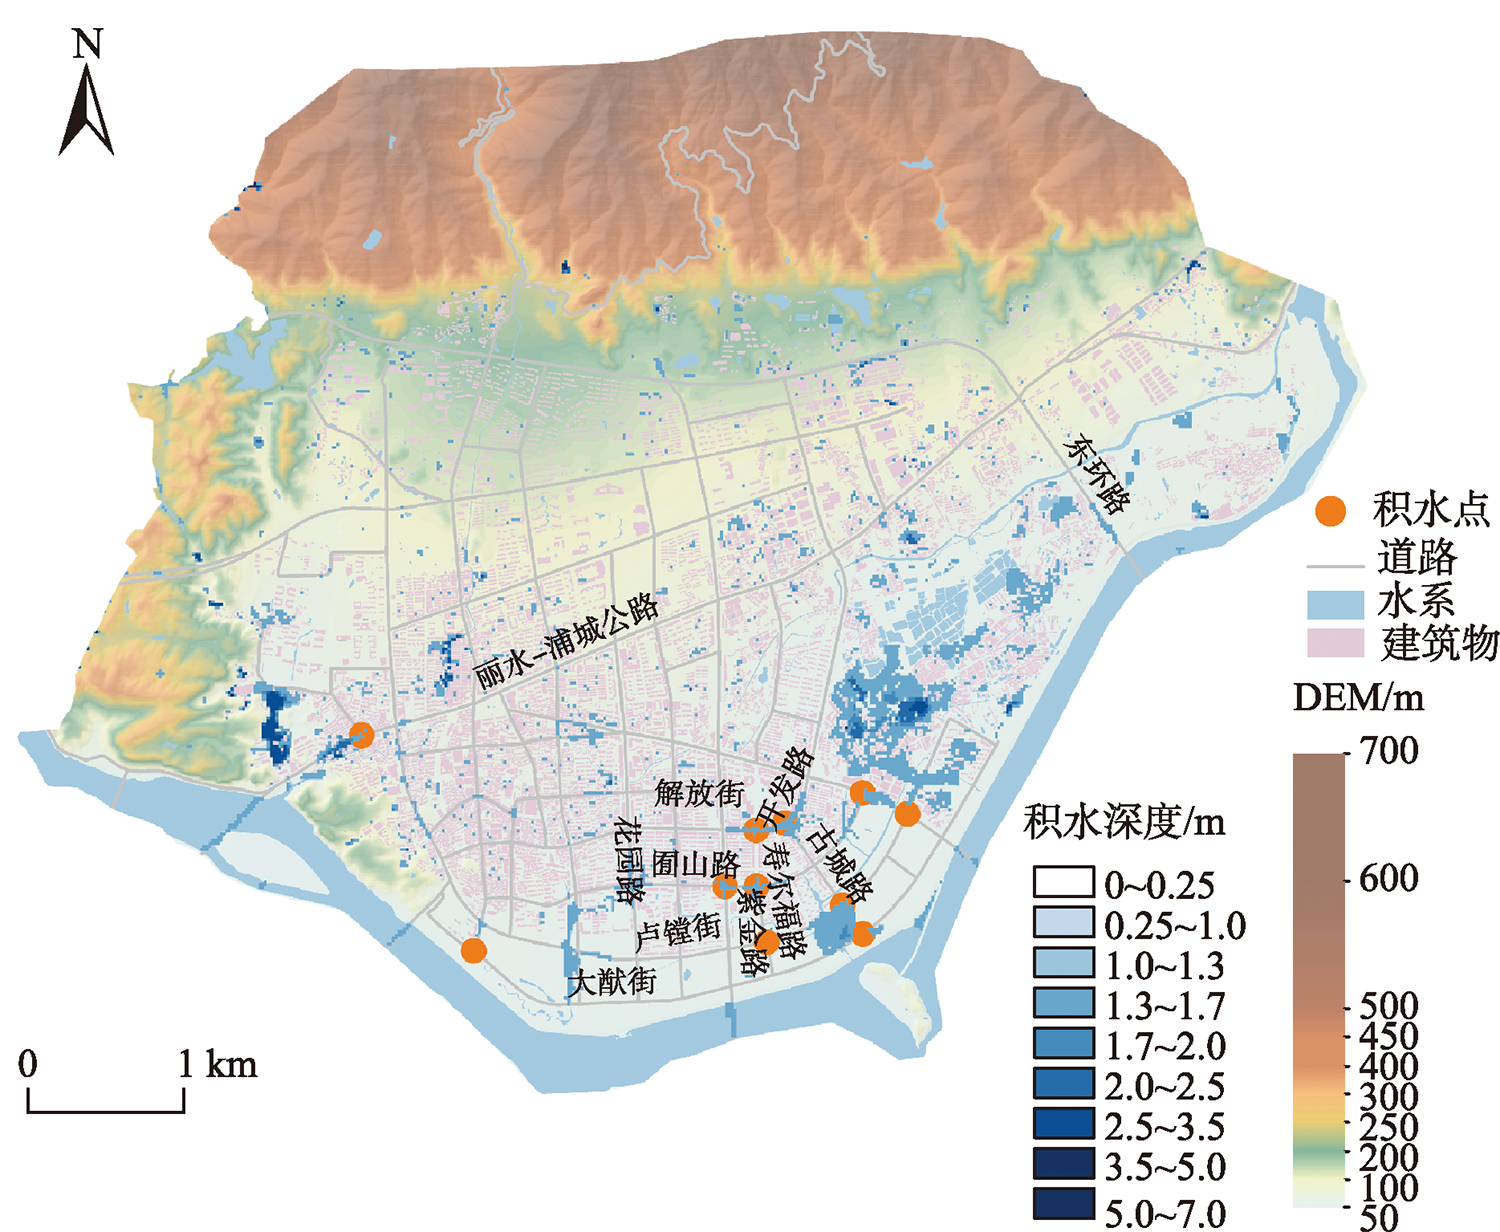
With the intensification of global climate change and the development of urbanization, the impact of heavy rains and floods on urban social and economic activities has become serious. As an important method to quantify the hazard impact and socio-economic loss, and to conduct risk assessment in urban hazard research, study on Urban Vulnerability to Flood Hazard (UVFH) is of great significance to flood risk management and planning. It can also contribute to interpretation of "human-earth" relationship and the effect of human activities on eco-environmental systems through geography and other related disciplines. Recent research has extended the connotation of vulnerability and enriched the indicator system. Their findings can reflect the overall features of urban vulnerability in a period. However, the current studies are still incapable of achieving vulnerability evaluation considering spatial heterogeneity and dynamic characteristic simultaneously. Therefore, in view of the research on flood hazard vulnerability, this paper proposed an agent-based computing model for UVFH calculation by considering its dynamic characteristics. Firstly, after analyzing the dynamic characteristics of UVFH, the computing framework of UVFH is designed, which sets up the quantitative model, and puts forward an agent-based computing method of UVFH. This framework models the flood hazard in four parts: urban environment, flood simulation, agents, and multi-agents' behaviors. Various environmental and socio-economic indicators are selected comprehensively to quantify the urban exposure, susceptibility, and adaptability. Secondly, by coupling the LISFLOOD-FP and SWMM model, the dynamic changes of hazard drivers are simulated. Moreover, the multi-agents' behaviors are designed to simulate hazard bearers' response to flood hazard. By computing the dynamic indicators of exposure and susceptibility, the UVFH can be simulated dynamically. The agent-based computing method highlights the dynamic characteristics of UVFH, thus can be used to simulate different scenarios. Thirdly, taking the Liandu District in Lishui City, Zhejiang Province as an example, two scenarios of 50-year flood hazards with different occurrence times were designed on the NetLogo platform. The results showed that the occurrence time of flood hazard made a difference to overall vulnerability, and people's daily routines had a great impact on the degree and distribution of vulnerability. Moreover, the contributions of exposure, susceptibility, and adaptability to vulnerability varied in places. The agent-based computing model of UVFH proposed by this paper can help discover the “vulnerable zone” of a city, and provide methodological supports for the spatio-temporal variation analysis of UVFH and the assessment of regional dynamic vulnerability, thus providing effective guidance for refined flood hazard management.
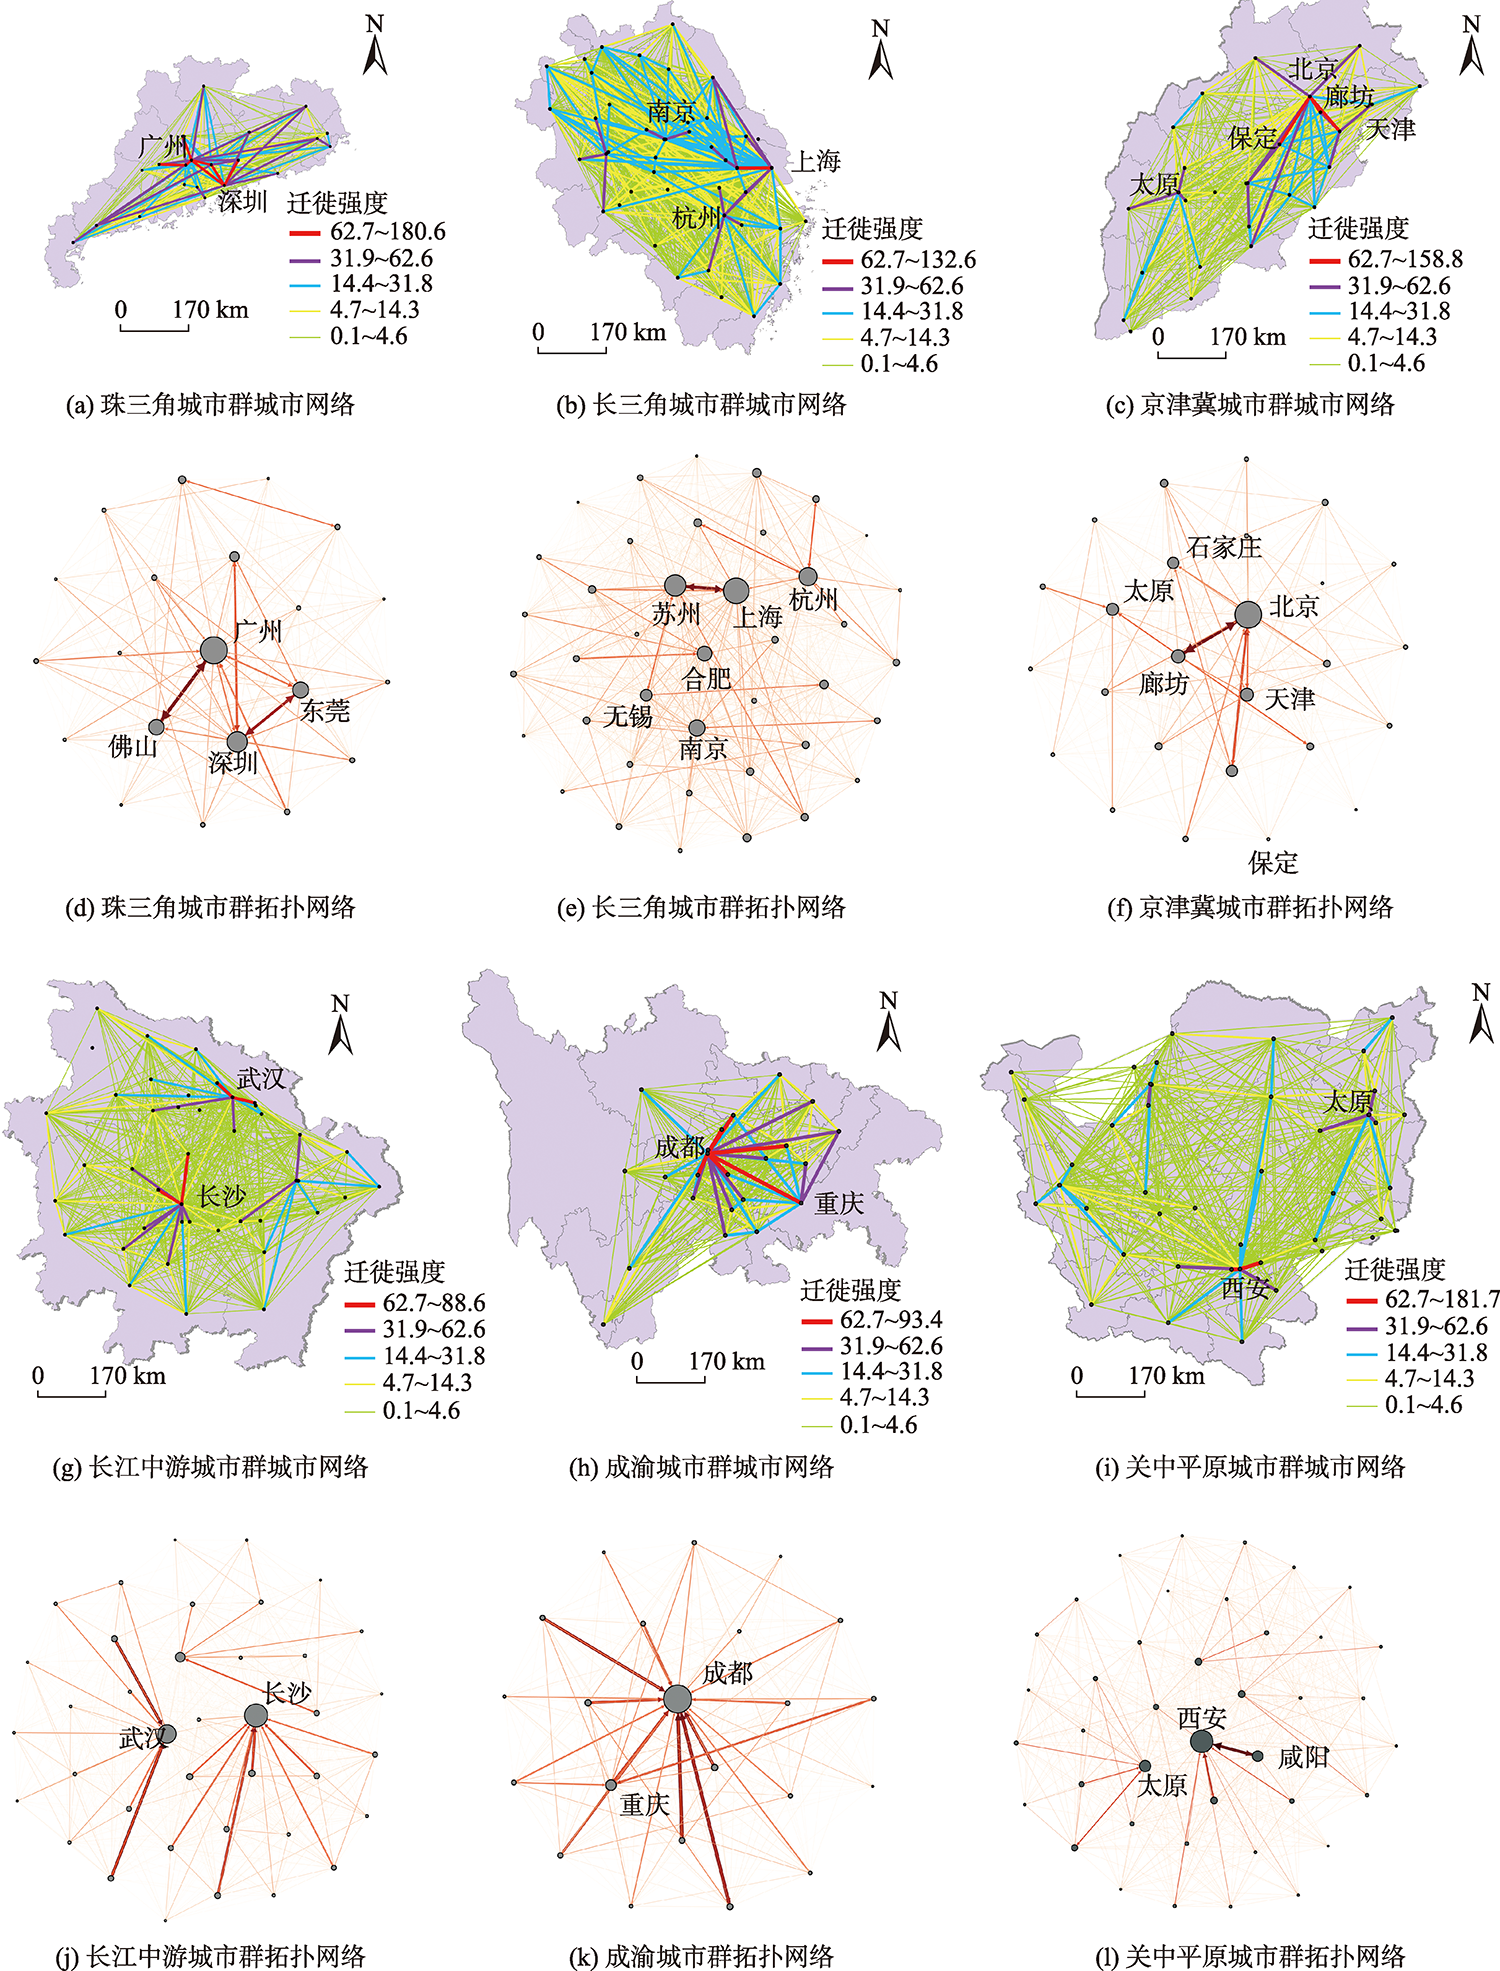
As a new product of the Internet era, migration flowed is the basic carrier of information flow, capital flow, traffic flow and other flow space. It can objectively reflect the geographical behavior relationship between cities, and it is of great significance to depict the urban network structure. Based on the big data of Baidu migration in cities above prefecture level, this paper attempts to explore and study the characteristics of urban network structure in China from the perspective of full time and net migration, and extracts the hierarchy, association and influencing factors of urban network. The results show that: the national urban network presents a stable and hierarchical pyramid and four vertex "diamond" structure, which is consistent with the spatial distribution of economic scale of major urban agglomerations; the regional network shows the core periphery radial structure of agglomeration to high-level administrative centers. The typical small world characteristics with provincial capital cities as the core are relatively prominent, and the accessibility and connectivity of small world network are high. As far as cities are concerned, Zhoukou, Fuyang, Ganzhou, Shangrao and Chongqing are the main export areas of population resources, while Shenzhen, Dongguan, Guangzhou, Beijing and Shanghai have become the main gathering places of migrant population, and the corresponding population transportation network has been formed. Administrative status, economic scale, transportation hub construction, population resources and other factors all play a decisive role in the control and influence of cities in the urban network. Finally, combined with the characteristics of China's urban network structure and its main influencing factors, the paper puts forward relevant policy suggestions, in order to provide reference for the balanced development and construction of China's urban network structure.
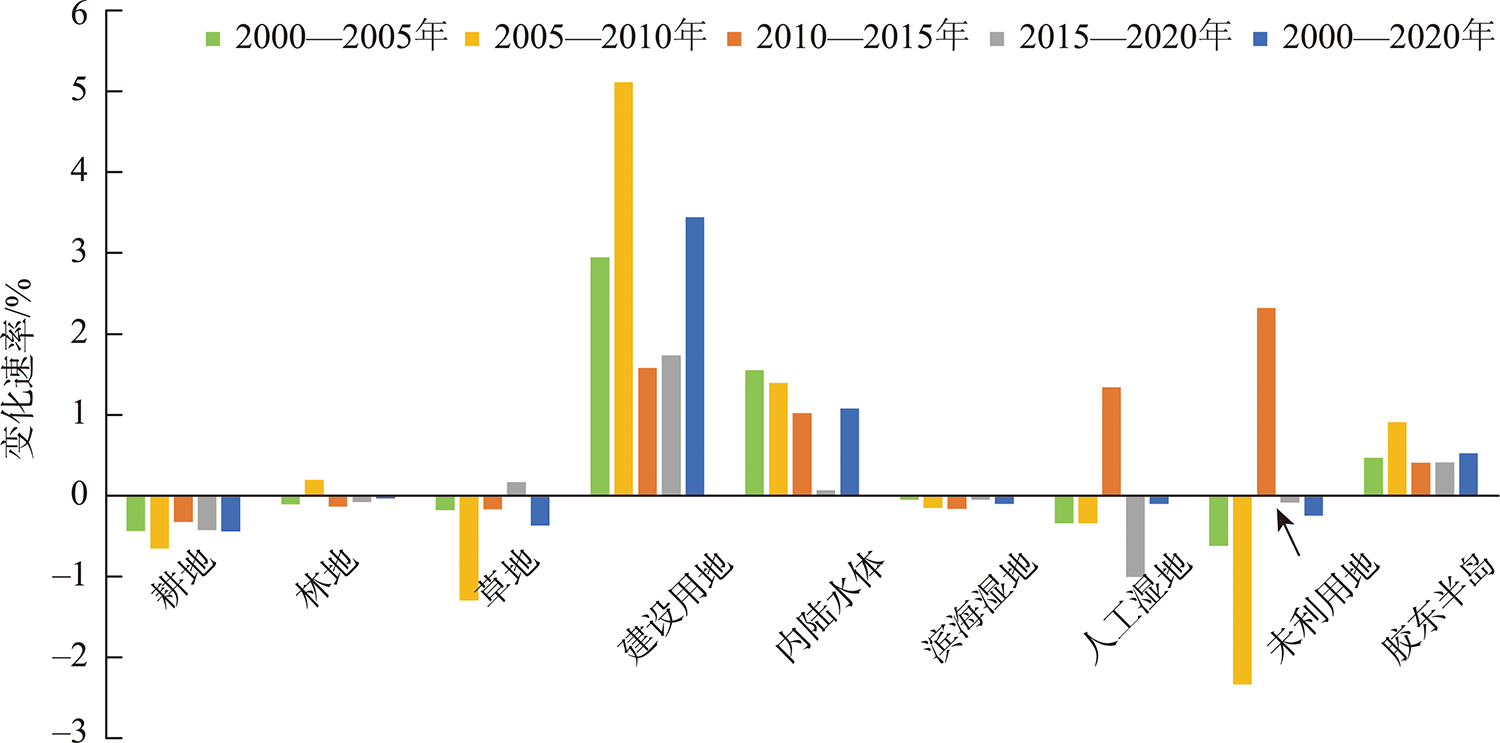
With the development of economy and society, human activities are more and more intensive. Habitat quality is increasingly threatened by conversion of land use caused by human activities. Therefore, it is of great significance to monitor and evaluate habitat quality. There's a long history of development in the Jiaodong Peninsula area, and the intensity of production activities is high, which seriously threatens the habitat quality in this region. Based on the land use data of 2000, 2005, 2010, 2015, and 2020, by using GIS spatial analysis technology and InVEST-Habitat Quality model, this paper quantitatively describes the spatial-temporal characteristics of land use and habitat quality in Jiaodong peninsula and detects hotspots of habitat quality changes as well as the impact of land use changes on habitat quality changes. The results show that: (1) Farmland is the main land use type in Jiaodong peninsula over time. The overall changes of land use in the past 20 years are that: the area of farmland, forest land, grassland, and coastal wetlands has decreased, and the area of construction land, inland water bodies, and unused land has increased. The increase of construction land and the decrease of farmland are particularly prominent. The rate of the overall land use conversion in this area presents a slow increasing trend; (2) The average value of habitat quality is 0.565, 0.560, 0.552, 0.548, and 0.545 in 2000, 2005, 2010, 2015, and 2020, respectively, showing an overall downward trend. The area proportions of different levels are sorted as medium, high, low, high, low. The area of the medium level has the most significant reduction, while the area of the low level has increased the most significantly. Inland areas with high habitat quality value are sparsely distributed while areas with low habitat quality are spatially aggregated and distributed as continuous blocky areas. The overall rate of habitat quality index is falling slowly; (3) The response of habitat quality to land use change varies spatially. The increase of construction land is the main reason for the overall decline in habitat quality in Jiaodong peninsula. In hotspots where habitat quality is increasing, the increase of coastal wetlands contributes greatly and serves as the main driving factor. In areas where habitat quality is deteriorating, both the remarkable increase in construction land and the scarcity of coastal wetlands or inland water bodies are witnessed. The research on regional habitat quality provides scientific references for land use planning and ecological protection in Jiaodong peninsula.
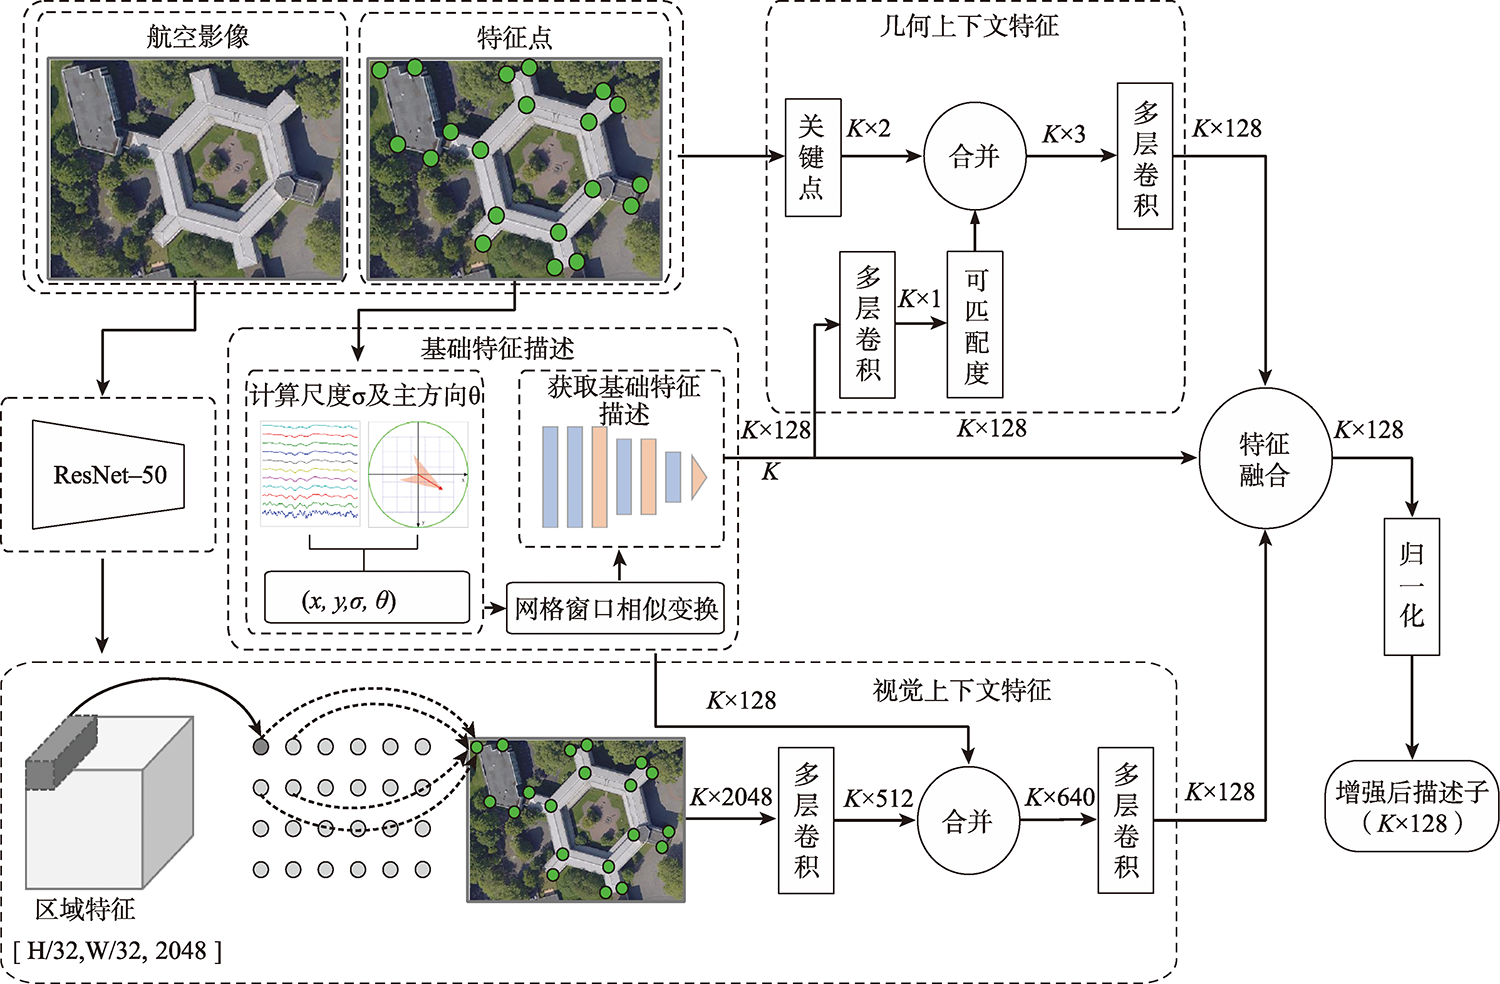
To solve the problem of few points, low recall rate, and low accuracy of feature matching points in oblique image matching by traditional and deep learning methods, we propose a deep learning-based oblique photogrammetry image matching method. Firstly, the oblique image overlapping areas are computed using Position and Orientation System (POS) information. The geometric deformation of the image overlapping areas, caused by large angle change and inconsistent depth of scene, is compensated using perspective transformation. After removing geometric deformation, the transformed images only have small scale rotation changes. Secondly, we trained the feature point detection neural network in two stages to get the multi-scale feature detection network. The pre-trained multi-scale feature detection network is used to infer the Gaussian heat map on the transformed images. The robust sub-pixel feature points are detected in the extreme scale space of the Gauss heat maps, which effectively avoids the influence of image-scale changes. In order to assist feature points description, the feature points scale and direction are obtained based on the pre-trained self-supervised principal feature direction network. In the feature description stage, the scale and rotation invariant GeoDesc descriptor information is obtained by self-supervised feature detection and principal feature direction network. The feature descriptor is enhanced by considering the image geometric and visual context information, which is useful to describe oblique images with large angle change and those with less texture information. Finally, the initial matching points are obtained by a two-stage ratio purification method, which ensures that not many gross errors in the initial points. The mismatches of initial matching points are further removed by fundamental-based Random Sample Consensus (RANSAC) algorithm and geometry-based graph constraint method, which guarantees that the final obtained matching points accuracy is reliable for bundle block adjustment. In order to verify the matching effect of the proposed method, the two typical rural and city area oblique images in ISPRS oblique photogrammetry datasets are selected to qualitatively and quantitatively analyze the matching results of all methods. The experimental results show that our proposed method can obtain lots of uniformly distributed matching points in large scale perspective and poor-texture oblique images. Compared with SIFT, Affine SIFT (ASIFT), SuperPoint, GeoDesc, and ContextDesc algorithms, our proposed method can acquire more robust feature points in scale space of the Gauss heat maps, which is helpful to increase the matching recall rate and accuracy.
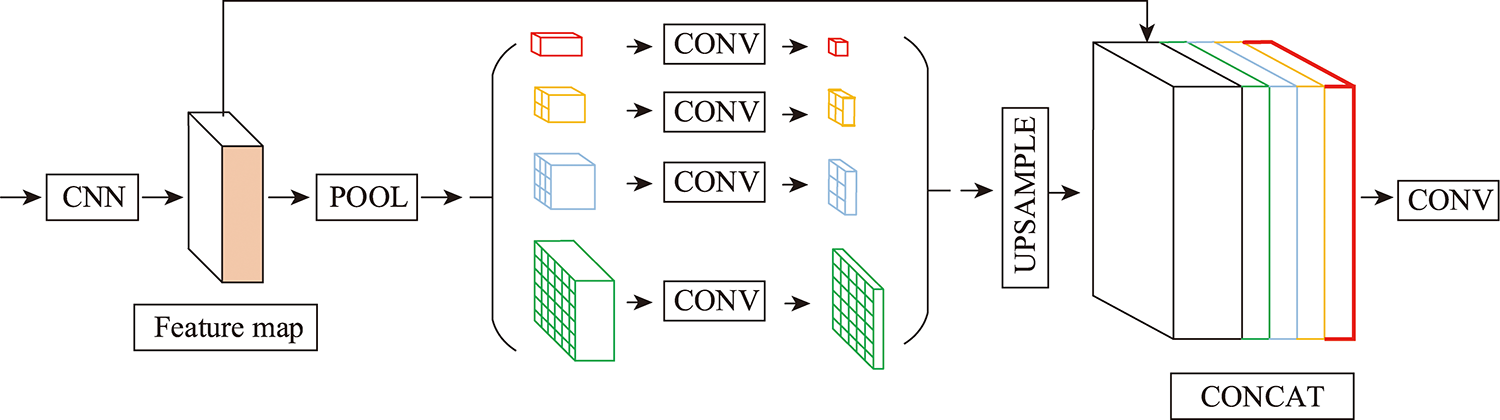
Building extraction based on high-resolution remote sensing images has important theoretical and practical applications. Deep learning has become one of the mainstream methods for extracting buildings from high-resolution images because of its excellent deep feature extraction ability. In this paper, based on an improved structure of deep learning network, we combined the concept of minimum outer rectangle and Hausdorff distance to improve the building extraction method. The main improvements in this paper are: ① Based on the Unet network structure, we employed the multi-scale feature detection ability of Pyramid Pooling Module (PPM), the great feature extraction capability of Residual Block (RB), and the ability to balance spatial and channel information of Convolutional Block Attention Module (CBAM). The PPM, RB, and CBAM were introduced to the Unet model to build the PRCUnet model, which focuses more on semantic and detailed information and overcomes the limitation of Unet in small target detection; ② We improved the building contour optimization algorithm based on the minimum outer rectangle and Hausdorff distance to improve the generalization ability of the model. Experiments show that the accuracy, IoU, and recall of the building extraction method proposed in this paper reached above 0.85 using the test set, significantly higher than those of the Unet model. The PRCUnet model also had better extraction effect on small-scale and irregular buildings than Unet, and the optimized building contours were close to the real building boundaries.
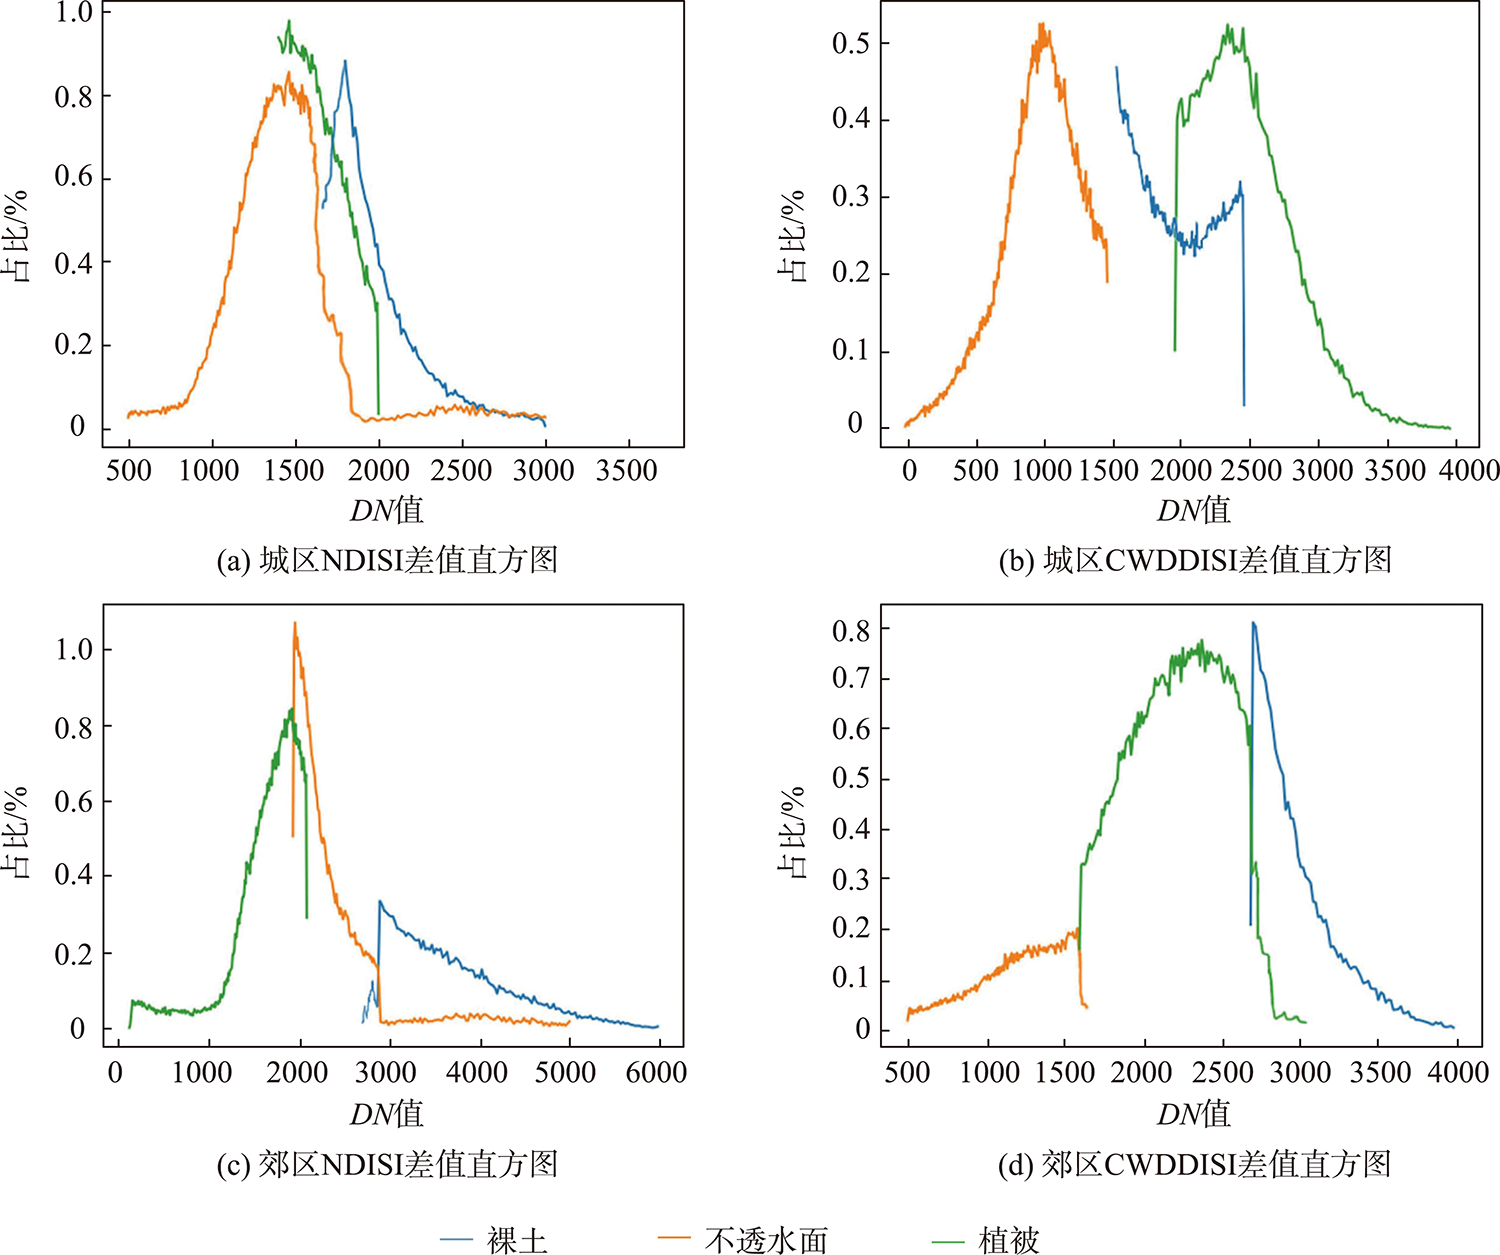
The existing impervious surface spectral indices tend to suffer from the disturbance of sand and bare land, which leads to the unsatisfied results in impervious area extraction. To handle this problem, based on Normalized Difference Impervious Surface Index (NDISI), this paper proposes a Composite-Weighted Double-Difference Impervious Surface Index (CWDDISI). CWDDISI increases the gap of spectral feature between the Impervious Surface (IS) and bare land by measuring two difference calculations with the specific three bands. Then, by integrating the Normalized Difference Vegetation Index (NDVI) and night-time light luminosity, CWDDISI achieves the constrain principle, which works to enhance impervious surface information while depressing bare land characteristics in the thermal band. In this paper, remote sensing data of Landsat8 OLI-TIR, Landsat7 ETM+, Sentinel-2A, Luojia1-01, DMSP-OL, and VIIRS/DNB were used. Guangzhou, Shenzhen, Xian, Xianyang, and Beijing were selected as study areas. Comparative experiments showed that CWDDISI performed well across different study areas and landforms. For the dataset of 2018, compared with NDISI, CWDDISI improved the overall accuracy and Kappa value by 6.02% and 0.078, respectively, at Guangzhou, where mountains dominate. In the meantime, CWDDISI improved the overall accuracy and Kappa value by 7.56% and 0.104, respectively, at Xian and Xianyang, where flatlands dominate. For the Landsat ETM+ data in 2002 and 2016, compared with NDISI, the overall accuracy and the Kappa value of CWDDISI had improved by 1.74% and 0.028, respectively, in Shenzhen and improved by 2.13% and 0.076, respectively, in Beijing. After analyzing all these comparative results, this study found that CWDDISI can successfully overcome the confusion between the impervious surface and bare land, which is difficult for most other impervious surface indices. This study provides valuable reference for future researches in impervious surface estimation.
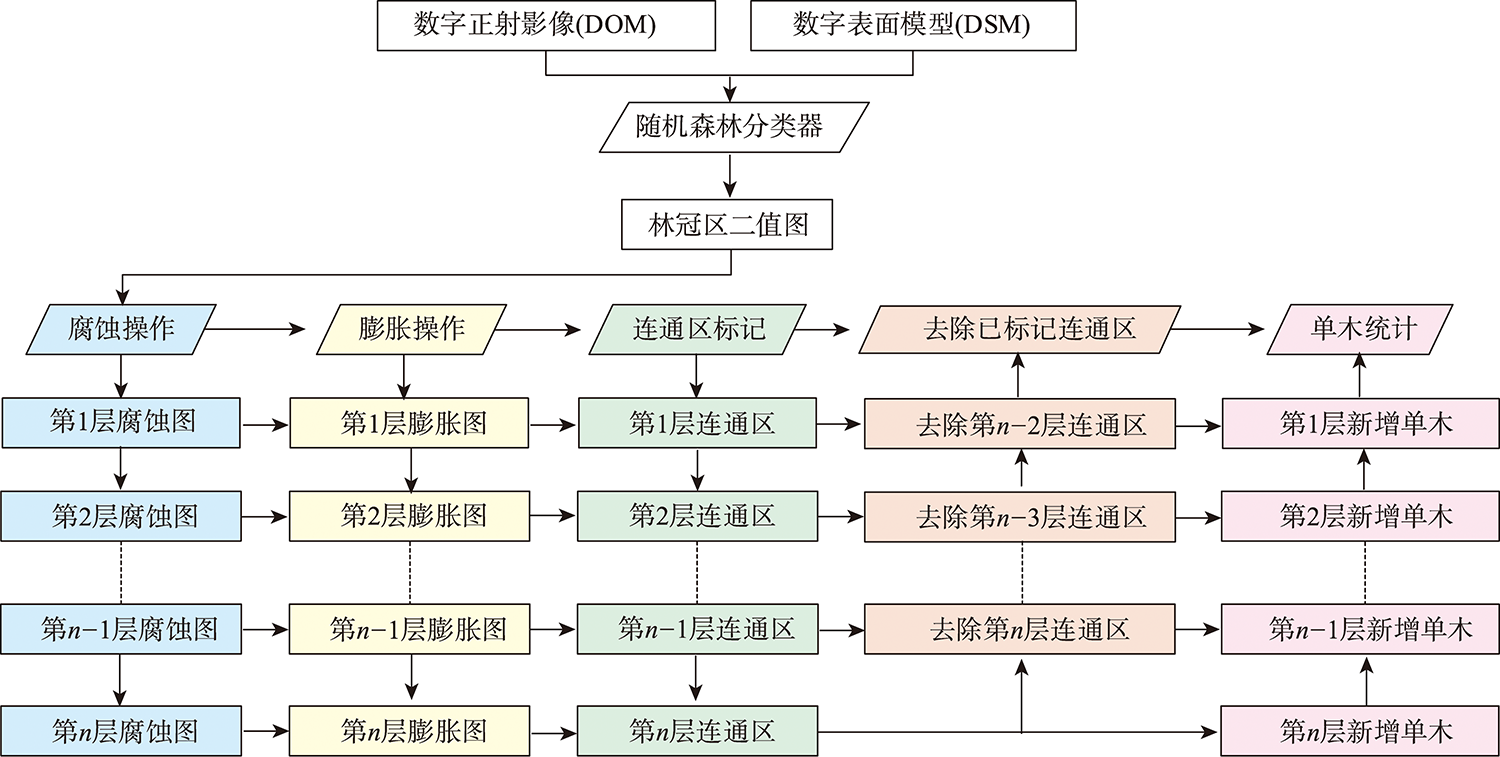
Forest is not only the main body of terrestrial ecosystem, but also one of the most important natural resources for human being. Individual tree parameters are of great significance to current forest resource management, ecological research, and biodiversity protection. However, the traditional forest surveys are realized through manual measurement of each tree, which is labor intensive and low efficient. UAV stereo imagery and individual tree recognition algorithms provide the foundations for low-cost and automatic acquisition of individual tree parameters. In recent years, there are a lot of research on individual tree recognition based on UAV stereo imagery. The existing studies show that the commonly used individual tree recognition algorithm based on local maximum search has a serious problem of missing recognition in dense stands, which affects the accuracy of tree parameters. Therefore, it is necessary to develop a robust individual tree recognition algorithm to overcome the problem of missing recognition for UAV stereo imagery. In this paper, a new algorithm of individual tree recognition in UAV stereo imagery was proposed, which takes into account the three-dimensional morphology of tree crown. Firstly, the height and RGB spectral information of UAV stereo imagery were used synthetically to extract the canopy area based on Random Forest (RF) classifier. Secondly, the multi-layers morphological corrosion, expansion, and connected area labeling were used to separate the connected trees and extract the center coordinates of the tree crown, so as to realize the individual tree recognition. Thirdly, in order to verify the recognition effect of the algorithm on different forest types, four sample plots in Daxing'anling forest region and Wanglang forest region were selected for verification. The visual interpretation data was used as reference and compared with local maximum search algorithm based on elevation value (algorithm A) and local maximum search algorithm based on RGB spectral brightness values (algorithm B). Results show that combination of DOM and DSM can improve the extraction accuracy of the forest canopy area to a certain extent. Meanwhile, the average F1 score of the proposed algorithm in four plots is 94.17%, which is 15.85% and 9.37% higher than those of algorithm A and B. For dense sample plots, the recall of this algorithm is 51.79% and 35.64% higher than those of algorithm A and algorithm B. The proposed algorithm can achieve good recognition effect in different forest areas. Moreover, it can effectively avoid the problem of missing recognition on dense forest stands. This paper provides a new idea for individual tree recognition based on UAV stereo imagery.
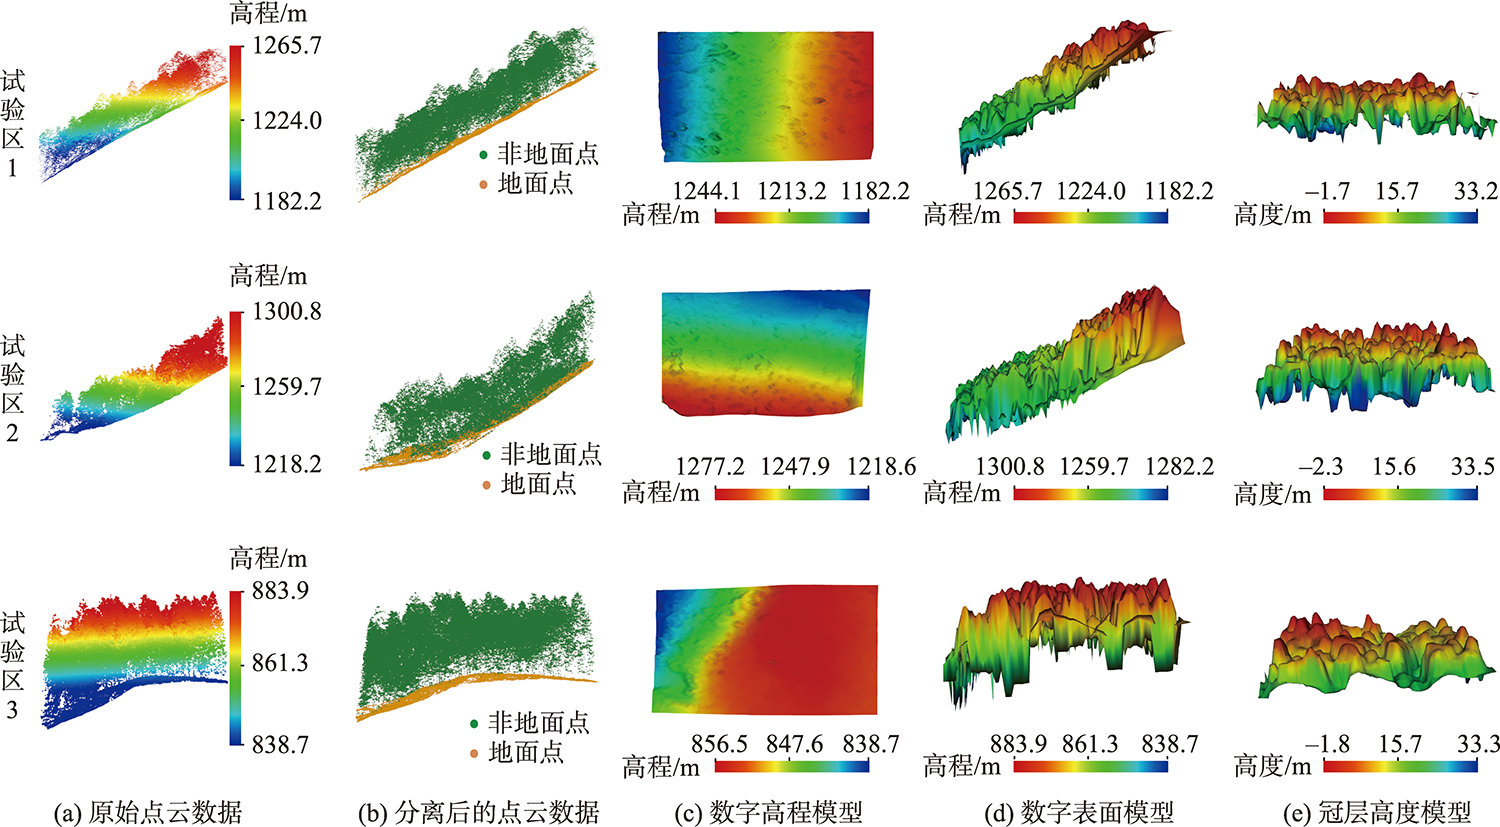
The retrieval of tree height is very important for growth status evaluation and biomass estimation. The Canopy Height Models (CHMs) are commonly used to extract the heights of individual trees. However, airborne LiDAR-derived CHMs are prone to distortion in areas with complex terrain, which significantly limits the extraction accuracy of individual tree height. Therefore, this study aimed to propose a new method, which simultaneously utilized the CHM and Digital Surface Model (DSM) to extract the heights of individual trees. Firstly, the CHM was generated from the preprocessed point clouds using Inverse Distance Weighted (IDW) interpolation algorithm. Secondly, the local maximum algorithm and Mark-Controlled Watershed Segmentation (MCWS) algorithm were adopted to segment the CHM, and thereafter obtain the individual tree crown contour polygon. Thirdly, the local maximum algorithm with a fixed window was applied to the DSM to detect the tree vertices and extract its elevation. Lastly, the tree height was obtained by subtracting the ground elevation obtained by Delaunay triangulation interpolation algorithm. Taking the coniferous forest near Fujiang Village, Xing'an County, Guangxi Province as the test area, this study analyzed the accuracy of tree heights obtained by CHM and our proposed method. For trees located at different test sites with the average terrain slopes of 32°, 25°, and 15°, the coefficients of determination (R2) values of the estimated tree heights based on CHMs are 0.84, 0.85, and 0.87, respectively, while the Root Mean Square Error (RMSE) values are 1.48, 1.41, and 1.58m, respectively. In contrast, the R 2 values of the tree height extracted from our method and the measured tree height are 0.92, 0.91, and 0.93, respectively, while the RMSE values are 0.93, 1.12, and 1.16 m, respectively. Compared with the CHM-based tree height extraction method, the R 2 of our method increased by 0.08, 0.06, and 0.06, respectively, while the RMSE values decreased by 0.55, 0.29, and 0.42m, respectively. The results indicated that, compared with the traditional method, our proposed method can significantly improve the estimation accuracy of individual tree height in areas with large terrain slopes.
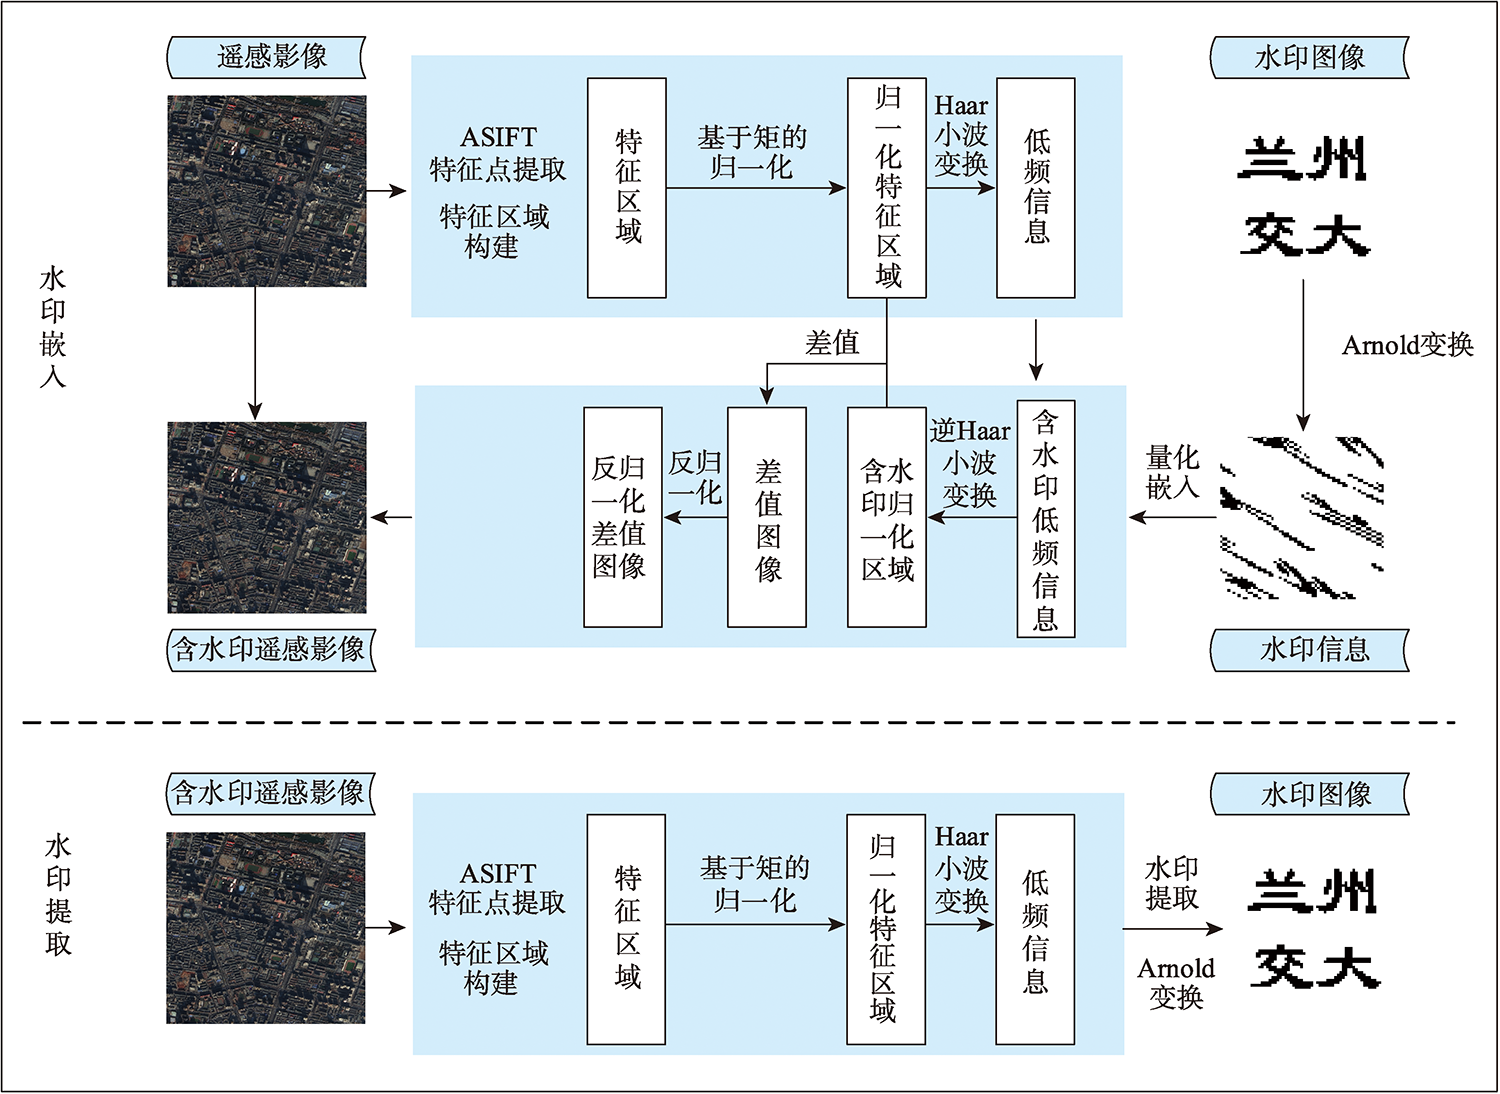
In the process of using remote sensing images, the synchronization between watermark and remote sensing image is disrupted after affine transformation is performed on the watermarked image. Although the watermark is not removed after affine transformation, the size and relative position of the image are changed, which leads to the problem that watermark cannot be detected correctly. It is significant to improve the robustness of digital watermarking. This paper proposes a blind watermarking algorithm for remote sensing image, which can effectively resist affine transformation. Firstly, the affine invariant feature points of the image are extracted by ASIFT algorithm. The stable, evenly distributed, appropriate feature points are selected according to the size of the feature scale and the Euclidean distance between the feature points to construct the corresponding square feature regions. Secondly, take a feature region as an example, the affine invariant moments of the feature region are calculated to normalize the feature region. With the invariant centroid of the normalized feature region as the center, the sub region is extracted as watermark embedding region. The low-frequency information of the watermark embedding region is obtained by two-level wavelet transform. The watermark is embedded into the low-frequency information using the quantization embedding rule to complete the watermark embedding. Finally, inverse wavelet transform of low-frequency information is performed. The difference image of the characteristic region before and after embedding is denormalized. The denormalized difference image is superimposed on the original image characteristic region to complete the watermark embedding. In this paper, a GF-2 remote sensing image of 3000 × 3000 pixels was used as the carrier image, while the binary image with copyright information was used as the watermark. This paper measured the invisibility of the watermark by calculating the magnitude of the peak signal-to-noise ratio. In the robustness testing experiments, the watermarked image was subjected to affine transformation, noise adding attack, and filtering attack. Then, the algorithm of this paper was used for watermark extraction. The watermark with the highest normalized correlation value extracted was selected for robustness evaluation. The experiment results show that, after affine transformation, including rotation, translation, and scaling, the watermark information was accurately extracted from the watermarked remote sensing image through the algorithm. The algorithm is robust to noise, filtering, cropping, and other conventional watermarking attacks. The watermark has good imperceptibility. ASIFT is a blind watermarking algorithm. The watermark detection process does not need the original remote sensing image. Our algorithm has strong practicability.