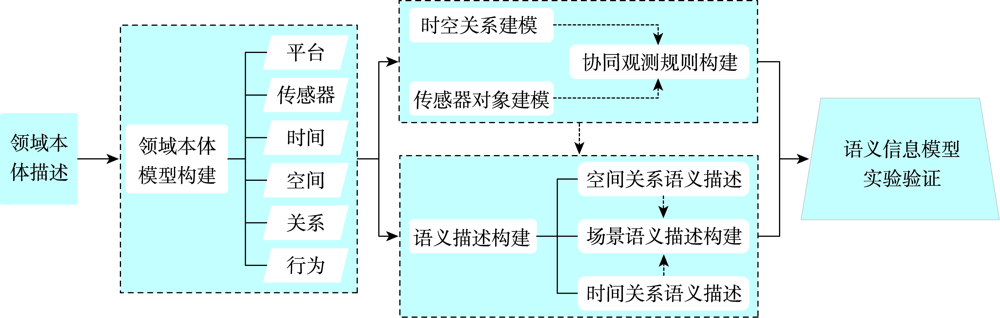
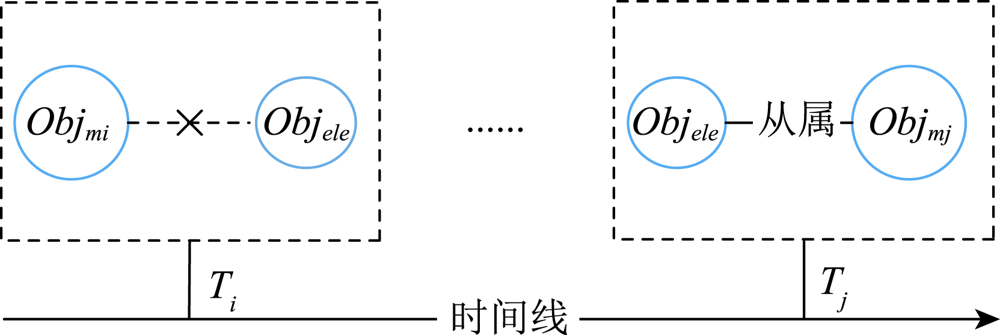
Earth observation technology is an important tool to obtain geospatial information and has now entered the stage of multi-platform and multi-sensor. Obtaining information and knowledge through the semantic modeling of aerospace cooperation earth observation is one of the important methods for the execution and planning of earth observation missions. To monitor the platform operation of aerospace cooperation earth observation and extract information and knowledge to serve the earth observation, a semantic model for aerospace cooperation earth observation is proposed. Firstly, the basic description of the domain ontology for aerospace cooperation earth observation platform is established, which can assist the clarification of research contents. Secondly, considering the correlation between different earth observation platforms and starting from the aspects of platform, sensor, time, and space, the domain ontology for aerospace cooperation earth observation platform is constructed based on Basic Formal Ontology, which is described by using six tuples. Thirdly, based on the modeling of spatiotemporal relationships and sensor objects, the cooperation observation rules for typical applications are formulated according to typical application requirements, to serve the evaluation and decision-making of aerospace cooperation earth observation tasks. Then, the semantic descriptions of spatiotemporal relationships are constructed, and the comprehensive semantic description of aerospace cooperation earth observation is realized by combining the semantic description of static and dynamic scenarios. Finally, in order to verify the domain ontology and semantic description for aerospace cooperation earth observation platform, based on the micro-service architecture and 3-dimension visualization framework, the service experimental system is built to verify the effectiveness of proposed models and methods, which takes Zhengzhou, the provincial capital of Henan, as an example. The aero-based and space-based earth observation platforms are used by the service experimental system to carry out the observation tasks, and the activities of aerospace cooperation earth observation are displayed in real time. Based on the cooperation observation rules, recommendations for the selection of the earth observation platform are given. Results show that the proposed models and methods can effectively represent and display the semantic information of operation status and task performance of aerospace cooperation earth observation, which can be used for mission planning and decision-making of earth observation. In follow-up research, a more refined semantic information model of aerospace cooperation earth observation will be constructed to support more complex earth observation scenarios. At the same time, the construction of cooperative observation rules under different application scenarios will be fully considered, and more accurate and detailed information will be provided for earth observation activities by reasoning.
Geo-setting spatiotemporal analysis is the interpretation, evaluation, and prediction of geo-entities, geo-relations, and geo-structures, and it is an important way to grasp the spatial characteristics of geo-setting and the evolution law of correlation. By using the methods of literature research, analogy induction, and modeling research, this paper puts forward that geo-setting object is the digital expression of the geo-setting entity in the GIS world. The geo-setting object flow is the general term of the material, information, and energy interaction process between spatiotemporal objects. There is a mapping relationship between the geo-setting object flow and geo-relation, which determines the geo-setting situation and evolution processes. Based on the analysis of the related concepts and connotation of geo-setting object flow, the paper discusses the data expression and organization of geo-setting object flow and constructs a geo-setting analysis model. Based on the composition of geo-setting system, the model combines the analysis logic and data format of geo-setting object flow and establishes the logical expression of analysis principle and the expression and organization of geo-setting object data. With the support of data, qualitative and quantitative data analysis can be carried out by using mathematical methods and machine learning to determine the mapping function between geo-setting objects and geo-relations, so as to realize geo-setting analysis for application scenarios and specific problems. Finally, the paper verifies the geo-setting analysis model. Taking the geo-economic analysis of the Indo-Pacific region as an example, based on the top 10 national economic data of the region's economic level from 2009 to 2018, the abstract expression of entities, expression of trade object flows, the objectified organization of data, data analysis, and geo-relations measurement are carried out. The spatiotemporal processes of trade flows, geo-influences, and geo-relations groups are analyzed, and the effectiveness of the model in the geo-setting analysis for specific scenarios is verified.
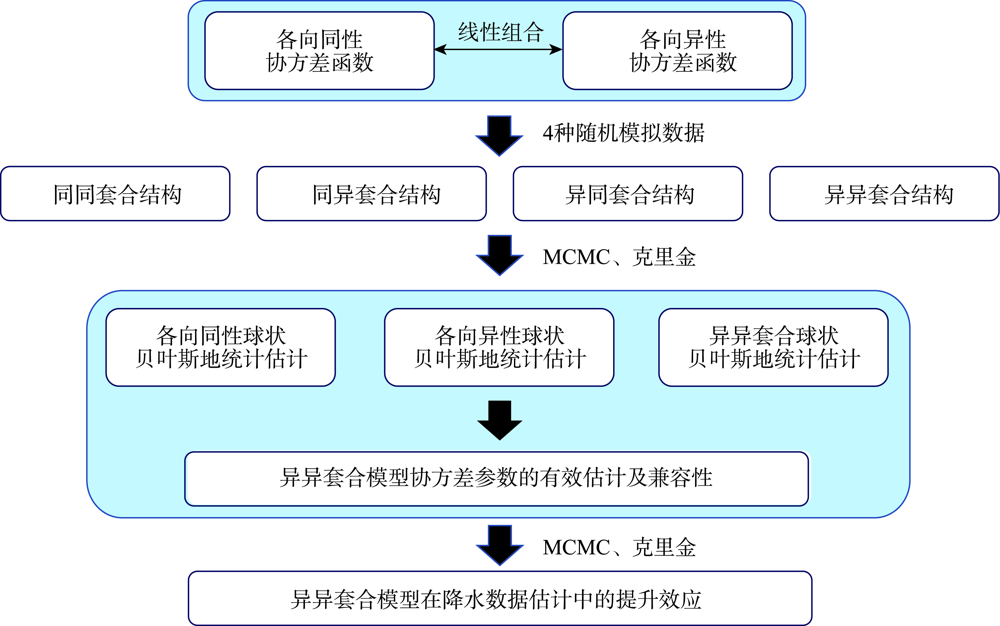
Spatially continuous precipitation data are important data input in hydrological simulation in a watershed, hydrological modeling of land surface, eco-environmental sensitivity evaluation, comprehensive investigation and zoning of geographical environment, and so on. These data are often interpolated from the discrete observations of monitoring points. However, due to the operations and interactions of the underlying physical processes on different scales, the spatial variations of precipitation are generally viewed as a result of the superposition of different geographical processes on multiple scales and directions. The multi-scale, multi-direction natures of geographical processes determine the weights between spatial points, which have an important impact on spatial interpolation. Therefore, it is necessary to establish a multi-scale and multi-direction spatial model to better reflect the dynamic process for regional precipitation estimation and spatial analysis, especially in sparse monitoring areas. Bayesian geostatistical models have the ability of multi-scale and multi-direction modeling and provide a scalable statistical inference framework by integrating observations (external implementation with errors), unknown variables, prior information, and complex dynamical models (real processes). In view of the superposition phenomena of precipitation on scales and directions, this study explored the possibility of decomposition estimates for the sparse data with nested anisotropy based on Bayesian and geostatistical methods to accurately determine the contribution of each independent component. We also further demonstrated the application potential of this model in precipitation interpolation. The results showed that, firstly, the nested anisotropy and multi-scale properties hidden in the sparse data could be well estimated by the Bayesian and geostatistical methods applied in the four random simulations with nested structures using a Fourier integration method. The more complex the model was, the more difficult the estimation was and the stronger the uncertainty was, and the convergence and estimation accuracy could be improved by introducing some prior information. The interpolation accuracy of the heterogeneous models was better than that of the models with simple isotropy or anisotropy. And also the more complex the covariance structure of the data was, the more obvious the improvement effect was. Secondly, complex structures had the ability of downward compatibility with simple structures, but simple structures did not have the ability of upward compatibility with complex structures. Finally, based on the interpolation results, the nested model played an obvious role in improving the accuracy of regional precipitation interpolation, which was about 10% higher than the estimation accuracy of the two basic models. Compared with the two basic structures, the method in this study not only identified two kinds of superposition information but also obtained the contributions of the two components, with a contribution ratio close to 1:1.
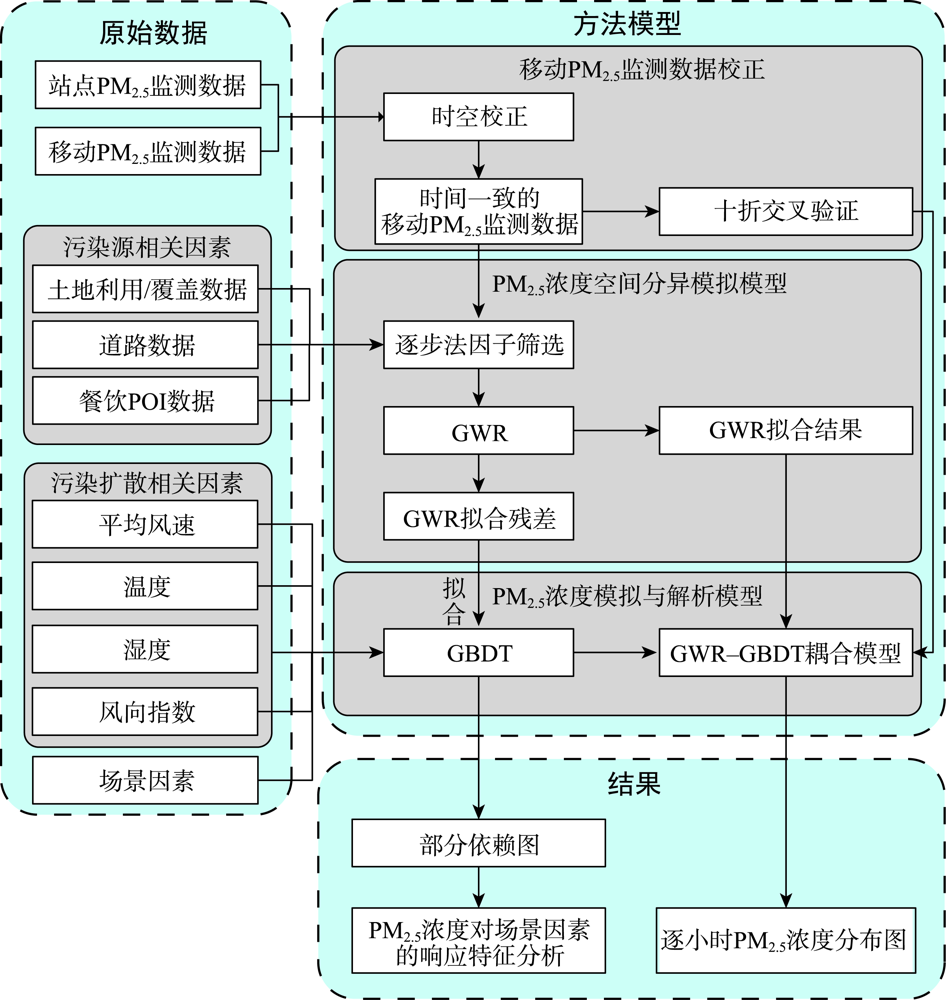
The distribution of PM2.5 concentration has obvious spatial heterogeneity in the inner city. However, traditional analysis methods based on remote sensing data or monitoring station data are difficult to reveal the distribution characteristics of PM2.5 concentration in the inner city at high spatial-temporal resolution, and there is also a lack of analysis on the complex nonlinear effect of urban scenes (e.g., roads, industrial areas, residential areas, etc.) on PM2.5 concentration. In this study, we installed the mobile monitoring sensor on the express van to collect PM2.5 concentration in different urban scenes in the south of Fuzhou main urban area. The PM2.5 simulation and scene analysis model based GWR-GBDT method was proposed by fusing Geographical Weighted Regression (GWR) and Gradient Boosting Decision Tree (GBDT). The model can fit the nonlinear relationship between meteorological factors, scene factors, and PM2.5 concentration, and enhance the fine-scale monitoring ability of PM2.5 pollution in city. Combined with partial dependency plot, the nonlinear effect of different urban scenes on PM2.5 concentration in different periods was analyzed to provide support for urban PM2.5 pollution control. The results show that: (1) Based on the mobile PM2.5 concentration monitoring data, the GWR-GBDT model can well simulate the nonlinear relationship between urban scene factors, meteorological factors, and PM2.5 concentration, and simulate the fine spatial distribution of PM2.5 concentration. The results of cross-validation R2 was between 0.52 and 0.94; (2) The heterogeneity of the response of the same scene to PM2.5 concentration in different time periods was analyzed by the partial dependence plots, and we found that the effect of various scenes on PM2.5 concentration was different; (3) By analyzing the interaction of human activities and urban scenes on PM2.5 concentration in different periods, we found that the effect of urban scenes on PM2.5 concentration was related to human commuting between schools, hospital, and residential areas. As the high pollution scene, construction site can effectively reduce PM2.5 pollution in several hours after taking watering measures. In the park and sports service area, PM2.5 concentration was low in most periods. For industrial area and roads, PM2.5 concentration was high in most periods; (4) For the spatial distribution of PM2.5 concentration, PM2.5 concentration in the south of Fuzhou main urban area presented a general trend of high pollution in the southeast and low pollution in the northwest. The proportion of slightly polluted areas in construction sites, roads, and industrial areas was significantly higher than that in other scenes. The overall PM2.5 concentration in the park scene was low, however, the park in mountains was affected by the surrounding industrial areas at nightfall, resulting in increased PM2.5 concentration. The urban outer waters have mitigation effect on PM2.5 concentration around them. This study can provide support for fine-scale PM2.5 pollution treatment, urban planning, and PM2.5 pollution exposure risk prevention of high-risk groups such as the elderly and children in different scenarios.
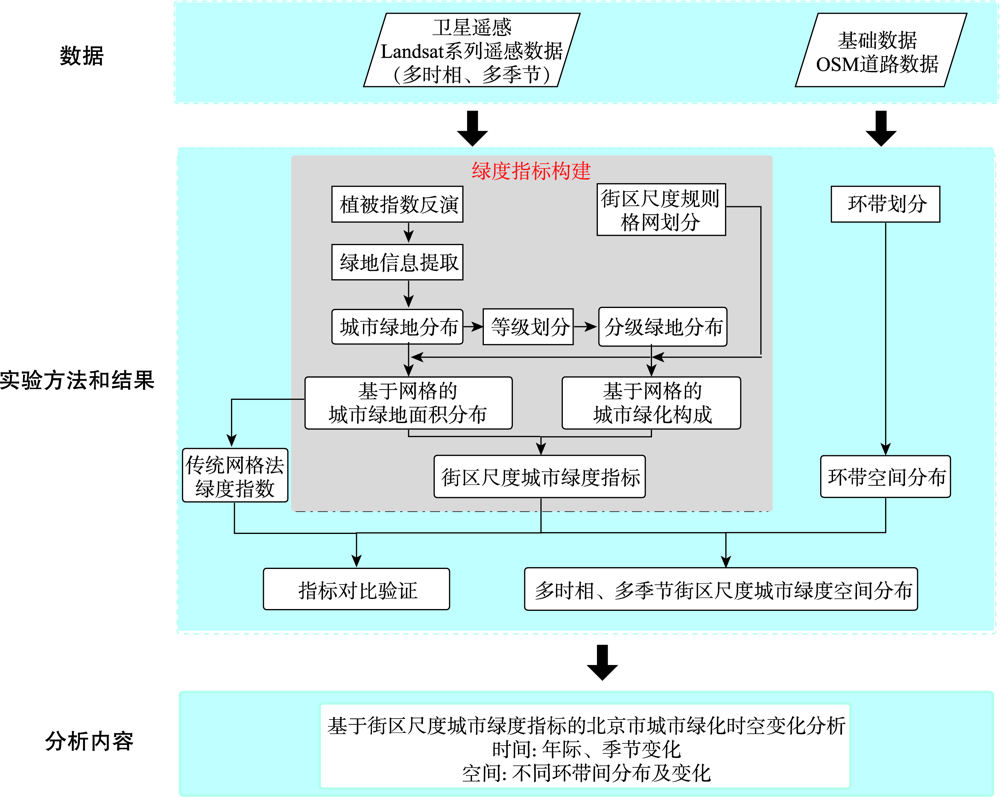
To quantify urban green space using remote sensing data, this paper proposed a grid-based urban green space measurement method at city block scale. The grid unit of 900 m×900 m was set to represent the block scale formed by the main road of the city. The vegetation coverage and vegetation composition were used together to generate the green index in each unit. Unlike the green index calculated by the traditional grid method based on the proportion of vegetation area, the green index in this paper enhanced urban greenness information particularly in areas with moderate to high vegetation coverage. We applied this method in Beijing city and diagnosed the spatiotemporal differences of local urban green space over years. We used Landsat TM/OLI datasets of 2009, 2015, and 2019 in spring, summer, and autumn, respectively. Results showed that both the quantity and quality of urban green space in Beijing have increased significantly from 2009 to 2019, especially in autumn. The changes of urban green space showed different patterns inside and outside of the Fourth Ring Road. Vegetation coverage showed an increase within the Fourth Ring Road, while outside the Fourth Ring Road, there was a significant increase in both vegetation coverage and quality.
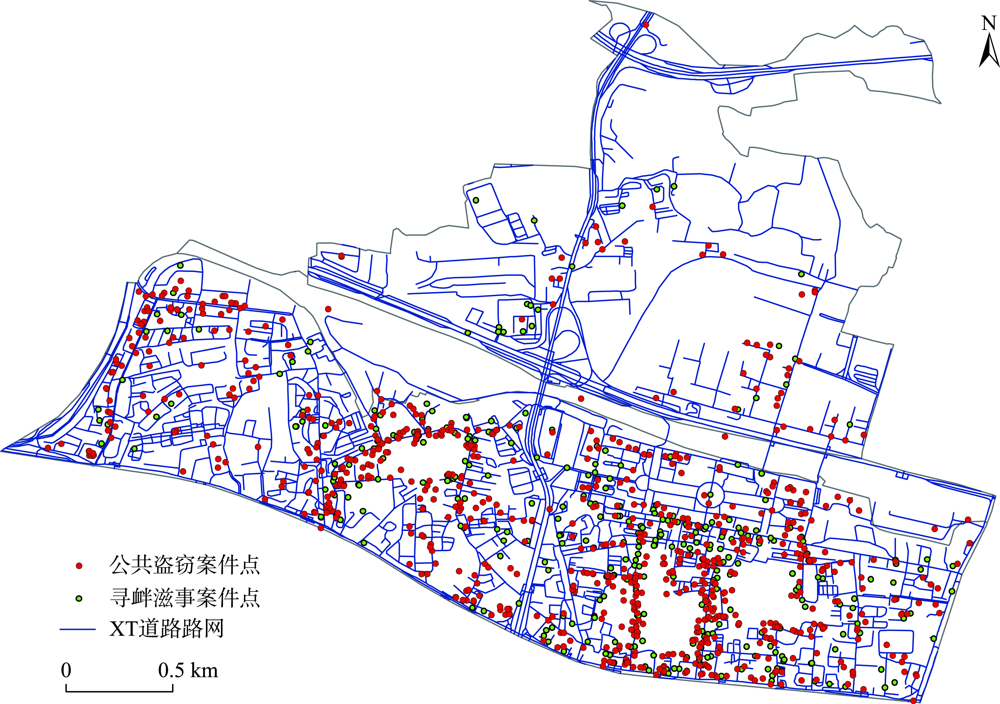
Street crimes pose threats to human life. Previous research tackling street crimes such as public thefts and provocations were often conducted at the neighborhood or even larger levels, thus ignoring the fine characteristics of the built environment at the address level, as is advocated by the theory of Crime Prevention Through Environmental Design (CPTED). It has been well established that the micro built environment at the address level has a direct or indirect impact on the occurrence of various types of crime. However, the measurement of the micro built environment, often called environmental auditing, has been challenging. Most of the previous studies relied on survey samples to characterize the built environment. They suffered from two limitations: incomplete characterization of the built environment and sparsity in spatial coverage. Baidu street view imagery is a new data source that captures built environment at the micro level. It often captures images in four different directions at a given location on the street, and it covers virtually all the drivable streets. This study used a full convolution deep learning image segmentation algorithm to extract the micro characteristics of the built environment from Baidu street view images and applied them to study crimes at the small address level. Eight variables including tree, road, sidewalk et al. were selected to show the differences of micro built environment in the study area. Bayesian logistic regression models were used to evaluate the impact of micro-built environment factors on public thefts and provocations by controlling other relevant criminological factors. Results show that the model performance was improved after adding the micro characteristics. Additionally, we found that places with more trees hence less visibility were more prone to public theft cases, and places with more roads and sidewalks were less prone to public theft cases, when compared with provocative cases. In sum, the convolution deep learning image segmentation algorithm is effective in extracting street-view-derived variables, and these variables added new dimensions to crime analysis at the micro spatial scale. This study not only contributes to the literature in crime geography, but also bring new insight for crime prevention following the principle of CPTED.
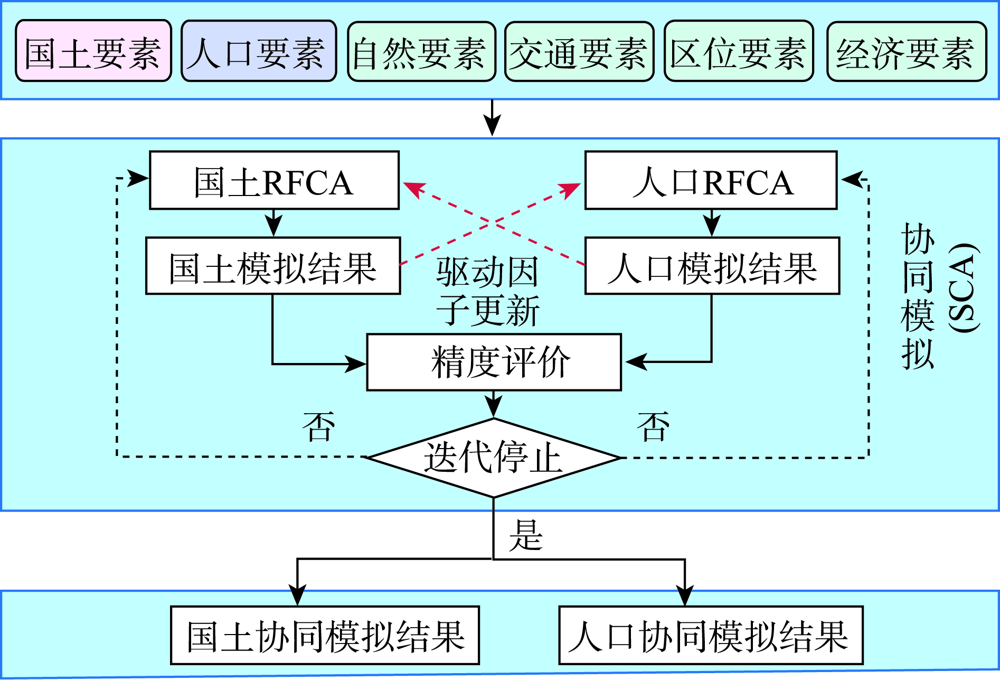
Metropolitan area is a typical complex system with co-evolution and coordinated development of land, population, and transportation. It has become an urgent issue to guide the development path of metropolitan area scientifically by coordinating the territorial space and human resources in metropolitan area. Cellular automata is a discrete grid dynamic model. By constructing simple transformation rules, combined with strong spatial modeling ability and computing ability, it has become an effective means to study complex urban systems. However, existing cellular automata-driven spatial simulation methods usually simulate land or population separately. Their performance are limited as they ignore the co-evolution between land and population. This paper proposes the dynamic influence factors to characterize the interaction between land and population. The core idea is to take the simulation results of land and population as the influence factors of new cellular automata, and express the complex driving processes of land change and population change by updating the cell transformation probability. The spatial simulation model is repeatedly trained to describe the synergistic evolution between land and population in the process of development. The classical cellular automata model is then extended to construct a synergistic simulation framework which realizes the accurate spatial simulation of land and population in the metropolitan area. Taking the Shenzhen-Dongguan-Hui metropolitan area as an example, the experiment was conducted to verify the proposed method. The results show that the synergistic simulation algorithm can accurately simulate the land and population development processes. The simulation results of the proposed algorithm show a Figure of Merit of 0.274 for land and Mean Absolute Percentage Error of 23.55% for population, which outperfoms the traditional cellular automata algorithm coupled with random forest (Figure of Merit = 0.24, and Mean Absolute Percentage Error = 29.33%). Compared with traditional models, the simulation accuracy of this model for construction land is improved by about 3% in land simulation, and the simulation error of this model for high-density population area is reduced by about 6% in population simulation. We further predict the spatial scenario of the land and population development of the Shenzhen-Dongguan-Hui Metropolitan Area in 2030. The results show that the expansion of construction land mainly occurs in the undeveloped areas with good infrastructure (such as Huizhou area), the population further gathers in the high-density areas, and the growth is mainly concentrated in the core urban areas of the metropolitan area. These results provide technical support for locating important infrastructure facilities and development scenarios simulation in the metropolitan area.
Geo-Polilinomical (GPN) relations have become the driving factor of Land Use Changes (LUC) in the border areas between neighboring countries globally. Since the 1990s, over 40 bi- and multi-laterally GPN cooperative mechanisms were established between Mainland Southeast Asia (MSA) nations and their neighbors. National borderlands of MSA, as the forefront of GPN-cooperation, have experienced rapid and widespread LUC, including rubber boom in the borderlands of Sino-Lao and Sino-Vietnam. In this study, using Landsat TM/ETM+OLI data and phenological characteristics (i.e., defoliation and foliation stages for rubber plantations), a normalization algorithm namely the "Renormalized Vegetation Index (RVI)", based on the Normalized Difference Moisture Index (NDMI) and Normalized Burn Ratio (NBR) during the optimum time windows, was modified and applied to map the mature rubber plantations in the borderlands of Sino-Lao and Sino-Vietnam from 1992 to 2018. Based on the spatiotemporal characteristics of rubber plantations in the critical periods of GPN cooperation between Sino-Lao and Sino-Vietnam since the 1990s, the GPN impact on rubber expansion and its national differences were further revealed. The results show that: (1) Under the rubber-based substitution planting, border-prone development, and agroforestry cooperation, the expansion of rubber plantations showed an obvious increase along the border areas since the 1990s. The area of mature rubber plantations was 5537.7 km2 in 2018 derived from Landsat-based RVI. During 1992-2018, there was an increase of 4542.2 km2 or nearly 4.6 times in the borderlands of Sino-Lao and Sino-Vietnam; (2) Under the good GPN relations (e.g., construction of the Mohan-Boten Port and cooperation between nine Provinces in Lao PDR and China), rubber plantations expanded and crossed borders significantly in the 30-km buffer areas of Sino-Lao borders, increasing from 244.6 km2 in1990 to 2080.7 km2 in 2018 (a net increase of 1835.9 km2). Especially, the area of rubber plots was up to 1694.7 km2 in the Chinese side in 2018, with a net increase of 1507.8 km2 (more than seven fold). Meanwhile, the area of mature rubber plantations in the Laotian side increased sharply from 57.8 km2 to 385.9 km2, a nearly five-fold increase; (3) With the gradual improvement of the GPN relations between China and Vietnam since the normalization of Sino-Vietnamese relation and cooperation of "Two Corridors and One Ring", the rubber plantations showed a rapid expansion in the 30 km buffer areas of Sino-Vietnam borders, from 313.6 km2 in 1992 to 1107.5 km2 in 2018, an increase of about 2.5 times. There was an increase of 562.8 km2 from the Chinese side, from 148.9 km2 to 711.7 km2. While the area of mature rubber plantations in the Vietnamese side increased from 164.7 km2 to 395.8 km2 in the same period. Our study is helpful to understand the interaction between GPN cooperation and border LUC, promoting the development of border geography.
Railway passenger flows reflect economic and social interactions in urban agglomerations. Urban agglomeration is the basic regional unit for a country to participate in global competition and international division of labor. It is also the main form of China's new urbanization and an important carrier of modernization. The integrated development of urban agglomerations is one of the major strategies for the development of urban agglomerations in China. An important sign of urban agglomeration integration is the structural characteristics of population, goods, information, and other flows within the urban agglomeration. In this context, the theory of flow space is applied in this study. Based on China's railway schedule OD data in 2018, this study uses complex network approach to analyze the structure patterns of urban agglomerations at the national scale, and investigates the variations of the spatial structure, scale structure, and network node structure in the five major urban agglomerations. The results of analysis show that there is a certain spatial dislocation in the scope between the urban agglomeration area based on the railway schedule and the urban agglomeration in the planning scheme. The planning scope of urban agglomerations is often larger than that of railway passenger transport service supply network. This shows that the supply of railway passenger service may lag behind the urban agglomeration planning. The five major urban agglomerations, Yangtze River Delta, Pearl River Delta, Jingjinji, Middle reach of the Yangtze River, and Chengdu-Chongqing, have different local patterns. Yangtze River Delta has a network-shaped spatial form and centralized scale distribution, the main problem of which is the mismatch between hub function and scale of local nodes. Pearl River Delta has a radial spatial form and centralized scale distribution, the main problem of which is the relative weak connection with other urban agglomerations. Jingjinji has a radial spatial form and centralized scale distribution, the main problem of which is the existence of marginalized nodes. The middle reach of the Yangtze River has a cluster-like spatial form and decentralized scale distribution, the main problem of which is the loose internal structure. Chengdu-Chongqing has a dumbbell-shaped spatial form and centralized scale distribution, the main problem of which is the weak connection with other urban agglomerations. With the process of regional integration, it is necessary to make up for the weak links within and among urban agglomerations according to the differences in the development stages of the network structure, so as to promote the coordination with the scale structure. It is necessary to promote the construction of passenger transport service network with distinct levels, cooperative hubs, and balanced spatial form to support the integrated development of urban agglomeration.
Tourism development is one of the important ways to eradicate poverty. It is of great significance to study tourism poverty alleviation effect from the perspective of multidimensional poverty. In this study, we take the national-level poverty-stricken counties of the Southwest China region that have been lifted out of poverty as the study cases, and introduce the NPP/VIIRS night light data to measure multidimensional poverty. The Geographically Weighted Regression method is used to explore the multidimensional poverty reduction effect of tourism development from 2012—2019. The results show that: (1) From 2012 to 2019, the level of tourism development in poor counties in Southwest China continued to improve, showing a spatial pattern of "high in the east and low in the west", and the regional difference in tourism development decreased; (2) In the past eight years, multidimensional poverty in poor counties in Southwest China was alleviated steadily. In terms of spatial distribution, the level of multidimensional poverty gradually decreased from the west to the east, and the spatial difference tended to decrease; (3) The tourism development can alleviate multidimensional poverty in economic, educational, medical, and social security aspects at county level. There is obvious spatial heterogeneity in the intensity of tourism multidimensional poverty reduction, with Sichuan's poor counties having the highest intensity of tourism poverty reduction. Overall, the tourism poverty reduction intensity is higher in poor counties in eastern Sichuan, northern Sichuan, and southeastern Yunnan, and lower in western Yunnan, southeastern Chongqing, and western Guizhou; (4) The intensity of tourism poverty reduction is mainly influenced by the endowment of tourism resource, the level of economic development, and the location of transportation. These influencing factors promote tourism development through the development of tourism resource, the strengthening of tourism industry support, and the improvement of tourism accessibility, etc. The tourism industry has a strong industrial linkage that leads to comprehensive regional development, improving economic, educational, medical, and social security levels in poor areas, and achieving multidimensional poverty reduction through tourism development. The intensity of tourism poverty reduction in poor counties is influenced by a variety of factors, so tourism poverty reduction development needs to be considered in the context of the actual situation. The effectiveness of tourism in reducing poverty can be improved by increasing the competitiveness of tourism products and improving transport conditions. In addition, the study finds that the measurement of multidimensional poverty based on night light data has a high accuracy and can provide data support for poverty research. The findings of the study have important reference value for the implementation of China's tourism poverty alleviation strategy, especially for the prevention of poverty return after 2020.
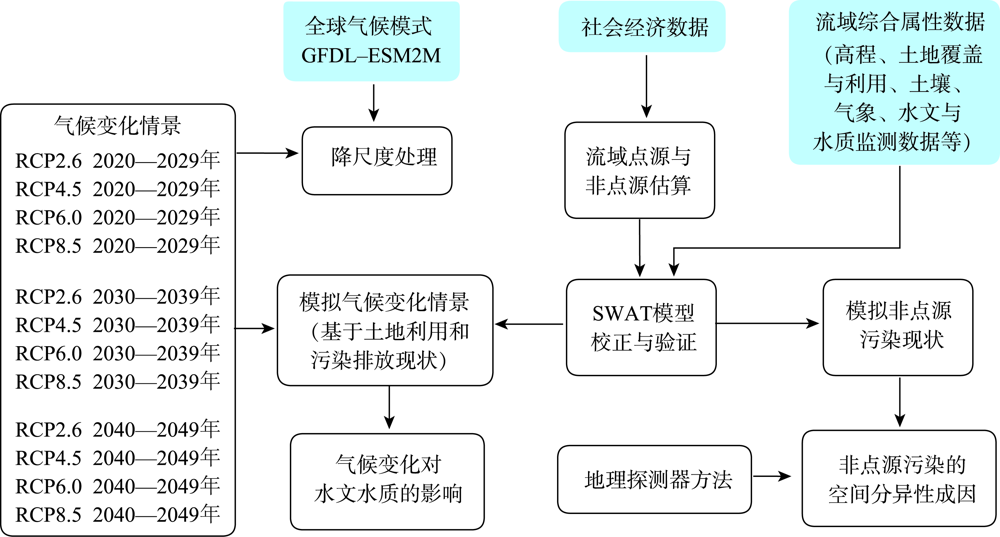
The Huai River Basin is an area where water bodies are seriously polluted by nutrients. Using data from the Huaibin Basin in the upper reaches of the Huai River as the study area, we created the SWAT model for the study area firstly. And then calibrated and validated the SWAT model against the monthly runoff and ammonia nitrogen concentration measured at Huaibin hydrological station from 2011 to 2017. At last, the potential impact of climate change on the runoff, ammonia nitrogen concentration and non-point source total nitrogen load under different climate change scenarios (RCP2.6, RCP4.5, RCP6.0, RCP8.5) in the 30 years (2020—2029, 2030—2039, 2040—2049) were predicted based on the climate data from Global Climate Model as the model input. The study found that the Nash-Suttcliffe coefficient of the runoff during the calibration period and the validation period were both 0.79, and the Nash-Suttcliffe coefficients of the ammonia nitrogen during the calibration period and the validation period were both higher than 0.5, so the applicability of the model was generally good. The main factors affecting the spatial stratified heterogeneity of nitrogen load were the amount of fertilization and the type of land use. The prediction of the Huaibin Basin indicated that before 2049 precipitation and temperature will increase under different climate change scenarios. If the current status of pollution emissions unchanged, the total nitrogen load from non-point source in the basin will increase by up to 31.8%, while the annual average ammonia nitrogen concentration at the outlet of the basin located at the Huaibin hydrological station will decrease by up to 42.6%. The study can provide scientific support for making basin management policies under the pressing challenges from climate change in the future.
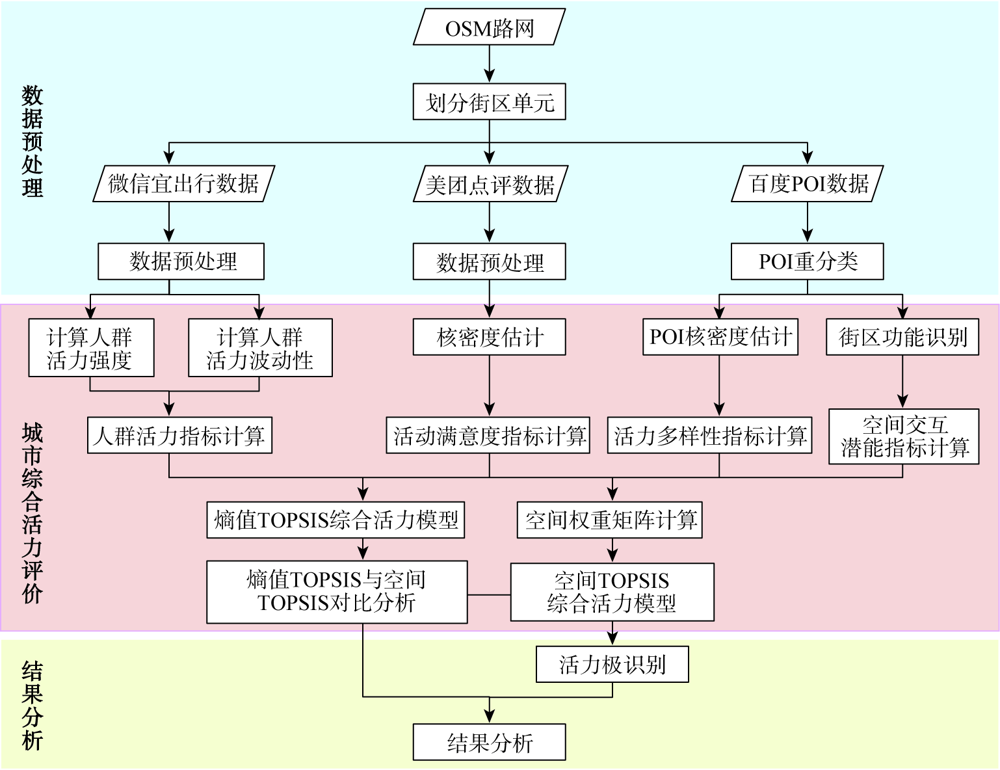
How to conduct quantitative analysis of urban vitality in a scientific and efficient manner has become a key research issue nowadays. Based on the multi-source geographic big data such as OpenStreetMap, Baidu Map POI, WeChat Travel, Meituan, Gaode building outlines, etc., and from the dual perspectives of people and space, this study selects indicators from four aspects, including crowd vitality, diversity of vitality, activity satisfaction, and spatial interaction potential, to construct a comprehensive vitality evaluation model of Spatial TOPSIS. Using the model, this study evaluates the comprehensive vitality of the downtown area of Nanjing, analyzes the spatial distribution characteristics of the vitality of the neighborhood, and explores the similarities and differences of vitality poles between weekdays and weekends. The evaluation results are compared with that of Entropy TOPSIS, in an effort to explore the impact of spatial interaction on the vitality of blocks. This study aims to help urban planners to understand the current status of urban vitality systematically, and provide a feasible plan for urban planning research. The research shows that, firstly, the spatial distribution characteristics of the comprehensive vitality of the downtown blocks in Nanjing urban center are similar between weekdays and weekends. However, the comprehensive vitality of the blocks on weekdays is higher than that on weekends. From the perspective of block functions, the high-value areas of comprehensive vitality are mainly concentrated in commercial centers, tourist attractions, and transportation hubs, which are closely related to the distribution of transportation stations (e.g. subway stations). Secondly, based on the vitality analysis of weekdays and weekends, it is found that Hunanlu - Xinjiekou - Confucius temple scenic area is the largest and most stable vitality pole. Among the small vitality poles, only Longjiang Metro Station has begun to take shape. Other small vitality poles, including Jiqingmen Street, Olympic Sports Center, Baijiahu Commercial District, and Wanda Commercial District, are unstable. Their vitality is still growing. Thus, they may become bigger vitality poles in the future. Thirdly, both the high vitality blocks in the center of the study area and the low vitality blocks receive less spatial effects. The areas with the greatest vitality change are generally distributed in a ring shape around the periphery of the central city. Combining the block functions, it is found that the comprehensive vitality of block units of other land and industrial land is less affected by the spatial interaction. In comparison, residential, commercial, scientific, educational, and cultural land are greatly affected by spatial interaction.
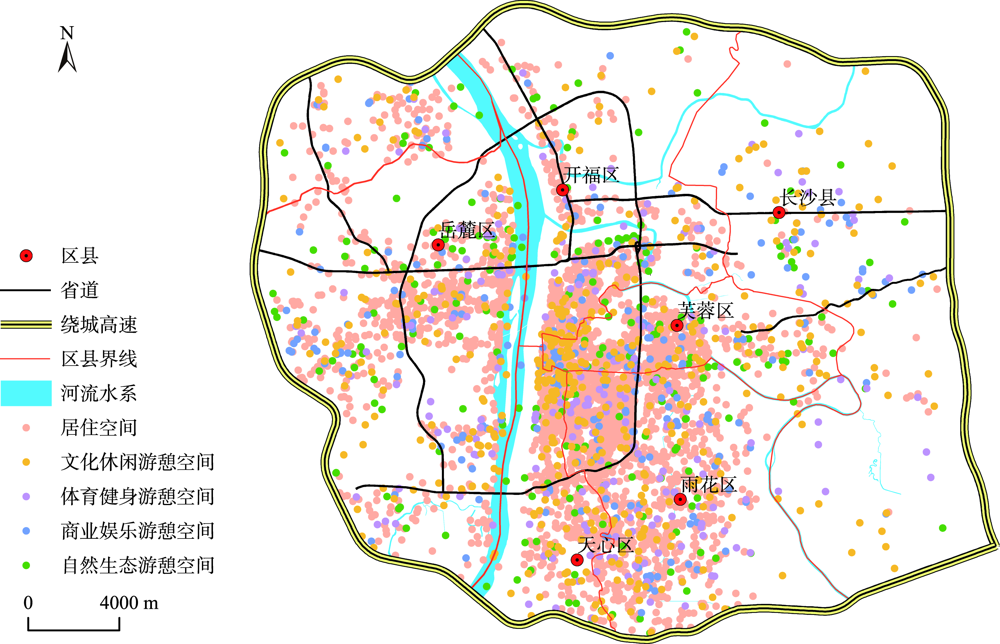
In an era of rapid urbanization and competitive entertainment, the relationship between recreational and residential function space has become an important issue in the field of urban regional structure. Based on POI geographic big data, by using the quantitative models such as Ripley's K function, colocation quotient, and inconsistency index, and adopting the ArcGIS spatial analysis methods for global spatial autocorrelation and kernel density estimation, this paper explores the spatial characteristics of recreational and residential function space and their relationships in Changsha. The results show that: (1) The two function spaces have significantly positive correlation at the spatial domain. The spatial patterns of different types of function spaces are significantly different but both present an agglomeration mode of "polar core of space". The agglomeration intensity of all types of function spaces is characterized by "residential space>cultural leisure space>sports and fitness space>commercial entertainment space>natural ecological space"; (2) The two function spaces have a function attenuation relationship based on "istance-quantity", and the circle radius of 3000m from the residential space is an important spatial area for the centralized distribution of recreational space and the residents' daily recreation; (3) The residential space has the spatial feature of "approaching" recreational space, but the reverse is not significant. The two function spaces show the "asymmetric" relation of one-way attraction, and the attraction level different types of recreational spaces to residential spaces is in the order of "sports and fitness space>cultural leisure space>natural ecological space>commercial entertainment space"; (4) There is strong spatial heterogeneity in the coordinated relation between recreational-residential function spaces. The west bank of Xiangjiang River is superior to the east bank. The Yuelu and Wangcheng Districts belong to recreational-residential coordination types. The Tianxin, Furong, Yuhua, and Kaifu districts are the recreation lagging residence type, while Changsha County is the type of the recreation advancing residence. This study focuses on the allocation of urban recreational facilities and their relationship with residential space in the era of new urbanization and national leisure, it provides theoretical exploration for enriching and inheriting urban public facilities location theory and urban spatial structure theory, and also provides scientific references for Changsha and other similar metropolises to rationally arrange urban recreational facilities, optimize urban spatial structure, and construct leisure livable city.
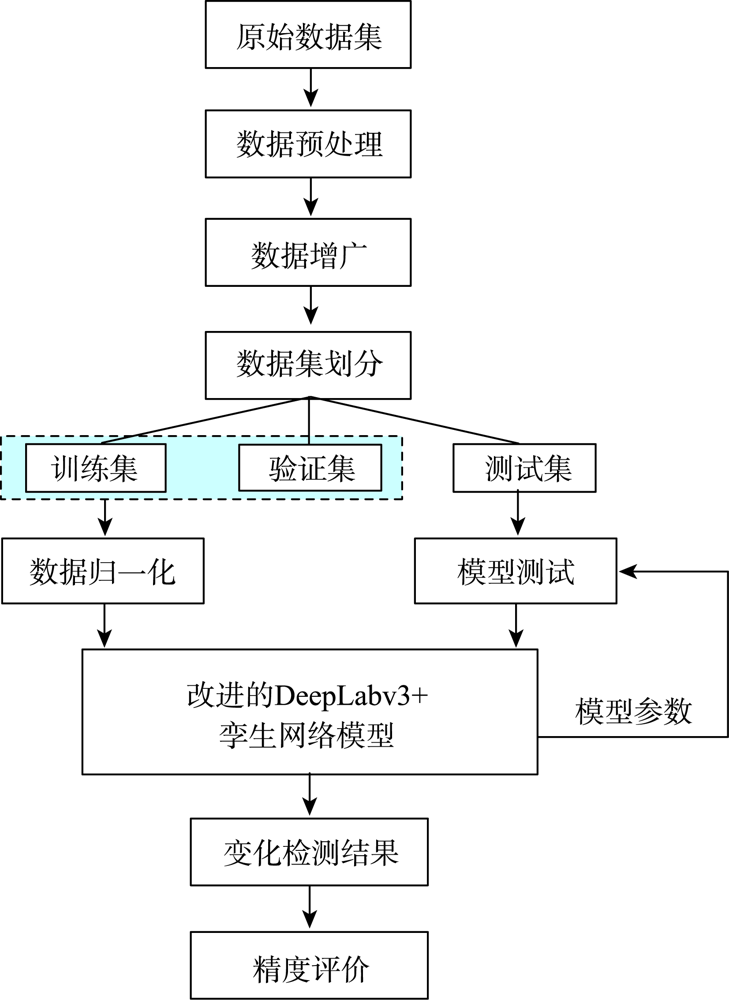
Traditional remote sensing image change detection method relies on artificial construction of features, and the algorithm design is complex and has a low accuracy. Moreover, the remote sensing image change detection technique, which superimposes two different phase images and then inputs them into the neural network, will cause the interaction of characteristics of different phases. It is difficult to maintain the high-dimensional features of the original image, and the model is less robust. Therefore, this paper proposes a remote sensing image change detection method that improves the DeepLabv3+ Siamese network based on the encoding and decoding structure of the classic DeepLabv3+ network: 1) In the encoding stage, the features are extracted by the Siamese network sharing weights, and remote sensing images are received through two input terminals respectively, so as to preserve the high-dimensional features of different time-phase images; 2) The dense atrous space pyramid pooling model replaces the atrous space pyramid pooling model in feature fusion. In addition, the method that combines the output of each atrous convolution through dense connections improves the segmentation of objects of different scales; 3) In the decoding stage, multiple levels of feature map information contain variance that causes integration problems. As a result, a feature alignment model based on the attention mechanism is introduced to guide the feature alignment of different levels, and then strengthen the learning of critical features to enhance model robustness. The open-source dataset CDD is used to verify the efficacy of the method in this paper, compared with UNet-EF, FC-Siam-conc, Siam-DeepLabv3+ and N-Siam-DeepLabv3+ networks. The test results demonstrate that the presented approach in the study achieves 87.3%、90.2%、88.4%、96.4% in precision rate, recall rate, F1 value, and overall accuracy, respectively, which are higher than those of the UNet-EF, FC-Siam-conc, Siam-DeepLabv3+ and N-Siam-DeepLabv3+ networks. The detection results turn out to be more comprehensive, and the boundary detection is smoother and more robust to scale changes.
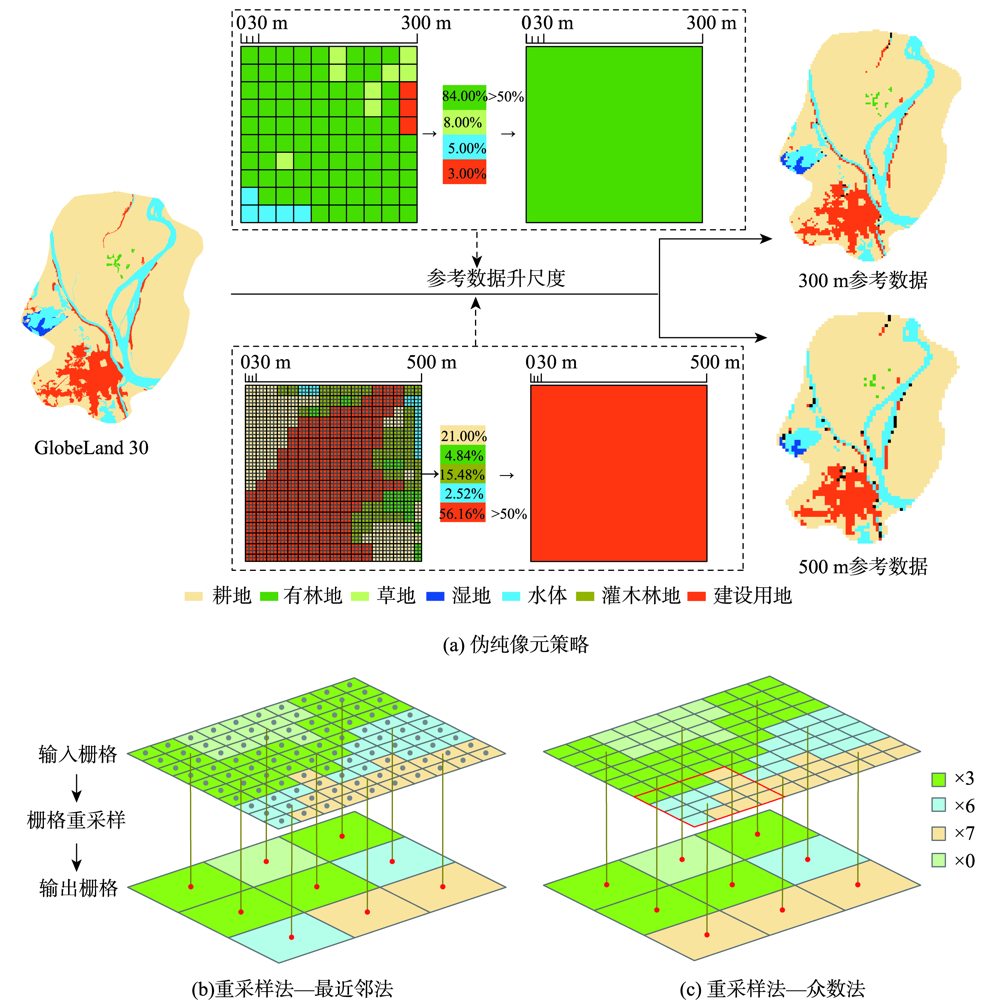
Land cover is an important parameter in geoscience research, and the accuracy assessment of land cover products is a prerequisite to ensure reasonable application of land cover products. In this study, an accuracy assessment strategy based on pseudo-pure pixels (i.e., pseudo-pure pixel strategy) is proposed. That is, calculating the area of land cover types of the high-resolution pixels within a pixel window of coarse spatial resolution data and defining the land cover type with the largest area as the advantage type, and then generating pseudo-pure pixels of advantage type based on the pixel window when the area proportion of the advantage type is higher than a pseudo-pure pixel purity threshold (ranging from 35% to 100%, with a step length of 5%). We take the Lancang-Mekong (Lanmei) basin as the study area and select the GlobeLand30 as the reference data. The confusion matrix accuracy assessment method was used to compare the difference in the accuracy of two sets of global land cover data, i.e., CCI-LC (300 m) and MCD12Q1 (500 m), using different assessment methods, i.e., the pseudo-pure pixel strategy and the resampling method (Nearest and Majority). Our results show that: (1) The accuracy using the pseudo-pure pixel strategy for CCI-LC and MCD12Q1 in the Lanmei Basin under the purity thresholds of 35%~100% are 72.76%~55.26% and 71.44%~45.41%, respectively, and it can better reflect the influence of pixel purity on the accuracy of land cover data than the single accuracy obtained by resampling method (Nearest: 71.21% and 70.54%; Majority: 71.48 and 69.87%); (2) The overall accuracy of CCI-LC is higher than that of MCD12Q1. The accuracy difference of the two datasets increases with the increase of purity threshold, and it is 1.32% and 9.85% respectively for purity threshold of 35% and 100%, respectively; (3) In both datasets, the classification accuracy of cropland, forest, grassland, and water is relatively high, and the classification accuracy of shrub land and bare land is relatively low; (4) The spatial inconsistency between the two datasets and the GlobeLand30 mainly occur in mixed pixel regions with highly heterogeneous land cover types. And the assessment sample grids are purer with the increase of pseudo-pure pixel threshold, which reduces the effects of mixed pixels on accuracy assessment. The pseudo-pure pixel strategy has the potential to compare the mapping accuracy of land cover data with different spatial resolutions, and provides a promising validation method for determining the applicability and application scope of global land cover products at regional scales.
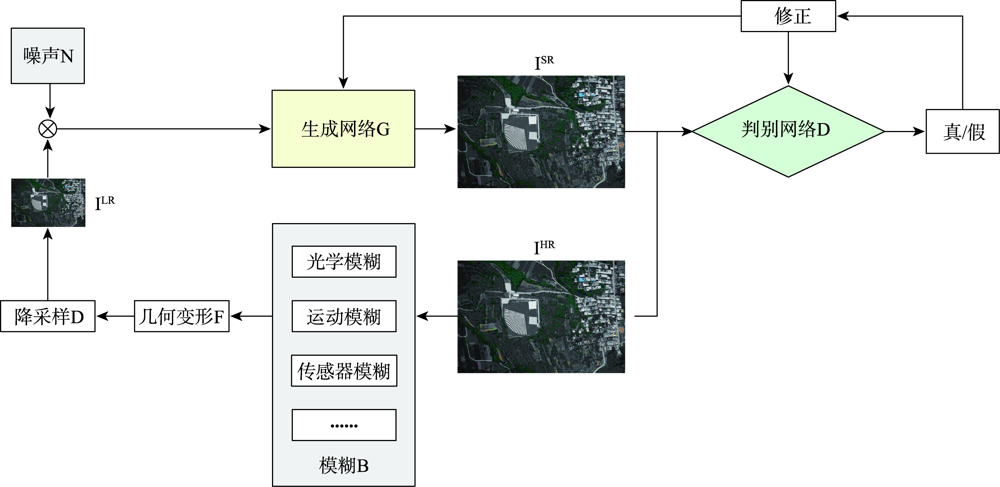
Remote sensing images are important data sources for terrain mapping, 3D reconstruction, and other tasks. The spatial resolution of remote sensing images determines the representation ability of the measured object on the image and plays an important role in the positioning accuracy and reconstruction effect of 3D model in the later stage. In view of the characteristics of high resolution remote sensing images including large scale, complex target features, and rich details, an enhanced SRGAN algorithm for remote sensing image reconstruction is proposed to meet the needs of 3D model reconstruction. The proposed algorithm overcomes the problems of edge effect and fuzzy reconstruction using traditional methods for super-resolution reconstruction. In traditional methods, there is limitation that simple convolutional networks can only extract the shallow feature information of the image and cannot retain the rich details of the image with the increasing resolution. The proposed algorithm is based on the generative adversarial networks using deep learning, in which dense residual blocks are used to extract deep features, and multi-scale discrimination is introduced into the discriminant model. In the training, the generation model and the discrimination model learn features together and are optimized to finally obtain a super-resolution reconstruction model suitable for remote sensing image application. This model can improve the resolution and image quality of remote sensing images, and ensure the integrity and accuracy of feature texture, detail information, and high-frequency target. In our study, the proposed algorithm is compared with the Bicubic, SRGAN, and ESRGAN algorithms. Our results show that the PSNR of the proposed algorithm is improved by about three units, the Penetration Index (PI) is stable and closer to one, and the SSIM and clarity index Q are also improved. In 3D reconstruction, the number of image dense matching points is increased, and the error is reduced. The measured point values of the model are closer to the measured point values from the field. The visual perception of the model is also more real and delicate, which indicates that the precision and positioning accuracy of the 3D model can be significantly improved using the remote sensing images constructed by the proposed algorithm. The results demonstrate the proposed algorithm that considers the characteristics of remote sensing images performs better than other algorithms for the super-resolution reconstruction, and the geometric accuracy and visual accuracy of the real 3D models based on the constructed images are also significantly improved.