The scientific and quantitative evaluation of urban vitality can provide an important basis for urban planning and urban coordinated development. Existing studies on urban vitality and urban planning both focus on the characteristics of people's activities, without considering the psychological feelings of urban residents. In view of the current situation that residents' emotions are easily ignored in research, this study selects Baidu heat map to measure the intensity of population agglomeration intensity and uses the emotional analysis results of micro-blog text data to measure emotional intensity. Using the TOPSIS model to calculate the comprehensive vitality of the city, a comprehensive vitality evaluation framework considering population agglomeration and emotional intensity is proposed. This study selects eight influencing factors from three dimensions: urban physical environment, economic environment, and ecological environment, including road accessibility, land use mix, the density of POI, building density, nighttime light intensity, salary level, housing price level, and vegetation coverage. The influence of the eight influencing factors on the spatial heterogeneity of urban vitality is further explored by the GeoDetector model. This study shows that: (1) The comprehensive vitality evaluation method integrating population agglomeration intensity and emotional intensity proposed in this study can better reflect the spatial differentiation pattern of urban vitality. The effectiveness of this proposed framework for evaluating urban comprehensive vitality is verified by the analysis results of the typical sampling regions; (2) Among the eight influencing factors, the density of POI has the greatest influence on urban comprehensive vitality, while the influence of vegetation coverage on urban comprehensive vitality is the weakest. However, the interaction between vegetation coverage and other factors has the most significant impact on the spatial heterogeneity of urban vitality. It shows that the vegetation coverage factor does not directly act on the spatial heterogeneity of urban vitality but indirectly affects the spatial differentiation of urban comprehensive vitality by coupling the road accessibility, density of POI, and building density.
Comprehensive evaluation of urban vitality and exploration of its land-use characteristics based on multi-dimensional perception is an important foundation for improving the level of urban intelligence, realizing accurate planning and organic renewal. Taking Xiamen Island as a case study, based on social media check-in data, night light image data, POI data, and LBS big data, urban vitality is quantified from four dimensions: society, economy, culture, and space. The spatial characteristics of urban vitality are analyzed by using kernel density, data gridding, and optimal clustering method, and the land use structure, functional diversity and development intensity of different areas are discussed. The findings are as follows: (1) Multi-dimensional perception method of urban vitality based on multi-source data can accurately and effectively evaluate urban spatial characteristics and development trends; (2) There are some differences in the spatial distribution of urban vitality in the social, economic, cultural, and spatial dimensions of Xiamen Island, and the distribution of the these four types of urban vitality are characterized by continuous belts in the west, business districts, and large-scale facilities in the east; (3) There are great differences in land use characteristics of various areas. The proportion of public administration and public service land in the first category and the proportion of commercial services land in the second category are the highest, both close to 20%. Agglomeration can significantly enhance the urban vitality, and the degree of functional mixing within 1000 m around the construction land is important. The vitality of residential and commercial service facility land decreases with the decrease of development intensity, and the plot ratio of high-value areas is above 2.0.
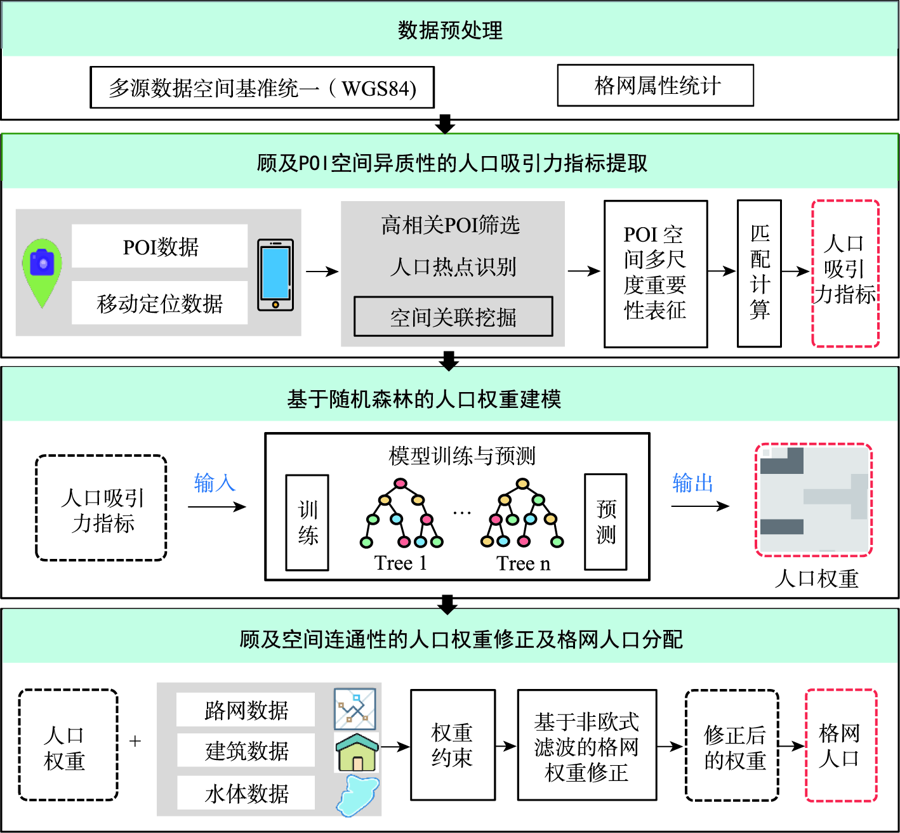
Population spatialization is a common method to refine the spatial resolution of census data. Existing studies are mostly based on the idea of statistical modeling to establish the association between ancillary data and population at the administrative-unit-level, and then transfer it to predict the gridded population. As an important data input for fine-grained population estimation, Point of Interests (POIs) are usually in the form of quantity or density indexes for regression modeling, which ignores the heterogeneity in the association between population and POIs with same type but different sizes. Such modeling methods cause the loss of semantic details of POIs, in turn leading to the population underestimation in main urban areas and overestimation in suburban areas. To tackle this problem, this paper proposes an urban population spatialization method based on random forest model by considering the heterogeneity of population attraction of POIs. More specifically, on the basis of establishing a multi-scale representation of the spatial importance of POIs, this method constructs population attraction indexes by integrating mobile positioning data. Meanwhile, the spatial autocorrelation of population is modeled based on non-Euclidean spatial filter for weight correction, which considers the influence of obstacles such as water body on local spatial connectivity. We select Wuhan city as the study area to conduct population spatialization experiment at 100 m spatial resolution. Through the comparison with traditional density-based model, popular gridded datasets, and the ablation experiments, the results verify the effectiveness of population attraction indexes and weight correction. The mean absolute error of our method is about 1/4-2/3 of the WorldPop, GPW, and the comparison model (i.e., Ye's model), demonstrating the advantages of our method in fine-grained population spatialization. In addition, the influences of the sampling rate and size of grid of mobile positioning data on the modeling accuracy are also discussed.
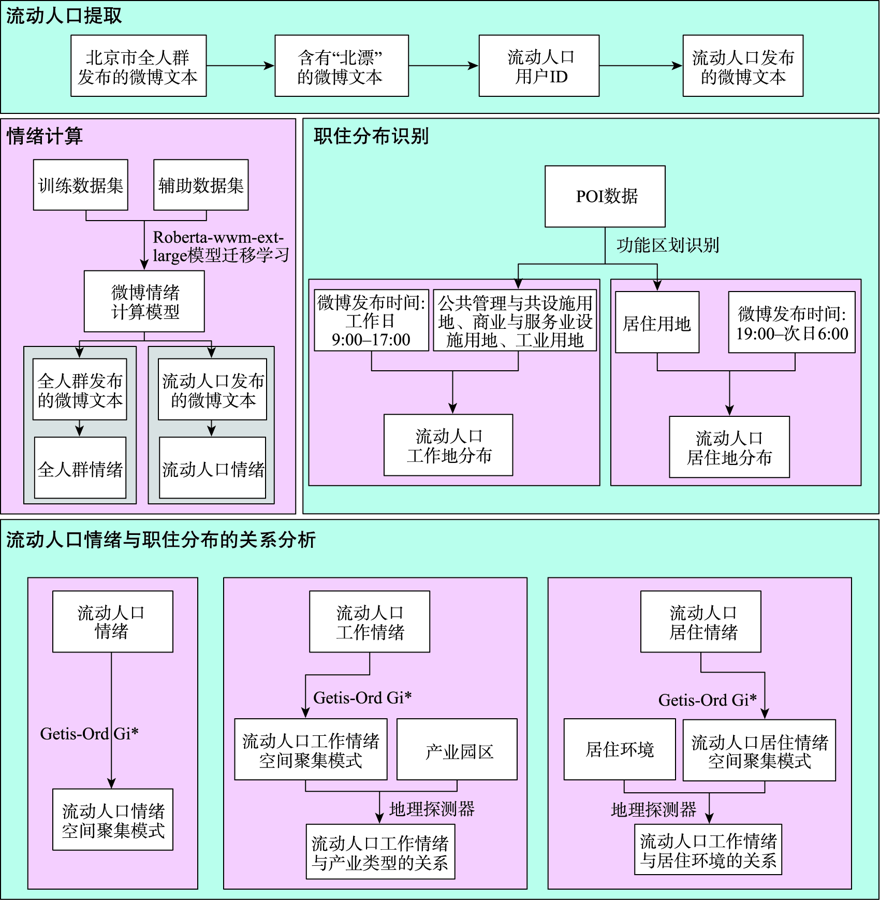
The floating population is an essential part of the urban population, and their working and living status are of great significance to urban stability. The working and living status of the floating population can be directly reflected in their sentiments. On the contrary, their working and living status can also be detected from their sentiments. Firstly, we used jieba word separation technology and manual screening to obtain the microblog texts published by the Beijing floating population based on the microblog big data in 2017. Secondly, we identified the sentimental tendency of microblog texts for the whole population and the floating population in Beijing by transfer learning the natural language processing pre-training model (Roberta-wwm-ext-large). Then, we obtained the working and living distribution of the floating population with POI data and the published time of microblog texts. Finally, we got the floating population's working and living sentiments through their microblog sentiments and working and living distribution, mined the spatial aggregation pattern of their working and living sentiments with spatial analysis methods such as Getis-Ord Gi*, and analyzed the factors that may affect the hot spots' distribution of working and living sentiments of the floating population in Beijing with geodetector. The experiment shows that the average sentiment of the floating population in Beijing (0.56) is lower than that of the whole Beijing population (0.57) at 99.9% confidence level. Overall, the sentiments of the floating population are positive. As for the spatial distribution, the sentiments of the floating population in the core areas such as Dongcheng district and Xicheng district are balanced. The sentiments in the northwest technology and innovation district are more negative relative to the average sentiment of the floating population, while the sentiments in the southeast central business district, cultural exchange district, and the international community are more positive. In terms of the relationship between the floating population's sentiments and distribution of working and living, the working sentiments of the floating population are related to the type of work they are engaged in (q=0.03, P<0.05). In detail, the floating population working in high-tech industrial parks, industrial parks, and logistics industrial parks are more negative relative to the average working sentiment of the floating population, while those working in the health industrial parks, cultural and creative industrial parks, and agricultural parks are more positive. Besides, the living sentiments of the floating population are related to the living environment (q=0.06, P<0.1). The floating population living in the distance suburban residential area are more negative relative to the average living sentiment of the floating population, while those living in the near suburban high-density residential area are more positive. In general, the average living sentiment of the population (0.55) is significantly lower than the average working sentiment (0.58). Therefore, focusing on the floating population engaged in high-tech industry, industry, and logistics industry as well as improving the living satisfaction of the floating population living in the distance suburban residential area is vital for constructing a city with a stable work-life and livable environment.
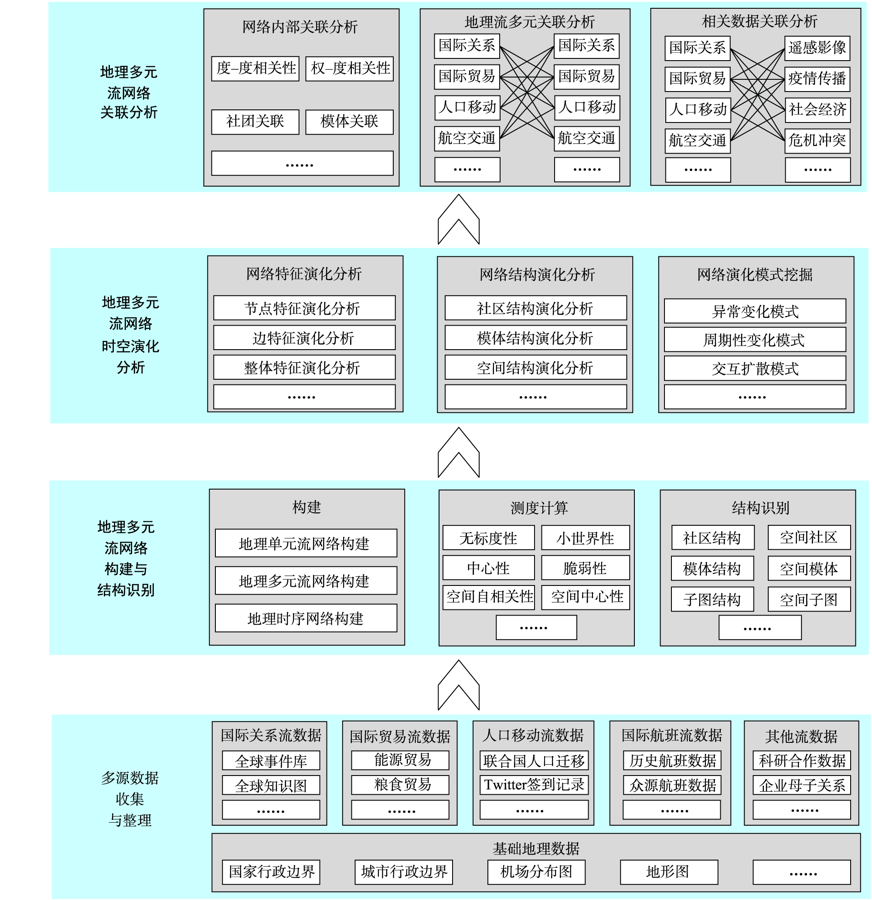
The world is networked and interconnected. The Geographical Multiple Flow (GMF) network formed by the movement or exchange of substances, information, and energy embedded in global geographical space, has become a novel perspective to investigate global issues through the perspectives of geography and networks. How to construct a multi-topic, time varying GMF networks, identify network structures, spatiotemporal evolution patterns, and association patterns, and provide support for solving global population movement, aviation transportation, international relations, international trade, and other issues, is a scientific problem that needs to be solved urgently in the fields of geographical information science and social sciences. In this paper, firstly, a research framework of network mining and association analysis of GMF networks on a global scale is explored, which includes 4 parts: 1) collection and processing of multi-source data; 2) construction and structure identification of GMF networks; 3) evolutionary analysis of GMF networks; 4) association analysis of GMF networks. Secondly, we review the research on international relation networks, international trade networks, global aviation transportation networks, and global human movement networks, with some specific demonstration experiments. Thirdly, we review the association analysis of GMF and proposed some research thoughts. Conclusions and discussions are made finally Our paper proposes a research framework and provides some research thoughts of GMF networks on a global scale, which provides references for global issues such as international relations, international trade, aviation transportation and human mobility and makes fundamental contribution to the development of flow-based spatiotemporal analysis methods.
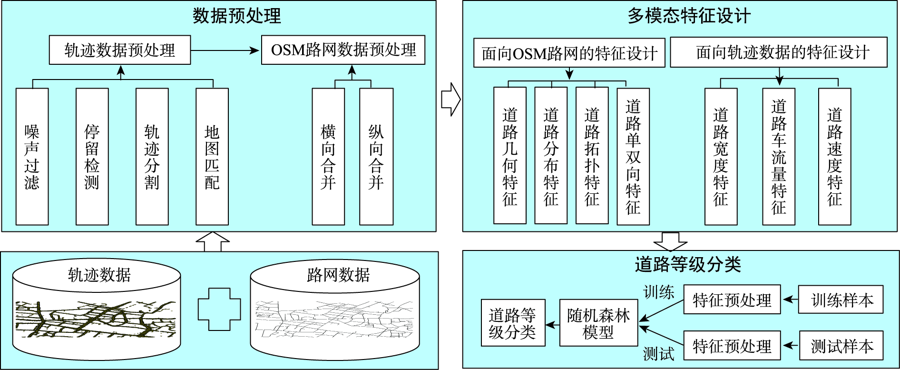
Path planning and vehicle navigation not only rely on the basic road network structure, but also need information such as grades to assist, to achieve navigation services such as "road priority". Road type is not only reflected in the static skeleton information of the road network, but also in the dynamic semantic information presented by the trajectories. To identify the missing road type of the road sections in the existing road network such as OpenStreetMap (OSM) and road network generation products, a road type classification method considering multi-mode features of the road network and trajectories was proposed. First, the connection between trajectory points and named roads was realized through the cleaning of trajectory data, map matching, and the merging of OSM based on names. Then, a set of descriptive features of road type was formed as the basis for identifying road type by taking the named road as the analytical unit. Specifically, based on the systematic analysis of the road geometric features, road distribution features, road topological features, and one-way and two-way information of the road network structure, we further mined and integrated the static and dynamic features of trajectories, such as width, traffic volume, speed, and so on. Finally, a Random Forest (RF) model was used as the base classifier for feature selection and model training to identify road type. In order to verify our proposed method, we selected the OSM road network and crowd-sourced trajectories in the Hanzheng Street area and the second ring area of Wuhan to carry out the experiment. Our method achieved excellent classification results, the accuracy in verification set of the small area on Hanzheng Street reached 91.2%, and the accuracy in verification set of the larger area on the second ring reached 80.8%. Compared with single-class features, integrated road network and trajectory features greatly improved the accuracy of road type identification. Compared with the road type classification in the form of the original road section, the road type identification in the form of road name reconstruction was better. Compared with existing methods, e.g., commonly used K-Nearest Neighbor (KNN), Support Vector Machine (SVM), Gaussian Naive Bayes (GNB), and other models, our proposed method achieved a higher accuracy. Feature rationality analysis also verified the effectiveness of the proposed method in this paper.
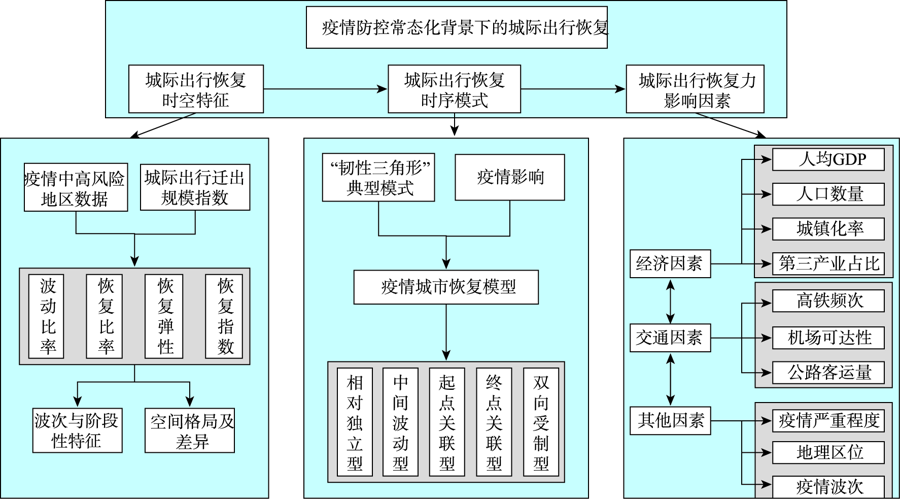
Since the outbreak of the COVID-19 epidemic in 2020, the intercity travel in China has been significantly affected. With the popularity of big data, spatiotemporal modeling and analysis are widely used in epidemic and transportation research. In the post epidemic era, residents' intercity travel shows a certain recovery mode under the influence of local epidemic. The recovery mode and resilience of intercity travel reflects the resilience of cities and can provide information for cities' epidemic prevention and control. Exploring different urban modes and factors affecting the resilience of intercity travel under the influence of epidemic situation has practical significance for normalized epidemic prevention and control management. Based on the migration big data, this paper describes the differentiation pattern of intercity travel resilience under the COVID-19 epidemic from different perspectives, summarizes the time series model, and explores the factors affecting intercity travel resilience. Four indicators, namely fluctuation ratio, recovery ratio, resilience, and recovery index, are constructed to measure the resilience of intercity travel. The results show that: (1) During the epidemic period, residents' resilience to travel shows certain spatial variation. On the whole, the eastern region is the best, followed by the western region and the central region, and the northeast region is the worst; (2) The temporal patterns of intercity travel in epidemic cities are consistent with "resilience triangle" of the typical model. According to the propagation mode and correlation of the epidemic, the specific temporal patterns can be classified into five types: Relative independence mode, intermediate fluctuation mode, starting-point correlation mode, end-point correlation mode, and bidirectional restraint mode, showing different curve forms and characteristics; (3) The resilience of intercity travel is affected by complex factors. When the epidemic wave and regional variables are controlled, economic and transportation factors have a significant impact on the recovery of intercity travel. There may be a U-shaped relationship between per capita GDP and industrial structure and the resilience of intercity travel. When the economic development reaches a certain level, the supporting effect of economy on the resilience of intercity travel becomes increasingly prominent. There is a positive correlation between high-speed rail and airport and the resilience of intercity travel, which plays an important role in increasing the resilience of intercity travel. The results of this study indicate that the application of spatiotemporal big data to analyze the mode and mechanism of urban recovery in the post epidemic era is a novel research method. Subsequent research can further explore the spatiotemporal pattern and mode mechanism of epidemic recovery, in order to provide scientific basis and guidance for epidemic prevention and control of cities.
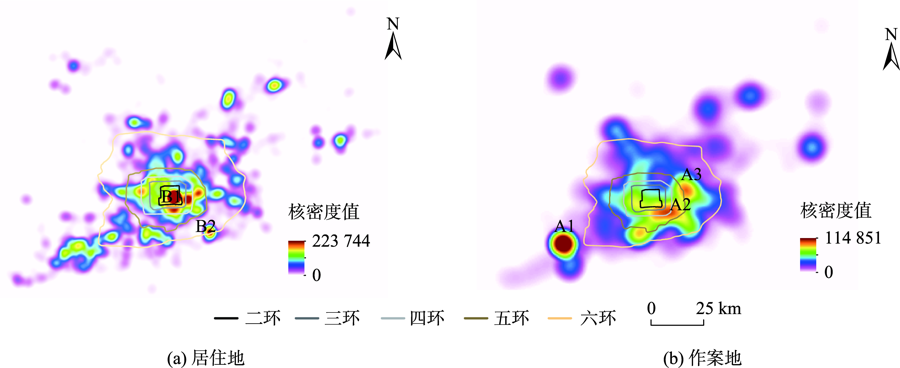
In criminology, journey-to-crime describes the phenomenon that how offenders be off their residing places and search for targets in space. In view of the disadvantages in the measurement of offenders' journey-to-crime and the influencing factors, the data of residential burglary offense in X city from 2015 to 2017 are collected and the walking, riding, and driving distances from the offender's residing location to their corresponding offending location are calculated using Baidu map API service. Then, this paper uses the categorical regression model to analyze the possible impact of environmental features within the offenders' residing area and the offending area, temporal pattern of crime, and subject characteristics of offenders on the journey-to-crime. The empirical analysis shows that: ① The frequency distribution of the three fitted traffic distances obeys the distance decay effect. Among more than 50% of the occurred crimes, the traffic distances between offenders' residing locations and their corresponding offending locations are no more than 10km, and also, the results indicate that there is no significant difference between any pair of three traffic distances, which demonstrates that three types of traffic distances are moderately equal in measuring journey-to-crime cost; ② In terms of influencing factors, the journey-to-crime distance of an offender is mainly affected by the environmental features within the offending area. Specifically, the results demonstrate that the more the targets concentrated and the areas being accessible, the more adjacent offenders are strongly attracted, while the more crime concentrated, the areas more strongly attract offenders from distant places; ③ In terms of the main individual characteristics of offenders, group offenders have longer journey-to-crime distance than single offenders, which reflects that group offenders have advantages in spatial cognition. It is mainly reflected in that for offenders who commit crimes alone, their "lone wolf" behavior restricts their spatial cognition to a low level, and the offenders who commit crimes in groups can learn and accumulate more about targets through information sharing between the members. At the same time, group cooperation can also support offenders to commit crimes in remote places from their residences and help them achieve higher crime benefits. Comparing with previous work on journey-to-crime, this paper includes the diversity of travel functions of offenders in their crime-committing processes, which fills the void of current research and enhances the understanding of journey-to-crime phenomenon. Meanwhile, the work finished in this paper could also be potentially and practically applied in offenders' detection scenarios, for example, geographic profiling.
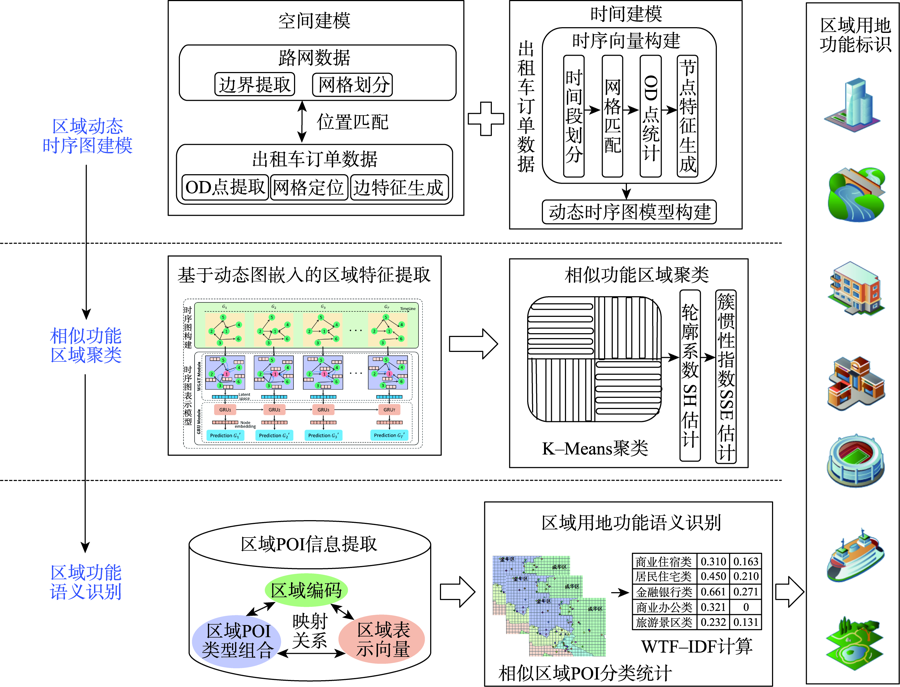
Urban functional area recognition based on multi-source big data is a complex nonlinear pattern recognition problem. The traditional machine learning methods are limited to effectively extract the information of multi granularity, time-varying, and multi-scale spatial interaction from large-scale trajectory data. Therefore, this paper designs and implements a Deep Learning model based on time series dynamic graph embedding, integrates Didi travel and Point of Interest (POI), extracts urban areas' spatiotemporal implicit features, and realizes the semantic recognition combined with cluster analysis. The results show that the land use functions in the center of Chengdu tend to be complex and diversified, and the land use attributes change with time. Furthermore, the scope and land use functions show a temporal and spatial law that they change with the activities of urban groups. The comparative experiments with the relevant literature show that the proposed method can identify the functional areas with a finer granularity. Moreover, the agglomeration degree within the same type of functional areas is higher, which can better capture the land use function changes of the composite area in different time modes. This study provides a new technical method for urban land function identification, helping researchers fully understand the structural attributes of urban areas, and has a particular value in improving the use of urban space.
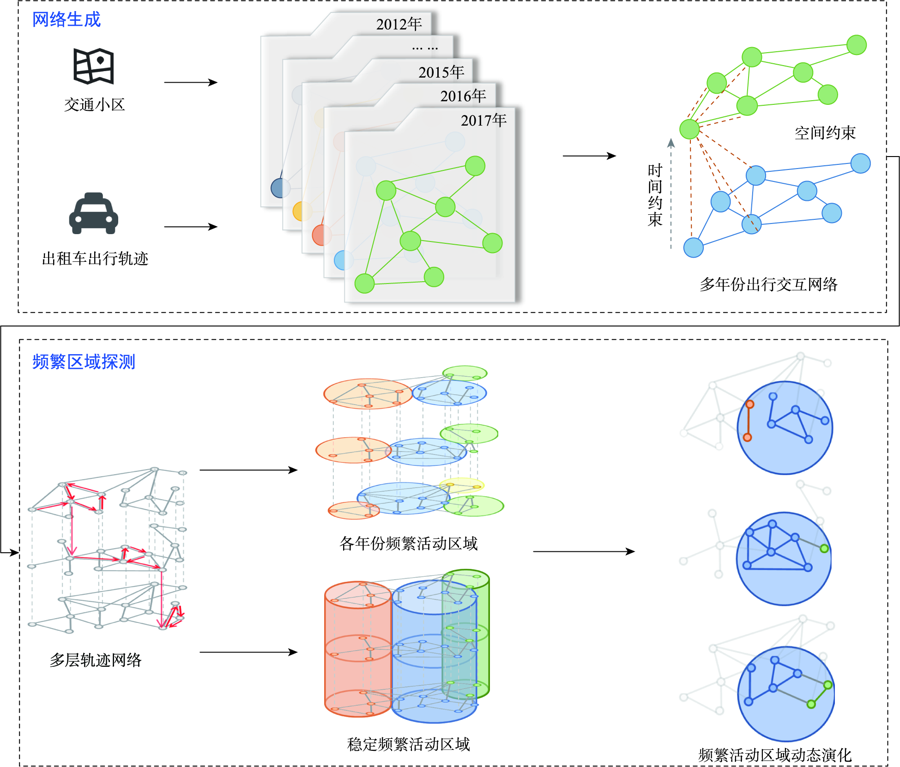
With the penetration of portable devices such as mobile phones and navigators that carry GPS sensors, the trajectory data generated by people's daily life have rapidly increased. Such kind of large-scale trajectory data have been gradually applied to traffic planning, urban management, behavioral analysis, recommendation system, and other fields. In urban studies, urban sub-center detection has always been one of the important topics in the exploration of urbanization. In this paper, we define urban subdistricts with comprehensive functions as a collection of sub-regions within which the internal traffic is significantly higher than their external connected traffic. To detect these subdistricts, a spatiotemporal coupling network model for time series trajectory data is proposed. Based on this model, a multi-layer network community discovery algorithm is proposed to detect dynamic activity sub-area. Taking the taxi trajectory data of Beijing from 2012 to 2017 as an example, this method is used to realize the dynamic detection and analysis of subdistricts with comprehensive urban functions in Beijing.
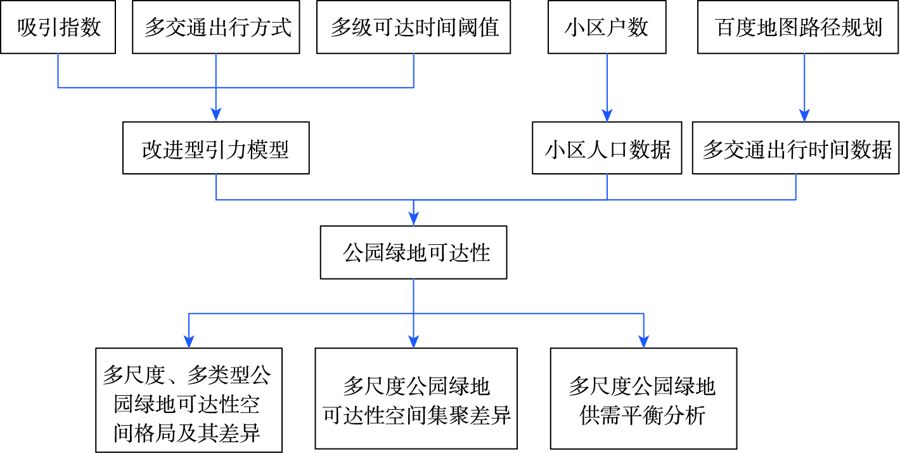
Exploring the effectiveness of the spatial allocation of park green space resources and the balance of supply and demand is of great significance for urban planning and residents' life in high density cities. Previous studies have rarely explored the accessibility of park green space from the perspectives of multi-scale, multi-traffic travel modes, and combination with big data algorithms. Therefore, the paper proposed an improved gravity model that combines multi-type park green space and multi-level travel time thresholds based on the multi-traffic travel data obtained from Baidu Map, and analyzed the spatial accessibility of park green space and the characteristics of the balance between supply and demand in Yuexiu District of Guangzhou City. The results show that: (1) There are significant differences in the accessibility of multi-scale and multi-type parks in Yuexiu District. The district scale accessibility generally shows a decreasing trend from north to south, and the subdistrict scale accessibility shows obvious "polarization" phenomenon. The accessibility of large parks is much higher than that of community parks and street gardens, which occupies a dominant position in the overall accessibility of the city; (2) In terms of spatial aggregation, the accessibility of district scale park green space shows obvious spatial aggregation and stratification, with high-value clustering, insignificant, low-value clustering from the north to south. Compared to the district scale, the subdistrict scale has fewer high-value clusters, and low-value clusters and non-statistically significant areas have increased; (3) The spatial accessibility results based on the perspective of supply and demand balance show that there is overall balance and local imbalance between the supply of park green space and the demand of residents in Yuexiu District. The local imbalance is mainly concentrated in areas with dense residential areas and relatively sparse park green space resources.
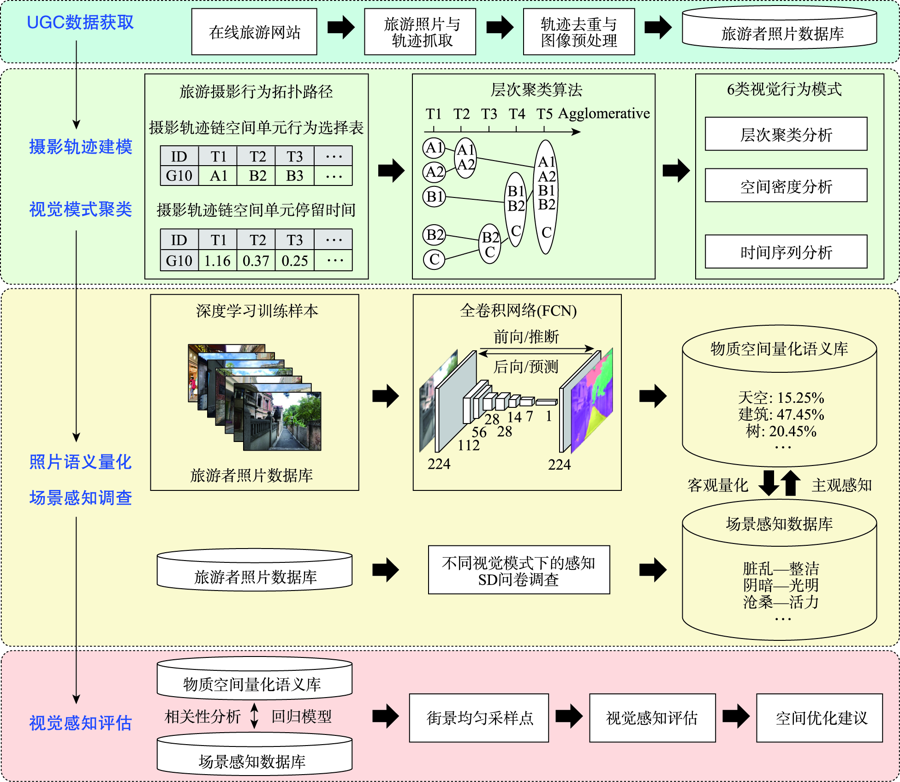
User Generated Content (UGC), as a new type of geographic big data for perceiving the physical space of tourism destination, depicts the objective environment of tourism destination from the perspective of users, which is an important way to explore the perception of tourism destination. However, the traditional tourism research has limited ability to deal with travel photos. The development of deep learning image semantic segmentation technology provides strong support for mining tourists' visual behavior patterns and exploring tourism destination environmental perception. This study proposes a framework for tourists' visual behavior model and perception evaluation, which integrates the big data of online travel photos and small data of questionnaire survey, and applies it to the case of Gulangyu Island. Firstly, 744 tourism trajectories are clustered into six types of visual behavior patterns, and visualized and spatiotemporal analysis is carried out; Secondly, based on the full convolution network algorithm, the semantics of 22 507 travel photos are quantified to explore the spatial differentiation of the elements concerned by tourists with different visual modes; Finally, through the correlation analysis of photo semantics and scene perception questionnaire and the multiple linear regression model, the overall visual perception satisfaction of tourism destination is evaluated, and the corresponding spatial optimization suggestions are put forward. The results show that: (1) the visual behavior patterns of tourists on Gulangyu Island are clustered into six categories: single point tour, island scenery tour, around the island tour, street and lane space tour, heritage building tour, and whole island tour; (2) Tourists with different visual behavior patterns have spatial agglomeration in their visual interest areas, and the transfer of visual space follows the geographical proximity effect; (3) The results of correlation analysis and model show that tourists prefer areas with high spatial openness, and the areas with lower perceived satisfaction have less photography behavior, which is the focus of environmental improvement; (4) Maximizing travel time and cost efficiency, built environment, psychological environment, and social environment are the main factors affecting tourists' visual perception. This study extends the application of artificial intelligence technology in the study of tourists' visual perception, and provides a reference for tourism destination spatial optimization.
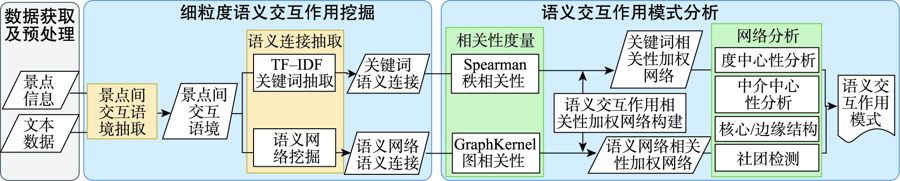
Exploring the semantic interaction and interaction pattern of tourist attractions is useful for optimizing the tourism pattern according to the needs of tourists. Existing semantic interaction mining methods ignore the contextual vocabulary that contains human perception information in texts. And there is a lack of research that analyzes the interaction pattern. Therefore, this paper proposes a framework for fine-grained semantic interaction mining and pattern analysis between attractions. First, the contextual information between two attractions is extracted through the co-occurrence relationship of words based on the online travel notes. Then, the semantic connection between attractions is mined by using the method of keyword analysis based on TF-IDF and the method of semantic network analysis from the perspectives of discussion focus and semantic structure. Finally, we regard attraction interaction as an object and use the Spearman rank correlation coefficient and the Graph Kernel (a method for graph similarity measurement) to calculate the correlation between them. Then the network analysis method is used to explore the interaction pattern. The experiment takes Yunnan Province as the case study area, the results of the text mining using travel notes in 2018 show that: (1) The framework is feasible and applicable. The travel experience can be improved according to the needs of tourists by mining and analyzing the fine-grained semantic interaction between attractions. And the route fragments that play a key role in optimizing the tourism pattern can be found by analyzing the semantic interaction pattern of attractions; (2) Cangshan Mountain-Erhai Lake should focus on improving the natural scenery travel experience; while Dali Old Town-Erhai Lake should consider improving tourists’ insufficient attention to branded tourism resources; (3) The coexistence of the three types of semantic interaction patterns, including single-core agglomeration, single-core radial, and multi-regional cooperation, presents the characteristics of node-axes evolving and diffusing. The high betweenness centrality and cross-regional attraction interactions are important for promoting the transformation of the other two models to multi-regional cooperation to develop "global tourism". The research results can provide references for recommending tourism routes and balancing tourism patterns. In the future work, we will explore the dynamic evolution of the semantic interaction between attractions and apply the results to tourist route recommendation.
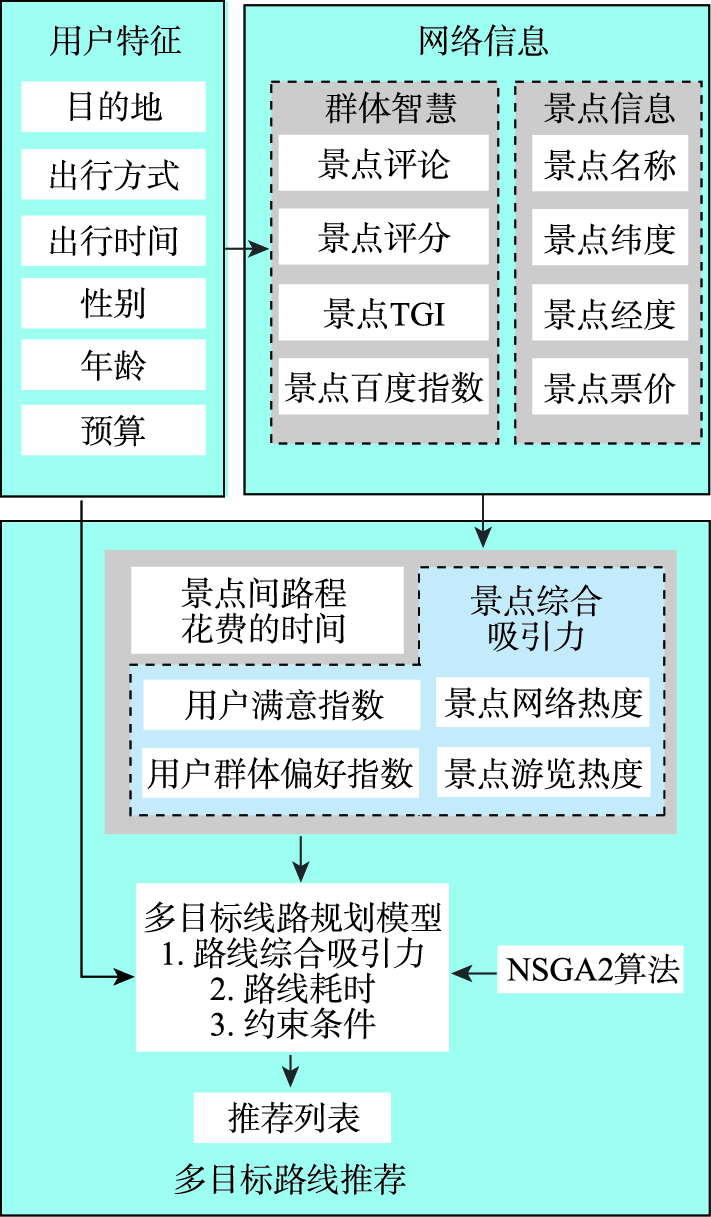
Improving the accuracy of travel route recommendation is of great significance to the field of tourism recommendation. Considering the problems of data sparsity and cold start involved in the process of travel route recommendation, a multi-objective travel route recommendation method is proposed in this article by integrating user features and group intelligence. First, we obtain scenic spot information and group intelligence data from Ctrip.com, whlyw.net, Baidu Index, and other websites, including the locations of scenic spots, the prices of scenic spots, user comments, user ratings, browsing data, etc. Second, we fuse user features and the group intelligence data to construct the comprehensive attraction index of scenic spots for different kinds of people and calculate the attraction index of travel routes. Finally, a multi-objective optimization function of tourism route recommendation is defined according to the user demand for the most efficient access to scenic spots that are most likely to be of interest to users during travel; thus, the recommendation list is generated by a multi-objective genetic algorithm (non-dominated sorting genetic algorithm-II, NSGA2). Compared to traditional travel route recommendation methods, our proposed method has following advantages: (1) We carefully consider the actual needs of users (consumer side) and the attraction of scenic spots (supplier side), ensuring that users can visit as many popular scenic spots as possible with less travelling time; (2) We consider that scenic spots, especially outdoor scenic spots, show different attraction to tourists in different time periods, and this paper takes into account the travel time of users when calculating the attraction of scenic spots to users; (3) The vehicle selected by a user has a great impact on user travel routes, and our proposed method recommends different travel routes for users according to different vehicles, which better meets user needs; (4) Since different users have different preferences for the same scenic spot, we divide user groups according to user gender, age, trip modes, and trip time, which improves the accuracy of recommendation. The experimental results show that: (1) The factors considered in this paper can effectively improve user satisfaction with the recommendation results; (2) The proposed method considers the factors that can effectively improve user satisfaction during route recommendation and provides diverse recommendation results for users with different features and needs; (3) The proposed method not only gives a higher comprehensive attraction index but also effectively reduces the time spent on the journey. Furthermore, the recommendation results are more diverse, thus contributing to the development of intelligent travel route recommendation.
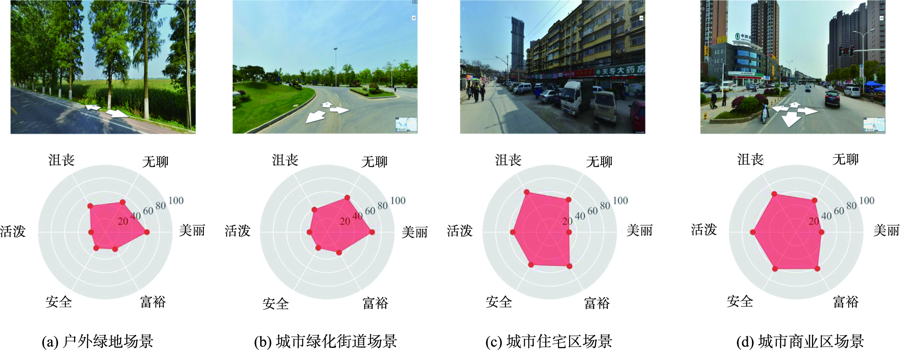
Understanding the impact of urban environment on human perception has important humanistic reference value for rational urban planning and layout. The urban environment is a dynamic and complex system with spatial heterogeneity. Due to the limitations of research methods in the complex urban environment, it is difficult to analyze the impact of key elements of the environment on human perception comprehensively and precisely in previous urban perception studies based on street view images. In this study, the center of Wuhan is chosen as the research area. First, the street view images are segmented into urban ground objects by using Fully Convolutional Networks, coupled with perception scoring data and Random Forests algorithm to establish six types of urban perception models. Then, based on the Shapley value method, the impact of various urban ground objects on human perception in the forest model is decomposed, and the key elements of the urban environment are identified. Finally, combined with the decomposition results, the applicability and advantages of the Shapley value method in the nonlinear model are explored. The results show that the Shapley value method can effectively consider the spatial heterogeneity of urban physical environment and accurately and quantitatively express the impact of various ground objects on human perception in different scenarios. Urban buildings, sky, and green space are the three categories that have the greatest degree of impact on human perception. And the volume and distribution form of ground objects affects human intuitive visual experience of ground objects, which in turn affects the specific impact role of ground objects on human perception. The larger the image proportion of the ground objects or the more continuous the distribution of the ground objects, the greater the impact of ground objects on human perception. At the same time, because of the influence of the spatial heterogeneity of the urban physical environment, the impact degree and form of the main ground object types on various perceptions are significantly different. The relationship between buildings and human perception is nonlinear and has an obvious monotonically increasing or decreasing form. Green space has a nonlinear relationship with positive perception and a linear decreasing relationship with negative perception. Based on the interpretability approach, this study analyzes the impact of key elements of urban environment on human perception and explores the interpretability issues in urban perception models, which can provide methodological reference and theoretical basis for urban perception related research, as well as reference for urban planning and landscape design.
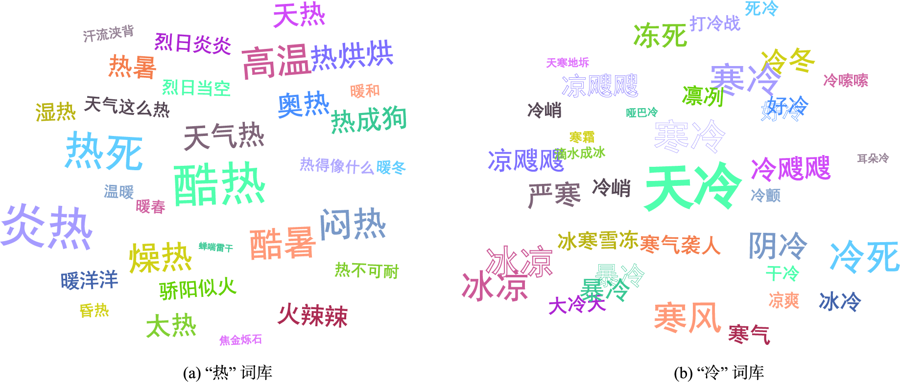
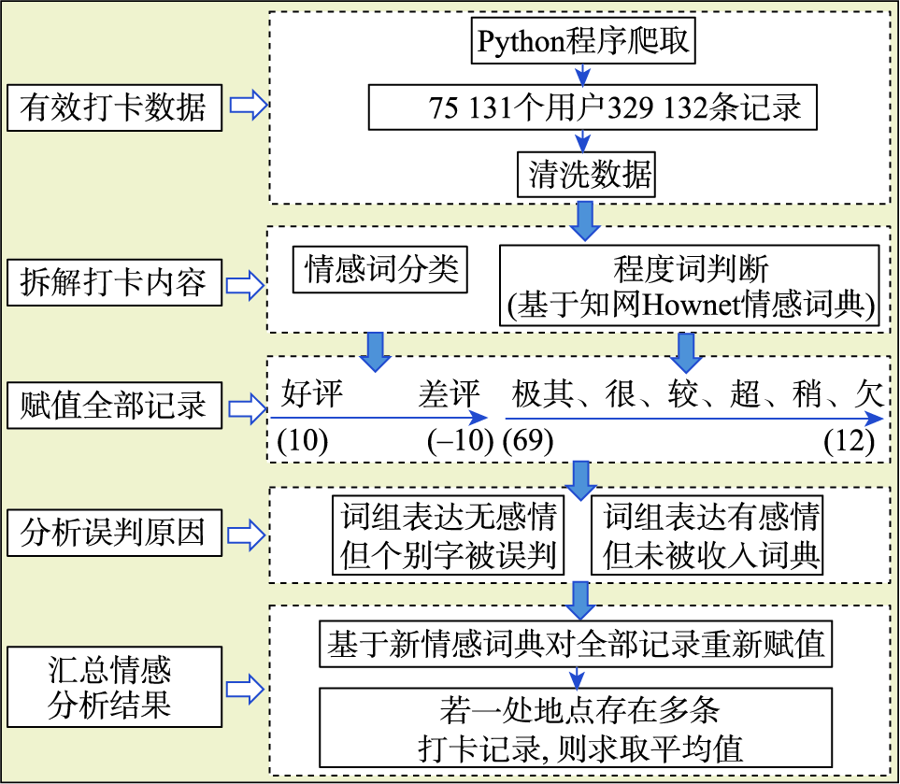
Extreme temperature events occur frequently and pose a serious threat to human health. However, due to the variability of individual and environmental influences, the perception of temperature change and the trend of actual temperature change in different populations do not exactly coincide. A deep understanding of the human perception characteristics of temperature change plays an important role in improving the management, adaptation, and warning capabilities for coping with extreme weather. Traditional survey data are insufficient in sample size and coverage, moreover, lack of diverse individual samples. And medical simulation results are strongly influenced by the parameters of environmental variables and often differ from the real situation. In this study, we used Weibo data to characterize human perception, that is, individual descriptions of temperature based on subjective feelings. We analyzed the quantitative response relationships between human perception of temperature and temperature observation variables and used temperature tolerance and sensitivity to measure temperature perception characteristics. We investigated geographical changes in human perception characteristics of temperature and its local variations in different seasons and among different groups over 31 Chinese cities. We then used the generalized linear regression model to analyze the influencing factors of temperature perception. For example, climatic factors such as climatic zones, annual average temperature, and annual average precipitation, as well as social factors such as urban population and Gross Regional Product. Our results showed that the human perception of temperature exhibited regular, nationally conspicuous shifts along latitudinal gradients, the lower the latitude, the stronger the average heat tolerance and cold sensitivity. They showed a significant trend linearly toward horizontal increase from the northern regions to the southern areas at a rate of 0.42 and 0.51 per degree, respectively. In contrast, the average cold tolerance was weaker at a rate of 0.31. There were also significant differences in human perception of temperature in different seasons and among different groups. The abnormal temperature in the off-season was more likely to attract people's attention to temperature change, and teenagers and females were more sensitive to cold. The regional differences in temperature perception characteristics were strongly associated with climate regions. People in temperate regions showed greater heat tolerance than those in the tropics, while people in the tropics showed greater temperature sensitivity. Our findings could provide insights into the characterization and patterns of the human perception of local temperature and have potential for several issues in terms of planning, management, and decision-making related to Extreme temperature event.