2015 , 17 (11): 1348-1354 https://doi.org/10.3724/SP.J.1047.2015.01348
史军 , 崔林丽
, 崔林丽
SHI Jun, CUI Linli
通讯作者:
收稿日期: 2015-05-4
修回日期: 2015-06-5
网络出版日期: 2015-11-10
版权声明: 2015 《地球信息科学学报》编辑部 《地球信息科学学报》编辑部 所有
基金资助:
作者简介:
作者简介:史 军(1975-),男,博士,高工,主要从事气候变化和气象灾害方面的研究。E-mail: shij@climate.sh.cn
展开
摘要
基于上海地区11个气象站气温、降水数据和主要天气现象记录资料,利用气候统计诊断方法研究了上海主要气候要素和天气现象的时空分布和变化特征。结果表明,上海年均气温呈中心城区高、周边郊区低的分布,中心城区与郊区年均温差最大可达0.9 ℃;降水量在中心城区和南部地区较多,而在北部和西部地区较少;高温日数中心城区明显多于东部和南部沿海,最多相差9.5 d;暴雨日数在中心城区和浦东较多,而在西部地区较少;雷暴、大风和大雾日数没有呈现出显著的城郊差异;霾日数在中心城区远高于郊区,最多相差49.2 d。1961-2013年间,上海年均气温显著上升,降水量略有增加,高温日数和霾日数分别以2.7 d/10 a和11.3 d/10 a的线性趋势增加,暴雨日数呈弱的增加趋势,而雷暴、大风和雾日数在1961-2013年间,分别以1.9、3.7和5.2 d/10 a的线性趋势减少。
关键词:
Abstract
Based on the temperature, precipitation data and main weather phenomenon records from 11 meteorological stations, the spatial and temporal distributions and the changes of main climate elements and the weather phenomena in Shanghai were analyzed using climate statistical diagnosis technology. The results indicate that the annual average temperature in Shanghai was higher in the urban areas and lower in the surrounding suburbs, with a maximum difference of 0.9 ℃; and the precipitation was heavier in the urban areas and southern suburbs, while less in the northern and western surrounding suburbs. The annual high temperature days were also greater in the urban areas than in the eastern and southern coastal areas, with a maximum difference of 9.5 days; and the annual torrential rain days were greater in the urban areas and Pudong region, but less in the western regions of Shanghai. The number of thunderstorm, gale and fog days did not show significant differences between the urban areas and suburbs. The annual haze days in the urban areas were evidently greater than those in the suburbs, with a maximum difference of 49.2 days. During the period from 1961 to 2013, the annual average temperature increased significantly while the annual precipitation increased slightly in Shanghai. The annual high temperature days and haze days increased with a linear rate of 2.7 and 11.3 days per decade respectively, while the annual thunderstorm, gale and fog days decreased with a linear rate of 1.9, 3.7 and 5.2 days per decade respectively in the past 53 years in Shanghai.
Keywords:
近百年来,全球气候呈现出以变暖为主要特征的显著变化[1]。1880-2012年,全球平均地表气温升高了0.85 ℃,其中,1951-2012年全球平均地表温度的升温速率几乎是1880年以来升温速率的2倍[2]。未来全球气候变暖仍将持续,21世纪末(2081-2100年)全球平均地表气温在1986-2005年的基础上将升高0.3~4.8 ℃[2]。气温平均值的升高会导致热浪、干旱和暴雨洪涝等天气气候事件的发生频次与强度出现显著变化[3],从而对社会经济、生命财产和自然生态系统等造成巨大的影响[4-6]。据世界气象组织报告[7],在21世纪最初10 a,全球有超过37万人死于空前的极端天气和气候事件的影响。因此,全球气候变化引起了各国政府和学者的普遍关注[1-6,8],开展区域气候变化规律及原因研究,不仅是全球气候变化科学迫切需要解决的前沿问题,而且对于提高极端天气气候事件的预估、制定应对气候变化的策略和措施都具有重要的科学意义[9]。
上海地处北亚热带湿润季风气候区,具有1873年至今连续140多年的仪器观测气候资料,是研究中国东部气候变化的首选地点之一;此外,20世纪90年代以来,中国东部沿海经济最发达的上海城市化和工业化发展迅猛,为研究中国乃至世界快速城市化和工业化,对区域气候变化的影响提供了理想的试验地点[10]。近年来,随着城市化和经济发展,气象灾害对上海城市安全、经济可持续发展的影响和威胁日趋严重[11-13],但已有对上海气候变化的研究,多侧重于气温、降水等气候要素平均态的变化分析[10,14-15],而对于灾害性天气气候事件变化的研究较少[16-18],且缺乏专门针对上海大城市开展城市气候效应的最新研究成果[18-22]。鉴于此,本文利用上海11个气象站1961-2013年气温、降水数据和主要天气现象记录资料,研究了上海主要气候要素和天气现象的时空分布和变化特征,以期为上海制定适应和减缓气候变化的战略,及区域防灾减灾行动措施提供科学依据和经验借鉴。
本文所用的资料有:上海中心城区(徐家汇)气象站和10个郊区(县)气象站(闵行、宝山、嘉定、崇明、南汇、浦东、金山、青浦、松江和奉贤)1961-2013年逐月和逐年平均气温、降水量以及高温、暴雨、雷暴、大风、雾和霾日数记录资料。这些数据均来自于上海市气候中心,都经过初步的质量检验和控制。
本文中高温指日最高气温≥35 ℃的天气现象,暴雨指日降雨量≥50 mm的天气。雷暴、大风、雾和霾的标准与“地面气象观测规范”[23]一致,即雷暴为积雨云云中、云间或云地之间产生的放电现象,表现为闪电兼有雷声,有时亦可只闻雷声而不见闪电;大风为瞬时风速≥17.0 m/s(或目测估计风力≥8级)的风;雾是大量微小水滴浮游空中,常呈乳白色,水平能见度<1.0 km的天气现象;霾是大量极细微的干尘粒等均匀地浮游在空中,使水平能见度<10.0 km的空气普遍混浊现象。
本文首先以11个站1961-2013年间主要气候要素(气温和降水)和天气现象(高温、暴雨、雷暴、大风、雾和霾日数)的逐年和逐月数据,利用站点平均的方法生成上海主要气候要素和天气现象年序列和月序列;其次,计算1981-2010年各站及上海主要气候要素和天气现象的平均值,获得各站及上海气候统计意义上的常年值;然后,分别计算各站1961-2013年间主要气候要素和天气现象的多年平均值,利用克里格(Kriging)空间插值方法生成空间分布图,研究上海主要气候要素和天气现象的空间格局;最后,根据统计的上海气候要素和天气现象的常年值,计算了1961-2013年间上海主要气候要素和天气现象的逐年距平,从而分析其年际变化特征及趋势。
(1)气温:1961-2013年,上海平均气温呈现出中心城区高、四周低的分布,且随着距离中心城区的增加气温相应地降低,城市热岛效应明显。中心城区与郊区崇明的年均温差最大,达0.9 ℃(图1(a))。上海(11站平均)年平均气温16.0 ℃,气温在7月最高,多年平均28.0 ℃,其次是8月(27.8 ℃),而1月最低(3.8 ℃)(表1)。2007年是1961-2013年间最暖的年份,平均气温17.8 ℃,比常年同期偏高1.5 ℃;1969、1972、1976和1980年是近53年来最冷的年份,平均气温15.0 ℃,比常年同期偏低1.3 ℃。
表1 1961-2013年间上海气候要素和天气现象的月际分布
Tab. 1 Monthly distribution of climate elements and weather phenomena in Shanghai
| 月份 | 气温(℃) | 降水(mm) | 高温(d) | 暴雨(d) | 雷暴(d) | 大风(d) | 雾(d) | 霾(d) |
|---|---|---|---|---|---|---|---|---|
| 1 | 3.8 | 52.7 | 0.0 | 0.0 | 0.0 | 0.9 | 3.3 | 2.9 |
| 2 | 5.2 | 60.7 | 0.0 | 0.0 | 0.3 | 0.6 | 2.7 | 1.8 |
| 3 | 8.9 | 89.2 | 0.0 | 0.0 | 1.5 | 1.0 | 3.0 | 1.8 |
| 4 | 14.4 | 91.2 | 0.0 | 0.1 | 2.3 | 0.9 | 3.1 | 1.8 |
| 5 | 19.6 | 104.8 | 0.0 | 0.2 | 2.0 | 0.6 | 2.3 | 1.9 |
| 6 | 23.7 | 170.1 | 0.7 | 0.7 | 3.5 | 0.5 | 1.9 | 1.6 |
| 7 | 28.0 | 132.4 | 4.7 | 0.5 | 7.1 | 1.1 | 1.1 | 1.0 |
| 8 | 27.8 | 145.7 | 2.4 | 0.6 | 7.0 | 1.3 | 1.0 | 0.7 |
| 9 | 23.7 | 122.7 | 0.2 | 0.5 | 3.2 | 0.5 | 1.6 | 0.8 |
| 10 | 18.4 | 60.4 | 0.0 | 0.1 | 0.4 | 0.4 | 2.9 | 1.7 |
| 11 | 12.6 | 53.9 | 0.0 | 0.0 | 0.2 | 0.7 | 3.8 | 2.8 |
| 12 | 6.3 | 40.7 | 0.0 | 0.0 | 0.1 | 0.7 | 4.4 | 3.7 |
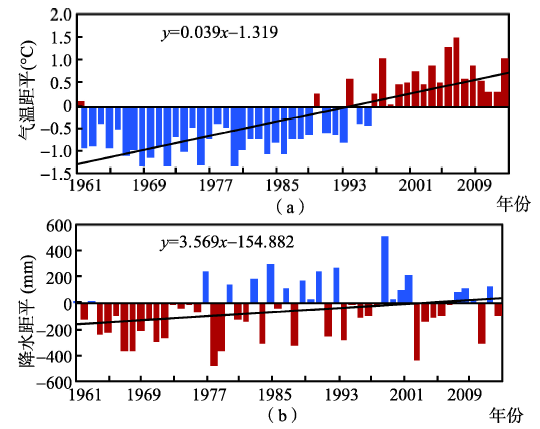
1961-2013年,上海年均气温总体上呈显著上升趋势,平均每10 a升高0.39 ℃(图2(a))。1990年代以来,升温趋势尤其显著,与1981-2010年间常年值相比,1961-1990年间中期气温以偏低为主,1997年后年均气温持续偏高。
(2)降水:1961-2013年,上海平均降水量在中心城区和南部地区较多,而在崇明最少(图1(b))。徐家汇站的降水量最多,年均降水量达1183.7 mm,比降水最少的崇明站多118.0 mm。上海多年平均降水量1122.5 mm,其中,夏季(6-8月)降水最多,逐月平均分别为170.1、132.4和145.7 mm,冬季12月降水最少(40.7 mm)(表1)。1999年是近53 a来降水最多的年份,年降水量达1699.8 mm,比常年同期偏多518.2 mm;1978年是近53年来最少的年份,仅有704.8 mm,比常年同期偏少476.8 mm。
图1 1961-2013年间上海年平均气温和降水的空间分布
Fig. 1 Spatial distribution of annual average temperature and precipitation in Shanghai during 1961-2013
1961-2013年,上海年均降水量呈弱的增多趋势(图2(b))。1990年代降水偏多;1960年代降水偏少最多。1999、1985和1993年分别是排名前三位的降水高值年;1978、2003和1967年分别是排名前三位的降水低值年。
图2 1961-2013年间上海年平均气温和降水量距平变化
Fig. 2 Anomaly of annual average temperature and precipitation in Shanghai during 1961-2013
(1)高温:1961-2013年,上海年高温日数呈现出中心城区和西北部地区明显多于东部和南部沿海地区的特征(图3(a))。中心城区徐家汇站的年高温日数达13.1 d,而南汇最少,仅有3.6 d。高温日数集中于每年的6-9月,其中,7月最多,平均4.7 d(表1)。2013年上海经历自1961年以来最热的夏季,年高温日数达38.6 d,比常年同期增加30.1 d,其中徐家汇站的高温日数达到47 d,偏多31.6 d。而1968、1972、1982和1999年的高温日数平均不足1 d。
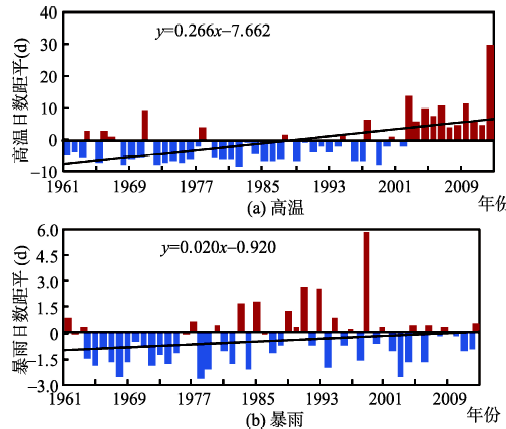
1961-2013年,上海年平均高温日数为8.0d,且呈增加趋势,递增率为2.7 d/10 a(图4(a))。2000年前高温日数多数年为负距平,2003-2013年高温日数全部为正距平。
(2)暴雨:1961-2013年,上海中心城区和浦东年暴雨日数多于西部地区(图3(b))。徐家汇站的年暴雨日数最多,达3.4 d,而西部的青浦年暴雨日数为2.4 d。暴雨日数多出现在4-10月,其中,6月和8月最多,分别为0.7 d和0.6 d(表1)。1999年上海暴雨日数多达9.1 d,比常年平均偏多近6 d,而1968、1978和2003年暴雨日数平均不足1 d。1961-2013年,上海年平均暴雨日数为2.8 d,并呈缓慢增加趋势(图4(b))。暴雨日数在20世纪60、70年代多为负距平。
图3 1961-2013年间上海年高温和暴雨日数的空间分布
Fig. 3 Spatial distribution of annual high temperature days and torrential rain days in Shanghai during 1961-2013
图4 1961-2013年间上海年高温日数和暴雨日数距平变化
Fig. 4 Anomaly of annual high temperature days and torrential rain days in Shanghai during 1961-2013
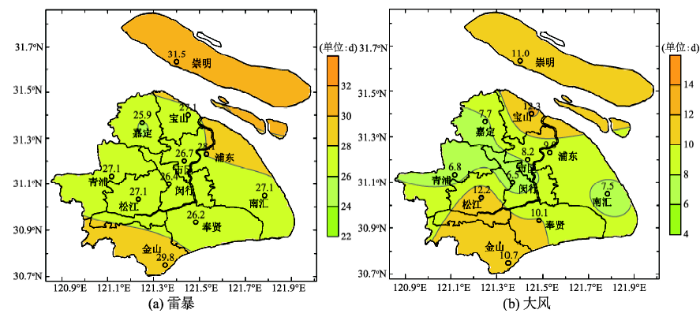
(3)雷暴:1961-2013年,上海年雷暴日数总体分布比较均匀,除在崇明和金山较多外(分别为31.5和29.8 d),其余各站的雷暴日数多在26.0~28.0 d之间,其中嘉定最少(图5(a))。雷暴在一年各月中都有发生,其中7、8月雷暴日数最多,分别为7.1 d和7.0 d,在1月最少(表1)。1963年上海雷暴日数最多(53.2 d),1978年最少(13.2 d)。
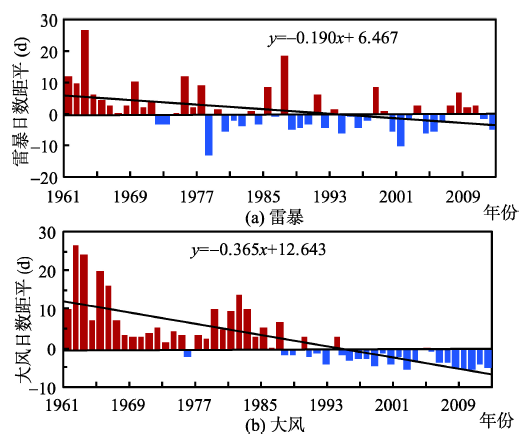
1961-2013年,上海年平均雷暴日数为27.5 d,且呈减少趋势,递减率为1.9 d/10 a(图6(a)),其中1961-1980年,上海雷暴日数减少较快,递减率为7.9 d/10 a,而在1981-2013年,雷暴日数呈缓慢减少趋势。
(4)大风:1961-2013年,上海年大风日数呈现出东北部和西南部较多,而闵行和青浦地区最少(图5(b))。近郊闵行站的年大风日数最少,仅有6.5 d;而宝山的大风日数最多,达到12.3 d。大风在一年中各月都有发生,其中7月和8月大风日数最多,分别为1.1 d和1.3 d,10月大风日数最少(表1)。1963年松江站大风日数最多,为61 d,2009年以后大风日数基本不足2 d。
1961-2013年,上海年平均大风日数为9.3 d,且呈减少趋势,递减率为3.7 d/10 a(图6(b)),其中,1962年最多为33.1 d,比常年同期偏多26.6 d。1961-1987年,大风日数除在1976年外都为正距平,而1995年后大风日数基本为负距平。
图5 1961-2013年间上海年雷暴和大风日数的空间分布
Fig. 5 Spatial distribution of annual thunderstorm days and gale days in Shanghai during 1961-2013
图6 1961-2013年间上海年雷暴日数和大风日数距平变化
Fig. 6 Anomaly of annual thunderstorm days and gale days in Shanghai during 1961-2013
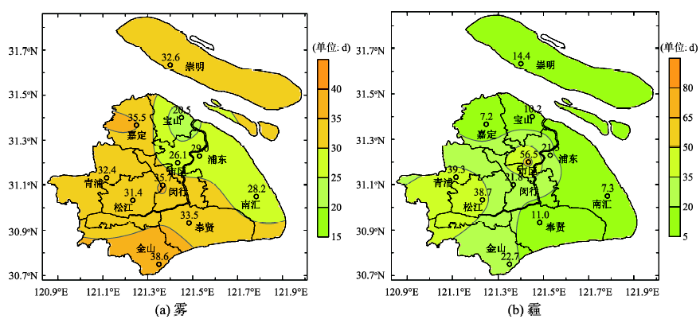
(5)雾:1961-2013年,上海年雾日数分布不均,总体呈现宝山、中心城区、浦东和南汇较少而金山较多的格局(图7(a))。宝山站的年雾日数为20.5 d,而金山达到38.6 d。雾在一年中各月都有发生,其中12月和11月雾日数最多,分别为4.4 d和3.8 d,8月雾日数最少(表1)。2012年雾日数仅有3.1 d,为近53年来最少,比常年同期偏少25.8 d,而1979年雾日数最多,达到55.5 d,偏多26.6 d。
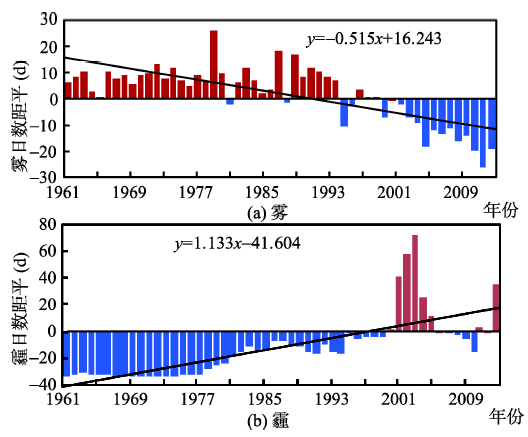
1961-2013年,上海年平均雾日数为31.2 d,且呈减少趋势,递减率为5.2 d/10 a(图8(a))。雾日数在1961-1990年变化不大,1991年以后,雾日数快速减少。2002-2013年上海雾日数都为负距平。
(6)霾:1961-2013年,上海年霾日数空间分布呈中心城区远远高于郊区,而郊区西部又远高于其他地区的特征(图7(b))。霾在一年中各月都有发生,其中12月和1月霾日数最多,分别为3.7 d和2.9 d,8月霾日数最少(表1)。徐家汇站的年霾日达56.5 d,而南汇站的年霾日数最少,仅有7.3 d,相差49.2 d。
图7 1961-2013年间上海年雾和霾日数的空间分布
Fig. 7 Spatial distribution of annual fog days and haze days in Shanghai during 1961-2013
1961-2013年,上海年平均霾日数为22.8 d,且呈增加趋势,增加率为11.3 d/10 a(图8(b))。霾日数在1961-1977年都较少,且变化不大,之后快速增加。2003年上海霾日数最多(平均106.2 d)。
图8 1961-2013年间上海年雾日数和霾日数距平变化
Fig. 8 Anomaly of annual fog days and haze days in Shanghai during 1961-2013
本文利用上海11个气象站1961-2013年气温、降水数据和主要天气现象记录资料,分析了上海主要气候要素和天气现象的时空分布和变化特征,主要结论如下:
(1)上海年平均气温呈现中心城区高、周边郊区低的分布,中心城区与郊区年均温差最大可达0.9 ℃。降水量在中心城区和南部地区较多,而在北部和西部地区较少。1961-2013年,上海年平均气温以0.39 ℃/10 d的线性趋势显著上升,尤其是1990年代以来,升温趋势显著;降水呈弱的增多 趋势,其中,在90年代偏多最多,而在60年代偏少最多。
(2)上海高温日数呈现中心城区和西北部地区明显多于东部和南部沿海地区的特征,中心城区年高温日数较远郊南汇多9.5 d。暴雨日数在上海中心城区和浦东地区较多,而在西部地区较少。雷暴、大风和大雾日数没有呈现出显著的城郊差异:雷暴日数多在26.0~28.0 d/a,大风日数在宝山最多,而雾日数在金山最多。中心城区霾日数远高于郊区,最多相差49.2 d。
(3)1961-2013年,上海高温和霾日数分别以2.7和11.3 d/10 a的线性趋势增加,暴雨日数呈弱的增加趋势,而雷暴、大风和雾日数分别以1.9、3.7和5.2 d/10 a的线性趋势减少。高温日数自2003年以后全部为正距平,大风日数则从1995年以后基本都为负距平。雷暴日数在1961-1980年间较快减少,雾日数自1991年以后快速减少,而霾日数在1977年以后快速增加。
The authors have declared that no competing interests exist.
| [1] |
近百年全球气候变暖的分析 [J].https://doi.org/10.3878/j.issn.1006-9895.1995.05.04 URL Magsci [本文引用: 2] 摘要
本文对比分析了IPCC,Vinnikov,Jones及Hansen的北半球,南半球及全球共12个地面温度序列,以及中国的气温序列。资料为1880—1991年。近百年气候变暖的速度为0.5℃/100 a。温度的长期变化趋势占序列总方差60%以上。但气候变暖有突变性,在1890年代中,1920年代中及1970年代末有3次突然气候变暖。分析表明,总的变暖趋势与CO2浓度及太阳活动有密切关系。火山活动也可能有一定作用。但前两次突然变暖可能与火山活动沉寂有关。最后一次突然变暖则可能是温室效应加剧的结果。
|
| [2] |
Climate change 2013: The physical science basis [M]. |
| [3] |
Managing the risks of extreme events and disasters to advance climate change adaptation [M]. |
| [4] |
An introduction to trends in extreme weather and climate events: Observations, socioeconomic impacts, terrestrial ecological impacts, and model projections [J].
Discusses the trends in extreme weather and climate events. Damaging effects on human society and infrastructure and on ecosystems and wildlife; Possible changes in climatic extremes due to natural climate fluctuations or under conditions of greenhouse gas-induced warming as shown by climate models.
|
| [5] |
Change trends of temperature and precipitation in the Loess Plateau Region of China, 1961-2010 [J].https://doi.org/10.1016/j.gloplacha.2012.05.010 URL 摘要
The Loess Plateau is the most severe soil and water loss area in the world. The changing trends of annual mean temperature and annual precipitation over the last 50years in the Loess Plateau Region (LPR) are investigated using observed time series from all available stations. The trends are assessed for both the entire LPR and its five integrated management divisions using the gridded data. It is shown that the region-averaged annual mean temperature has significantly increased over the last 50years (1.91°C/50yr), whereas the region-averaged annual precipitation shows a non-significant negative trend (6129.11mm/50yr). Spatially, there is an enhanced warming gradient but an obvious drying to weak wetting gradient from the southeast to the northwest across the region. On divisional scales, a significant warming trend is detected for all the divisions. A significant drying trend and a nearly significant drying trend are found for the first and second divisions, respectively, and a non-significant positive trend for other divisions. Therefore the region can be divided into the southeast warming and drying sub-region (SESR) and the northwest warming and weak wetting sub-region (NWSR). Further analysis shows that the SESR has a significant warming trend (1.71°C/50yr) and a significant drying trend (6147.62mm/50yr), and the NWSR has a significant warming trend (2.25°C/50yr) but a non-significant wetting trend (15.20mm/50yr). These results may have important implication in addressing the challenge of climate change in terms of the integrated management of the LPR.
|
| [6] |
Trends in temperature and rainfall extremes in the Yellow River source region, China [J].https://doi.org/10.1007/s10584-011-0056-2 URL Magsci [本文引用: 2] 摘要
Abstract<br/>Spatial and temporal changes in daily temperature and rainfall indices are analyzed for the source region of Yellow River. Three periods are examined: 1960–1990, 1960–2000 and 1960–2006. Significant warming trends have been observed for the whole study region over all the three periods, particularly over the period 1960–2006. This warming is mainly attributed to a significant increase in the minimum temperature, and characterized by pronounced changes in the low temperature events composing a significant increase in the magnitude and a significant decrease in the frequency. In contrast to the temperature indices, no significant changes have been observed in the rainfall indices at the majority of stations. However, the rainfall shows noticeable increasing trends during winter and spring from a basin-wide point of view. Conversely, the frequency and contribution of moderately heavy rainfall events to total rainfall show a significant decreasing trend in summer. To conclude, this study shows that over the past 40–45 years the source region of the Yellow River has become warmer and experienced some seasonally varying changes in rainfall, which also supports an emerging global picture of warming and the prevailing positive trends in winter rainfall extremes over the mid-latitudinal land areas of the Northern Hemisphere.<br/>
|
| [7] |
The Global Climate 2001-2010: A decade of climate extremes[R]. WMO-no.1103. Geneva, |
| [8] |
Changes in daily climate extremes in China and their connection to the large scale atmospheric circulation during 1961-2003 [J].https://doi.org/10.1007/s00382-009-0735-0 URL [本文引用: 1] 摘要
ABSTRACT Based on daily maximum and minimum surface air temperature and precipitation records at 303 meteorological stations in China, the spatial and temporal distributions of indices of climate extremes are analyzed during 1961–2003. Twelve indices of extreme temperature and six of extreme precipitation are studied. Temperature extremes have high correlations with the annual mean temperature, which shows a significant warming of 0.27°C/decade, indicating that changes in temperature extremes reflect the consistent warming. Stations in northeastern, northern, northwestern China have larger trend magnitudes, which are accordance with the more rapid mean warming in these regions. Countrywide, the mean trends for cold days and cold nights have decreased by 610.47 and 612.06days/decade respectively, and warm days and warm nights have increased by 0.62 and 1.75days/decade, respectively. Over the same period, the number of frost days shows a statistically significant decreasing trend of 613.37days/decade. The length of the growing season and the number of summer days exhibit significant increasing trends at rates of 3.04 and 1.18days/decade, respectively. The diurnal temperature range has decreased by 610.18°C/decade. Both the annual extreme lowest and highest temperatures exhibit significant warming trends, the former warming faster than the latter. For precipitation indices, regional annual total precipitation shows an increasing trend and most other precipitation indices are strongly correlated with annual total precipitation. Average wet day precipitation, maximum 1-day and 5-day precipitation, and heavy precipitation days show increasing trends, but only the last is statistically significant. A decreasing trend is found for consecutive dry days. For all precipitation indices, stations in the Yangtze River basin, southeastern and northwestern China have the largest positive trend magnitudes, while stations in the Yellow River basin and in northern China have the largest negative magnitudes. This is inconsistent with changes of water vapor flux calculated from NCEP/NCAR reanalysis. Large scale atmospheric circulation changes derived from NCEP/NCAR reanalysis grids show that a strengthening anticyclonic circulation, increasing geopotential height and rapid warming over the Eurasian continent have contributed to the changes in climate extremes in China. KeywordsClimate extremes–Atmospheric circulation–China
|
| [9] |
Evolution of Extreme Temperatures in Belgium since the 1950s [J]. |
| [10] |
上海百余年来气温日间波动特征及城市化影响 [J].
基于上海市区(徐家汇)气象站1873年-2009年和上海10个郊县气象站1960年-2009年逐日气温数据,利用气候统计诊断方法分析了上海最高和最低气温在两日间(简称日间)的波动特征及城市化影响,结果表明:1873年-2009年期间,上海最高气温日间降温日数逐渐增多,升温日数逐渐减少,最低气温日间降温日数呈多-少-多-少的年际变化,日间升温日数则呈少-多-少-多的年际变化。上海最高气温日间降温和升温幅度、降温和升温≥5℃日数和最低气温日间降温幅度、降温≥5℃日数都呈现出先增加后减少的年际变化,最低气温日间升温幅度和升温≥5℃日数在20世纪30年代前变化很小,从20世纪60年代至今明显减少。上海城市化增加了最高气温的日间波动幅度,并减少了最低气温的日间波动幅度,使得最高气温日间升温≥5℃日数增加和日间降温≥5℃日数减缓减少,最低气温日间降温和日间升温≥5℃日数均减少。
|
| [11] |
Characteristics of high impact weather and meteorological disaster in Shanghai, China [J].https://doi.org/10.1007/s11069-011-9877-6 URL Magsci [本文引用: 1] 摘要
Abstract<br/>This paper discusses the characteristics of high-impact weather events based on available data during 1960–2009, including the frequency and extreme value of rainstorm, typhoon, thunderstorm, strong wind, tornado, fog, haze and hot days in Shanghai, China. The frequency and spatial distribution of meteorological disasters and their impacts on both human and property during 1984–2009 are also discussed. Examination of the frequency indicates a decreasing trend in the occurrence of typhoon, thunderstorm, strong wind, tornado and fog, and an increasing trend in the occurrence of rainstorm, haze and hot days. The number of casualties caused by meteorological disasters appears to show a slight decreasing trend while the value of direct economic loss is increasing slightly during 1984–2009, and the number of collapsed or damaged buildings and the area of affected crops have no significant trend in Shanghai. These results can be attributed to the great efforts for prevention and mitigation of meteorological disasters made by Shanghai government in recent 60 years. With global climate change, urbanization and rapid economic development, Shanghai has become more vulnerable to high-impact weather and meteorological disaster, especially precipitation extreme, summer high temperature, haze and typhoon, so more strategies of mitigation and/or adaptation of natural disasters are quite useful and necessary for local government and the public in the future.<br/>
|
| [12] |
上海地区台风灾害损失评估 [J].
<p>台风是一种生成于热带或副热带洋面上的破坏性很强的天气系统。历史上台风对上海曾造成较大的影响和经济损失。利用上海气象站风、雨观测资料、上海基础地理信息数据、上海社会和经济数据以及台风灾情资料,利用逐步回归方法建立了上海台风灾害损失评估模型,并开展了上海台风灾损的年际变化和地区分布差异评价。结果表明建立的台风灾害损失评估模型可以用来进行台风灾损评估。近50 a来上海台风灾损度的变化趋势不明显,上海地区因台风影响造成的损失以沿海的崇明、南汇最严重,其次是地势低洼的青浦、金山和松江,中心城区和闵行台风灾损最低。由于历史台风灾情资料记载的不完整性和本评估未充分考虑上海社会经济发展及自然灾害防御能力的提高对台风灾损的影响,评估结果还具有一定的不确定性。深入综合考虑台风灾害致灾性和当地社会经济发展变化,建立更科学的台风灾害损失评估模型,是今后的研究方向</p>
|
| [13] |
上海大雾气候特征及风险区划研究 [J].
大雾作为一种比较常见的灾害性 天气,对交通运输和人体健康等都会造成严重的影响。基于上海市11个气象站1971-2000年的大雾数据和城市基础地理信息,利用地理信息系统和层次分 析法,结合专家调查法,建立了上海市大雾风险的评价指标体系和权重,开展了上海市大雾的风险特征及地理区划研究,获得了1 km空间分辨率的上海大雾气候特征图、上海城市对大雾敏感性特征图和上海市大雾风险区划图。初步研究表明,这种方法对城市大雾评估和风险区划是可行的。
|
| [14] |
近百余年来上海两次增暖期的特征对比及其成因 [J].https://doi.org/10.3321/j.issn:0375-5444.2000.04.013 URL [本文引用: 1] 摘要
利用上海 1 873~ 1 999年的气温等实测资料及 1 961~ 1 999年郊区的资料 ,在基本剔除城市化热岛效应对气候变化趋势的可能影响之后 ,研究上海近百余年来两次明显的增暖时期(1 937~ 1 953年和 1 987~ 1 999年 )气温结构分布特征 ,进行对比分析。结果表明 :1第一次增暖期的增温主要在白天 ,最高气温上升明显 ,季节中以夏季最突出 ;第二次增温期的增温主要是夜间气温升高引起的 ,最低气温具有显著增暖趋势 ,最高气温呈降温趋势 ,也以夏季最明显。这种变化使得气温日较差表现出明显的减小趋势。 2最高最低气温的变化是与太阳直接辐射的减少、散射辐射的增加以及 CO2 等温室气体导致的气候变暖造成大气水汽含量的增加相关联的。
|
| [15] |
上海降水百年变化趋势及其城郊的差异 [J].https://doi.org/10.1142/S0252959901000401 URL [本文引用: 1] 摘要
采用上海龙华中心气象站1893-1999年降水资料及上海周边郊县1960-1999年降水资料,分析上海降水的时空特征,研究结果表明:(1)上海年度降水存在着2a、3.2a、35.2a的准周期振动;上海百年气候按干湿状况可分为6个时期,1982年开始的这次多雨偏湿期周期趋向延长;上海降水的年际波动显著,旱涝灾害年发生概率为18.7%,上海气候特征在长江和钱塘江之间平原地区有相关广泛的代表性。(2)上海城郊降水存在着显著性差异,近40a市区降水增长率为郊县的1.5倍,城郊降水差异呈扩大趋势,上海城市雨岛效应主要存在于6-9月的梅雨和台风雨期间,有明显的雨岛中心,全市降水北片稍大于南片;多年降水有明显的长期趋势。而秋末到春季并无雨岛现象,全市降水南片略大于北片;多年降水表现为较强烈的波动性。
|
| [16] |
Climatic characteristics of high temperature in East China during 1961-2005 [J].https://doi.org/10.1007/s11442-008-0283-2 URL [本文引用: 1] 摘要
Based on the daily maximum temperature data covering the period 1961–2005, temporal and spatial characteristics and their changing in mean annual and monthly high temperature days(HTDs)and the mean daily maximum temperature(MDMT)during annual and monthly HTDs in East China were studied.The results show that the mean annual HTDs were 15.1 and the MDMT during annual HTDs was 36.3℃in the past 45 years.Both the mean annual HTDs and the MDMT during annual HTDs were negative anomaly in the1980s and positive anomaly in the other periods of time,oscillating with a cycle of about 12–15 years.The mean annual HTDs were more in the southern part,but less in the northern part of East China.The MDMT during annual HTDs was higher in Zhejiang,Anhui and Jiangxi provinces in the central and western parts of East China.The high temperature process(HTP) was more in the southwestern part,but less in northeastern part of East China.Both the HTDs and the numbers of HTP were at most in July,and the MDMT during monthly HTDs was also the highest in July.In the first 5 years of the 21st century,the mean annual HTDs and the MDMT during annual HTDs increased at most of the stations,both the mean monthly HTDs and the MDMT during monthly HTDs were positive anomalies from April to October,the number of each type of HTP generally was at most and the MDMT in each type of HTP was also the highest.
|
| [17] |
上海高温和低温气候变化特征及其影响因素 [J].https://doi.org/10.3969/j.issn.1004-8227.2009.12.010 URL 摘要
基于上海11个气象站逐日最高、最低气温、降水资料和西太平洋副热带高压(简称副高,下同) 环流指数,分析了上海夏季高温和冬季低温的气候变化特征及其影响因素。结果表明,1873~2007年,上海高温日数表现为少—多—少—多的年代际变化, 低温日数则表现为多—少的年代际变化。2001~2007年,上海年均高温日数、各级高温过程数和高温过程日数都最多,低温日数、低温过程数和低温过程日 数都最少。1960~2007年,上海每年高温日数与当年夏季副高面积和强度指数显著正相关,低温日数与当年冬季副高面积和强度指数显著负相关。降水对上 海极端气温有一定的缓解作用,上海高温日数与夏季降水量弱显著负相关,低温日数与冬季降水量显著负相关。上海高温过程数受城市化影响较大,其时间变化具有 明显的城郊差异,低温过程数则受城市化影响较小。
|
| [18] |
上海极端气温变化特征及其对城市化的响应 [J].
利用上海气象站逐日最高和最低气温资料,分析上海极端气温时间变化特征及对上海城市化的响应过程。结果表明上海1873~2007年极端最高气温总体上无显著变化趋势,极端最低气温以0.27℃/10 a的线性倾向率显著增加,2001~2007年,上海高温日数最多,低温日数最少。1960~2007年,上海极端最高气温和高温日数在市区增加较多,近郊和远郊增加较少;极端最低气温和低温日数市区和近郊减少较多,远郊减少较少。
|
| [19] |
Urbanization effect on trends of extreme temperature indices of national stations over mainland China, 1961-2008 [J].https://doi.org/10.1175/JCLI-D-13-00393.1 URL 摘要
Understanding the long-term change of extreme temperature events is important to the detection and attribution of climate change. It is unclear, however, how much effect urbanization has had on trends of the extreme temperature indices series constructed based on the commonly used datasets on a subcontinental scale. Applying a homogenized daily temperature dataset of the national reference climate stations and basic meteorological stations, and a rural station network previously developed, urbanization effects on trends of extreme temperature indices in mainland China for the time period 1961-2008 are evaluated. It is found that 1) the country-averaged annual- and seasonal-mean extreme temperature indices series generally experience statistically significant trends; 2) annual-mean urbanization effects in the country as a whole are statistically significant for daily minimum temperature (Tmin), maximum temperature (Tmax), and mean temperature of Tmin and Tmax (Tavg), reaching 0.07000°, 0.02300°, and 0.04700°C (10 yr)0903’1, respectively, with the largest values for annual-mean Tmin occurring in north China; 3) annual- and seasonal-mean urbanization effects for the declining diurnal temperature range (DTR) are highly significant, and the largest seasonal-mean DTR decline because of urbanization occurs in winter and spring; 4) annual-mean urbanization effects for the lowest Tmin, summer days, tropical nights, and frost days series are significant, but an insignificant urb
|
| [20] |
城市气候效应研究进展 [J].https://doi.org/10.3969/j.issn.1004-4965.2011.06.019 URL 摘要
城市是人类社会发展的必然产 物。随着城市的快速发展,城市气候效应凸显,并对社会经济可持续发展和人体健康等造成影响。基于国内外已有的研究成果,综述了城市气候效应,包括城市热岛 效应、雨岛效应、混浊岛效应、干岛效应和雷暴岛效应的研究历史、现状及其与城市化、天气气候变化的相互关系,并对未来城市气候效应的研究方向及技术方法进 行了展望。
|
| [21] |
北京地区夏季极端降水变化特征及城市化的影响 [J].https://doi.org/10.7519/j.issn.1000-0526.2013.12.012 URL 摘要
应用北京地区20站1971-2010年降水记录及城市发展数据,采用百分位方法定义极端降水事件的阈值,分析了北京地区夏季极端降水事件的时空变化特征及城市化的影响。结果表明:(1)北京夏季极端降水阈值及频数存在较强局地性特征,基本沿地形高度分布,极端降水频数多发区与高阈值区不完全对应;(2)近40年极端降水频率及强度均呈现下降趋势,年际及年代际差异显著;(3)城市化发展不同阶段极端降水强度及频数均有不同的分布形态,城市化对城市不同区域极端降水影响不一样,城市化导致城市下风向近郊区极端降水强度、次数均表现为增多趋势;(4)城市对极端降水的影响还与天气过程强度有关,强天气背景下城市对极端降水频数的影响程度高于对降水强度的影响。
|
| [22] |
上海地区不同重现期的风速估算研究 [J]. |
| [23] |
|

/
| 〈 |
|
〉 |

