苏巧梅 , 赵尚民, 郭建立
SU Qiaomei, ZHAO Shangmin, GUO Jianli
通讯作者:
收稿日期: 2017-05-18
修回日期: 2017-07-4
网络出版日期: 2017-12-25
版权声明: 2017 《地球信息科学学报》编辑部 《地球信息科学学报》编辑部 所有
基金资助:
作者简介:
作者简介:苏巧梅(1970-),女,博士,副教授,研究方向为遥感与GIS应用,GIS空间分析。E-mail: suqiaomei@tyut.edu.cn
展开
摘要
本文以山西省霍西煤矿区为研究区,利用遥感和GIS方法对滑坡灾害的敏感性进行了数值建模与定量评价。利用交叉检验方法构建了径向基核函数支持向量机滑坡敏感性评价模型,并基于拟合精度对模型进行了定量评价;对各评价因子在模型中的重要性进行对比分析;基于空间分辨率为30m的评价因子,通过径向基核函数支持向量机模型获得了霍西煤矿区滑坡敏感性指数值,并利用分位数法将霍西煤矿区的滑坡敏感性分为极高、高、中和低4个等级。结果表明:拟合精度建模阶段和验证阶段分别为87.22%和70.12%;与滑坡敏感性关系最密切的5个评价因子依次是岩性、距道路距离、坡向、高程和土地利用类型;极高和高敏感区域分布了93.49%的滑坡点,面积占总面积的50.99%,是比较合理的分级方案。本研究不仅可以为研究区人工边坡调查和煤矿资源合理开采提供借鉴,对相似矿区的相关工作也具有参考价值。
关键词:
Abstract
Taking Huoxi Coal Mine Area in Shanxi Province as the research area, we conducted numerical modeling and quantitative evaluation of landslide susceptibility using remote sensing and GIS technology. Based on the DEM with spatial resolution of 30 m × 30 m, five topographical parameters were derived: elevation, slope angle, slope aspect, plan curvature and profile curvature. Stratigraphic lithology was digitized based on the geological maps from Department of Geological Survey in 1:50 000 scale. Fault network, drainage network and road were digitized based on the geological maps and other thematic maps from Department of Land Resource in 1:50 000 scale. Then, buffer for faults, drainage, and road were done. Mining disturbance were digitized based on the planning maps of coal resources. If the point falls in the mine area, it is proved to be disturbed by the mining disturbance, otherwise is not affected. NDVI and land-use types interpreted and computed the Landsat TM images. Landslide data was collected by Bureau of Land and Resources and it is represented by the X, Y coordinates of its central point. Then, the correlation characteristics among evaluation factors and the spatial distribution of landslides were acquired by using remote sensing technology and GIS spatial analysis method. Repeated 5-fold cross validation method was adopted in this research and the landslide/non-landslide datasets were randomly split into a ratio of 80:20 for training and validating models. Based on the methods of the 5-fold cross-validation and the fitting accuracy to the constructed the landslide susceptibility assessment model-Radial Basis Function - Support Vector Machine (RBF-SVM), the precision of the models was quantitatively assessed. We calculated the importance of each evaluation factor in the RBF-SVM model. Meanwhile, we obtained landslide susceptibility map of Huoxi Coal Mine Area based on the RBF-SVM model. The landslide susceptibility of Huoxi Coal Mine Area was divided into four scales referencing the quantile law: low (0-0.02), medium (0.02-0.1), high (0.1-0.85) and very high (0.85-1) probability of landslide. The results show that: (1) the fitting accuracy was 87.22% in the modeling phase and 70.12% in the validation phase, respectively, for the RBF-SVM model; (2) it indicated that lithology, distance from road, slope aspect, elevation and land-use types have contribution to each model. Therefore, these five factors are most suitable conditioning factors for landslide susceptibility mapping in this area. Mining disturbance factors have little contribution to the model. The mining method in this area is underground mining and the mining depth is very deep affecting the stability of the slopes. (3) The number of landslides points in the very high region was 316, which account for 93.49% of the total number of landslides points and 50.99% of the total area. This study obtained the spatial distribution characteristics of the Huoxi Coalfield geological disasters and the quantitative evaluation of landslide susceptibility. It provides reference for the investigation about artificial slope in the research area monitoring the rational mining coal resources. It will also provide the reference for the related research in other similar coal region and management work.
Keywords:
地质灾害作为一种破坏性的地质事件对人类的生命财产和生存环境构成严重威胁,制约着人类的可持续发展。中国是世界上地质灾害严重的国家之一,而山西省属于滑坡敏感性省份,因为矿山开采容易引发和加剧崩塌、滑坡和泥石流的发生和发展[1]。滑坡敏感性评价是进行灾害评估的第一步,可以提供未来滑坡灾害敏感产生的分布地区,是减灾的有效方法。
近年来,随着以RS和GIS为主的地球空间信息技术的发展,为滑坡研究提供了新手段,RS和GIS为滑坡灾害在基础数据获取、空间数据分析、数据储存管理、空间数据建模、空间动态模拟等方面提供了新工具、新方法和新思路[2-4]。其中,机器学习和数据挖掘方法在滑坡预测中得到更多的关注。牛瑞卿等[5]指出传统的空间分析技术不易在巨大的多样滑坡数据集中发现隐藏的未知模式、趋势和关系,而数据挖掘技术则在滑坡敏感性评价和空间预测方面体现出优势。
支持向量机是机器学习方法中应用比较广泛的方法。Yao等[6]、胡德勇等[7]、戴福初等[8]在机器学习方法中应用了支持向量机模型,也有很多学者将支持向量机方法[9-14]引入到滑坡敏感性区划中。在矿山开采对地质灾害的影响方面,肖和平等[15]、翟文杰等[16]、王现国等[17]对煤矿区地质灾害的特征、成生机理和防治对策进行了研究。张国丽等[18]和Lee等[19]用人工神经网络模型分析了煤矿区地面沉降的敏感性。Suh等[20]利用确定性权重模型分析了采煤引起的地面沉降的敏感性。Oh等[21]用频率比模型分析煤矿废弃地周围的地面沉降敏感性。但在煤矿区滑坡敏感性分析统计模型研究方面,定量评价矿山开采影响的文献较少。
本文以山西省霍西煤矿为研究区,以滑坡地质灾害为研究对象,利用RS和GIS方法构建了滑坡敏感性评价因子和支持向量机评价模型,并对模型的精度进行分析;通过滑坡敏感性模型绘制了霍西煤矿区滑坡敏感性等级分布图,并对敏感性分布图的质量进行了评价。本研究可为煤矿区地质环境治理提供参考或指导,从而丰富和完善矿山地质环境评价治理方法理论体系。
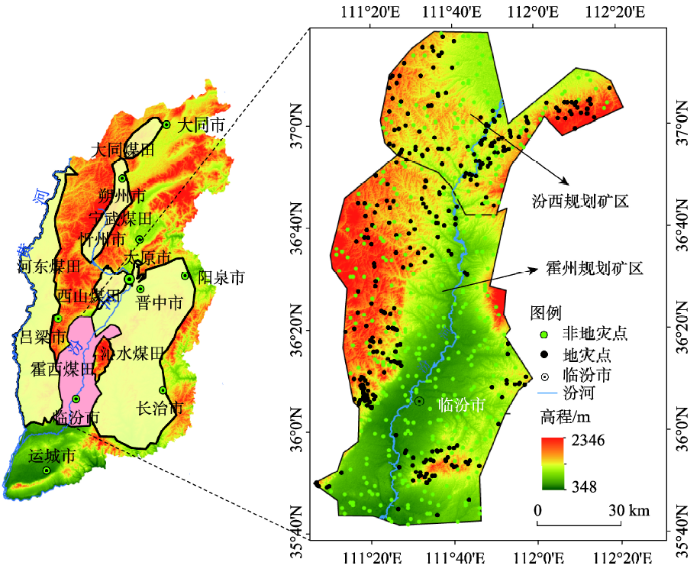
霍西煤矿区位于山西省中南部地区,面积约9800 km2,(35°40′28″~37°17′12″ N, 111°5′43″~ 112°21′26″ E),属于吕梁山与太岳山及其之间的汾河河谷地带,跨临汾、吕梁、晋中、长治、运城5个市,境内山川起伏,地貌复杂,山地、台地、盆地、丘陵等地貌类型均有分布,海拔高度分布在700~1600 m之间,盆地中发育着洪积扇、冲积平原或冲湖积平原,盆地边缘则是受分割的黄土台地,盆地周围是因断裂形成的山地[22]。
霍西煤矿区是温带大陆性季风气候区,且因地处内陆的中部地区,大陆性比较强。按照全国的气候分类结果,它属于暖温带气候亚带,是中国干旱与湿润地区的过渡位置。霍西煤矿区地理位置如图1所示。霍西煤矿区出露的地层是:太古界、上元古界、古生界和新生界。本区主要含煤地层为石炭系-上统-太原组和二叠系-下统-山西组。
霍西煤矿区分为汾西规划矿区和霍州规划矿区两部分,在汾西规划矿区,山西组平均厚度50 m,距地面深度760 m;太原组平均厚度90 m,距地面深度810 m。在霍州规划矿区,山西组平均厚度40 m,距地面深度150 m;太原组平均厚度85 m,距地面深度190 m。煤炭开采方式是井工式开采。本区的煤层涵盖了气煤、气肥煤、1/3焦煤、肥煤、焦煤、瘦煤、贫煤、无烟煤8类。
研究区有丰富的矿产资源,由于过度开采,在矿区形成地下采空区,采空区容易引发地表破坏,形成地质灾害;矿山废渣包括煤矸石、废矿渣、粉煤灰和尾矿等,使矿区地质环境破坏,诱发矿山地质灾害;交通路网修建、切坡建房也易导致滑坡灾害;地下水过量抽取引发地面沉降、水资源破坏等多种环境地质问题。
支持向量机是Vapnik等[23]发展起来的建立在统计学习理论的VC 维理论和结构风险最小原理基础上的一种机器学习方法。该模型是基于各种基函数将线性不可分的数据转换为高维空间,并在高维空间中找到超平面,实现线性可分的数据模式。模型优点在于当样本较少的情况下较好地解决了非线性及高维模式识别问题,已经广泛地用于趋势分析和模式识别中。
一般SVM(Support Vector Machine)被设计成用于解决2类分类问题,即同时存在正样本和负样本。2类SVM的目标是寻求一个n维空间上的超平面,以最大间隔区分,同时使分开的2类数据点距离分类面最远,这个超平面既可以是平面也可以是曲面。数学上表述为:
其中,约束条件为:
式中:||w||是超平面法向量的范数;b是标量。对于更一般的线性不可分实例,引入松弛因子ξi(i=1, 2, ⋯, n)来调整约束条件,如式(3)所示。
则得到式(1)的替代公式:
这里ν∈(0, 1]是一个新引进的对于错误分类的阈值。对于非线性不可分问题,核函数K(xi, xj)引入进来,核函数的选取对于SVM模型至关重要。虽然一些新的核函数被陆续提出,但径向基核函数(Radial Basis Function)是被广泛认同的基本核函数之一,其数学表达式为:
式中:核函数中的γ是参数,需要在构建模型时进行优化,以提高模型的拟合精度。
运用模型前必须对模型进行建模和验证以检验模型的适用性,而检验则多采用交叉检验的方法。这一方法既可以克服训练样本和验证样本不足的缺点,同时避免训练数据和验证数据重叠导致的评价结果过于乐观的不足。本文采用k折交叉检验(K-fold cross-validation)的方法,这种方法使用部分样本进行模型的建立,而用剩余的样本对所建立的模型进行验证,该方法将所有验证等分为k份,在进行模型建立时,应该用其余的k-1部分样本进行,而用第k个部分进行模型的检验,计算拟合模型的预测精度。与此步骤相同,需要对k=1,2,…,k分别进行一次模型的建立和检验,由此可得出预测误差的k个估计,合并这k个估计,从而用于评价模型的拟合精度。
滑坡分为狭义滑坡和广义滑坡。狭义滑坡是指部分斜坡沿着斜坡内的重力面的作用,向下做剪切运动的现象,广义滑坡是指包括崩塌、滑坡、泥石流和碎屑流等一切引起斜坡坡面级沟谷重力侵蚀的现象[24-25]。马秋红[26]指出崩塌、滑坡和泥石流往往在成因上相互联系、在时空上彼此相依,具有链生性的特点。因此,对这3类的评价可以用统一的模型来表征。本文的滑坡是指广义滑坡,包括崩塌、滑坡和泥石流,共有338个,由国土资源局采集,并由其中心点的X,Y坐标表示,坐标投影为高斯克吕格投影。研究区滑坡主要分布在海拔700~1500 m之间的低山、丘陵、中低山区。
本文选择支持向量机方法构建模型,模型目标为二值输出,为了匹配滑坡点,随机产生与滑坡点个数相等的非滑坡点,并将滑坡点数据和非滑坡点数据赋值,分别赋值为1和0,用于表征是否为滑坡点(1表示滑坡,0表示非滑坡)。其中,确立霍西煤矿区非滑坡点的原则为:① 非滑坡点离滑坡点距 离大于400 m;② 任何2个随机点间的距离大于200 m[14]。本文选择k=5,进行5折交叉检验,霍西煤矿区滑坡点和非滑坡点共计676个样点(338个滑坡点,338个非滑坡点),如图1所示。所有滑坡点和非滑坡点被随机平均分为5组,训练组包括540个点(270个滑坡点和270个非滑坡点),验证组包括136个点(68个滑坡点和68个非滑坡点),即80%的训练样本和20%的验证样本[27]。
本文用到的滑坡敏感性评价因子数据源包括分辨率为30 m的DEM数据(ASTER-GDEM)、遥感影像数据和其他统计数据,其中DEM数据(http://www.jspacesystems.or.jp/ersdac/GDEM/E/2.htm)和遥感影像(https://earthexplorer.usgs.gov/)由网上下载获取,其他统计数据包括地层岩性图等(表1)均由纸质图扫描数字化得到。
表1 霍西煤矿区地质灾害评价基础数据表
Tab. 1 The list of parameters and their range of Huoxi Coal Mine Area
| 基础因子 | 数据来源 | 数据分类 | 数据类型 |
|---|---|---|---|
| 高程/m | ASTER-GDEM(30 m) | 348~2346 | 连续值 |
| 平面曲率 | 0-82.03 | ||
| 剖面曲率 | 0-46.85 | ||
| 坡度/° | 0~64.5 | ||
| 坡向 | Flat;N;NE;E;SE;S;SW;W;NW | 分类值 | |
| 地层岩性 | 地质调查部门 (1:50 000) | 块状岩体;泥岩,页岩;砂岩,砂质页岩;灰岩;白云岩;页岩;煤,石灰岩; 粉砂质泥岩,砂岩;粘土,亚粘土;亚砂土,亚粘土;亚砂土;砂质粘土,砾石 | 分类值 |
| 距断层距离/m | <200,200~400,400~600,600~800,800~1000,>1000 | ||
| 距河流距离/m | 国土资源部门(1:50 000) | <100,100~200,200~300,300~400,400~500,>500 | 分类值 |
| 距道路距离/m | <100,100~200,200~300,300~400,400~500,>500 | ||
| 采矿扰动 | 开采区;非开采区 | ||
| 土地利用类型 | TM(30 m) | 耕地;林地;草地;住宅用地;工矿用地;水域 | 分类值 |
| NDVI | -0.414-0.631 | 连续值 |
注:水域不会产生滑坡,不包括在研究范围
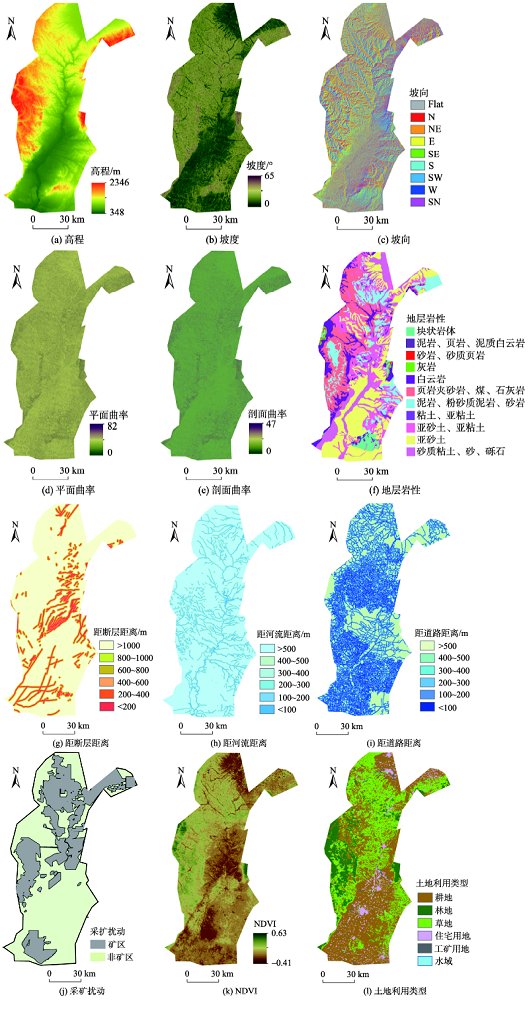
在DEM的基础上提取了高程、坡度、坡向、曲率因子;在各专题图基础上提取了距离道路距离、距离河流距离、距离断层距离,地层岩性等因子;把灾害点与矿区与非矿区关联,如果点落在矿区,说明它受到采矿扰动,相反,则没有受到采矿扰动,构建了采矿扰动因子;在遥感影像的基础上,在ENVI遥感软件支持下,通过解译得到土地利用分布图,NDVI分布图。构建的12个基础条件因子如图2所示。
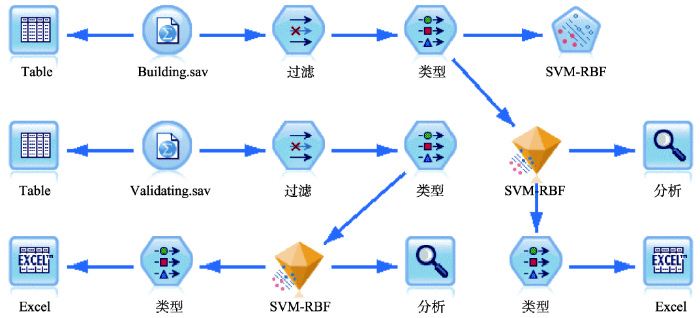
利用30 m基础评价因子、径向基核函数支持向量机模型和交叉检验方法,在软件SPSS Modeler 18中构建了模型的数据流,其运行界面见图3。
图3 径向基核函数支持向量机模型在SPSS Modeler18中构建的运行界面
Fig. 3 Vector machine models supported by radial basis function in SPSS Modeler18 environment
谭龙等[10]指出,应用支持向量机在敏感性评价中有2个关键问题需要解决:① 寻找一个脱离数据模式的最优的分类超平面;② 采用合理的核函数将线性不可分的数据映射到一个高维特征空间中使之线性可分。超平面和核函数的选择会直接影响模型的性能和拟合的精度,其中超平面选择的关键是成本函数和松弛变量,核函数的选择通常是通过拟合精度的对比选择一个最优的核函数,本文选择径向基核函数对研究区进行交叉验证。此外,本研究通过交叉验证对关键因子进行校正和优化,参数优化结果见表2。
表2 霍西煤矿区滑坡敏感性径向基核函数支持向量机模型参数(RBF核函数)
Tab. 2 Vector machine parame ters of geological disaster susceptibility supported by radial basis function in Huoxi Coal Mine Area
| 停止 标准 | 规则化 参数(C) | 回归准确度(Epsilon) | RBF伽马(RBF-γ) | 伽马(γ) | 度 |
|---|---|---|---|---|---|
| 1.0-3 | 0.8 | 0.1 | 0.95 | 1.0 | 3 |
通过交叉验证模型,得到混淆矩阵,并基于此计算摩西拟合精度,求取其均值结果:在建模阶段精度为87.22%,而验证阶段精度为70.12%,如表3所示。
表3 霍西煤矿区滑坡敏感性模型交叉检验精度/%
Tab. 3 Precision of cross-validation of landslide susceptibility models in Huoxi Coal Mine Area
| 阶段 | 平均值 | 标准差 |
|---|---|---|
| 建模 | 87.22 | 0.66 |
| 验证 | 70.12 | 4.07 |
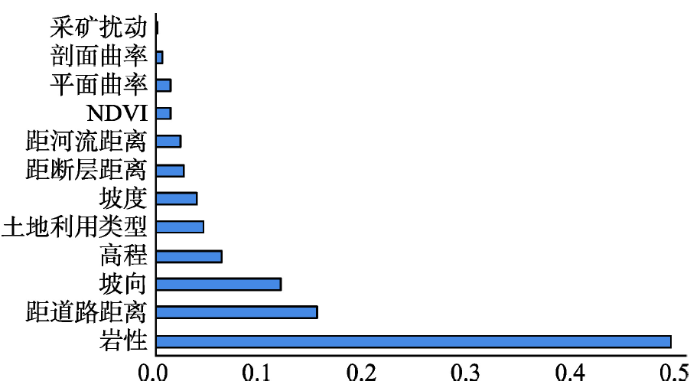
为进一步进行模型间的对比,将不同交叉验证的因子相对重要性结果求取其平均值,并绘制因子重要性模型分布图,结果见图4所示。分析结果如下:
图4 霍西煤矿区滑坡敏感性模型因子重要性
Fig. 4 Relative importance of conditioning factors of the landslide susceptibility models in Huoxi Coal Mine Area
(1)岩性是最重要的因子,因为滑坡发生滑动的物理条件主要是剪切破坏,因此,岩体的抗剪强度是衡量滑坡岩体稳定性的必要条件。从岩性对力学性质的影响可知,坚硬、致密的岩体其抗剪强度较高,不敏感产生滑坡;松散、破碎的岩体其抗剪强度低,容易产生滑坡。这一结果在许多研究中得到证实[28]。
(2)距道路距离对滑坡的影响较大,因为在路网修建过程中,造成的切坡、填方工程、大量堆弃物等,会改变原始的自然坡面,破坏坡面导致滑坡的发生。
(3)坡向。霍西煤矿区阳坡、半阳坡面积与阴坡、半阴坡所占的面积相差不大,但经统计,位于阳坡、半阳坡面的滑坡地灾点个数为218,占总数的64.50%,阴坡、半阴坡面的滑坡灾害个数为120个,占总数的35.50%。这主要是因为山地热量和降水的差异会影响局部的土壤、植被、和地质等。相对而言,阳坡比阴坡植被覆盖密集,山体内部水体易达到饱和状态,因此阳坡比阴坡发生滑坡灾害临界值相对较低。
(4)高程。因为地形地貌是影响滑坡灾害发育的决定性因素之一,通常情况下,高程差越大,切割越剧烈,滑坡灾害越发育。霍西煤矿区滑坡多发生在高差大的山地区域,其中91.42%的滑坡点发生低山丘陵和低中山区域。
(5)土地利用类型。经统计,工矿用地的滑坡灾害密度最大,说明工矿活动对滑坡灾害有密切关系,其次是草地和耕地,耕地和草地的植物根系没有深入土壤,对土地均没有加固作用,因此,一旦发生暴雨,地面灾害便很容易发生。
采矿扰动对滑坡几乎没有影响。本区主要含煤地层距地面最近150 m,最远平均810 m,开采方式全部为井工开采,对地表影响较小。
本文用交叉验证中准确率最高的批次为输入,经过模拟和等级划分,得到研究区的滑坡敏感性评价图。滑坡敏感性评价图中,其值越接近0表示所在栅格单元越稳定,发生滑坡的可能性越小;越接近1表示所在栅格单元越不稳定,发生滑坡的可能性越大。因为获得的滑坡敏感性是0-1范围内的连续数值,为了得到滑坡敏感性评价等级图,需要对敏感性概率划分为若干类。
文献[29]提出,滑坡敏感性区划划分精度的评价应该从2个方面进行:① 已发生的地质灾害点应该尽可能高地被划分到敏感性等级高的区域中,这样的目的在于评价已有滑坡敏感性划分等级定级的精度;② 在所有普查的中,被预测为敏感性等级高的点应该占尽量低的比例,这样做的目的在于尽量降低高敏感性滑坡预测的冗余,提升敏感性评价的命中率。
根据上述标准,为了评价敏感性等级划分标准的优劣,首先基于径向基核函数支持向量机模型,提取霍西煤矿区普查滑坡点敏感性的预测值,并对预测值进行统计,再采用分位数分类方法,获得霍西煤矿区滑坡敏感性分级标准,即:极高(85-100)、高(10-85)、中(2-10)和低(0-2)4个等级。统计分类后各等级的滑坡点个数、对应的百分比和面积百分比,结果如表4所示。
表4 霍西煤矿区滑坡敏感性分级及滑坡点分布情况
Tab. 4 Landslide susceptibility classification and distributions of landslide in Huoxi Coal Mine Area
| 等级 | 预测值/% | 灾害点数量/个 | 数量百分比/% | 面积百分比/% |
|---|---|---|---|---|
| 低 | 0-2 | 1 | 0.30 | 20.38 |
| 中 | 2-10 | 21 | 6.21 | 28.64 |
| 高 | 10-85 | 67 | 19.82 | 25.71 |
| 极高 | 85-100 | 249 | 73.67 | 25.28 |
由表4可知,按照敏感性值等级划分的4个标准,滑坡灾害点分布在极高、高、中、低4个等级中的数量为:249、67、21和1,数量百分比分别为73.67%、19.82%、6.21%和0.30%,面积百分比为25.28%、25.71、28.64和20.38%。极高和高敏感区域分布了93.49%的滑坡点,面积占到总面积的50.99%,是比较合理的分级方案。依据分位数法划分分级标准,可以得到滑坡敏感性评价图,结果如图5所示。
此敏感性评价图可以在资金有限的情况下,用于制定灾害治理的优先级。这样,在霍西煤矿区普查数据基础上,准确定位到每一次灾害,选择治理极高和高危险区的灾害。
(1)基于径向基核函数支持向量机模型,根据拟合精度评价指标,利用交叉检验方法对霍西煤矿区滑坡敏感性进行评价,模型拟合精度结果在建模和验证阶段分别为87.22%和70.12%;
(2)对各评价因子在模型中的重要性进行对比,结果表明与滑坡敏感性关系最密切的5个评价因子依次是岩性、距道路距离、坡向、高程和土地利用类型。
(3)利用分位数法将霍西煤矿区的滑坡敏感性分为极高、高、中和低4个等级,极高和高敏感区域分布了93.49%的滑坡点,面积占到总面积的50.99%,统计结果表明该方案是比较合理的分级方案。
The authors have declared that no competing interests exist.
| [1] |
中国矿山地质灾害分布特征 [J].Distribution characteristics of mine geological hazards in China [J]. |
| [2] |
|
| [3] |
Use of Geomorphological Information in Indirect Landslide Susceptibility Assessment [J].https://doi.org/10.1023/B:NHAZ.0000007097.42735.9e URL 摘要
The objective of this paper is to evaluate the importance of geomorphological expert knowledge in the generation of landslide susceptibility maps, using GIS supported indirect bivariate statistical analysis. For a test area in the Alpago region in Italy a dataset was generated at scale 1:5,000. Detailed geomorphological maps were generated, with legends at different levels of complexity. Other factor maps, that were considered relevant for the assessment of landslide susceptibility, were also collected, such as lithology, structural geology, surficial materials, slope classes, land use, distance from streams, roads and houses. The weights of evidence method was used to generate statistically derived weights for all classes of the factor maps. On the basis of these weights, the most relevant maps were selected for the combination into landslide susceptibility maps. Six different combinations of factor maps were evaluated, with varying geomorphological input. Success rates were used to classify the weight maps into three qualitative landslide susceptibility classes. The resulting six maps were compared with a direct susceptibility map, which was made by direct assignment of susceptibility classes in the field. The analysis indicated that the use of detailed geomorphological information in the bivariate statistical analysis raised the overall accuracy of the final susceptibility map considerably. However, even with the use of a detailed geomorphological factor map, the difference with the separately prepared direct susceptibility map is still significant, due to the generalisations that are inherent to the bivariate statistical analysis technique.
|
| [4] |
Debris flow susceptibility assessment by GIS and information value model in a large-scale region, Sichuan Province (China) [J].https://doi.org/10.1007/s11069-012-0414-z URL Magsci [本文引用: 1] 摘要
Debris flow susceptibility assessment is the premise of risk assessment. In this paper, Sichuan Province is chosen as a study area, where debris flow disasters happen frequently. Information value model is applied to calculate the information values of seven environmental factors, namely elevation, slope, aspect, flow accumulation, vegetation coverage, soil type and land-use type. Geographic information system technology is used to analyze the comprehensive information values so as to determine the debris flow susceptibility. The results show that the northeast, the central and the south of Sichuan are the most hazardous regions, which display a zonal distribution feature from the southeast to the south. From the validation results, 7.53 % of the total area suffers from high susceptibility and 19.97 % suffers from very high susceptibility. However, 80 % of the debris flows are concentrated in two regions. The actual occurrence ratios of debris flows of the high-susceptibility and very high-susceptibility areas are 4.95 and 2.14, respectively.
|
| [5] |
利用数据挖掘的滑坡监测数据处理流程 [J].
为有效处理海量、多种类的滑坡监测数据,提出了基于数据挖掘的滑坡监测数据处理流程。以白家包滑坡为例,利用k-means算法对监测数据进行定性处理,进而利用Apriori算法分析滑坡形变的诱发因素。实验结果表明,提出的流程能有效地处理滑坡监测数据,并发掘到有助于人们认识滑坡形变及其原因的知识。
Technological flow for processing Landslide-monitoring data based on data mining [J].
为有效处理海量、多种类的滑坡监测数据,提出了基于数据挖掘的滑坡监测数据处理流程。以白家包滑坡为例,利用k-means算法对监测数据进行定性处理,进而利用Apriori算法分析滑坡形变的诱发因素。实验结果表明,提出的流程能有效地处理滑坡监测数据,并发掘到有助于人们认识滑坡形变及其原因的知识。
|
| [6] |
Landslide susceptibility mapping based on Support Vector Machine: A case study on natural slopes of Hong Kong, China [J].https://doi.org/10.1016/j.geomorph.2008.02.011 URL [本文引用: 1] 摘要
The Support Vector Machine (SVM) is an increasingly popular learning procedure based on statistical learning theory, and involves a training phase in which the model is trained by a training dataset of associated input and target output values. The trained model is then used to evaluate a separate set of testing data. There are two main ideas underlying the SVM for discriminant-type problems. The first is an optimum linear separating hyperplane that separates the data patterns. The second is the use of kernel functions to convert the original non-linear data patterns into the format that is linearly separable in a high-dimensional feature space. In this paper, an overview of the SVM, both one-class and two-class SVM methods, is first presented followed by its use in landslide susceptibility mapping. A study area was selected from the natural terrain of Hong Kong, and slope angle, slope aspect, elevation, profile curvature of slope, lithology, vegetation cover and topographic wetness index (TWI) were used as environmental parameters which influence the occurrence of landslides. One-class and two-class SVM models were trained and then used to map landslide susceptibility respectively. The resulting susceptibility maps obtained by the methods were compared to that obtained by the logistic regression (LR) method. It is concluded that two-class SVM possesses better prediction efficiency than logistic regression and one-class SVM. However, one-class SVM, which only requires failed cases, has an advantage over the other two methods as only ailed case information is usually available in landslide susceptibility mapping.
|
| [7] |
GIS支持下滑坡灾害空间预测方法研究 [J].https://doi.org/10.11834/jrs.200706115 URL Magsci [本文引用: 1] 摘要
滑坡预测在防灾减灾工作中具有重要意义,它包括空间、时间预测两个方面。基于统计模型进行区域评价与空间预测是滑坡灾害研究的重要方向,但是预测结果往往依赖样本数量和空间分布等。本文以马来西亚金马伦高原为研究区,选择高程、坡度、坡向、地表曲率、构造、土地覆盖、地貌类型、道路和排水系统作为评价因子,探讨运用地理信息系统(GIS)和遥感(RS)获取与管理滑坡灾害信息,以及热带雨林地区湿热环境下滑坡空间预测的方法。支持向量机(SVM)和逻辑(Logistic)回归模型分别应用于滑坡空间预测,结果显示平均预测精度分别为95.9%和86.2%,SVM法具有较高的描述精度,值得推荐;同时,基于SVM模型的滑坡空间预测受样本影响较小,预测结果相对比较稳定,这对于滑坡灾害区域评价与预测的快速实现具有实际意义。
GIS-based landslide spatial prediction methods: A case study in Cameron Highland, Malaysia [J].https://doi.org/10.11834/jrs.200706115 URL Magsci [本文引用: 1] 摘要
滑坡预测在防灾减灾工作中具有重要意义,它包括空间、时间预测两个方面。基于统计模型进行区域评价与空间预测是滑坡灾害研究的重要方向,但是预测结果往往依赖样本数量和空间分布等。本文以马来西亚金马伦高原为研究区,选择高程、坡度、坡向、地表曲率、构造、土地覆盖、地貌类型、道路和排水系统作为评价因子,探讨运用地理信息系统(GIS)和遥感(RS)获取与管理滑坡灾害信息,以及热带雨林地区湿热环境下滑坡空间预测的方法。支持向量机(SVM)和逻辑(Logistic)回归模型分别应用于滑坡空间预测,结果显示平均预测精度分别为95.9%和86.2%,SVM法具有较高的描述精度,值得推荐;同时,基于SVM模型的滑坡空间预测受样本影响较小,预测结果相对比较稳定,这对于滑坡灾害区域评价与预测的快速实现具有实际意义。
|
| [8] |
滑坡灾害空间预测支持向量机模型及其应用 [J].https://doi.org/10.3321/j.issn:1005-2321.2007.06.019 URL [本文引用: 1] 摘要
随着GIS技术在滑坡灾害空间预测研究中的广泛应用,滑坡灾害空间预测模型成为研究的热点问题。在总结滑坡灾害空间预测研究现状的基础上,简要介绍了两类和单类支持向量机的基本原理。以香港自然滑坡空间预测为例,采用两类和单类支持向量机进行滑坡灾害空间预测,并与Logistic回归模型进行了比较。结果表明,两类支持向量机模型优于Logistic回归模型,而Logistic回归模型优于单类支持向量机模型。
Landslide susceptibility mapping using support vector machine [J].https://doi.org/10.3321/j.issn:1005-2321.2007.06.019 URL [本文引用: 1] 摘要
随着GIS技术在滑坡灾害空间预测研究中的广泛应用,滑坡灾害空间预测模型成为研究的热点问题。在总结滑坡灾害空间预测研究现状的基础上,简要介绍了两类和单类支持向量机的基本原理。以香港自然滑坡空间预测为例,采用两类和单类支持向量机进行滑坡灾害空间预测,并与Logistic回归模型进行了比较。结果表明,两类支持向量机模型优于Logistic回归模型,而Logistic回归模型优于单类支持向量机模型。
|
| [9] |
基于不同核函数的2010年玉树地震滑坡空间预测模型研究 [J].The 2010 Yushu earthquake triggered landslide spatial prediction models based on several kernel functions types [J]. |
| [10] |
逻辑回归与支持向量机模型在滑坡敏感性评价中的应用 [J].https://doi.org/10.3969/j.issn.1004-9665.2014.01.008 URL Magsci [本文引用: 1] 摘要
白龙江流域是我国滑坡泥石流灾害四大高发区之一,进行该区域滑坡敏感性评价,能够为决策者在灾害管理和设施建设规划方面提供帮助,对区域防灾减灾具有重要指导意义。本研究采用边坡单元为基本研究单元,在野外调查及前人研究基础上,选择控制该区域滑坡发育的19个要素作为影响因子;经过主成分分析和独立性检验得到该区域对滑坡形成贡献最大的6个因子:高程、坡度、坡向、岩性、断裂距离和人口密度;分别使用二元逻辑回归模型(LR)和支持向量机模型(SVM)对该区域进行滑坡敏感性评价;最后,采用ROC曲线对模型精度进行验证。研究结果表明,两模型各能将38.76%、14.48%、9.40%、11.28%、26.07%和13.49%、21.61%、8.17%、26.70%、30.04%的边坡单元分别预测为极高危险区、高危险区、中度危险区、低危险区和极低危险区;精度验证结果表明两种模型均能有效地进行该区域滑坡敏感性评价,并且支持向量机模型具有更好的分类能力、预测精度和稳定性。
Landslide susceptibility mapping based on logistic regression and support vector machines [J].https://doi.org/10.3969/j.issn.1004-9665.2014.01.008 URL Magsci [本文引用: 1] 摘要
白龙江流域是我国滑坡泥石流灾害四大高发区之一,进行该区域滑坡敏感性评价,能够为决策者在灾害管理和设施建设规划方面提供帮助,对区域防灾减灾具有重要指导意义。本研究采用边坡单元为基本研究单元,在野外调查及前人研究基础上,选择控制该区域滑坡发育的19个要素作为影响因子;经过主成分分析和独立性检验得到该区域对滑坡形成贡献最大的6个因子:高程、坡度、坡向、岩性、断裂距离和人口密度;分别使用二元逻辑回归模型(LR)和支持向量机模型(SVM)对该区域进行滑坡敏感性评价;最后,采用ROC曲线对模型精度进行验证。研究结果表明,两模型各能将38.76%、14.48%、9.40%、11.28%、26.07%和13.49%、21.61%、8.17%、26.70%、30.04%的边坡单元分别预测为极高危险区、高危险区、中度危险区、低危险区和极低危险区;精度验证结果表明两种模型均能有效地进行该区域滑坡敏感性评价,并且支持向量机模型具有更好的分类能力、预测精度和稳定性。
|
| [11] |
Landslide susceptibility mapping using GIS-based multi-criteria decision analysis, support vector machines, and logistic regression [J].https://doi.org/10.1007/s10346-013-0391-7 URL Magsci 摘要
Identification of landslides and production of landslide susceptibility maps are crucial steps that can help planners, local administrations, and decision makers in disaster planning. Accuracy of the landslide susceptibility maps is important for reducing the losses of life and property. Models used for landslide susceptibility mapping require a combination of various factors describing features of the terrain and meteorological conditions. Many algorithms have been developed and applied in the literature to increase the accuracy of landslide susceptibility maps. In recent years, geographic information system-based multi-criteria decision analyses (MCDA) and support vector regression (SVR) have been successfully applied in the production of landslide susceptibility maps. In this study, the MCDA and SVR methods were employed to assess the shallow landslide susceptibility of Trabzon province (NE Turkey) using lithology, slope, land cover, aspect, topographic wetness index, drainage density, slope length, elevation, and distance to road as input data. Performances of the methods were compared with that of widely used logistic regression model using ROC and success rate curves. Results showed that the MCDA and SVR outperformed the conventional logistic regression method in the mapping of shallow landslides. Therefore, multi-criteria decision method and support vector regression were employed to determine potential landslide zones in the study area.
|
| [12] |
Susceptibility mapping of shallow landslides using kernel-based Gaussian process, support vector machines and logistic regression [J].https://doi.org/10.1016/j.jafrearsci.2016.02.019 URL 摘要
Identification of landslide prone areas and production of accurate landslide susceptibility zonation maps have been crucial topics for hazard management studies. Since the prediction of susceptibility is one of the main processing steps in landslide susceptibility analysis, selection of a suitable prediction method plays an important role in the success of the susceptibility zonation process. Although simple statistical algorithms (e.g. logistic regression) have been widely used in the literature, the use of advanced non-parametric algorithms in landslide susceptibility zonation has recently become an active research topic. The main purpose of this study is to investigate the possible application of kernel-based Gaussian process regression (GPR) and support vector regression (SVR) for producing landslide susceptibility map of Tonya district of Trabzon, Turkey. Results of these two regression methods were compared with logistic regression (LR) method that is regarded as a benchmark method. Results showed that while kernel-based GPR and SVR methods generally produced similar results (90.46% and 90.37%, respectively), they outperformed the conventional LR method by about 18%. While confirming the superiority of the GPR method, statistical tests based on ROC statistics, success rate and prediction rate curves revealed the significant improvement in susceptibility map accuracy by applying kernel-based GPR and SVR methods.
|
| [13] |
A comparative study on the predictive ability of the decision tree, support vector machine and neuro-fuzzy models in landslide susceptibility mapping using GIS [J].https://doi.org/10.1016/j.cageo.2012.08.023 URL 摘要
The purpose of the present study is to compare the prediction performances of three different approaches such as decision tree (DT), support vector machine (SVM) and adaptive neuro-fuzzy inference system (ANFIS) for landslide susceptibility mapping at Penang Hill area, Malaysia. The necessary input parameters for the landslide susceptibility assessments were obtained from various sources. At first, landslide locations were identified by aerial photographs and field surveys and a total of 113 landslide locations were constructed. The study area contains 340,608 pixels while total 8403 pixels include landslides. The landslide inventory was randomly partitioned into two subsets: (1) part 1 that contains 50% (4000 landslide grid cells) was used in the training phase of the models; (2) part 2 is a validation dataset 50% (4000 landslide grid cells) for validation of three models and to confirm its accuracy. The digitally processed images of input parameters were combined in GIS. Finally, landslide susceptibility maps were produced, and the performances were assessed and discussed. Total fifteen landslide susceptibility maps were produced using DT, SVM and ANFIS based models, and the resultant maps were validated using the landslide locations. Prediction performances of these maps were checked by receiver operating characteristics (ROC) by using both success rate curve and prediction rate curve. The validation results showed that, area under the ROC curve for the fifteen models produced using DT, SVM and ANFIS varied from 0.8204 to 0.9421 for success rate curve and 0.7580 to 0.8307 for prediction rate curves, respectively. Moreover, the prediction curves revealed that model 5 of DT has slightly higher prediction performance (83.07), whereas the success rate showed that model 5 of ANFIS has better prediction (94.21) capability among all models. The results of this study showed that landslide susceptibility mapping in the Penang Hill area using the three approaches (e.g., DT, SVM and ANFIS) is viable. As far as the performance of the models are concerned, the results appeared to be quite satisfactory, i.e., the zones determined on the map being zones of relative susceptibility.
|
| [14] |
Landslide susceptibility mapping based on Support Vector Machine: A case study on natural slopes of Hong Kong, China [J].https://doi.org/10.1016/j.geomorph.2008.02.011 URL [本文引用: 2] 摘要
The Support Vector Machine (SVM) is an increasingly popular learning procedure based on statistical learning theory, and involves a training phase in which the model is trained by a training dataset of associated input and target output values. The trained model is then used to evaluate a separate set of testing data. There are two main ideas underlying the SVM for discriminant-type problems. The first is an optimum linear separating hyperplane that separates the data patterns. The second is the use of kernel functions to convert the original non-linear data patterns into the format that is linearly separable in a high-dimensional feature space. In this paper, an overview of the SVM, both one-class and two-class SVM methods, is first presented followed by its use in landslide susceptibility mapping. A study area was selected from the natural terrain of Hong Kong, and slope angle, slope aspect, elevation, profile curvature of slope, lithology, vegetation cover and topographic wetness index (TWI) were used as environmental parameters which influence the occurrence of landslides. One-class and two-class SVM models were trained and then used to map landslide susceptibility respectively. The resulting susceptibility maps obtained by the methods were compared to that obtained by the logistic regression (LR) method. It is concluded that two-class SVM possesses better prediction efficiency than logistic regression and one-class SVM. However, one-class SVM, which only requires failed cases, has an advantage over the other two methods as only ailed case information is usually available in landslide susceptibility mapping.
|
| [15] |
我国煤矿的主要地质灾害及防治对策 [J].https://doi.org/10.3969/j.issn.1003-8035.2001.01.013 URL [本文引用: 1] 摘要
文章综合分析了煤矿区地震、滑坡、地面沉陷与塌陷、煤与瓦斯突出 及突水等主要地质灾害。通过对各类灾害特征、成生机理及危害的研究,认为:(1)煤矿地质灾害严重地危害着矿山正常生产和人民生活;(2)煤矿矿震生成主 要是脆硬-软地层结构、褶皱构造、构造活化区及地下水突变、采煤卸载等内外环境因子综合作用的结果;(3)煤矿滑坡、地面沉陷及塌陷、煤与瓦斯突出和突水 等地质灾害是矿区工程活动破坏了地质构造和生态环境、山体原始平衡所致。在此基础上,提出了煤矿地质灾害链和防御措施。
Important geological hazards of coal-mine and its prevention measures in China [J].https://doi.org/10.3969/j.issn.1003-8035.2001.01.013 URL [本文引用: 1] 摘要
文章综合分析了煤矿区地震、滑坡、地面沉陷与塌陷、煤与瓦斯突出 及突水等主要地质灾害。通过对各类灾害特征、成生机理及危害的研究,认为:(1)煤矿地质灾害严重地危害着矿山正常生产和人民生活;(2)煤矿矿震生成主 要是脆硬-软地层结构、褶皱构造、构造活化区及地下水突变、采煤卸载等内外环境因子综合作用的结果;(3)煤矿滑坡、地面沉陷及塌陷、煤与瓦斯突出和突水 等地质灾害是矿区工程活动破坏了地质构造和生态环境、山体原始平衡所致。在此基础上,提出了煤矿地质灾害链和防御措施。
|
| [16] |
抚顺西露天煤矿地质灾害预测 [J].Prediction of geological hazard in west open pit of Fushun coal mine [J]. |
| [17] |
小秦岭矿区地质灾害发育特征与易发性分区 [J].Analysis of geological hazards development characteristics and effect factors in Xiao Qinling Mountains mining area [J]. |
| [18] |
基于GIS与BP神经网络的采空塌陷易发性预测 [J].https://doi.org/10.13284/j.cnki.rddl.002756 URL [本文引用: 1] 摘要
以湖北省鄂州程潮铁矿和黄石大冶铁矿为例,利用GIS空间分析功 能对研究区数据进行提取分级、赋值统计及归一化等处理,构建了包括高程、坡度、地层、地下开采点的分布密度、相距最近地下开采点的距离、开采厚度与深度比 值、蚀变接触带缓冲区、地下水深度以及地表地物类型的矿区采空塌陷易发性评价指标数据集;借助IDL语言调用Matlab神经网络工具箱,将研究区 2011和2012年的指标数据集作为输入数据,塌陷易发性作为期望输出,建立基于BP神经网络的矿区采空塌陷易发性预测模型;通过选取并优化训练样本, 实现对2013年矿山塌陷易发性的预测。结果表明,高易发区及以上的区域包含89.91%的采空塌陷,随着易发等级的提高,采空塌陷面积占易发等级面积比 也随之增大;采空塌陷的分布具有明显的地带性,高易发区基本沿着岩体与围岩的接触带分布。模型解决了塌陷预测中的非线性映射问题,预测结果与实际调查情况 基本吻合。BP 神经网络模型与GIS技术相结合预测矿区采空塌陷的易发性具有可行性。
|
| [19] |
Spatial prediction of ground subsidence susceptibility using an Artificial Neural Network [J].https://doi.org/10.1007/s00267-011-9766-5 URL PMID: 22005969 Magsci [本文引用: 1] 摘要
Ground subsidence in abandoned underground coal mine areas can result in loss of life and property. We analyzed ground subsidence susceptibility (GSS) around abandoned coal mines in Jeong-am, Gangwon-do, South Korea, using artificial neural network (ANN) and geographic information system approaches. Spatial data of subsidence area, topography, and geology, as well as various ground-engineering data, were collected and used to create a raster database of relevant factors for a GSS map. Eight major factors causing ground subsidence were extracted from the existing ground subsidence area: slope, depth of coal mine, distance from pit, groundwater depth, rock-mass rating, distance from fault, geology, and land use. Areas of ground subsidence were randomly divided into a training set to analyze GSS using the ANN and a test set to validate the predicted GSS map. Weights of each factor’s relative importance were determined by the back-propagation training algorithms and applied to the input factor. The GSS was then calculated using the weights, and GSS maps were created. The process was repeated ten times to check the stability of analysis model using a different training data set. The map was validated using area-under-the-curve analysis with the ground subsidence areas that had not been used to train the model. The validation showed prediction accuracies between 94.84 and 95.98%, representing overall satisfactory agreement. Among the input factors, “distance from fault” had the highest average weight (i.e., 1.5477), indicating that this factor was most important. The generated maps can be used to estimate hazards to people, property, and existing infrastructure, such as the transportation network, and as part of land-use and infrastructure planning.
|
| [20] |
GIS-based evaluation of mining-induced subsidence susceptibility considering 3D multiple mine drifts and estimated mined panels [J].https://doi.org/10.1007/s12665-016-5695-1 URL [本文引用: 1] 摘要
Abstract This paper presents a case study of subsidence hazard mapping in the vicinity of an abandoned coal mine within geographic information system (GIS) environment. A geospatial database was constructed using mine drift maps, topographic maps, land use maps, road maps, building maps, borehole data, and subsidence inventory maps showing occurrences of past subsidence events. Six raster-type factor layers (i.e., an influential area instability (IAI) layer calculated using multiple mine drifts and estimated mined panels, land use, distance from nearest railroad, distance from nearest road, and slope gradient) were generated and extracted from the database to identify relationships between past subsidence occurrences and the factors. Two IAI factors incorporate the complex effects of ground IAI and are calculated using the depths of each underground cavity and its angle of draw. A weight of evidence model was used to establish optimal correlations, expressed as contrast values (CVs) for subsidence inventory data, and inputs of all factors. Six CV layers (one for each factor) were linearly combined to generate a subsidence hazard map representing the relative vulnerability to subsidence in the study area. The area under the cumulative frequency diagram technique was then used to verify predicted subsidence hazards by comparing estimated susceptibility rankings over the entire range of grid cells with actual subsidence occurrences; the proposed GIS analysis model showed an accuracy of 91.09 % in the prediction of subsidence occurrences. Moreover, field surveys showed buildings with severe subsidence-related damage (damage level 4 or 5, according to the National Coal Board) in regions with very high subsidence hazard indices. Finally, a factor negatively correlated with subsidence prediction (slope angle) was determined from the sensitivity analysis.
|
| [21] |
Sensitivity analysis for the GIS-based mapping of the ground subsidence hazard near abandoned underground coal mines [J].https://doi.org/10.1007/s12665-010-0855-1 URL Magsci [本文引用: 1] 摘要
Ground subsidence around abandoned underground coal mines can cause much loss of life and property. We analyze factors that can affect ground subsidence around abandoned mines in Jeongahm in Kangwon-do by sensitivity analysis in geographic information system (GIS). Spatial data for the subsidence area, topography and geology and various ground engineering data were collected and used to make a factor raster database for a ground subsidence hazard map. To determine the importance of extracted subsidence-related factors, frequency ratio model and sensitivity analysis were employed. Sensitivity analysis is a method for comparing the combined effects of all factors except one. Sensitivity analysis and its verification showed that using all factors provided 91.61% accuracy. The best accuracy was achieved by not considering the groundwater depth (92.77%) and the worst by not considering the lineament (85.42%). The results show that the distance from the lineament and the distance from the drift highly affected the occurrence of ground subsidence, and the groundwater depth, land use and rock mass rating had the least effects. Thus, we determined causes of ground subsidence in the study area and this information could help in the prediction of ground subsidence in other areas.
|
| [22] |
|
| [23] |
Landslide susceptibility analysis and its verification using likelihood ratio, logistic regression and artificial neural network models: A case study of Youngin, Korea [J].https://doi.org/10.1007/s10346-007-0088-x URL Magsci [本文引用: 1] 摘要
The likelihood ratio, logistic regression, and artificial neural networks models are applied and verified for analysis of landslide susceptibility in Youngin, Korea, using the geographic information system. From a spatial database containing such data as landslide location, topography, soil, forest, geology, and land use, the 14 landslide-related factors were calculated or extracted. Using these factors, landslide susceptibility indexes were calculated by likelihood ratio, logistic regression, and artificial neural network models. Before the calculation, the study area was divided into two sides (west and east) of equal area, for verification of the models. Thus, the west side was used to assess the landslide susceptibility, and the east side was used to verify the derived susceptibility. The results of the landslide susceptibility analysis were verified using success and prediction rates. The verification results showed satisfactory agreement between the susceptibility map and the existing data on landslide locations.
|
| [24] |
|
| [25] |
滑坡图像自动识别浅议 [J].https://doi.org/10.3724/SP.J.1047.2013.00726 URL Magsci [本文引用: 1] 摘要
识别滑坡须先了解什么是滑坡, 广义滑坡包括崩塌、滑坡、碎屑流、泥石流等所有斜坡重力侵蚀现象;狭义滑坡指部分斜坡沿着斜坡内的一个或数个面在重力的作用下作剪切运动的现象。各类滑坡 有自已特殊的地表形态特征,发育的基本地质环境条件和触发因素,据这些特征识别滑坡。利用数字滑坡技术进行滑坡识别大致分为2步:(1)通过RS和GIS 技术将不同时间的调查区地物现场以不同分辨率展现在数字图像上,并与地理控制及地质环境信息配准、组合,建立解译基础;(2)在滑坡地学理论指导下,通过 人机交互方式进行解译和时空分析,获取减灾防灾需要的信息。该方法尚未达到遥感自动识别滑坡的程度,但建立解译基础的过程已可由计算机通过多种程序软件完 成,故认为滑坡模式识别的前2个步骤:数字化及预处理已由计算机实现。现需探索的是用计算机实现基于滑坡地学理论知识,以人机交互方式进行的滑坡识别及分 析过程。就狭义滑坡而言,基于DEM的滑坡地形识别已可由计算机实现。如能确定地面滑坡壁及滑体与地下滑面、滑床的关系,了解它们的光谱特征并建立计算模 型,便可构建遥感技术的滑坡模式识别。
A preliminary discussion on landslide pattern recognition [J].https://doi.org/10.3724/SP.J.1047.2013.00726 URL Magsci [本文引用: 1] 摘要
识别滑坡须先了解什么是滑坡, 广义滑坡包括崩塌、滑坡、碎屑流、泥石流等所有斜坡重力侵蚀现象;狭义滑坡指部分斜坡沿着斜坡内的一个或数个面在重力的作用下作剪切运动的现象。各类滑坡 有自已特殊的地表形态特征,发育的基本地质环境条件和触发因素,据这些特征识别滑坡。利用数字滑坡技术进行滑坡识别大致分为2步:(1)通过RS和GIS 技术将不同时间的调查区地物现场以不同分辨率展现在数字图像上,并与地理控制及地质环境信息配准、组合,建立解译基础;(2)在滑坡地学理论指导下,通过 人机交互方式进行解译和时空分析,获取减灾防灾需要的信息。该方法尚未达到遥感自动识别滑坡的程度,但建立解译基础的过程已可由计算机通过多种程序软件完 成,故认为滑坡模式识别的前2个步骤:数字化及预处理已由计算机实现。现需探索的是用计算机实现基于滑坡地学理论知识,以人机交互方式进行的滑坡识别及分 析过程。就狭义滑坡而言,基于DEM的滑坡地形识别已可由计算机实现。如能确定地面滑坡壁及滑体与地下滑面、滑床的关系,了解它们的光谱特征并建立计算模 型,便可构建遥感技术的滑坡模式识别。
|
| [26] |
秦巴山区地层岩性与地质构造对地质灾害发育的控制作用分析[D] .Analysis of the control effect of formation lithology and geological structure on the development of geological disasters in Qinba Mountain[D]. Xi'an: Chang'an |
| [27] |
基于DEM的福建省土质滑坡敏感性评价 [J].Soil landslide sensitivity assessment based on DEM [J]. |
| [28] |
Landslide susceptibility mapping for a landslide-prone area (Findikli, NE of Turkey) by likelihood frequency ratio and weighted linear combination models [J].https://doi.org/10.1007/s00254-007-0882-8 URL Magsci [本文引用: 1] 摘要
Landslides are very common natural problems in the Black Sea Region of Turkey due to the steep topography, improper use of land cover and adverse climatic conditions for landslides. In the western part of region, many studies have been carried out especially in the last decade for landslide susceptibility mapping using different evaluation methods such as deterministic approach, landslide distribution, qualitative, statistical and distribution-free analyses. The purpose of this study is to produce landslide susceptibility maps of a landslide-prone area (Findikli district, Rize) located at the eastern part of the Black Sea Region of Turkey by likelihood frequency ratio (LRM) model and weighted linear combination (WLC) model and to compare the results obtained. For this purpose, landslide inventory map of the area were prepared for the years of 1983 and 1995 by detailed field surveys and aerial-photography studies. Slope angle, slope aspect, lithology, distance from drainage lines, distance from roads and the land-cover of the study area are considered as the landslide-conditioning parameters. The differences between the susceptibility maps derived by the LRM and the WLC models are relatively minor when broad-based classifications are taken into account. However, the WLC map showed more details but the other map produced by LRM model produced weak results. The reason for this result is considered to be the fact that the majority of pixels in the LRM map have high values than the WLC-derived susceptibility map. In order to validate the two susceptibility maps, both of them were compared with the landslide inventory map. Although the landslides do not exist in the very high susceptibility class of the both maps, 79% of the landslides fall into the high and very high susceptibility zones of the WLC map while this is 49% for the LRM map. This shows that the WLC model exhibited higher performance than the LRM model.
|
| [29] |
The 17 March 2005 Kuzulu landslide (Sivas, Turkey) and landslide susceptibility map of its near vicinity [J].https://doi.org/10.1016/j.enggeo.2005.07.011 URL 摘要
Landslides are common natural hazards in the seismically active North Anatolian Fault Zone of Turkey. Although seismic activity, heavy rainfall, channel incisions, and anthropogenic effects are commonly the main triggers of landslides, on March 17, 2005, a catastrophic large landslide in Sivas, northeastern of Turkey, the Kuzulu landslide, was triggered by snowmelt without any other precursor. The initial failure of the Kuzulu landslide was rotational. Following the rotational failure, the earth material in the zone of accumulation exhibited an extremely rapid flow caused by steep gradient and high water content. The Agnus Creek valley, where Kuzulu village is located, was filled by the earth-flow material and a landslide dam was formed on the upper part of Agnus Creek. The distance from the toe of the rotational failure down to the toe of the earth flow measured more than 1800 m, with about 12.5 million m 3 of displaced earth material. The velocity of the Kuzulu landslide was extremely fast, approximately 6 m/s. The main purposes of this study are to describe the mechanism and the factors conditioning the Kuzulu landslide, to present its environmental impacts, and to produce landslide-susceptibility maps of the Kuzulu landslide area and its near vicinity. For this purpose, a detailed landslide inventory map was prepared and geology, slope, aspect, elevation, topographic-wetness index and stream-power index were considered as conditioning factors. During the susceptibility analyses, the conditional probability approach was used and a landslide-susceptibility map was produced. The landslide-susceptibility map will help decision makers in site selection and the site-planning process. The map may also be accepted as a basis for landslide risk-management studies to be applied in the study area.
|

/
| 〈 |
|
〉 |
