侯西勇 , 邸向红
, 邸向红
HOU Xiyong, DI Xianghong
通讯作者:
收稿日期: 2018-04-12
修回日期: 2018-06-22
网络出版日期: 2018-10-25
版权声明: 2018 《地球信息科学学报》编辑部 《地球信息科学学报》编辑部 所有
基金资助:
作者简介:
作者简介:侯西勇(1975-),男,山东泰安人,博士,研究员,博士生导师,主要从事海岸带土地利用变化与海岸线变化遥感监测、海岸带脆弱性评价、海岸带综合管理等方面研究。E-mail: xyhou@yic.ac.cn
展开
摘要
土地利用遥感制图结果是支撑全球气候变化和区域可持续发展等领域科学研究不可或缺的重要基础数据,而制图精度方面的评价信息则决定土地利用遥感制图结果的完整性、可靠性、可用性、可控性和可传播性。本文概述2000、2005、2010和2015年多时相中国海岸带土地利用遥感制图的数据源和技术方法,针对2010年和2015年制图结果,基于Google Earth高分影像通过目视判读获得精度评价所需的参考数据,进而建立混淆矩阵并评估制图的精度。结果表明:① 2010和2015年中国海岸带土地利用遥感制图结果的总体精度分别为95.15%和93.98%,Kappa系数分别为0.9357和0.9229,表明2个时相遥感制图结果的精度总体较好;② 中国海岸带土地利用遥感制图结果的精度水平存在较为显著的区域差异,2010年时相江苏沿海区域的精度最高,2015年时相津冀沿海区域、上海市、海南省和台湾省的精度均比较高,2个时相均以福建省沿海区域的精度最低;③ 中国海岸带土地利用遥感制图结果的精度水平存在显著的类型差异,总体上,耕地、林地、草地和滨海湿地的分类精度较高,而建设用地、内陆水体和人工咸水湿地的分类精度则相对较低,未利用土地则是错分最严重的类型;④ 耕地与林地之间、建设用地与草地之间相互误分比较显著,内陆水体容易被错分为耕地、林地和建设用地,人工咸水湿地容易被误分为耕地和建设用地,未利用土地容易被误分为耕地,这些都是未来时期数据持续更新过程中应该重视的问题。本文有望为海岸带土地利用变化遥感监测和科学研究提供必要的支持。
关键词:
Abstract
Land use mapping using remote sensing techniques supplies essential datasets for scientific researches including global climate change, regional sustainable development and so on. The evaluation information on the accuracy of the land use mapping determines the integrity, reliability, usability, controllability and shareability of the land use maps obtained by the applications of remote sensing techniques. In this paper, the methods, processes and results of multiple temporal land use mapping for China's coastal zone using remote sensing techniques were overviewed, and the land use maps in 2010 and 2015 were selected for accuracy evaluation. The validation samples were collected based on Google Earth and the confusion matrices were established for the whole coastal zone and its sub-regions, respectively. Then, the overall accuracy and Kappa coefficient were calculated. Main findings are as follows: (1) Results of land use mapping in 2010 and 2015 using remote sensing techniques achieved high accuracy. For the entire coastal zone in China, the overall accuracy came to 95.15% and 93.98%, with the Kappa coefficients of 0.9357 and 0.9229 in 2010 and 2015, respectively. (2) The accuracy of land use mapping in China's coastal zone exhibited obvious regional differences. The best accuracy was found in the coastal area of Jiangsu province in 2010, and very high accuracy were found in the coastal area of Hebei-Tianjin, Shanghai city, Hainan province and Taiwan province in 2015, while the worst accuracy was found in the coastal area of Fujian province in both 2010 and 2015. (3) The accuracy of land use mapping in China's coastal zone exhibited obvious typological differences. The very high accuracy (both producer precision and user precision) were achieved for farmland, forest, grassland and saltwater wetlands, and the high accuracy for built-up, freshwater wetlands and human made saltwater wetland, while the worst accuracy for unused land. (4) The misclassification between cultivated land and forest land, construction land and grassland is quite significant. Inland water bodies were easily misclassified into cultivated land, forest land and construction land. Artificial salt water wetlands were easily misclassified into cultivated land and construction land, and unused land. It was easy to mistakenly classify the unused land as cultivated land. These are the issues that should be paid more attention during the continuous update of the land use maps in the future. This study provides supports for the dynamic monitoring and scientific researches on coastal land use changes.
Keywords:
土地利用/覆盖变化(Land Use/Cover Change, LUCC)遥感监测是开展气候变化与人类活动及其相互作用等方面科学研究的重要基础[1];20世纪80年代以来,该领域研究开始进入快速发展的阶段,如国际地圈与生物圈计划(IGBP)与全球变化人文因素计划(IHDP)在1993年联合制订土地利用/覆盖变化(LUCC)科学研究计划,又于2005年启动全球土地计划(GLP)[2]。作为遥感对地观测技术发展的重要产物,土地利用/覆盖遥感分类结果已成为支撑全球变化和区域可持续发展等研究不可或缺的重要基础数据[3],全球范围的科学家以及众多的国际组织发挥遥感技术的优势开展了一系列全球及区域尺度的土地利用/覆盖遥感制图研究,目前已经形成了众多的土地利用/覆盖数据产品[4]。例如,针对全球尺度,美国地质调查局为国际地圈与生物圈计划建立IGBP DISCover数据集[5],美国马里兰大学开发了全球土地覆盖数据(UMD数据集)[6],欧盟联合研究中心制作了GLC数据集[7],美国波士顿大学基于MODIS影像生产了MCD12Q1数据集[8],欧洲空间局制备了GlobCover数据集[9]和CCI-LC数据集[10],中国清华大学研制了FROM-GLC数据集[11],中国国家基础地理信息中心制作了GlobeLand30数据集[12]等。针对中国区域,较具代表性的工作有:中国科学院组织开展了全国范围以遥感手段为主的土地资源调查,建立了全国1:10万多时相土地利用数据库[13,14]等。土地利用/覆盖遥感制图精度评价是正确使用遥感制图结果、发挥其巨大价值的前提和保证,因此受到国内外学者的高度重视。由于数据源、分类系统和分类方法不同,遥感制图结果差异显著;通过遥感制图精度评价,数据生产者可以不断改进方法获得更高质量的数据产品,数据使用者则可以分析数据的优劣从而做出正确的选择以及合理地使用数据来满足具体的应用需求[15]。目前,常用的评估遥感制图精度的方法包括:野外实地验证(直接验证)、以更高分辨率的同类产品为真值进行对比验证(间接验证),以及二者相结合的验证方法[16]。在地面真实值难以获取或难以与制图产品在时间上同步的情况下,间接验证是一种行之有效的验证方法,尤其是针对大范围区域的遥感制图。例如,对IGBP DISCover、UMD、GLC2000和MCD12Q1进行比较,结果表明其在数量和空间分布上的一致性较差[17];以Google Earth高分影像为参考,评估和对比IGBP DISCover、UMD、GLC2000、MCD12Q1和GlobCover2005在中国区域及其周边范围的精度特征,发现GLC2000的总体精度和Kappa系数最高、GlobCover2005的总体精度和Kappa系数最低[18]。将中国1:10万土地利用数据CHINA 2010与30 m分辨率的GlobleLand30数据,针对中国河南省进行对比,表明GlobleLand30与CHINA 2010的空间一致性高达80.20%[19]。
城市、人口和经济等要素高度聚集的海岸带区域是全球变化等领域科学研究的重要“窗口”。中国海岸带自20世纪80年代以来经历了明显的变化,因此针对中国海岸带开展长时间序列的土地利用动态遥感监测具有重要的科学意义。本文简要回顾和总结研究组针对中国海岸带区域所开展的土地利用遥感分类系统调整、数据修改与更新工作,在此基础上,针对2010年和2015年中国海岸带土地利用遥感制图结果,基于Google Earth高分影像建立参考数据并进行精度评价。通过研究,旨在为后续的海岸带土地利用变化、生态系统评估等相关领域的科学研究和数据共享等提供必要的信息与支持。
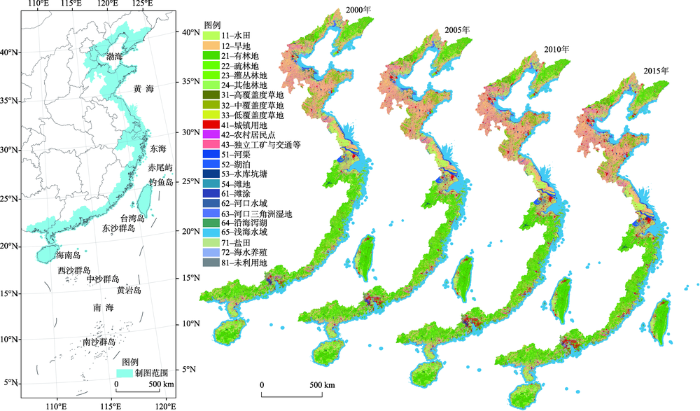
中国海岸带区域南北及东西跨度大,气候、地貌、植被、土壤、水文以及人类活动等因素都存在着非常显著的空间差异,而且与内陆区域相比也有其突出的独特性,因此自2009年以来陆续开展了如下研究工作:① 针对山东沿海,尤其是黄河三角洲和胶东半岛区域,开展了多目的的野外调查和考察,土地利用是历次野外调查和考察的重要研究目标之一,并在此基础上开展了区域性的海岸带多时相土地利用遥感制图工作;② 通过文献分析,总结和评估已有的能够覆盖整个中国沿海区域的土地利用遥感制图产品,确定以中国科学院地理科学与资源研究所建立的多时相1:10万比例尺中国土地利用数据库[13,20-21]为基础开展中国海岸带土地利用数据制备和变化特征研究;③ 强调中国海岸带区域自然环境、人类活动以及土地资源的特殊性,综合国内外相关研究成果,对多时相1:10万比例尺土地利用数据的分类系统进行必要的调整,得到中国海岸带土地利用遥感分类系统(表1)[22,23];④ 从2000年1:10万比例尺中国土地利用数据中提取出中国沿海区域的数据,对照2000年成像的Landsat卫星影像,按照中国海岸带土地利用遥感分类系统进行目视判读,修改图斑边界及属性,得到2000年中国海岸带土地利用数据[22,24];⑤ 对照2005年成像的Landsat卫星影像修改2000年中国海岸带土地利用数据,进行目视判读,通过变化区域图斑勾绘和代码赋值建立2005年中国海岸带土地利用数据,依次类推、顺次更新,获得2010年和2015年中国海岸带土地利用数据;⑥ 2000年数据修改以及2005、2010和2015年数据顺次更新,在土地利用类型遥感判读和GIS制图规范等方面遵循1:10万比例尺的技术要求;⑦ 遥感制图范围以中国沿海地级市为主体①(①制图范围:早期的研究工作是以“大陆海岸带(沿海)”为重点,因而未包含海南省和台湾省,后续进行了补充;二级类型中的“浅海水域”仅通过光学遥感技术难以确定其具体范围,因而早期数据产品缺少这一类型,导致海部边界不固定,后期以-10 m等深线和离岸10 km缓冲区为依据,取二者的并集建立了固定的海域边界,因此数据产品中实际上是“浅海/近海水域”。),兼顾鞍山、德州、临沂、湖州、佛山和玉林6个不临海但辖区距海很近的地级市。截至2017年,完成了2000、2005、2010和2015年4个时相的中国海岸带土地利用遥感制图工作(图1),数据图斑数量分别多达41.33、43.17、42.82和42.01万。
表1 中国海岸带土地利用遥感分类系统
Tab. 1 Land use hierarchy for China's coastal zone based on remote sensing techniques
| 一级类型 (编码+名称) | 二级类型 (编码+名称) |
|---|---|
| 1 耕地 | 11水田;12旱地 |
| 2 林地 | 21有林地;22疏林地;23灌木林地;24其他林地 |
| 3 草地 | 31高覆盖度草地;32中覆盖度草地;33低覆盖度草地 |
| 4 建设用地 | 41城镇用地;42农村居民点;43独立工矿及交通用地 |
| 5 内陆水体 | 51河渠;52湖泊;53水库坑塘;54滩地 |
| 6 滨海湿地 | 61滩涂;62河口水域;63河口三角洲湿地;64沿海瀉湖;65浅海水域 |
| 7 人工咸水湿地 | 71盐田;72养殖 |
| 8 未利用地 | 81未利用地 |
图1 中国海岸带多时相土地利用遥感制图结果
Fig. 1 Land use maps in multiple years in China's coastal zone based on remote sensing techniques
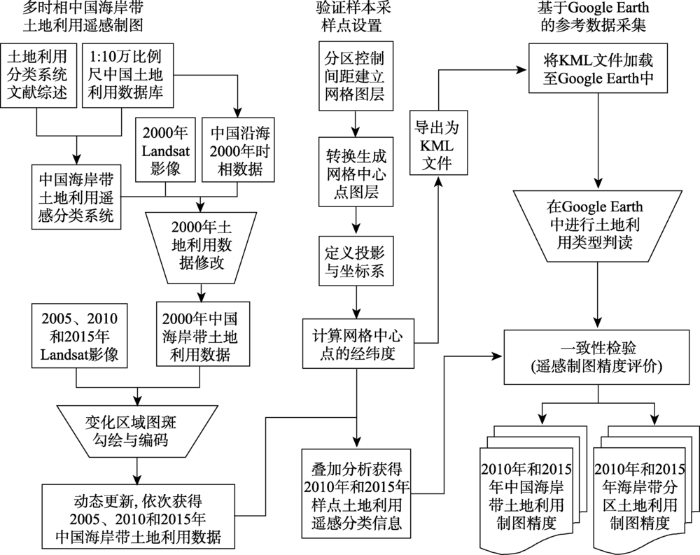
随着遥感技术的不断发展和数据开放共享的逐渐推进,已经有越来越多的中、高分辨率卫星影像数据实现了共享,很好地满足了各种各样与日俱增的需求。2005年,Google公司推出Google Earth(GE)虚拟地球软件[25],实时为用户提供覆盖全球的高分影像数据,这一数据资源迅速成为中低分辨率(30 m~1 km)土地利用/覆盖遥感制图精度评价的有效参考数据。为此,设置采样点,基于Google Earth高分影像建立中国海岸带土地利用遥感制图精度评价的参考数据集。验证样本采集及制图精度评价的技术流程如图2所示。具体过程包括: ① 中国海岸带土地利用分类系统确定与多时相遥感制图,主要通过Landsat卫星影像假彩色合成、土地利用类型目视判读、变化图斑勾绘与编码、多时相数据顺次更新的技术途径获得4个年份的土地利用分类结果;② 利用ArcGIS中的Generate工具,在不同的行政区内按照不同的采样间距生成采样点,其中2010年共计13 013个样点,2015年共计16 418个样点(表2);③ 将采样点图层与土地利用遥感制图结果进行叠加分析,获得每个样点位置2010年和2015年的土地利用遥感分类结果;④ 将采样点图层转换为KML文件,进而将其加载至Google Earth中,根据Google Earth高分影像目视判读每个采样点的土地利用类型,其中,针对2010年数据的样本采集时间为2011-2012年,针对2015年数据的样本采集时间为2015-2016年;⑤ 针对整个中国海岸带以及分行政区空间范围,分别进行土地利用类型的一致性检验,在8个一级类型层面建立混淆矩阵并计算精度水平,获得土地利用遥感制图精度评估结果。
图2 中国海岸带土地利用遥感制图及精度评价的技术流程
Fig. 2 Technical approaches of land use mapping and accuracy evaluation for China's coastal zone
表2 不同行政区域的采样间距及样点数量
Tab. 2 Spacing and amounts of sampling points in each administrative region
| 行政区域 | 辽宁 | 河北 | 天津 | 山东 | 江苏 | 上海 | 浙江 | 福建 | 广东 | 广西 | 海南 | 港澳 | 台湾 | 合计 |
|---|---|---|---|---|---|---|---|---|---|---|---|---|---|---|
| 采样间距/km | 7 | 7 | 5 | 7 | 7 | 4.5 | 8 | 7 | 7 | 6 | 6 | 2 | 10 | |
| 2010年采样点数量/个 | 1358 | 730 | 500 | 1410 | 1098 | 500 | 1163 | 1117 | 1772 | 1000 | 1311 | 500 | 554 | 13013 |
| 2015年采样点数量/个 | 1780 | 1019 | 474 | 2445 | 1318 | 578 | 1463 | 1304 | 2397 | 1123 | 1311 | 652 | 554 | 16418 |
土地利用遥感制图精度评价是一项非常重要的工作,一般主要从面积一致性和空间一致性2个方面进行考察[26,27]。面积一致性强调数量方面的精度,用于验证待评价数据各类别的数量是否与参考数据对应类别的数量一致[28],多采用一致性系数[29]或相关系数[30]来表征;空间一致性是将特定位置的分类结果和参考数据相应点的类别进行比较,多采用混淆矩阵来度量[31]。本研究基于较大数量的样本数据,针对土地利用遥感制图的空间一致性进行定量评价,具体方法如下:
混淆矩阵是n行n列的矩阵,n为类别数;矩阵列方向依次为实际类别的第1类、第2类、…、第n类的代码或名称,矩阵行方向依次为制图类别的第1类、第2类、…、第n类的代码或名称;矩阵中的元素是各类别的样点数[32]。总体精度等于被正确分类的样点总和除以总样点数,被正确分类的样点数沿混淆矩阵的对角线分布;生产者精度是被正确分类样点数占参考数据样点数的百分比,描述待评价数据与参考数据的一致性;用户精度描述待评价数据中被正确分类样点所占的百分比,从用户角度描述数据的可用程度。总体精度、生产者精度和用户精度的不足在于样点类别的小变动即可能导致其较大的变化,而Kappa系数则能够更全面地反映制图结果的分类精度[33]。计算公式如下:
式中:O是总体精度;P是生产者精度;U是用户精度;N是用于精度评价的总样点数;n为混淆矩阵中的总列数;xii为混淆矩阵中第i行、第i列上样点数;xi+和x+i分别是第i行和第i列的总样点数;K是Kappa系数。
在沿海省、区、市层面对2010年和2015年中国海岸带土地利用遥感制图的结果进行精度评价,针对8个一级土地利用类型,基于遥感分类结果和Google Earth采样信息建立混淆矩阵,计算总体精度和Kappa系数,汇总各行政区的计算结果如表3所示。可见:① 各个分区2010年和2015年的土地利用遥感分类结果的精度均比较高,2010年精度水平总体上略优于2015年。② 2010年各分区的总体精度普遍大于95%,Kappa系数普遍大于0.94;江苏沿海区域土地利用分类结果的精度最高,总体精度达97.45%,Kappa系数达0.9641;福建沿海区域土地利用分类结果的精度最低,总体精度为92.57%,Kappa系数为0.8839。③ 2015年各分区总体精度普遍大于94%,Kappa系数普遍大于0.93;上海、台湾、海南以及津冀沿海区域土地利用分类结果的精度最高,总体精度均大于95.30%,Kappa系数均大于0.9340;福建沿海区域土地利用分类结果的精度仍为各个分区中的最低水平,总体精度为90.95%,Kappa系数仅为0.8714。④ 福建沿海地貌类型及其格局比较复杂,地形起伏剧烈,主要受此影响,30m分辨率卫星影像中混合像元占比高,以其为主要数据源进行土地利用目视解译具有较高的不确定性。
表3 分区层面中国海岸带土地利用遥感制图的精度
Tab. 3 Accuracy of land use mapping in each administrative region in China's coastal zone
| 分区编号 | 所属的 行政区 | 2010年 | 2015年 | |||
|---|---|---|---|---|---|---|
| 总体精度/% | Kappa系数 | 总体精度/% | Kappa系数 | |||
| 1 | 辽宁 | 95.06 | 0.9318 | 94.83 | 0.9332 | |
| 2 | 津冀 | 94.39 | 0.9110 | 95.71 | 0.9348 | |
| 3 | 山东 | 93.90 | 0.8991 | 95.17 | 0.9288 | |
| 4 | 江苏 | 97.45 | 0.9641 | 94.69 | 0.9280 | |
| 5 | 上海 | 95.20 | 0.9331 | 95.33 | 0.9374 | |
| 6 | 浙江 | 95.96 | 0.9430 | 94.81 | 0.9317 | |
| 7 | 福建 | 92.57 | 0.8839 | 90.95 | 0.8714 | |
| 8 | 广东 | 93.12 | 0.8996 | 90.99 | 0.8809 | |
| 9 | 广西 | 96.90 | 0.9523 | 92.43 | 0.8917 | |
| 10 | 海南 | 97.40 | 0.9606 | 95.65 | 0.9342 | |
| 11 | 港澳 | 96.20 | 0.9408 | 94.02 | 0.9180 | |
| 12 | 台湾 | 96.39 | 0.9500 | 95.30 | 0.9349 | |
针对整个中国海岸带区域2010年和2015年土地利用遥感制图结果进行精度评价,在8个一级土地利用类型层面,基于遥感分类结果和Google Earth采样信息建立混淆矩阵,进而计算总体精度和Kappa系数,如表4、5所示。可见:① 2010年分类结果的总体精度为95.16%,Kappa系数为0.9357;② 2015年分类结果的精度水平略低于2010年,但总体精度和Kappa系数仍然分别高达93.98%和0.9229;③ 总的来说,2010年和2015年中国海岸带土地利用遥感制图结果的精度水平均比较高。
表4 2010年中国海岸带土地利用遥感制图混淆矩阵
Tab. 4 Confusion matrix of land use mapping in China's coastal zone in 2010
| 分类数据 | 标准数据 | 行总数 | 用户精度/% | |||||||
|---|---|---|---|---|---|---|---|---|---|---|
| 1 | 2 | 3 | 4 | 5 | 6 | 7 | 8 | |||
| 1 | 4103 | 102 | 33 | 83 | 26 | 4 | 19 | 3 | 4373 | 93.83 |
| 2 | 88 | 4170 | 7 | 15 | 8 | 1 | 0 | 2 | 4291 | 97.18 |
| 3 | 32 | 10 | 671 | 4 | 5 | 0 | 3 | 3 | 728 | 92.17 |
| 4 | 39 | 17 | 2 | 1484 | 7 | 4 | 10 | 1 | 1564 | 94.88 |
| 5 | 11 | 5 | 5 | 6 | 664 | 3 | 7 | 2 | 703 | 94.45 |
| 6 | 2 | 5 | 1 | 2 | 0 | 901 | 3 | 0 | 914 | 98.58 |
| 7 | 7 | 1 | 1 | 5 | 3 | 0 | 335 | 2 | 354 | 94.63 |
| 8 | 12 | 9 | 0 | 3 | 0 | 6 | 1 | 55 | 86 | 63.95 |
| 列总数 | 4294 | 4319 | 720 | 1602 | 713 | 919 | 378 | 68 | ||
| 生产者精度/% | 95.55 | 96.55 | 93.19 | 92.63 | 93.13 | 98.04 | 88.62 | 80.88 | ||
| 总体精度/% | 95.16 | Kappa系数 | 0.9357 | |||||||
表5 2015年中国海岸带土地利用遥感制图混淆矩阵
Tab. 5 Confusion matrix of land use mapping in China's coastal zone in 2015
| 分类数据 | 标准数据 | 行总数 | 用户精度/% | |||||||
|---|---|---|---|---|---|---|---|---|---|---|
| 1 | 2 | 3 | 4 | 5 | 6 | 7 | 8 | |||
| 1 | 4424 | 231 | 5 | 173 | 26 | 2 | 6 | 1 | 4868 | 90.88 |
| 2 | 107 | 4117 | 5 | 48 | 11 | 10 | 6 | 2 | 4306 | 95.61 |
| 3 | 31 | 4 | 723 | 23 | 4 | 7 | 4 | 4 | 800 | 90.38 |
| 4 | 58 | 42 | 9 | 1587 | 17 | 10 | 4 | 2 | 1729 | 91.79 |
| 5 | 29 | 14 | 8 | 18 | 625 | 3 | 6 | 2 | 705 | 88.65 |
| 6 | 3 | 8 | 2 | 3 | 0 | 3559 | 1 | 0 | 3576 | 99.52 |
| 7 | 2 | 0 | 0 | 5 | 2 | 2 | 350 | 0 | 361 | 96.95 |
| 8 | 16 | 4 | 1 | 2 | 0 | 5 | 0 | 45 | 73 | 61.64 |
| 列总数 | 4670 | 4420 | 753 | 1859 | 685 | 3598 | 377 | 56 | ||
| 生产者精度/% | 94.73 | 93.14 | 96.02 | 85.37 | 91.24 | 98.92 | 92.84 | 80.36 | ||
| 总体精度/% | 93.98 | Kappa系数 | 0.9229 | |||||||
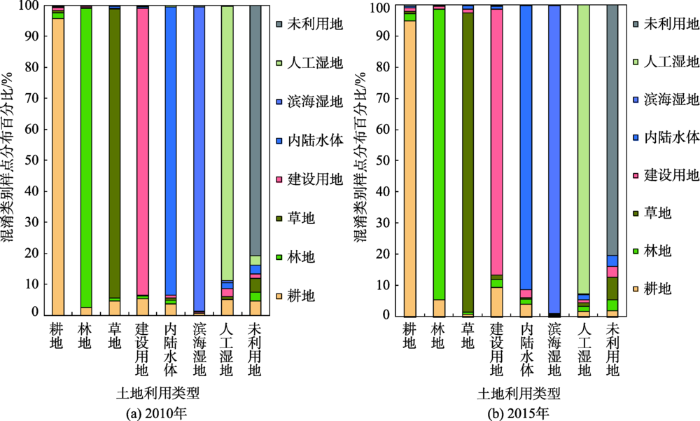
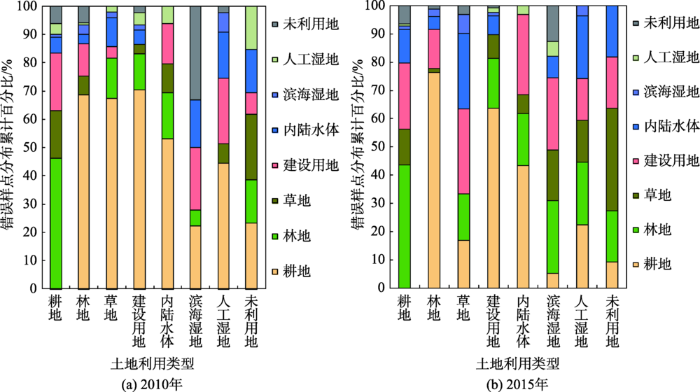
分析遥感制图结果与Google Earth验证样本之间的混淆特征以及错误样点的数量分布特征(图3、4),可以发现:2010年和2015年,林地和滨海湿地的生产者精度与用户精度均超过93%,这是由于林地主要分布于地势较高的区域,色调和纹理特征显著,目视解译比较容易判读;而滨海湿地主要位于大陆海岸线附近,解译标志亦比较明显,与其他地类之间的边界清晰。
图3 土地利用遥感制图与Google Earth验证样本混淆特征
Fig. 3 Confusions between remote sensing based land use map and Google Earth based samples in 2010 and 2015
图4 土地利用遥感制图错误样点统计特征
Fig. 4 Statistical characters of misclassified samples of land use mapping in 2010 and 2015
耕地是中国海岸带区域最主要的用地类型之一,2010年和2015年耕地制图精度均超过94%,表明遥感分类结果比较理想,其误差主要表现为误分成林地、建设用地、草地、内陆水体和未利用地。由于耕地农作物与林地或草地光谱特征接近,加之我国海岸带区域耕地分布、农作物类型及熟制南北方差异巨大,耕地-林地、耕地-草地、耕地(水田)-内陆水体、耕地-未利用地的混分现象比较显著。耕地误分为建设用地的样点多分布于城乡建设用地的周边,耕地与建设用地空间分布呈现“犬牙交错”的复杂格局特征,在30 m空间分辨率卫星影像中存在大量的混合像元,导致目视解译过程中对耕地-建设用地的共有边界判断不准确,出现明显的错分问题。
内陆水体的分类精度总体上也比较高,其误差主要表现为错分成耕地(水田)、林地和建设用地,误分的可能原因包括:内陆水体水面受季节和降水因素影响较为显著,丰枯变化导致季节性的农作物种植或其他植被分布,周期性淹没的区域也经常有耐水湿乔木分布;城乡周边与建设用地毗邻的水体,其边界形状受人为影响而趋于复杂化,在30 m空间分辨率卫星影像中水体与建设用地的混合像元大量分布,导致明显的错分问题。
人工咸水湿地类型中较多的样点被错分为耕地或建设用地,与其他地类相比制图精度偏低。错分为耕地(尤其是水田)的样点大多分布于入海河流的河口三角洲区域以及养殖池附近;滨海城市受到土地资源紧缺的制约,在城市化和工业化过程中,人工咸水湿地比开阔的滩涂湿地和浅海水域更容易被侵占,因此,很多区域人工咸水湿地与建设用地相邻分布,在30 m空间分辨率卫星影像中混合像元大量分布,导致明显的错分问题。
未利用地的分类错误率最高,生产者精度与用户精度均为最低。其误差主要表现为与耕地、林地和建设用地之间相互混淆和误分。中国海岸带区域人类活动的广度和深度均比较显著,长期闲置的未利用地较为少见,在土地利用方式变化较为频繁的区域,常有短期的、暂时性的未利用地,这种“暂时性”特征容易导致错分;另外,滩涂湿地被围垦的过程产生大量的新增未利用地,围垦方式、围垦阶段以及潮位的影响,也导致某些区域的错分。
归纳土地利用类型间的混分与错分,主要包括自然植被与农作物(耕地)之间、人工水体与天然湿地之间以及城乡结合部多种地类的混合像元等几种情形,有鉴于此,提出消减混分和错分、降低不确定性的可能途径,主要包括:①充分利用一年之内不同生长季的卫星影像,借助植被物候特征信息降低林地、草地、耕地等之间以及多种类型植被覆盖与建设用地之间的混分;②充分利用一年之内不同水文周期的卫星影像,借助不同季节陆地水体的丰枯变化以及海岸带不同潮位所对应的影像差异,提高各种水体的分类精度;③尝试中高分辨率卫星影像相结合,降低地貌类型复杂、地形起伏剧烈和景观格局复杂等因素所导致的不确定性。
本文概述了在1:10万比例尺中国土地利用数据库中2000年时相数据的基础上进行2000年以来4个时相中国海岸带土地利用数据制备的技术途径和过程,在此基础上,针对2010年和2015年的数据产品,设置大量的采样点,从Google Earth中获取采样点的土地利用类型作为参考数据,用于对2个时相的遥感制图结果进行精度评价。主要结论如下:
(1)以时间序列的Landsat多波段卫星影像为主要数据源,采用目视判读、图斑勾绘与编码以及时序动态更新的技术途径进行多时相中国海岸带土地利用遥感制图,这一技术方案能够获得精度较优的多时相土地利用分类数据产品,在支持中国海岸带土地利用变化监测和研究方面是行之有效的。
(2)基于Google Earth获取采样信息,进而在8个一级类型层面评价2010年和2015年中国海岸带土地利用遥感制图结果的精度水平,结果表明:2010年和2015年总体精度分别为95.16%、93.98%,Kappa系数分别为0.9357、0.9229;制图精度整体较高,但存在较为显著的空间差异性。
(3)中国海岸带多时相土地利用遥感制图的精度水平存在显著的类型差异特征,总的来说:耕地、林地、草地和滨海湿地的分类精度均比较高;建设用地、内陆水体和人工咸水湿地的分类精度则相对略低;未利用地很容易被误分为耕地、林地和建设用地,是海岸带区域错分问题最突出的类型。
(4)总结未来时期海岸带土地利用数据持续更新需要重视的问题,主要有:耕地与林地、建设用地、草地、内陆水体等类型之间比较显著的混分现象,内陆水体被错分为耕地(水田)、林地和建设用地,人工咸水湿地被误分为耕地(水田)和建设用地,严重且复杂的未利用地的错分问题等。
(5)提出克服土地利用之间混分与错分,降低目视解译不确定性的技术途径,主要包括:充分利用一年之内不同生长季以及不同水文周期的卫星影像,尝试中高分辨率卫星影像相结合。
综上所述,本文介绍了2000年以来4个时相中国海岸带土地利用遥感分类数据的建立过程以及其中2010年和2015年时相数据的精度评价方法和评价结果信息,对于推进该科学数据集的推广应用和价值提升具有一定的意义,对于未来时期中国海岸带多时相土地利用数据持续更新过程中的精度提高和质量控制也将具有一定的指导意义。
致谢:诚挚感谢刘纪远研究员、徐新良研究员、王庆教授、李秀彬研究员、张安定教授、郭笃发教授、牛振国研究员、何洪林研究员、李志教授、李春晖博士、常军博士通过参加研究生开题和中期报告会、毕业答辩会等过程对“中国海岸带土地利用数据”研发过程中相关的技术方法、经验技巧以及数据产品应用等问题给予宝贵的意见和建议。非常感谢于良巨、常远勇、王远东、陈晴、宋洋、李晓炜、方晓东、王晓利、张玉新、李卉、李瑞泽、张春艳等在野外考察与调查、卫星影像下载和处理、统计资料整理等过程中所做出的工作和贡献。
The authors have declared that no competing interests exist.
| [1] |
全球第一个综合高分辨率土地覆盖图——中国30 m分辨率全球土地覆盖图评述 [J].First comprehensive fine-resolution global land cover map in the world from China: Comments on global land cover map at 30-m resolution [J]. |
| [2] |
巴西土地利用/覆盖变化时空格局及驱动因素 [J].https://doi.org/10.11820/dlkxjz.2015.01.009 Magsci [本文引用: 1] 摘要
土地利用/覆盖变化(LUCC)是全球变化研究的热点问题之一。本文采用人机交互方法基于2005 年基准年的Landsat TM/ETM遥感影像修正欧空局GlobalCover 2005 年土地利用数据,进而采用逆时相目视解译法从1980年基准年的Landsat MSS/TM遥感影像数据提取1980-2005 年土地利用/覆盖变化信息,分析其变化的时空格局及驱动因素。结果表明:1980-2005年的25年间,巴西土地利用/覆盖变化面积达79.43万km<sup>2</sup>,占土地总面积的9.33%。其中,单纯耕地像元面积增加了20.18 万km<sup>2</sup>;耕地/自然植被镶嵌混合像元区面积增加了10.70 万km<sup>2</sup>;林地面积减少了53.12 万km<sup>2</sup>;灌丛与草地净增加21.10 万km<sup>2</sup>;水体面积增加0.46 万km<sup>2</sup>;城乡建设用地面积增加7573.87 km<sup>2</sup>。由此导致热带和亚热带湿润阔叶林生态地理区、热带和亚热带干旱阔叶林生态地理区、热带及亚热带草原生态地理区、草原和沼泽湿地生态地理区、沙漠和旱生植物生态地理区以及红树林生态地理区内分别呈现不同的土地利用/覆盖变化特征。近25 年间,地形地貌、气候、植被等自然地理条件深刻影响着土地利用的宏观格局,而土地利用政策调控、经济及对外贸易发展、人口增加及空间迁移、道路修建等是导致巴西土地利用变化的主要原因。
Spatiotemporal pattern and driving forces of land use/cover change in Brazil [J].https://doi.org/10.11820/dlkxjz.2015.01.009 Magsci [本文引用: 1] 摘要
土地利用/覆盖变化(LUCC)是全球变化研究的热点问题之一。本文采用人机交互方法基于2005 年基准年的Landsat TM/ETM遥感影像修正欧空局GlobalCover 2005 年土地利用数据,进而采用逆时相目视解译法从1980年基准年的Landsat MSS/TM遥感影像数据提取1980-2005 年土地利用/覆盖变化信息,分析其变化的时空格局及驱动因素。结果表明:1980-2005年的25年间,巴西土地利用/覆盖变化面积达79.43万km<sup>2</sup>,占土地总面积的9.33%。其中,单纯耕地像元面积增加了20.18 万km<sup>2</sup>;耕地/自然植被镶嵌混合像元区面积增加了10.70 万km<sup>2</sup>;林地面积减少了53.12 万km<sup>2</sup>;灌丛与草地净增加21.10 万km<sup>2</sup>;水体面积增加0.46 万km<sup>2</sup>;城乡建设用地面积增加7573.87 km<sup>2</sup>。由此导致热带和亚热带湿润阔叶林生态地理区、热带和亚热带干旱阔叶林生态地理区、热带及亚热带草原生态地理区、草原和沼泽湿地生态地理区、沙漠和旱生植物生态地理区以及红树林生态地理区内分别呈现不同的土地利用/覆盖变化特征。近25 年间,地形地貌、气候、植被等自然地理条件深刻影响着土地利用的宏观格局,而土地利用政策调控、经济及对外贸易发展、人口增加及空间迁移、道路修建等是导致巴西土地利用变化的主要原因。
|
| [3] |
全国1:25万土地覆被遥感制图精度在内蒙古东部的实地验证 [J].Validation for accuracy of land cover remote sensing mapping of China at scale of 1:250 000 in East Inner Mongolia [J]. |
| [4] |
中国土地利用/覆盖变化及其气候效应的研究综述 [J].https://doi.org/10.11867/j.issn.1001-8166.2014.09.1025 URL Magsci [本文引用: 1] 摘要
人类活动引起的土地利用/覆盖变化(Land Use and Land Cover Change,LUCC)是重要的外强迫之一,但是LUCC对全球及区域气候影响的研究仍然薄弱,至今无法对LUCC的气候效应问题做出系统的评估。研究针对人类活动比较剧烈的中国区域问题,首先回顾了近几十年来中国LUCC的特征,接着从观测和数值模拟2个方面系统地讨论了过去LUCC的研究成果,主要针对LUCC通过生物地球物理过程影响区域气候的工作,总结和归纳了LUCC对中国区域气候的影响问题,进而探讨了LUCC在未来气候变化中可能扮演的角色、亟待解决的问题,以及国内外在这方面的研究动态和未来发展方向。
Review of land use and land cover change in China and associated climatic effects [J].https://doi.org/10.11867/j.issn.1001-8166.2014.09.1025 URL Magsci [本文引用: 1] 摘要
人类活动引起的土地利用/覆盖变化(Land Use and Land Cover Change,LUCC)是重要的外强迫之一,但是LUCC对全球及区域气候影响的研究仍然薄弱,至今无法对LUCC的气候效应问题做出系统的评估。研究针对人类活动比较剧烈的中国区域问题,首先回顾了近几十年来中国LUCC的特征,接着从观测和数值模拟2个方面系统地讨论了过去LUCC的研究成果,主要针对LUCC通过生物地球物理过程影响区域气候的工作,总结和归纳了LUCC对中国区域气候的影响问题,进而探讨了LUCC在未来气候变化中可能扮演的角色、亟待解决的问题,以及国内外在这方面的研究动态和未来发展方向。
|
| [5] |
Development of a global land cover characteristics database and IGBP DIS Cover from 1 km AVHRR data [J].https://doi.org/10.1080/014311600210191 URL [本文引用: 1] |
| [6] |
A comparison of the IGBP DISCover and University of Maryland 1 km global land cover products [J].https://doi.org/10.1080/014311600210218 URL [本文引用: 1] 摘要
Two global 1 km land cover data sets derived from 1992-1993 Advanced Very High Resolution Radiometer (AVHRR) data are currently available, the International Geosphere-Biosphere Programme Data and Information System (IGBP-DIS) DISCover and the University of Maryland (UMd) 1 km land cover maps. This paper makes a preliminary comparison of the methodologies and results of the two products. The DISCover methodology employed an unsupervised clustering classification scheme on a per-continent basis using 12 monthly maximum NDVI composites as inputs. The UMd approach employed a supervised classification tree method in which temporal metrics derived from all AVHRR bands and the NDVI were used to predict class membership across the entire globe. The DISCover map uses the IGBP classification scheme, while the UMd map employs a modified IGBP scheme minus the classes of permanent wetlands, cropland/natural vegetation mosaic and ice and snow. Global area totals of aggregated vegetation types are very similar and have a per-pixel agreement of 74%. For tall versus short/no vegetation, the per-pixel agreement is 84%. For broad vegetation types, core areas map similarly, while transition zones around core areas differ significantly. This results in high regional variability between the maps. Individual class agreement between the two 1 km maps is 49%. Comparison of the maps at a nominal 0.5 resolution with two global ground-based maps shows an improvement of thematic concurrency of 46% when viewing average class agreement. The absence of the cropland mosaic class creates a difficulty in comparing the maps, due to its significant extent in the DISCover map. The DISCover map, in general, has more forest, while the UMd map has considerably more area in the intermediate tree cover classes of woody savanna/ woodland and savanna/wooded grassland.
|
| [7] |
GLC2000: A new approach to global land cover mapping from Earth observation data [J].https://doi.org/10.1080/01431160412331291297 URL [本文引用: 1] 摘要
A new global land cover database for the year 2000 (GLC2000) has been produced by an international partnership of 30 research groups coordinated by the European Commission's Joint Research Centre. The database contains two levels of land cover information—detailed, regionally optimized land cover legends for each continent and a less thematically detailed global legend that harmonizes regional legends into one consistent product. The land cover maps are all based on daily data from the VEGETATION sensor on‐board SPOT 4, though mapping of some regions involved use of data from other Earth observing sensors to resolve specific issues. Detailed legend definition, image classification and map quality assurance were carried out region by region. The global product was made through aggregation of these. The database is designed to serve users from science programmes, policy makers, environmental convention secretariats, non‐governmental organizations and development‐aid projects. The regional and global data are available free of charge for all non‐commercial applications from http://www.gvm.jrc.it/glc2000.
|
| [8] |
Global land cover mapping from MODIS: Algorithms and early results [J].https://doi.org/10.1016/S0034-4257(02)00078-0 URL [本文引用: 1] 摘要
Until recently, advanced very high-resolution radiometer (AVHRR) observations were the only viable source of data for global land cover mapping. While many useful insights have been gained from analyses based on AVHRR data, the availability of moderate resolution imaging spectroradiometer (MODIS) data with greatly improved spectral, spatial, geometric, and radiometric attributes provides significant new opportunities and challenges for remote sensing-based land cover mapping research. In this paper, we describe the algorithms and databases being used to produce the MODIS global land cover product. This product provides maps of global land cover at 1-km spatial resolution using several classification systems, principally that of the IGBP. To generate these maps, a supervised classification methodology is used that exploits a global database of training sites interpreted from high-resolution imagery in association with ancillary data. In addition to the IGBP class at each pixel, the MODIS land cover product provides several other parameters including estimates for the classification confidence associated with the IGBP label, a prediction for the most likely alternative class, and class labels for several other classification schemes that are used by the global modeling community. Initial results based on 5 months of MODIS data are encouraging. At global scales, the distribution of vegetation and land cover types is qualitatively realistic. At regional scales, comparisons among heritage AVHRR products, Landsat TM data, and results from MODIS show that the algorithm is performing well. As a longer time series of data is added to the processing stream and the representation of global land cover in the site database is refined, the quality of the MODIS land cover product will improve accordingly.
|
| [9] |
MODIS和GLOBCOVER全球土地覆盖数据集对比分析——以黑龙江流域为例 [J].https://doi.org/10.3724/SP.J.1047.2012.00240 URL Magsci [本文引用: 1] 摘要
随着全球气候变化的日益加剧,全球变化研究对全球土地覆盖数据的需要也越来越迫切。目前全球土地覆盖数据产品主要包括由欧洲和美国生产的5类数据产品,其中,美国波士顿大学生产的全球土地覆盖数据产品(即MODIS数据集)和欧洲空间局通过全球合作生产的全球土地覆盖数据产品(即Globcover数据集)具有较好的实效性,应用越来越广泛。由于数据来源、分类系统和分类方法不同,两个数据集在土地覆盖类型的数量和空间分布上有明显的差异。本研究从数据使用者的角度,对比了MODIS和Globcover数据集在黑龙江流域上数量和空间分布的差异,并采用LANDSAT TM/ETM+影像随机采样和野外照片验证两种方式对两个数据集的分类精度进行了验证。结果表明,在黑龙江流域,两个数据集数量和空间分布差异较大。在数量上,两个数据集一级土地覆盖类型均以森林和农田为主,草地次之,但二级土地覆盖类型差异较大。在空间上,二级类空间一致性区域和一级类空间一致性的区域分别仅占流域的22.5%和53.6%。两个数据集精度均不高,一级土地覆盖类型精度约为60%,Globcover数据较MODIS数据破碎化明显,整体精度略低于MODIS数据集,不同的二级土地覆盖类型精度不同。考虑到黑龙江流域的代表性,我们认为Globcover数据集和MODIS数据集可满足较低要求的土地覆盖分析需求。本研究为全球气候变化研究选择合适的数据集提供了基础。
A comparative analysis of the MODIS land cover data sets and Globcover land cover data sets in Heilongjiang Basin [J].https://doi.org/10.3724/SP.J.1047.2012.00240 URL Magsci [本文引用: 1] 摘要
随着全球气候变化的日益加剧,全球变化研究对全球土地覆盖数据的需要也越来越迫切。目前全球土地覆盖数据产品主要包括由欧洲和美国生产的5类数据产品,其中,美国波士顿大学生产的全球土地覆盖数据产品(即MODIS数据集)和欧洲空间局通过全球合作生产的全球土地覆盖数据产品(即Globcover数据集)具有较好的实效性,应用越来越广泛。由于数据来源、分类系统和分类方法不同,两个数据集在土地覆盖类型的数量和空间分布上有明显的差异。本研究从数据使用者的角度,对比了MODIS和Globcover数据集在黑龙江流域上数量和空间分布的差异,并采用LANDSAT TM/ETM+影像随机采样和野外照片验证两种方式对两个数据集的分类精度进行了验证。结果表明,在黑龙江流域,两个数据集数量和空间分布差异较大。在数量上,两个数据集一级土地覆盖类型均以森林和农田为主,草地次之,但二级土地覆盖类型差异较大。在空间上,二级类空间一致性区域和一级类空间一致性的区域分别仅占流域的22.5%和53.6%。两个数据集精度均不高,一级土地覆盖类型精度约为60%,Globcover数据较MODIS数据破碎化明显,整体精度略低于MODIS数据集,不同的二级土地覆盖类型精度不同。考虑到黑龙江流域的代表性,我们认为Globcover数据集和MODIS数据集可满足较低要求的土地覆盖分析需求。本研究为全球气候变化研究选择合适的数据集提供了基础。
|
| [10] |
Major forest changes and land cover transitions based on plant functional types derived from the ESA CCI Land Cover product [J].https://doi.org/10.1016/j.jag.2015.12.006 URL [本文引用: 1] |
| [11] |
全球地表覆盖制图研究新范式 [J].New research paradigm for global land cover mapping [J]. |
| [12] |
Global mapping of artificial surface at 30-m resolution [J].https://doi.org/10.1007/s11430-016-5291-y URL [本文引用: 1] |
| [13] |
20世纪80年代末以来中国土地利用变化的基本特征与空间格局 [J].Spatiotemporal characteristics, patterns and causes of land use changes in China since the late 1980s [J]. |
| [14] |
Spatiotemporal patterns and characteristics of land-use change in China during 2010-2015 [J].https://doi.org/10.1007/s11442-018-1490-0 URL [本文引用: 1] 摘要
Land use/cover change is an important theme on the impacts of human activities on the earth systems and global environmental change. National land-use changes of China during 2010–2015 were acquired by the digital interpretation method using the high-resolution remotely sensed images, e.g. the Landsat 8 OLI, GF-2 remote sensing images. The spatiotemporal characteristics of land-use changes across China during 2010–2015 were revealed by the indexes of dynamic degree model, annual land-use changes ratio etc. The results indicated that the built-up land increased by 24.6×10 3 km 2 while the cropland decreased by 4.9×10 3 km 2 , and the total area of woodland and grassland decreased by 16.4×10 3 km 2 . The spatial pattern of land-use changes in China during 2010–2015 was concordant with that of the period 2000–2010. Specially, new characteristics of land-use changes emerged in different regions of China in 2010–2015. The built-up land in eastern China expanded continually, and the total area of cropland decreased, both at decreasing rates. The rates of built-up land expansion and cropland shrinkage were accelerated in central China. The rates of built-up land expansion and cropland growth increased in western China, while the decreasing rate of woodland and grassland accelerated. In northeastern China, built-up land expansion slowed continually, and cropland area increased slightly accompanied by the conversions between paddy land and dry land. Besides, woodland and grassland area decreased in northeastern China. The characteristics of land-use changes in eastern China were essentially consistent with the spatial govern and control requirements of the optimal development zones and key development zones according to the Major Function-oriented Zones Planning implemented during the 12th Five-Year Plan (2011–2015). It was a serious challenge for the central government of China to effectively protect the reasonable layout of land use types dominated with the key ecological function zones and agricultural production zones in central and western China. Furthermore, the local governments should take effective measures to strengthen the management of territorial development in future.
|
| [15] |
河南省GlobeLand30数据精度评价及对比分析 [J].
全球地表覆盖数据在气候变化研究、地理国情监测、生态环境保护等方面发挥着重要作用,2014年中国国家基础地理信息中心推出了全球最高30 m分辨率的地表覆盖遥感制图数据产品Globe Land30。本文以2010年1:10万中国土地利用数据为参考,采用空间统计、面积一致性以及误差矩阵等分析方法,对河南省Globe Land30、Glob Cover2009、MCD12Q1数据进行精度评价和对比分析研究,结果表明:(1)3种地表覆盖数据对河南省土地构成的描述基本一致,即以耕地、林地为主,草地、水体和人造地表为辅,但分类土地面积存在大小不同的差异;(2)Globe Land30的总体精度和Kappa系数最高,MCD12Q1次之,GlobCover2009最低。3种数据中耕地和林地的精度均较高,草地的精度较差,Globe Land30中水体和人造地表的生产者精度远高于其他2种数据,使用者精度相差不大;(3)地表覆盖数据与参考数据在空间上存在类型混淆情况,混淆主要发生于林地、草地、水体、人造地表与耕地之间,Globe Land30的混淆程度要低于其他2种数据。
Accuracy assessment and comparative analysis of GlobeLand30 dataset in Henan province [J].
全球地表覆盖数据在气候变化研究、地理国情监测、生态环境保护等方面发挥着重要作用,2014年中国国家基础地理信息中心推出了全球最高30 m分辨率的地表覆盖遥感制图数据产品Globe Land30。本文以2010年1:10万中国土地利用数据为参考,采用空间统计、面积一致性以及误差矩阵等分析方法,对河南省Globe Land30、Glob Cover2009、MCD12Q1数据进行精度评价和对比分析研究,结果表明:(1)3种地表覆盖数据对河南省土地构成的描述基本一致,即以耕地、林地为主,草地、水体和人造地表为辅,但分类土地面积存在大小不同的差异;(2)Globe Land30的总体精度和Kappa系数最高,MCD12Q1次之,GlobCover2009最低。3种数据中耕地和林地的精度均较高,草地的精度较差,Globe Land30中水体和人造地表的生产者精度远高于其他2种数据,使用者精度相差不大;(3)地表覆盖数据与参考数据在空间上存在类型混淆情况,混淆主要发生于林地、草地、水体、人造地表与耕地之间,Globe Land30的混淆程度要低于其他2种数据。
|
| [16] |
SPOT4-VEGETATION中国西北地区土地覆盖制图与验证 [J].https://doi.org/10.3321/j.issn:1007-4619.2003.03.009 URL Magsci [本文引用: 1] 摘要
利用SPOT4-VEGETATION 的遥感数据产品生成的NDVI 与NDWI 植被指数时间序列图像集,通过ISODATA 非监督分类方法,编制中国西北地区土地覆盖图。以TM 影像人工解译结果作为真实值,通过对西北五省共计47 个均匀分布且异质性强的25km× 25km 样本区内的土地覆盖类型及其面积进行统计分析,修正了SPOT4-VEGETATION 的土地覆盖分类系统,建立了各省验证结果的样本统计直方图并计算其回归系数。结果表明SPOT4-VEGETATION 中国西北地区土地覆盖图在总体上具有较高的准确性。影响遥感数据自动分类精度,造成土地覆盖误判的原因主要来源于两个方面:即异物同谱和混合像元问题。对于前者通过叠加各种辅助数据如DEM 等可以降低误判的机率;对于后者运用混合像元分解的各种算法可以提高分类精度。
The mapping and validation of land cover in Northwest China from SPOT4-VEGETATION [J].https://doi.org/10.3321/j.issn:1007-4619.2003.03.009 URL Magsci [本文引用: 1] 摘要
利用SPOT4-VEGETATION 的遥感数据产品生成的NDVI 与NDWI 植被指数时间序列图像集,通过ISODATA 非监督分类方法,编制中国西北地区土地覆盖图。以TM 影像人工解译结果作为真实值,通过对西北五省共计47 个均匀分布且异质性强的25km× 25km 样本区内的土地覆盖类型及其面积进行统计分析,修正了SPOT4-VEGETATION 的土地覆盖分类系统,建立了各省验证结果的样本统计直方图并计算其回归系数。结果表明SPOT4-VEGETATION 中国西北地区土地覆盖图在总体上具有较高的准确性。影响遥感数据自动分类精度,造成土地覆盖误判的原因主要来源于两个方面:即异物同谱和混合像元问题。对于前者通过叠加各种辅助数据如DEM 等可以降低误判的机率;对于后者运用混合像元分解的各种算法可以提高分类精度。
|
| [17] |
A spatial comparison of four satellite derived 1 km global land cover datasets [J].https://doi.org/10.1016/j.jag.2005.12.002 URL [本文引用: 1] 摘要
Global change issues are high on the current international political agenda. A variety of global protocols and conventions have been established aimed at mitigating global environmental risks. A system for monitoring, evaluation and compliance of these international agreements is needed, with each component requiring comprehensive analytical work based on consistent datasets. Consequently, scientists and policymakers have put faith in earth observation data for improved global analysis. Land cover provides in many aspects the foundation for environmental monitoring [FAO, 2002a. Proceedings of the FAO/UNEP Expert Consultation on Strategies for Global Land Cover Mapping and Monitoring. FAO, Rome, Italy, 38 pp.]. Despite the significance of land cover as an environmental variable, our knowledge of land cover and its dynamics is poor [Foody, G.M., 2002. Status of land cover classification accuracy assessment. Rem. Sens. Environ. 80, 185 201]. This study compares four satellite derived 1 km land cover datasets freely available from the internet and in wide use among the scientific community. Our analysis shows that while these datasets have in many cases reasonable agreement at a global level in terms of total area and general spatial pattern, there is limited agreement on the spatial distribution of the individual land classes. If global datasets are used at a continental or regional level, agreement in many cases decreases significantly. Reasons for these differences are many anging from the classes and thresholds applied, time of data collection, sensor type, classification techniques, use of in situ data, etc., and make comparison difficult. Results of studies based on global land cover datasets are likely influenced by the dataset chosen. Scientists and policymakers should be made aware of the inherent limitations in using current global land cover datasets, and would be wise to utilise multiple datasets for comparison.
|
| [18] |
大尺度土地覆盖数据集在中国及周边区域的精度评价 [J].https://doi.org/10.11834/jrs.20143055 URL Magsci [本文引用: 1] 摘要
大尺度土地覆盖数据是全球陆地表层过程研究、生态系统评估、环境建模等科学研究的重要基础,研究现有数据集的特点对数据使用者及生产新的数据集都具有指导意义。本研究以中国及周边区域为研究区,根据不同分类体系对地物的定义,研究不同分类体系中对应地物的相关系数,并将所有分类体系转换为IGBP分类体系;然后,从定性和定量两方面分析现有5种土地覆盖数据集(IGBP DISCover、UMD、GLC2000、MOD12Q1和GlobCover 2005)的空间一致性;并利用Google Earth高分影像选取两期验证样本评价5种土地覆盖数据集的精度。结果表明:同种地物在不同土地覆盖数据集之间的空间分布格局差异较大,且不同土地覆盖数据集之间的总体一致性系数较低;5种土地覆盖数据集中,GLC2000的总体精度和Kappa系数均最高,GlobCover 2005的总体精度和Kappa系数均最低。
Comparison and assessment of large-scale land cover datasets in China and adjacent regions [J].https://doi.org/10.11834/jrs.20143055 URL Magsci [本文引用: 1] 摘要
大尺度土地覆盖数据是全球陆地表层过程研究、生态系统评估、环境建模等科学研究的重要基础,研究现有数据集的特点对数据使用者及生产新的数据集都具有指导意义。本研究以中国及周边区域为研究区,根据不同分类体系对地物的定义,研究不同分类体系中对应地物的相关系数,并将所有分类体系转换为IGBP分类体系;然后,从定性和定量两方面分析现有5种土地覆盖数据集(IGBP DISCover、UMD、GLC2000、MOD12Q1和GlobCover 2005)的空间一致性;并利用Google Earth高分影像选取两期验证样本评价5种土地覆盖数据集的精度。结果表明:同种地物在不同土地覆盖数据集之间的空间分布格局差异较大,且不同土地覆盖数据集之间的总体一致性系数较低;5种土地覆盖数据集中,GLC2000的总体精度和Kappa系数均最高,GlobCover 2005的总体精度和Kappa系数均最低。
|
| [19] |
首套全球30 m分辨率土地覆被产品区域尺度精度评价——以河南省为例 [J].https://doi.org/10.11821/dlyj201608003 URL [本文引用: 1] 摘要
Accurate global land cover datasets are key environmental information for research on global changes and regional sustainable development, such as global climate change, ecosystem assessment, biodiversity conservation. However, there are still some shortcomings in showing spatial and thematic details for the existing global land cover products at medium and low resolutions (300-1000 m). Recently, GlobeLand30, a global land cover product based on Landsat images at a 30-m resolution, was produced and released by China. The product made a breakthrough in enhancing spatial resolution of global land cover products, and has a wide range of application prospects. As with any land cover products, it is necessary to carry out accuracy evaluation of GlobeLand30 in global, regional or local scales before it is widely applied. This study aims at assessing the accuracy of GlobleLand30 in Henan province with cross-comparison analyses and sampling methods respectively. Firstly, the national land use database of China at a 1100000 scale (CHINA-2010) was used as a reference data to analyze the spatial consistency between these two products. Secondly, validation samples collected from Google Earth were used to assess the producer's accuracy in spatially inconsistent areas. Finally, the overall accuracy of GlobleLand30 was assessed by field survey. Moreover, several factors influencing the accuracy of GlobleLand30 were also taken into consideration, such as land cover complexity and elevation. The following conclusions were drawn: (a) Spatial consistency between GlobleLand30 and CHINA-2010 reached up to 80.20%. There was high spatial consistency for croplands, forests and artificial surfaces, and low spatial consistency for grasslands, water bodies, shrubs, wetlands and unused lands. (b) The overall accuracy of GlobleLand30 was slightly lower than that of CHINA-2010 in spatially inconsistent areas. As for forests, producer's accuracy of GlobleLand30 was relatively higher than that of CHINA-2010. (c) It was found by field survey that the overall accuracy of GlobleLand30 was 83.33%. (d) On the one hand, with the increase of the complexity of land cover types, spatial consistency between GlobleLand30 and CHINA-2010 decreased; on the other hand, with the increase of elevation, spatial consistency between the two products decreased first and then rose, and became lower in the elevation transition zones.
Regional accuracy assessments of the first global land cover dataset at 30-meter resolution: A case study of Henan province [J].https://doi.org/10.11821/dlyj201608003 URL [本文引用: 1] 摘要
Accurate global land cover datasets are key environmental information for research on global changes and regional sustainable development, such as global climate change, ecosystem assessment, biodiversity conservation. However, there are still some shortcomings in showing spatial and thematic details for the existing global land cover products at medium and low resolutions (300-1000 m). Recently, GlobeLand30, a global land cover product based on Landsat images at a 30-m resolution, was produced and released by China. The product made a breakthrough in enhancing spatial resolution of global land cover products, and has a wide range of application prospects. As with any land cover products, it is necessary to carry out accuracy evaluation of GlobeLand30 in global, regional or local scales before it is widely applied. This study aims at assessing the accuracy of GlobleLand30 in Henan province with cross-comparison analyses and sampling methods respectively. Firstly, the national land use database of China at a 1100000 scale (CHINA-2010) was used as a reference data to analyze the spatial consistency between these two products. Secondly, validation samples collected from Google Earth were used to assess the producer's accuracy in spatially inconsistent areas. Finally, the overall accuracy of GlobleLand30 was assessed by field survey. Moreover, several factors influencing the accuracy of GlobleLand30 were also taken into consideration, such as land cover complexity and elevation. The following conclusions were drawn: (a) Spatial consistency between GlobleLand30 and CHINA-2010 reached up to 80.20%. There was high spatial consistency for croplands, forests and artificial surfaces, and low spatial consistency for grasslands, water bodies, shrubs, wetlands and unused lands. (b) The overall accuracy of GlobleLand30 was slightly lower than that of CHINA-2010 in spatially inconsistent areas. As for forests, producer's accuracy of GlobleLand30 was relatively higher than that of CHINA-2010. (c) It was found by field survey that the overall accuracy of GlobleLand30 was 83.33%. (d) On the one hand, with the increase of the complexity of land cover types, spatial consistency between GlobleLand30 and CHINA-2010 decreased; on the other hand, with the increase of elevation, spatial consistency between the two products decreased first and then rose, and became lower in the elevation transition zones.
|
| [20] |
Study on spatial pattern of land-use change in China during 1995-2000 [J]. |
| [21] |
20世纪90年代中国土地利用变化时空特征及其成因分析 [J].https://doi.org/10.3321/j.issn:1000-0585.2003.01.001 URL [本文引用: 1] 摘要
Supported by the key knowledge innovation projects,i.e., a preliminary study on the theories and techniques of the remotely sensed temporal-spatial information and digital Earth; and a study on the integration of national resources and environment and data sharing, the authors have set up a spatial-temporal information platform by the integration of the corresponding scientific and research achievements during the periods of the 8th- and 9th-Five Year Plan, which comprehensively reflected the features of land-use change, designed a series of technical frameworks on the spatial-temporal database construction based on remote sensing techniques, e.g., the construction of remotely sensed database and land-use spatial database of the mid-1980s, the mid-1990s and the end of the 1990s, which laid a foundation for the dynamic monitoring of land-use change and the corresponding studies. In this paper,the authors have analyzed comprehensively the features of land-use change in the 1990s, revealed the spatial-temporal change of land use supported by remote sensing and GIS technologies as well as analyzed the geophysical and socio-economic driving factors.The findings are as follows: the arable land has been increased in total amount, the balance of decrease in the south and increase in the north was resulted from the reclamations of grassland and forest land. On the whole, the forest land area had a process of decrease, and the decreased area was mainly distributed in the traditional forest areas. Areas with plentiful precipitation and heat in the south, however, had distinct effects of reforestation. The rural-urban construction land had a situation of persistent expansion, and the general expansion speed has been slowed down during the last five years of the 1990s with the exception of the Western China where the expansion speed has been accelerated. The land use change in China in the 1990s had distinct temporal and spatial differences due to two main reasons, which were policy control and economic driving. Hereby, conclusions and proposals brought forward by the authors were as follows: the spatial diversity rules of the modern land use change in China must be fully considered in the future land use planning. At the same time, the pertinence of physical geographical zones must be considered during the planning of eco-environment construction. And, based on the increasingly maturity of the infrastructure, the traditional thoughts on planning and management of resources must be shifted so as to fully realize the optimized allocation of land resources at regional scale.
A study on the spatial-temporal dynamic changes of land-use and driving forces analyses of China in the 1990s [J].https://doi.org/10.3321/j.issn:1000-0585.2003.01.001 URL [本文引用: 1] 摘要
Supported by the key knowledge innovation projects,i.e., a preliminary study on the theories and techniques of the remotely sensed temporal-spatial information and digital Earth; and a study on the integration of national resources and environment and data sharing, the authors have set up a spatial-temporal information platform by the integration of the corresponding scientific and research achievements during the periods of the 8th- and 9th-Five Year Plan, which comprehensively reflected the features of land-use change, designed a series of technical frameworks on the spatial-temporal database construction based on remote sensing techniques, e.g., the construction of remotely sensed database and land-use spatial database of the mid-1980s, the mid-1990s and the end of the 1990s, which laid a foundation for the dynamic monitoring of land-use change and the corresponding studies. In this paper,the authors have analyzed comprehensively the features of land-use change in the 1990s, revealed the spatial-temporal change of land use supported by remote sensing and GIS technologies as well as analyzed the geophysical and socio-economic driving factors.The findings are as follows: the arable land has been increased in total amount, the balance of decrease in the south and increase in the north was resulted from the reclamations of grassland and forest land. On the whole, the forest land area had a process of decrease, and the decreased area was mainly distributed in the traditional forest areas. Areas with plentiful precipitation and heat in the south, however, had distinct effects of reforestation. The rural-urban construction land had a situation of persistent expansion, and the general expansion speed has been slowed down during the last five years of the 1990s with the exception of the Western China where the expansion speed has been accelerated. The land use change in China in the 1990s had distinct temporal and spatial differences due to two main reasons, which were policy control and economic driving. Hereby, conclusions and proposals brought forward by the authors were as follows: the spatial diversity rules of the modern land use change in China must be fully considered in the future land use planning. At the same time, the pertinence of physical geographical zones must be considered during the planning of eco-environment construction. And, based on the increasingly maturity of the infrastructure, the traditional thoughts on planning and management of resources must be shifted so as to fully realize the optimized allocation of land resources at regional scale.
|
| [22] |
21世纪初期中国海岸带区域土地利用变化特征研究 [D].Characteristics of land use change in China's coastal zone in the early 21st century [D]. |
| [23] |
中国海岸带土地利用遥感分类系统研究 [J].
土地利用分类是土地利用数据建立和土地利用变化研究的前提。鉴于我国海岸带土地利用多样性显著而分类系统研究相对不足的现实,本文简要论述国内外海岸带土地利用分类系统的研究进展、适用的遥感数据类型和制图精度,并从陆海耦合的角度出发回顾国内滨海湿地分类系统的研究成果。在此基础上,提出中国海岸带土地利用遥感分类系统优化方案,包含8个一级类型和24个二级类型,较全面地涵盖了全国海岸带的土地资源类型,并从海岸带区域的特征出发,强调了湿地资源的细分;应用该分类系统,基于Landsat TM影像建立解译标志,并对2010年中国海岸带区域土地利用进行遥感制图,表明该分类系统具有较强的可行性。本研究可为全国尺度海岸带土地资源遥感调查、土地利用管理与规划、海岸带综合管理等研究工作提供参考。
Land use classification system for China's coastal zone based on remote sensing [J].
土地利用分类是土地利用数据建立和土地利用变化研究的前提。鉴于我国海岸带土地利用多样性显著而分类系统研究相对不足的现实,本文简要论述国内外海岸带土地利用分类系统的研究进展、适用的遥感数据类型和制图精度,并从陆海耦合的角度出发回顾国内滨海湿地分类系统的研究成果。在此基础上,提出中国海岸带土地利用遥感分类系统优化方案,包含8个一级类型和24个二级类型,较全面地涵盖了全国海岸带的土地资源类型,并从海岸带区域的特征出发,强调了湿地资源的细分;应用该分类系统,基于Landsat TM影像建立解译标志,并对2010年中国海岸带区域土地利用进行遥感制图,表明该分类系统具有较强的可行性。本研究可为全国尺度海岸带土地资源遥感调查、土地利用管理与规划、海岸带综合管理等研究工作提供参考。
|
| [24] |
Spatial-temporal characteristics of land use intensity of coastal zone in China during 2000-2010 [J].https://doi.org/10.1007/s11769-014-0707-0 URL [本文引用: 1] |
| [25] |
Google Earth 影像辅助的农作物面积地面样方调查 [J].https://doi.org/10.11975/j.issn.1002-6819.2015.24.023 URL Magsci [本文引用: 1] 摘要
地面样方调查是农作物种植面积遥感监测的重要环节,一般采用差分GPS(DGPS,differential GPS)实地测量的方式实现,是一项耗时、耗力的业务工作。该文利用经DGPS实测点校正后的Google Earth影像,以中国农业科学院(万庄)农业高新技术产业园及周边地区范围(3.1 km×2.0 km)为研究区域,探索了基于Google Earth影像辅助的农作物面积地面样方调查,比较了该方法与完全采用GPS实地测量在调查精度和效率方面的差异。针对不同的GE影像来源,文中定义基于GE客户端COM API编程下载后的影像为A级影像、经在线GE影像校正后的影像为B级影像、经DGPS实测点校正后的影像为C级影像。与实测的检查点相比,0.5 m以上空间分辨率的A级影像X、Y 2个方向中误差232.7 m,B级影像中误差5.4 m,C级影像中误差1.0 m。B级影像中误差符合《数字航空摄影测量 空中三角测量规范》1:25000平地的平面位置中误差不大于8.75 m的要求,C级影像中误差符合1:10000平地的平面位置中误差不大于3.5 m的要求。在测区内选择结构组成简单、中等和较为复杂的3个样方类型,量算B和C级影像的面积量算精度,与DGPS实测面积比较,平均误差仅有0.108%和0.018%。从样方相对位置确定、地块和农田边界的修正3个方面用于地面样方的辅助测量,在业务工作中进行了初步应用,陕西省2015年冬小麦种植面积地面样方调查的实际效果表明,GE影像辅助调查比GPS实测方法在时间方面减少了64.2%,路程节约82.5%,调查效率提高了73.3%以上。
Crop area ground sample survey using Google Earth image-aided [J].https://doi.org/10.11975/j.issn.1002-6819.2015.24.023 URL Magsci [本文引用: 1] 摘要
地面样方调查是农作物种植面积遥感监测的重要环节,一般采用差分GPS(DGPS,differential GPS)实地测量的方式实现,是一项耗时、耗力的业务工作。该文利用经DGPS实测点校正后的Google Earth影像,以中国农业科学院(万庄)农业高新技术产业园及周边地区范围(3.1 km×2.0 km)为研究区域,探索了基于Google Earth影像辅助的农作物面积地面样方调查,比较了该方法与完全采用GPS实地测量在调查精度和效率方面的差异。针对不同的GE影像来源,文中定义基于GE客户端COM API编程下载后的影像为A级影像、经在线GE影像校正后的影像为B级影像、经DGPS实测点校正后的影像为C级影像。与实测的检查点相比,0.5 m以上空间分辨率的A级影像X、Y 2个方向中误差232.7 m,B级影像中误差5.4 m,C级影像中误差1.0 m。B级影像中误差符合《数字航空摄影测量 空中三角测量规范》1:25000平地的平面位置中误差不大于8.75 m的要求,C级影像中误差符合1:10000平地的平面位置中误差不大于3.5 m的要求。在测区内选择结构组成简单、中等和较为复杂的3个样方类型,量算B和C级影像的面积量算精度,与DGPS实测面积比较,平均误差仅有0.108%和0.018%。从样方相对位置确定、地块和农田边界的修正3个方面用于地面样方的辅助测量,在业务工作中进行了初步应用,陕西省2015年冬小麦种植面积地面样方调查的实际效果表明,GE影像辅助调查比GPS实测方法在时间方面减少了64.2%,路程节约82.5%,调查效率提高了73.3%以上。
|
| [26] |
An overview of 21 global and 43 regional land-cover mapping products [J].https://doi.org/10.1080/01431161.2015.1093195 URL [本文引用: 1] 摘要
Land-cover (LC) products, especially at the regional and global scales, comprise essential data for a wide range of environmental studies affecting biodiversity, climate, and human health. This review builds on previous compartmentalized efforts by summarizing 23 global and 41 regional LC products. Characteristics related to spatial resolution, overall accuracy, time of data acquisition, sensor used, classification scheme and method, support for LC change detection, download location, and key corresponding references are provided. Operational limitations and uncertainties are discussed, mostly as a result of different original modelling outcomes. Upcoming products are presented and future prospects towards increasing usability of different LC products are offered. Despite the common realization of product usage by non-experts, the remote-sensing community has not fully addressed the challenge. Algorithmic development for the effective representation of inherent product limitations to facilitate proper usage by non-experts is necessary. Further emphasis should be placed on international coordination and harmonization initiatives for compatible LC product generation. We expect the applicability of current and future LC products to increase, especially as our environmental understanding increases through multi-temporal studies.
|
| [27] |
Accuracy assessment of seven global land cover datasets over China [J].https://doi.org/10.1016/j.isprsjprs.2017.01.016 URL [本文引用: 1] 摘要
Land cover (LC) is the vital foundation to Earth science. Up to now, several global LC datasets have arisen with efforts of many scientific communities. To provide guidelines for data usage over China, nine LC maps from seven global LC datasets (IGBP DISCover, UMD, GLC, MCD12Q1, GLCNMO, CCI-LC, and GlobeLand30) were evaluated in this study. First, we compared their similarities and discrepancies in both area and spatial patterns, and analysed their inherent relations to data sources and classification schemes and methods. Next, five sets of validation sample units (VSUs) were collected to calculate their accuracy quantitatively. Further, we built a spatial analysis model and depicted their spatial variation in accuracy based on the five sets of VSUs. The results show that, there are evident discrepancies among these LC maps in both area and spatial patterns. For LC maps produced by different institutes, GLC 2000 and CCI-LC 2000 have the highest overall spatial agreement (53.8%). For LC maps produced by same institutes, overall spatial agreement of CCI-LC 2000 and 2010, and MCD12Q1 2001 and 2010 reach up to 99.8% and 73.2%, respectively; while more efforts are still needed if we hope to use these LC maps as time series data for model inputting, since both CCI-LC and MCD12Q1 fail to represent the rapid changing trend of several key LC classes in the early 21st century, in particular urban and built-up, snow and ice, water bodies, and permanent wetlands. With the highest spatial resolution, the overall accuracy of GlobeLand30 2010 is 82.39%. For the other six LC datasets with coarse resolution, CCI-LC 2010/2000 has the highest overall accuracy, and following are MCD12Q1 2010/2001, GLC 2000, GLCNMO 2008, IGBP DISCover, and UMD in turn. Beside that all maps exhibit high accuracy in homogeneous regions; local accuracies in other regions are quite different, particularly in Farming-Pastoral Zone of North China, mountains in Northeast China, and Southeast Hills. Special attention should be paid for data users who are interested in these regions.
|
| [28] |
效率系数和一致性指数及其在干旱预测精度评价中的应用 [J].https://doi.org/10.7606/j.issn.1000-7601.2016.01.35 URL [本文引用: 1] 摘要
基于关中平原2003—2014年Aqua-MODIS数据的条件植被温度指数的干旱监测结果,引入效率系数和一致性指数对自回归求和移动平均(ARIMA)模型和季节性ARIMA模型的预测精度进行了评价,并分析了其在干旱预测精度评价中的适用性。两种干旱预测模型的精度评价结果为ARIMA模型与季节性ARIMA模型的效率系数分别为-0.04与-4.27,一致性指数分别为0.40与0.37,表明ARIMA模型对干旱的预测精度高于季节性ARIMA模型,这与均方根误差、皮尔森相关系数及Kappa系数等的评价结果一致,且效率系数对不同干旱预测模型的预测性能的区分效果尤为显著,对干旱预测模型的精度评价比一致性指数更为合理。因此,效率系数更适合用于遥感干旱预测模型的精度评价。
Application of the coefficient of efficiency and index of agreement on accuracy assessment of drought forecasting models [J].https://doi.org/10.7606/j.issn.1000-7601.2016.01.35 URL [本文引用: 1] 摘要
基于关中平原2003—2014年Aqua-MODIS数据的条件植被温度指数的干旱监测结果,引入效率系数和一致性指数对自回归求和移动平均(ARIMA)模型和季节性ARIMA模型的预测精度进行了评价,并分析了其在干旱预测精度评价中的适用性。两种干旱预测模型的精度评价结果为ARIMA模型与季节性ARIMA模型的效率系数分别为-0.04与-4.27,一致性指数分别为0.40与0.37,表明ARIMA模型对干旱的预测精度高于季节性ARIMA模型,这与均方根误差、皮尔森相关系数及Kappa系数等的评价结果一致,且效率系数对不同干旱预测模型的预测性能的区分效果尤为显著,对干旱预测模型的精度评价比一致性指数更为合理。因此,效率系数更适合用于遥感干旱预测模型的精度评价。
|
| [29] |
全球土地覆盖GlobCover2009数据中的中国区域湿地数据精度评价 [J].
<p>目前,湿地方面的全球性数据产品寥寥无几。GlobCover2009作为免费的分辨率最高的全球土地覆盖数据产品,成为研究全球性湿地的重要参考数据源之一。目前为止,还没有学者对该数据产品中湿地类型的精度做出具体评价。以目视解译的中国2008年湿地遥感制图数据为参考, 从湿地面积、类型和空间一致性在不同区域的分布等方面,对GlobCover2009数据产品在中国区域内湿地相关类型产品的分类精度进行了评价。评价结果显示,GlobCover2009数据产品中,中国的湿地类型总体分类精度不高,湿地面积一致性为46%,总体精度为32%,Kappa系数为0.13;其中,沼泽湿地的制图精度(0.05%)远低于水体制图精度(53.34%),水体的用户精度达到90.18%,沼泽湿地的用户精度仅为11.76%。对于沼泽湿地分布较广泛的中国东北地区和西北地区,该数据产品的分类精度也很低,分别仅为17%和13%;造成此现象的原因,除GlobCover2009数据产品没有专门对沼泽湿地进行定义和分类外,二者使用的数据源在空间分辨率及时间上的差异也是主要原因。</p>
Accuracy Assessment of Wetland Categories from the GlobCover2009 Data Over China [J].
<p>目前,湿地方面的全球性数据产品寥寥无几。GlobCover2009作为免费的分辨率最高的全球土地覆盖数据产品,成为研究全球性湿地的重要参考数据源之一。目前为止,还没有学者对该数据产品中湿地类型的精度做出具体评价。以目视解译的中国2008年湿地遥感制图数据为参考, 从湿地面积、类型和空间一致性在不同区域的分布等方面,对GlobCover2009数据产品在中国区域内湿地相关类型产品的分类精度进行了评价。评价结果显示,GlobCover2009数据产品中,中国的湿地类型总体分类精度不高,湿地面积一致性为46%,总体精度为32%,Kappa系数为0.13;其中,沼泽湿地的制图精度(0.05%)远低于水体制图精度(53.34%),水体的用户精度达到90.18%,沼泽湿地的用户精度仅为11.76%。对于沼泽湿地分布较广泛的中国东北地区和西北地区,该数据产品的分类精度也很低,分别仅为17%和13%;造成此现象的原因,除GlobCover2009数据产品没有专门对沼泽湿地进行定义和分类外,二者使用的数据源在空间分辨率及时间上的差异也是主要原因。</p>
|
| [30] |
四种常用的全球1km土地覆盖数据中国区域的精度评价 [J].
<FONT face=Verdana>精确的全球及区域土地覆盖数据是陆地表层过程研究的重要基础. 定量的评价已有数据的质量将有助于未来更好的开展土地覆盖制图. 基于一个新的分类系统(森林、灌木草地、农田、裸地、城市、湿地和水体),以中国1:10万土地利用数据为参考数据,从类型面积一致性、空间一致性两方面对4各全球土地覆盖数据集在中国区域的分类精度进行了评价,包括美国地质调查局为国际地圈-生物圈计划的全球土地覆盖数据集(IGBPDISCover);美国马里兰大学的全球土地覆盖数据集(UMd);欧盟联合研究中心(JRC)空间应用研究所(SAI)的2000年全球土地覆盖数据产品(GLC2000);MODIS 2000年的土地覆盖数据产品(MOD12Q1). 并对4种土地覆盖产品误差的空间和类型分布进行了分析. 结果表明: 在4种土地覆盖分类产品中,GLC2000和MODIS土地覆盖数据有更高的整体分类精度,IGBP数据的整体分类精度次之,但是3种数据在局部都存在明显的分类错误;UMd的分类精度整体最低. 通过对4种数据分类精度的空间和类型分布规律的分析,认为4种数据都不能很好的满足陆地表层过程模拟的需要. 建议发展土地覆盖类型决策融合方法,将现存多源土地覆盖分类信息融合起来,制备更高精度的中国土地覆盖分类图. </FONT>
Accuracy evaluation of the four remote sensing based land cover products over China [J].
<FONT face=Verdana>精确的全球及区域土地覆盖数据是陆地表层过程研究的重要基础. 定量的评价已有数据的质量将有助于未来更好的开展土地覆盖制图. 基于一个新的分类系统(森林、灌木草地、农田、裸地、城市、湿地和水体),以中国1:10万土地利用数据为参考数据,从类型面积一致性、空间一致性两方面对4各全球土地覆盖数据集在中国区域的分类精度进行了评价,包括美国地质调查局为国际地圈-生物圈计划的全球土地覆盖数据集(IGBPDISCover);美国马里兰大学的全球土地覆盖数据集(UMd);欧盟联合研究中心(JRC)空间应用研究所(SAI)的2000年全球土地覆盖数据产品(GLC2000);MODIS 2000年的土地覆盖数据产品(MOD12Q1). 并对4种土地覆盖产品误差的空间和类型分布进行了分析. 结果表明: 在4种土地覆盖分类产品中,GLC2000和MODIS土地覆盖数据有更高的整体分类精度,IGBP数据的整体分类精度次之,但是3种数据在局部都存在明显的分类错误;UMd的分类精度整体最低. 通过对4种数据分类精度的空间和类型分布规律的分析,认为4种数据都不能很好的满足陆地表层过程模拟的需要. 建议发展土地覆盖类型决策融合方法,将现存多源土地覆盖分类信息融合起来,制备更高精度的中国土地覆盖分类图. </FONT>
|
| [31] |
基于亚分数混淆矩阵的中国典型区大尺度土地覆盖数据集评价 [J].https://doi.org/10.11873/j.issn.1004-0323.2015.2.0353 URL Magsci [本文引用: 1] 摘要
<p>在中国东北、华北、华中、华南、西北、青藏、内蒙古7个自然地区分别选择典型区A、B、C、D、E、F、G,以Landsat TM/ETM+影像分类结果为参考数据,采用亚分数混淆矩阵对5种大尺度土地覆盖数据集的精度进行定量评价,为数据集的使用提供科学依据。亚分数混淆矩阵可避免参考数据与待评价数据尺度转换时引入的误差,能反映不同优势类比重情况下数据集的总体精度和分类方法误差。结果表明:GLC2000在全部典型区的总体精度最高,为65.64%;UMD总体精度最低,为43.06%。GLC2000在主要土地覆盖类型为林地和耕地以及草地区域具有较高的分类精度;UMD在各区域的分类精度均最低或较低。5种土地覆盖数据集对于城镇、其他的分类精度在各典型区均较低;对于草地和水体的分类精度则是在西北干旱区和青藏高原区的典型区较高。</br> </p>
Assessment of Large-scale land cover datasets in Typical Areas of China based on sub-fractional error matrix [J].https://doi.org/10.11873/j.issn.1004-0323.2015.2.0353 URL Magsci [本文引用: 1] 摘要
<p>在中国东北、华北、华中、华南、西北、青藏、内蒙古7个自然地区分别选择典型区A、B、C、D、E、F、G,以Landsat TM/ETM+影像分类结果为参考数据,采用亚分数混淆矩阵对5种大尺度土地覆盖数据集的精度进行定量评价,为数据集的使用提供科学依据。亚分数混淆矩阵可避免参考数据与待评价数据尺度转换时引入的误差,能反映不同优势类比重情况下数据集的总体精度和分类方法误差。结果表明:GLC2000在全部典型区的总体精度最高,为65.64%;UMD总体精度最低,为43.06%。GLC2000在主要土地覆盖类型为林地和耕地以及草地区域具有较高的分类精度;UMD在各区域的分类精度均最低或较低。5种土地覆盖数据集对于城镇、其他的分类精度在各典型区均较低;对于草地和水体的分类精度则是在西北干旱区和青藏高原区的典型区较高。</br> </p>
|
| [32] |
Valuing map validation: The need for rigorous land cover map accuracy assessment in economic valuations of ecosystem services [J].https://doi.org/10.1016/j.ecolecon.2015.01.003 URL [本文引用: 1] |
| [33] |
Kappa系数在干旱预测模型精度评价中的应用——以关中平原的干旱预测为例 [J].Application of Kappa coefficient to accuracy assessments of drought forecasting model: A case study of Guanzhong Plain [J]. |

/
| 〈 |
|
〉 |