刘菊 , 许珺, 蔡玲
LIU Ju, XU Jun, CAI Ling
通讯作者:
收稿日期: 2018-04-4
修回日期: 2018-09-7
网络出版日期: 2018-11-20
版权声明: 2018 《地球信息科学学报》编辑部 《地球信息科学学报》编辑部 所有
基金资助:
作者简介:
作者简介:刘 菊(1994-),女,硕士生,研究方向为数据挖掘。E-mail: liuju@lreis.ac.cn
展开
摘要
出租车数据作为城市大数据重要来源,其上车行为和下车行为直接反映城市人群出行行为特征,帮助城市规划者发现城市人群出行规律和城市功能结构。但是出租车数据隐含多维度信息,一维或者二维模型不足以表达和挖掘其蕴含的多维信息,因此本文选择可以承载多维数据的张量模型对出租车OD(上车/下车)数据进行时空模式挖掘。本文将北京六环区域划分为500 m×500 m格网,采用北京市2012年11月1-16日的出租车OD数据,分别构建O点和D点张量,利用张量分解模型从日尺度、时段尺度揭示出租车用户出行时间模式,同时获取不同时段对应的出租车用户出行空间模式,并推测空间模式包含的语义属性。本文结合城市兴趣点(Point of Interest, POI)数据,提高空间模式语义属性推测的准确性,识别出租车用户出行功能区。结果表明:出租车用户出行时间符合工作日和休息日的早高峰、日间、晚高峰以及夜间模式;对应8种时间模式,出租车用户出行包含8种空间模式,每一种空间模式都是对应时间模式下的上下车热点区域,因此空间模式的变化表明城市人群在不同的时间点,到达不同的场所,进行不同的活动,间接表达空间功能的动态变化;区域的功能不是单一静态的,而是随着时间在不断地变化,是不同时段功能的组合。本文揭示出租车OD数据中隐含的出租车用户出行模式和空间功能动态变化,对利用人类行为时空模式研究区域空间功能结构具有科学参考价值。
关键词:
Abstract
Under the influence of time, position and purpose, people move between different places in a city for various activities. The spatio-temporal data recording human trajectories implicate the functions of different regions in the city. Taxi is an important way that people travel in a city. The trajectories of taxis record spatio-temporal characteristics of taxi passengers' trips, from which corresponding functions of regions can be detected. This paper tries to figure out dynamic functions of regions where passengers take in or take off taxis by analyzing the regular pattern of ODs (origins and destination) of taxi trajectory data. However, taxi data always contain multi-dimensional information, one-dimensional or two-dimensional model is not enough to express the multi-dimensional information. As a result, we use tensor decomposition model to handle the taxi OD data from multiple dimensions, including day dimension, hour dimension and space dimension, and reveal the pattern of passengers' trips. We divide the region that covers the urban area within Sixth Ring Road of Beijing into 11 663 grids of 500 m×500 m in size. The Os and Ds of taxi trajectories are mapped into the grids and the number of Os and Ds in each grid is counted by hour and day separately. Then, we build 3-rd order tensors of Os and Ds, respectively. The result of tensor decomposition contains three matrixes which show hour patterns, day patterns and spatial patterns of Os and Ds and a core tensor which shows the intensity of relations between the three matrixes. The tensor decomposition found 8 temporal patterns of Os and Ds: morning rush pattern, daytime pattern, evening rush pattern and night pattern on weekdays and weekends separately. Mapping the temporal patterns of Os and Ds into space, 8 spatial patterns of Os and Ds were detected which reveals people's different activities in space during different time periods. By analyzing the patterns in each dimension and the relations between different dimensions, the functions of grids can be identified. Combined with points of interest (POI), more specific functions can be identified. This study demonstrate that the function of a region is not static but dynamic with changes with the need of people. The paper reveals the hidden real-time information of taxi data, which can provide a scientific reference for city planners.
Keywords:
城市是空间、功能和人类活动的组合[1]。人们在城市空间的活动表征了城市空间的功能分异。在时间、位置以及出行目的的共同影响下,城市人群选择性地在城市内部区域之间移动,到达不同的场所,进行不同的活动。海量的交通数据中隐藏着城市人群出行的时空规律,也蕴含着城市功能分区的信息。从海量的交通数据中挖掘城市人群的出行模式,有助于发现城市区域的功能和区域间的相互作用,揭示城市的空间结构。
目前,城市交通数据被用于城市人群出行距离的研究[2,3,4]、城市人群出行时空规律究[5,6]、城市热点区域研究[7,8]、城市空间交互作用[9,10,11,12]等方面;结合城市POIs数据,交通数据还可用于判断城市功能区的分布[12,13]。由于交通运营数据量较大,数据隐含的维度也比较复杂,用一维向量或者二维矩阵形式难以完全表达多维度信息。张量模型则可以充分发挥其多维度的特点,从不同的维度描述数据,已经成功应用于信号处理、计算机视觉、数据挖掘等方面[14,15,16,17]。在城市交通出行方面,Sun等[18]使用张量分解模型探究新加坡城市公交车数据中隐藏的城市人群出行的时空规律,Wang等[19]通过张量分解模型揭示北京出租车轨迹数据中隐藏的城市区域模式,他们的工作都是将上车点(O)、下车点(D)与其它信息一起构建统一的张量。但是城市居民出行活动通常在一定的距离范围内[2,3,4],将O点数据和D点数据放在同一个张量中进行模式挖掘,必然使得OD点相互影响,从而导致同一类模式出现地理空间聚集现象。
作为城市流动人群的主要代步工具,出租车的运营状况和上下车点在很大程度上反映出人群移动的时空规律。相对于出租车完整轨迹路线的随机性,出租车OD数据更能反映出乘客的行为特征,并且出租车OD数据包含轨迹移动的空间信息和时间信息,可以反映出租车用户在不同时段中上车点与下车点对应的热点区域,揭示城市在不同时段中热点区域的空间分布与人群集聚现象,表达城市区域的动态性。而目前利用手机通讯、出行轨迹等大数据研究城市功能的研究中大多只考虑静态的区域功能,未反映出区域功能的动态变化[12-13,20-21]。本文利用北京市出租车OD数据,对北京市出租车用户的出行行为与活动进行分析,推测出行目的及其对应的城市空间功能,并结合兴趣点(Point of Interest, POI)的分布,提高推测的准确性。为解决多维度信息的表达和挖掘,本文选择张量模型;为避免相同区域模式的地理聚集现象,本文使用出租车OD数据分别构造上车张量和下车张量,通过张量分解,发现出租车用户上下车行为在不同维度的时空特征,获取不同时段对应的空间模式,实现出租车用户出行的功能区动态识别。
本文实验数据包括北京市六环路网数据、出租车轨迹数据和POI数据,统一坐标系为WGS 1984 UTM Zone 50 N(WGS84椭球体的通用横轴墨卡托投影第50分度带),研究区域范围:X[422 211.60 m, 475 711.60 m],Y[4 393 462.30 m, 4 447 962.30 m],研究区域在指定投影坐标系下为53.5 km×54.5 km的矩形区域。本实验将研究区域划分为500 m×500 m格网,不仅简化问题模型,而且降低计算的复杂度,划分结果如图1所示,总计11 663个格网,表现为109行×107列,格网编号为从上至下、从左到右依次编号为0-11 662。
本研究出租车轨迹数据时间范围为2012年 11月1-16日,从轨迹数据中提取出租车OD数据,删除重复、不完整以及范围超限数据,其中六环区域内有效轨迹为2 531 618条记录,将每一条出租车轨迹的O点与D点映射到格网中,每一条出租车轨迹记录字段见表1。
表1 出租车轨迹数据字段
Tab.1 The fields of taxi trajectory data
| 序号 | 字段 | 数据类型 | 说明 |
|---|---|---|---|
| 1 | ID | 字符串 | 轨迹唯一标识 |
| 2 | 出租车ID | 字符串 | 出租车唯一标识 |
| 3 | 起点时间 | 日期 | 轨迹开始时间 |
| 4 | 终点时间 | 日期 | 轨迹结束时间 |
| 5 | 轨迹时间 | 浮点型 | 乘客轨迹时间/s |
| 6 | 轨迹距离 | 浮点型 | 乘客轨迹距离/m |
| 7 | 起点经度 | 浮点型 | WGS84地理坐标 |
| 8 | 起点纬度 | 浮点型 | WGS84地理坐标 |
| 9 | 终点经度 | 浮点型 | WGS84地理坐标 |
| 10 | 终点纬度 | 浮点型 | WGS84地理坐标 |
| 11 | 起点编号 | 整型 | 起点对应格网编号 |
| 12 | 终点编号 | 整型 | 终点对应格网编号 |
城市POI数据泛指一切可以抽象为点的地理对象,尤其是与人们生活密切相关的地理实体,可以反映出城市空间区域的功能属性。本文加入北京六环区域的POI数据识别城市功能区特征。本文POI数据通过高德地图开发平台提供的API获取,该平台默认将POI数据分为23大类,263个小类。根据实验目的与需求,本文筛选、拆分与合并不同类别的POI数据,最终获取总计760 200条,总计13个类别(餐饮服务、购物服务、生活服务、体育休闲服务、住宿服务、风景名胜、住宅、政府机构、科教文化、交通设施、金融保险和公司企业),每条记录包括POI名称、经度、纬度、行政区与类别属性。
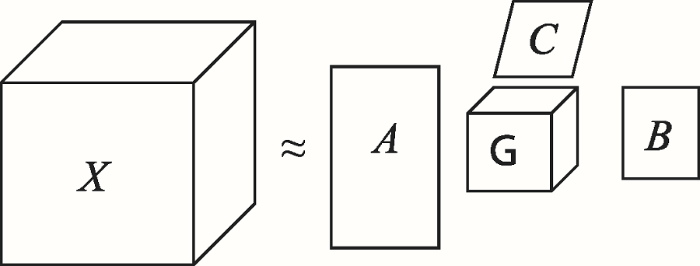
张量是一种多维数组,不同的维度可以具有不同的坐标系统。一阶张量是一个向量,二阶张量是一个矩阵,三阶及以上阶数的张量则是高阶张量,图2是一个三阶张量X∈$\mathbb{R}^{I\times J\times K}$。
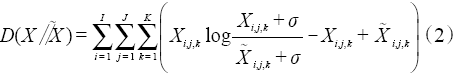
张量分解为奇异值分解和主成分分析的高阶推广,主要包括Tucker分解和CP (Canonical Polyadic Decomposition)分解。其中Tucker分解是一种高阶主成分分析,它把一个张量分解为一个核心张量沿着每一个模乘上一个因子矩阵,每个模上的因子矩阵称为张量在每个模上的基矩阵或者主成分。以3阶张量X∈$\mathbb{R}^{I \times J\times K}$为例,对其进行Tucker分解,分解模数为(P×Q×U)(式(1)),分解结果如图3,其中核心张量G∈$\mathbb{R}^{P\times Q\times U}$,因子矩阵包括A∈$\mathbb{R}^{I\times P}$,B∈$\mathbb{R}^{J\times Q}$,C∈$\mathbb{R}^{K\times U}$。如果P,Q,U分别小于I,J,K,G可以看作是X的压缩,压缩之后的核心张量存储空间明显小于原始张量存储空间,从而达到高维数据的降维,起到数据压缩与特征提取的作用。因子矩阵的每一列为一个主成分,代表该因子特征空间的一种模式,每一行为某一事物在不同模式的值,表示这一事物与不同模式的相关程度,模式值越大相关性越大。核心张量表示因子矩阵之间的相互作用或者联系强度;
张量分解求解问题为:给定一个张量X∈$\mathbb{R}^{I\times J\times K}$,求解核心张量G∈$\mathbb{R}^{P\times Q\times U}$和因子矩阵A∈$\mathbb{R}^{I\times P}$,B∈$\mathbb{R}^{J\times Q}$,C∈$\mathbb{R}^{K\times U}$,使X与
式中:Xi, j, k表示张量中的元素值,
张量分解的核心张量与因子矩阵中的元素 可为正或负,从数学角度观点看,分解结果中存在负值是正确的,但是负值在实际问题中可解释性差,通常是没有意义的,同时张量分解结果不具有唯一性。为解决以上问题,Mørup等[22]提出SN-TUCKER (稀疏非负Tucker分解),该模型在张量分解过程中加入非负约束与稀疏约束。对于任意一个非负张量X,SN-TUCKER通过非负约束可以分解出非负核心张量和非负因子矩阵;通过稀疏约束,对核心张量和因子矩阵进行降维,从而减少张量分解结果的歧义性。SN-TUCKER利用乘法更新规则迭代求解,从而保证G,A,B和C的非负性。SN-TUCKER利用1-范数实现稀疏约束,使结果尽可能的稀疏以获取主要特征,从而减少分解结果的歧义性。
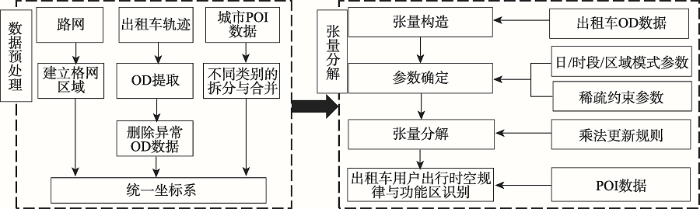
本实验首先进行数据预处理,然后通过张量 分解获取北京六环区域的区域模式。划分到同一种模式中的区域在一天的某个时间段内,具有相似的上下车量,城市居民在相邻的时间段出行或者在相邻的位置上下车,对应的出行模式可能存在一定的相似性,即在某一个时间段内,上车点所在区域或者下车点所在区域具有相似的功能特征;在此理论基础上结合区域活跃时间段和POI分布进行出租车用户出行的功能区特征识别,实验流程如图4所示。
4.2.1 张量构造
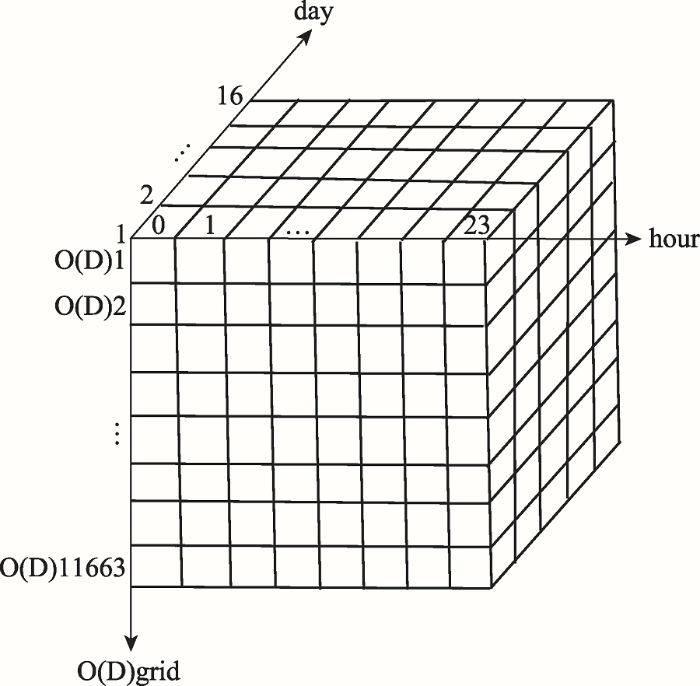
本实验构造上车张量XO = (上车点,时段,日),维数为11 663×24×16,如图5所示,总计16张天切面,每张切面共有11 663行24列,其中每一张垂直切面表示一天;垂直切面的每一行表示一个区域,每一列表示24 h中的一个时段,其中0时段对应 0-1点,其它时段以此类推;垂直切面中格网元素值表示某个区域在某个时段中的出租车上车量。同理构造下车张量XD = (下车点,时段,日)。
4.2.2 张量分解参数设置
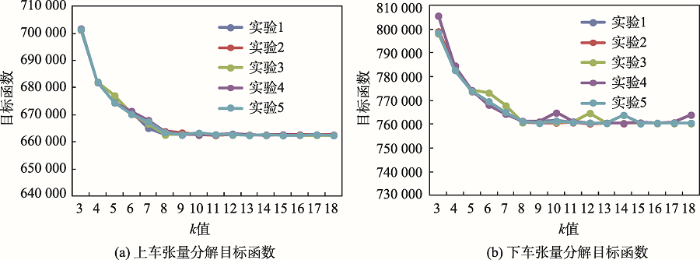
本文对张量X进行分解,求解核心张量G,因子矩阵:A区域模式矩阵、B时段模式矩阵和C日模式矩阵。在进行张量分解之前,需要确定张量分解的分解模数和稀疏约束参数。“时段”模数参考其它文献[4,18-19]和经验确定为4,即早高峰时段、日间时段、晚高峰时段以及夜间时段。“日”分解模数可以根据数据特点,即工作日和休息日确定为2。“区域”分解模数即为不同类别区域数量k,如果k过小致使不同类别区域冗杂在一起,如果k过大则会使同一类别区域分在不同的模式中;在同一组参数下 SN-TUCKER分解结果歧义性减少,但是仍然具有不唯一性。综上所述本实验对XO与XD选择k[3,18]分别进行五组张量分解实验,结果如图6所示,在[3,8]区间中,随着k值的增大,图6(a)和图6(b)中的目标函数呈下降趋势,在[8,18]区间中,目标函数趋于稳定,因此本实验选取k=8,此时目标函数基本达到[3,18]区间的最小值,且具有较强的可解释性,综上所述,本文的张量分解模数确定为8×4×2。经过实验发现,当对A和B进行稀疏约束,不对G和C进行稀疏约束,可获取张量分解理想结果。
本文使用出租车OD数据分别构造上车张量XO和下车张量XD,通过SN-TUCKER分解,将张量XO和XD分别分解为一个核心张量和3个因子矩阵: A∈$\mathbb{R}^{11 663\times 8}$、B∈$\mathbb{R}^{24\times 4}$和C∈$\mathbb{R}^{16\times 2}$的乘积形式,A、B、C可以被认为是每一特征维度的主成分,即空间维度、时段维度与日维度的主成分;因子矩阵的每一列分别代表特征空间的一种模式,即区域模式、时段模式与日模式;A每一行代表某一空间格网与对应的8种区域模式相关程度,B每一行代表每一时段与对应的4种时段模式相关程度,C每一行代表每一天与对应的2种日模式相关程度,模式值越大相关程度越大。下面分别对每个特征模式的结果进行分析。
4.3.1 日模式
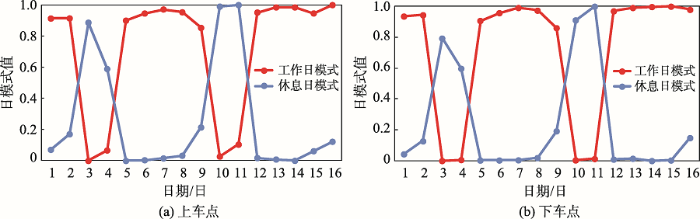
日维度的因子矩阵C∈$\mathbb{R}^{16\times 2}$有2种模式,如图7,其中2012-11-03(周六)、2012-11-04(周日)、2012-11-10(周六)和2012-11-11(周日)是休息日。图7(a)中,红线在休息日的模式值接近0,在工作日的模式值是高值且平稳状态,表明红线在工作日特征信息较明显;蓝线在休息日的模式值达到高峰,而在工作日模式值接近0,表明蓝线在休息日特征信息较明显,因此红线是工作日模式,蓝线是休息日模式。同理,图7(b)中,红线是工作日模式,蓝线是休息日模式。
4.3.2 时段模式
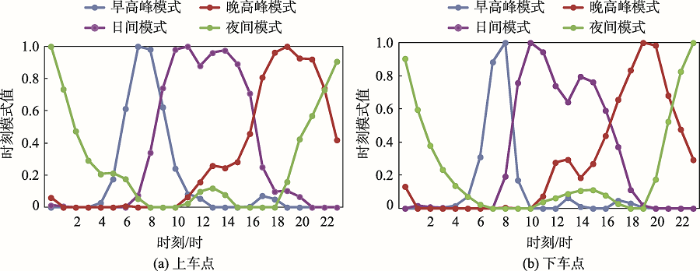
时段维度的因子矩阵B∈$\mathbb{R}^{24\times 4}$具有4种模式,如图8。图8(a)蓝线与图8(b)蓝线在时段7-8达到高峰期,因此图8蓝线对应早高峰模式。图8(a)紫线与图8(b)紫线在时段9-16期间达到高峰期,图 8(a)紫线在时段12存在低谷现象,图8(b)紫线在时段13存在低谷现象,低谷现象是由于人们处于午休时段,出租车需求略微下降,因此图8紫线对应日间模式。图8(a)红线与图8(b)红线在17-21时达到高峰状态,因此图8红线对应晚高峰时段。图 8(a)绿线与8(b)绿线在时段0附近达到高峰,因此图8绿线为夜间模式。
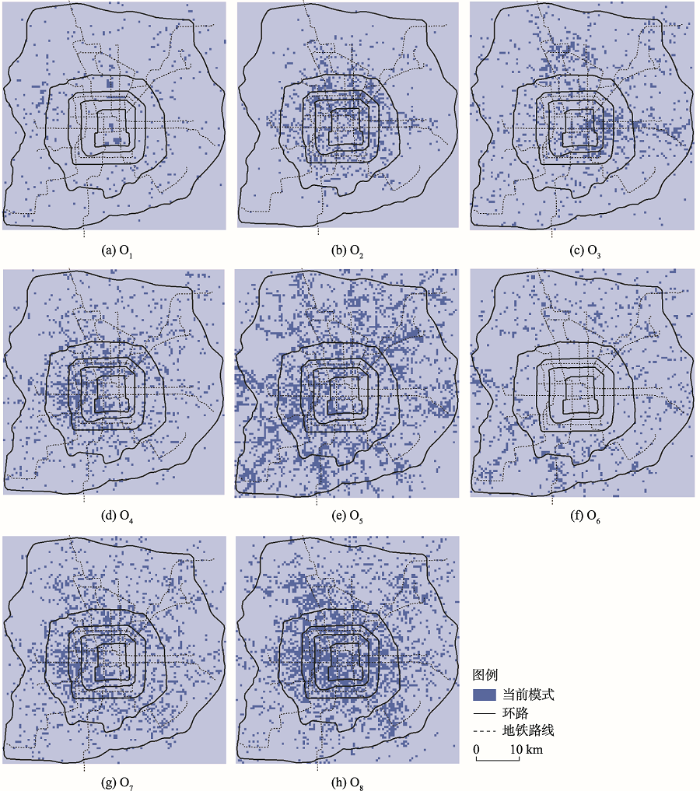
4.3.3 区域模式
张量分解结果中的因子矩阵A∈$\mathbb{R}^{11663\times 8}$,表示每个格网中对应的8种上下车模式,每个模式值表示对应的模式在该格网中的贡献值,该值与格网的上车量成正比,即格网上车量越大,贡献值越大。由于每个网格的上下车量本身存在很大差异,导致无法直接比较不同格网的模式值,因此本实验对因子矩阵A在行方向进行归一化处理,如式(3)所示。
式中:分子表示A第p行q列元素,分母表示第p行元素之和。
矩阵AO归一化后,得到矩阵
4.3.4 核心张量分析
通过张量分解得到的上下车时间模式,可以判断出租车用户的行为时间特征。结合核心张量,建立时间模式和区域模式的对应关系,可初步推断出租车用户的行为空间功能特征。核心张量Go∈$\mathbb{R}^{8\times 4\times 2}$与GD∈$\mathbb{R}^{8\times 4\times 2}$,如表2和表3,分别表示8种上车点/下车点模式、4个时段模式和2个日模式之间的联系强度。根据表2与表3可确定上车点和下车点之间的相互作用,建立同一个时段中活跃的上车点与下车点的映射关系(表4),从可而进一步判定上车点所在区域与下车点所在区域对应的功能。
表2 上车张量分解的核心张量
Tab. 2 The core tensor of Os
| 早高峰模式 | 日间模式 | 晚高峰模式 | 夜间模式 | |||||
|---|---|---|---|---|---|---|---|---|
| 工作日 | 休息日 | 工作日 | 休息日 | 工作日 | 休息日 | 工作日 | 休息日 | |
| O1 | 0.000 0 | 0.000 0 | 0.000 0 | 0.000 0 | 0.162 0 | 0.280 4 | 0.000 0 | 0.000 0 |
| O2 | 0.048 6 | 0.000 0 | 0.219 3 | 0.000 0 | 0.215 4 | 0.000 0 | 0.000 0 | 0.071 0 |
| O3 | 0.000 0 | 0.000 0 | 0.000 0 | 0.000 0 | 0.000 0 | 0.000 0 | 0.334 7 | 0.146 4 |
| O4 | 0.000 0 | 0.000 0 | 0.000 0 | 0.363 1 | 0.000 0 | 0.000 0 | 0.000 0 | 0.000 0 |
| O5 | 0.366 9 | 0.000 0 | 0.000 0 | 0.000 0 | 0.000 0 | 0.000 0 | 0.000 0 | 0.000 0 |
| O6 | 0.000 0 | 0.272 5 | 0.000 0 | 0.000 0 | 0.000 0 | 0.000 0 | 0.000 0 | 0.000 0 |
| O7 | 0.000 0 | 0.000 0 | 0.004 6 | 0.000 0 | 0.372 5 | 0.000 0 | 0.011 6 | 0.000 0 |
| O8 | 0.000 0 | 0.000 0 | 0.424 5 | 0.000 3 | 0.000 0 | 0.000 0 | 0.000 0 | 0.000 0 |
表3 下车张量分解的核心张量
Tab. 3 The core tensor of Ds
| 早高峰模式 | 日间模式 | 晚高峰模式 | 夜间模式 | |||||
|---|---|---|---|---|---|---|---|---|
| 工作日 | 休息日 | 工作日 | 休息日 | 工作日 | 休息日 | 工作日 | 休息日 | |
| D1 | 0.000 0 | 0.000 0 | 0.000 0 | 0.000 0 | 0.236 0 | 0.265 2 | 0.000 0 | 0.000 0 |
| D2 | 0.000 0 | 0.000 0 | 0.028 8 | 0.000 0 | 0.394 2 | 0.000 0 | 0.000 0 | 0.000 0 |
| D3 | 0.000 0 | 0.000 0 | 0.000 0 | 0.000 0 | 0.000 0 | 0.000 0 | 0.171 2 | 0.288 1 |
| D4 | 0.000 0 | 0.240 7 | 0.000 0 | 0.012 5 | 0.001 0 | 0.000 0 | 0.000 0 | 0.000 0 |
| D5 | 0.323 9 | 0.000 0 | 0.000 0 | 0.000 0 | 0.000 0 | 0.000 0 | 0.000 0 | 0.000 0 |
| D6 | 0.000 0 | 0.000 0 | 0.432 5 | 0.000 9 | 0.000 0 | 0.000 0 | 0.000 0 | 0.000 0 |
| D7 | 0.000 0 | 0.000 0 | 0.000 0 | 0.000 0 | 0.000 9 | 0.000 0 | 0.361 1 | 0.000 0 |
| D8 | 0.000 0 | 0.000 0 | 0.000 0 | 0.353 4 | 0.000 0 | 0.000 0 | 0.000 0 | 0.000 0 |
表4 区域模式交互
Tab. 4 Interaction between spatial patterns
| 工作日 | 休息日 | |||
|---|---|---|---|---|
| 时段 | O区域 | D区域 | O区域 | D区域 |
| 早高峰模式 | O5 | D5 | O6 | D4 |
| 日间模式 | O8、O2 | D6 | O4 | D8 |
| 晚高峰模式 | O7、O2、O1 | D2、D1 | O1 | D1 |
| 夜间模式 | O3 | D7、D3 | O3 | D3 |
工作日早高峰时段,O5与D5较活跃,该时段人们通常从居住区前往工作区,可以初步判断O5对应居住区,D5对应工作区。工作日日间时段,O8、O2与D6较活跃,O2在工作日晚高峰时段也较活跃,O2、O8与D6空间分布广泛,白天人流较大且活动范围较广,推测O2、O8与D6为餐饮购物、交通、景区、教育、医疗等多种功能混合区域。工作日晚高峰时段,O7、O2与O1上车数量较多,D2、D1下车数量较多,其中O7空间分布较广,推测O7为餐饮购物、交通、景区、教育、医疗等多种功能混合区域;O1在休息日晚高峰时段也较活跃,初步推测O1为景区或娱乐区(酒吧、KTV等夜生活场所);人们晚高峰时段通常是回家或者到达娱乐场所,初步判断D1、D2为居住区或娱乐区。工作日夜间时段,O3、D7与D3较活跃,夜间娱乐场所通常是出租车上下车的热点区域,居住地则会出现大量出租车下车现象,推测O3对应娱乐区,D3与D7为居住区或娱乐区。
休息日早高峰时段,O6与D4较活跃,休息日早晨人们活动起点通常是居住地,目的地为景区或者机场车站,推测O6为居住区,D4对应景区或者机场车站。休息日日间时段,O4与D8较活跃,白天人流较大且活动范围较广,推测O4与D8为餐饮购物、交通、景区、教育、医疗等多种功能混合区域。休息日晚高峰时段,O1与D1较活跃,上文可知O1为景区,D1为居住区/娱乐区混合区域。休息日夜间时段,O3与D3较活跃,上文可知O3为娱乐区, D3为居住区/娱乐区混合区域。
图9与图10中包含8种上车/下车空间模式分布,表明在不同时段,出租车用户到达不同的场所,进行不同的活动,揭示了出租车用户出行功能区的动态变化。
通过张量分解模型得出的时空模式可以初步探究出租车用户出行的目的,有些时段的出行行为目的明确,而有些时段则可能有多种出行目的,难以确切识别目的地的区域功能,因而,本文利用POI类型判断区域功能特征,进一步提高出租车用户出行功能区识别的准确性
4.4.1 区域模式功能特征
本文计算每种区域模式(图9与图10)下的POI频数密度值(Frequency Density,FD),计算公式见式(4),其中Ni, j表示第i种区域模式的第j类POI数量,Si表示第i种区域模式总面积。
为了消除不同POI类别数量级差异影响频数密度,对FD进行Min-max标准化,计算公式见式(5),其中FDmin与FDmax分别是同一类POI在8种区域模式中最小和最大频数密度。上车点区域模式与下车点区域模式POI归一化频数密度见表5-6。
表5 上车点区域模式的POI归一化频数密度
Tab. 5 The normalized frequency density of POIs in each spatial pattern of Os
| O1 | O2 | O3 | O4 | O5 | O6 | O7 | O8 | |
|---|---|---|---|---|---|---|---|---|
| 餐饮服务 | 0.000 0 | 0.992 9 | 1.000 0 | 0.463 2 | 0.600 9 | 0.250 6 | 0.373 9 | 0.478 0 |
| 购物服务 | 0.000 0 | 1.000 0 | 0.889 2 | 0.621 8 | 0.390 8 | 0.287 3 | 0.525 2 | 0.659 0 |
| 生活服务 | 0.000 0 | 1.000 0 | 0.487 3 | 0.560 8 | 0.487 8 | 0.317 8 | 0.452 9 | 0.518 6 |
| 体育休闲 | 0.000 0 | 1.000 0 | 0.833 8 | 0.572 7 | 0.240 6 | 0.064 0 | 0.433 2 | 0.589 8 |
| 医疗服务 | 0.000 0 | 1.000 0 | 0.476 2 | 0.375 2 | 0.630 4 | 0.308 7 | 0.542 0 | 0.599 7 |
| 住宿服务 | 0.000 0 | 1.000 0 | 0.775 8 | 0.544 9 | 0.292 9 | 0.135 1 | 0.427 7 | 0.541 1 |
| 风景名胜 | 0.682 3 | 1.000 0 | 0.758 5 | 0.474 9 | 0.199 3 | 0.000 0 | 0.469 7 | 0.660 0 |
| 住宅 | 0.000 0 | 1.000 0 | 0.396 4 | 0.345 7 | 0.746 6 | 0.435 3 | 0.573 3 | 0.616 4 |
| 政府机构 | 0.000 0 | 1.000 0 | 0.402 7 | 0.367 1 | 0.465 4 | 0.146 4 | 0.540 7 | 0.599 1 |
| 科教文化 | 0.000 0 | 1.000 0 | 0.343 1 | 0.331 0 | 0.630 2 | 0.077 1 | 0.466 5 | 0.571 9 |
| 交通设施 | 0.000 0 | 1.000 0 | 0.629 8 | 0.659 5 | 0.492 0 | 0.113 5 | 0.541 7 | 0.630 7 |
| 金融保险 | 0.000 0 | 1.000 0 | 0.819 4 | 0.607 5 | 0.332 7 | 0.120 7 | 0.499 9 | 0.670 0 |
| 公司企业 | 0.021 8 | 1.000 0 | 0.709 0 | 0.522 1 | 0.325 2 | 0.000 0 | 0.485 9 | 0.660 9 |
表6 下车点区域模式的POI归一化频数密度
Tab. 6 The normalized frequency density of POIs in each spatial pattern of Ds
| D1 | D2 | D3 | D4 | D5 | D6 | D7 | D8 | |
|---|---|---|---|---|---|---|---|---|
| 餐饮服务 | 0.956 5 | 0.852 8 | 0.297 4 | 0.000 0 | 0.591 8 | 1.000 0 | 0.665 8 | 0.717 7 |
| 购物服务 | 0.715 7 | 0.648 2 | 0.291 8 | 0.000 0 | 0.124 4 | 1.000 0 | 0.498 6 | 0.935 2 |
| 生活服务 | 1.000 0 | 0.897 9 | 0.307 3 | 0.037 6 | 0.000 0 | 0.803 9 | 0.679 0 | 0.528 0 |
| 体育休闲 | 0.819 4 | 0.798 4 | 0.017 7 | 0.000 0 | 0.209 9 | 1.000 0 | 0.735 5 | 0.798 5 |
| 医疗服务 | 0.987 0 | 0.877 2 | 0.266 7 | 0.000 0 | 0.135 9 | 1.000 0 | 0.698 8 | 0.623 1 |
| 住宿服务 | 0.725 1 | 0.663 8 | 0.132 4 | 0.000 0 | 0.012 1 | 1.000 0 | 0.459 7 | 0.511 4 |
| 风景名胜 | 0.178 1 | 0.122 0 | 0.000 0 | 0.204 4 | 0.293 5 | 1.000 0 | 0.009 6 | 0.715 5 |
| 住宅 | 1.000 0 | 0.906 4 | 0.469 7 | 0.000 0 | 0.098 3 | 0.841 3 | 0.510 6 | 0.508 2 |
| 政府机构 | 0.701 8 | 0.642 7 | 0.105 8 | 0.000 0 | 0.065 0 | 1.000 0 | 0.321 8 | 0.638 1 |
| 科教文化 | 0.623 9 | 0.551 5 | 0.119 0 | 0.000 0 | 0.034 9 | 1.000 0 | 0.362 2 | 0.804 5 |
| 交通设施 | 0.656 9 | 0.617 3 | 0.000 0 | 0.415 6 | 0.330 2 | 1.000 0 | 0.242 5 | 0.741 8 |
| 金融保险 | 0.493 3 | 0.448 7 | 0.047 5 | 0.000 0 | 0.086 2 | 1.000 0 | 0.227 5 | 0.976 7 |
| 公司企业 | 0.338 9 | 0.289 2 | 0.000 0 | 0.007 0 | 0.322 3 | 1.000 0 | 0.143 1 | 0.881 3 |
O1区域分布比例最高的POI是风景名胜,表明该区域主要为景区,排除了上文娱乐区推测;O2区域中每类POI的FDnor都很高,具备大量餐饮、购物、休闲、公司、住宿等服务,具备成熟商业区特征,包括多种功能;O3区域包含大量体育休闲、餐饮、购物、住宿等服务设施,说明该区域为娱乐区;O4、O7与O8具备丰富的餐饮购物、生活服务、体育休闲、住宿、交通设施服务,具备新兴商业区特征,包括各种功能;O5与O6区域具有大量住宅POI,且包含丰富的餐饮、生活、医疗、科教文化等基础设施,具有明显居住区特征。
D1、D2与D7区域具有大量住宅、科教文化、交通设施、餐饮购物等服务设施,同时体育休闲服务丰富,推测D1、D2与D7区域为居住区或娱乐区混合区域,与上文推测一致;D3空间区域住宅服务POI分布比例最高,同时配套一定数量的餐饮、购物、生活、医疗等基础服务,具备居住区的特征,排除了上文娱乐区推测;D4空间区域主要包括风景名胜,因此D4主要为景区;D5空间区域具有丰富的公司企业、餐饮和交通设施等服务,具备工作区的特征;D6区域中每类POI的FDnor都很高,具备大量餐饮、购物、休闲、公司、住宿等服务,具备成熟商业区特征,包括多种功能;D8具备丰富的餐饮购物、生活服务、体育休闲、住宿、交通设施服务,其FDnor值略低于D6,具备新兴商业区特征,包括各种功能。
在核心张量分析出租车用户上车点/下车点对应功能区基础上,结合城市POI数据进一步推测功能特征,二者结果大体一致,同时可进一步揭示出不同时段下的出租车用户出行区域功能特征。
4.4.2 功能区识别
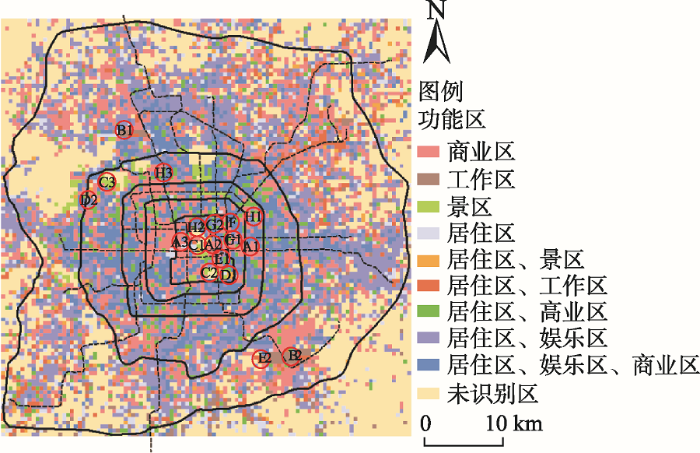
通过以上分析,可判断O5、O6、D3为居住区,O1、D4为景区,O3为娱乐区,D5为工作区,D1、D2和D7为居住区/娱乐区的混合区域,O2、O4、O7、O8、D6和D8为商业区。为进一步探索北京市六环整体功能,将每一个格网对应的O区域比例向量
图11是8种上车点区域模式和下车点区域模式对应城市功能区的叠加结果,即所有时间段内的出租车用户出行功能区的叠加。图9与图10中的空间模式对应功能区以单一功能区为主,而图11中的单一功能的格网区域数量远小于多功能的格网区域数量,表明一个区域往往不是静态的功能,而是随着社会人群的需求变化而变化。
本文根据北京出租车OD轨迹数据,基于城市人群在不同时间段进行不同活动,使用张量分解模型探究北京城市人群在时间上与空间上的出行规律。实验结果表明,利用张量分解得到的出租车OD数据时空模式,可以从不同维度的特征挖掘出出租车用户出行时空活动模式,从而识别不同时段中的出租车用户出行功能区。本文利用城市人群出行模式获取不同时段的城市功能区分布,并将不同时段的功能区进行叠加,获取所有时段中的综合功能区分布,其混合功能区数量大于每个时段的混合功能区数量,表明城市区域功能不是静止不变的,而是不同时段功能的组合。但是根据出租车OD数据识别的用户出行功能区有限,需结合POI或其它富含语义信息的数据,提高上下车点所在区域功能信息判断的准确性。
城市人群的出行不局限于出租车,因此出租车不能表示所有城市人群的出行信息,同时出租车上下车点局限于路网区域,即不能到达所有研究区域,因此出租车OD数据隐含的语义信息不能全面反映出城市所有功能区的时空分布。为了进一步识别出人群出行功能区,本文计划在出租车轨迹数据基础上,融合其它来源的数据,如社交媒体定位或文本数据,从而更加全面而准确识别城市人群出行功能区分布,挖掘出城市人群出行驱动机制。
The authors have declared that no competing interests exist.
| [1] |
Can visibility predict location? Visibility graph of food and drink facilities in the city [J].https://doi.org/10.1179/1752270613Y.0000000057 URL [本文引用: 1] 摘要
The spatial arrangement of socio-economic facilities in the city is shaped by the interaction of many individuals in the context of a particular physical structure. The urban physical environment displays characteristics of networks (graphs) where nodes and edges are embedded in space. For decades, the analysis of urban network structure represents an attractive model for describing urban phenomena. This paper presents novel means of understanding how socio-economic activities are distributed in urban environment, what forces influence their spatial patterns and how urban structure and functions are mutually dependent. We investigate the functional aspect of urban spatial networks; specifically we study the spatial distribution of food and drink public facilities in the historical district of Tel Aviv-Yafo Israel. These places, caf0108s, coffee shops, restaurants and others are known as 090004third place090005 in urban sociology and play an important role in establishing a sense of place. We propose a novel graph analytic framework in which the third places are incorporated by means of visual accessibility. The development of this framework emerged from the concept of Integrative Visibility Graph (IVG), a quantitative method, based on visibility analysis of urban structure and its functioning. Several centrality measures from complex network theory are applied to the proposed graphs in order to evaluate structural position of third place locations in the urban network. Our findings illustrate a strong correlation between street centrality values and third place distribution.
|
| [2] |
Understanding intra-urban trip patterns from taxi trajectory data [J].https://doi.org/10.1007/s10109-012-0166-z URL [本文引用: 2] |
| [3] |
The scaling of human mobility by taxis is exponential [J].https://doi.org/10.1016/j.physa.2011.11.035 URL [本文引用: 2] 摘要
78 We analyze the trajectories of more than 10 thousand taxis in Beijing. 78 The taxis’ traveling displacements tend to follow an exponential distribution. 78 The elapsed time can also be well approximated by an exponential distribution. 78 The human mobility has characteristic of bursts through analyzing interevent time.
|
| [4] |
Exploring human movements in Singapore: A comparative analysis based on mobile phone and taxicab usages [C]. |
| [5] |
Collective human mobility pattern from taxi trips in urban area [J].https://doi.org/10.1371/journal.pone.0034487 URL PMID: 3329492 [本文引用: 1] 摘要
Abstract We analyze the passengers' traffic pattern for 1.58 million taxi trips of Shanghai, China. By employing the non-negative matrix factorization and optimization methods, we find that, people travel on workdays mainly for three purposes: commuting between home and workplace, traveling from workplace to workplace, and others such as leisure activities. Therefore, traffic flow in one area or between any pair of locations can be approximated by a linear combination of three basis flows, corresponding to the three purposes respectively. We name the coefficients in the linear combination as traffic powers, each of which indicates the strength of each basis flow. The traffic powers on different days are typically different even for the same location, due to the uncertainty of the human motion. Therefore, we provide a probability distribution function for the relative deviation of the traffic power. This distribution function is in terms of a series of functions for normalized binomial distributions. It can be well explained by statistical theories and is verified by empirical data. These findings are applicable in predicting the road traffic, tracing the traffic pattern and diagnosing the traffic related abnormal events. These results can also be used to infer land uses of urban area quite parsimoniously.
|
| [6] |
基于时间序列聚类方法分析北京出租车出行量的时空特征 [J].https://doi.org/10.3724/SP.J.1047.2016.01227 URL Magsci [本文引用: 1] 摘要
<p>受城市资源配置、区域功能分化的影响,城市中居民的出行往往呈现出特定的模式和规律,而这种出行模式的背后反映出城市的功能结构。城市车辆GPS导航的广泛使用,以及车辆轨迹数据的大量获取,为分析城市居民出行模式及理解城市功能结构提供了数据支撑。本文以道路分割城市得到的地块为研究单元,利用北京市一个月的出租车轨迹数据,对北京居民的出行模式及城市功能格局进行分析。在轨迹数据分析中,本文从轨迹数据中提取每个地块的出行量时间序列信息,然后采用结合时间序列距离度量和时间序列自身相关性的聚类方法,对出行量时间序列数据进行聚类分析,从而研究乘客出行的时空分布特征,最后结合北京市POI数据,探讨了不同区域乘客出行规律和区域功能类型的相互关系。结果表明,出租车出行量时间序列模式在工作日和周末间存在明显差异。此外,工作日的2个出行高峰与通常的通勤早晚高峰不同。由出行量所得的区域聚类结构,除具有重要交通枢纽功能的地块外,总体上以市中心为圆心大致呈同心圆分布,且距离市中心越远出行量越小。研究结果对于分析北京市居民出行行为、辅助城市交通规划具有一定的意义。</p>
Analyzing the spatio-temporal characteristics of Beijing's OD trip volume based on time series clustering method [J].https://doi.org/10.3724/SP.J.1047.2016.01227 URL Magsci [本文引用: 1] 摘要
<p>受城市资源配置、区域功能分化的影响,城市中居民的出行往往呈现出特定的模式和规律,而这种出行模式的背后反映出城市的功能结构。城市车辆GPS导航的广泛使用,以及车辆轨迹数据的大量获取,为分析城市居民出行模式及理解城市功能结构提供了数据支撑。本文以道路分割城市得到的地块为研究单元,利用北京市一个月的出租车轨迹数据,对北京居民的出行模式及城市功能格局进行分析。在轨迹数据分析中,本文从轨迹数据中提取每个地块的出行量时间序列信息,然后采用结合时间序列距离度量和时间序列自身相关性的聚类方法,对出行量时间序列数据进行聚类分析,从而研究乘客出行的时空分布特征,最后结合北京市POI数据,探讨了不同区域乘客出行规律和区域功能类型的相互关系。结果表明,出租车出行量时间序列模式在工作日和周末间存在明显差异。此外,工作日的2个出行高峰与通常的通勤早晚高峰不同。由出行量所得的区域聚类结构,除具有重要交通枢纽功能的地块外,总体上以市中心为圆心大致呈同心圆分布,且距离市中心越远出行量越小。研究结果对于分析北京市居民出行行为、辅助城市交通规划具有一定的意义。</p>
|
| [7] |
Visualizing hot spot analysis result based on mashup [C]. |
| [8] |
Understanding operation behaviors of taxicabs in cities by matrix factorization [J].https://doi.org/10.1016/j.compenvurbsys.2016.08.002 URL [本文引用: 1] 摘要
61Detecting cabdrivers’ self-organized habitual operation behaviors in space61Comparing performances of taxicabs with distinct spatial operation behaviors61Developing a matrix factorization based analytical framework to quantify, visualize and evaluate taxicabs' habitual operation behavior patterns in space
|
| [9] |
Urban mobility landscape: real time monitoring of urban mobility patterns [C]. |
| [10] |
Urban computing with taxicabs [C]. |
| [11] |
Exploratory calibration of a retail location model using search by golden section [J]. |
| [12] |
基于居民出行特征的北京城市功能区识别与空间交互研究 [J].Identification and spatial interaction of urban functional regions in Beijing based on the characteristics of residents' traveling [J]. |
| [13] |
Discovering regions of different functions in a city using human mobility and POIs [C]. |
| [14] |
Tensor decompositions and applications [J].https://doi.org/10.1137/07070111X URL [本文引用: 2] |
| [15] |
交通流网络的时空特征解析-基于张量分解方法视角 [J].https://doi.org/10.13249/j.cnki.sgs.2016.11.010 URL Magsci [本文引用: 1] 摘要
<p>基于非负张量分解方法(NTF方法),依托 2004年1月至2012年12月江苏省高速公路网络的三维OD海量交通流数据,展开网络时空特征的解析、提取与挖掘,尝试解决现有数据分析方法无法有效解析交通流网络时空演化的动态性与多维性问题。结果表明:<i>① </i>重构网络对原始网络的空间构型与格局具有很好的重现能力,基本刻画了原始网络的倒“不”字型空间结构;<i>② </i>分解的网络可提取出基本不变型、渐变型和突变型3类时变规律,且每类时间特征有各自耦合对应的局部空间格局,体现内在组织的时空统一性;<i>③ </i>倒“不”字型空间结构由分解的沿沪宁线横向子网络叠加过润扬大桥沿扬溧线、过江阴大桥沿京沪线和过苏通大桥沿沈海线的三大纵向子网络等具有明确地理含义的多个局部空间系统共同构成,体现全局由局部组成的特性。</p>
Traffic flow network spatial-temporal characteristics analysis: Basis on the tensor decomposition method perspective [J].https://doi.org/10.13249/j.cnki.sgs.2016.11.010 URL Magsci [本文引用: 1] 摘要
<p>基于非负张量分解方法(NTF方法),依托 2004年1月至2012年12月江苏省高速公路网络的三维OD海量交通流数据,展开网络时空特征的解析、提取与挖掘,尝试解决现有数据分析方法无法有效解析交通流网络时空演化的动态性与多维性问题。结果表明:<i>① </i>重构网络对原始网络的空间构型与格局具有很好的重现能力,基本刻画了原始网络的倒“不”字型空间结构;<i>② </i>分解的网络可提取出基本不变型、渐变型和突变型3类时变规律,且每类时间特征有各自耦合对应的局部空间格局,体现内在组织的时空统一性;<i>③ </i>倒“不”字型空间结构由分解的沿沪宁线横向子网络叠加过润扬大桥沿扬溧线、过江阴大桥沿京沪线和过苏通大桥沿沈海线的三大纵向子网络等具有明确地理含义的多个局部空间系统共同构成,体现全局由局部组成的特性。</p>
|
| [16] |
Travel time estimation of a path using sparse trajectories [C]. |
| [17] |
Tensor based missing traffic data completion with spatial-temporal correlation [J].https://doi.org/10.1016/j.physa.2015.09.105 URL [本文引用: 1] 摘要
Missing and suspicious traffic data is a major problem for intelligent transportation system, which adversely affects a diverse variety of transportation applications. Several missing traffic data imputation methods had been proposed in the last decade. It is still an open problem of how to make full use of spatial information from upstream/downstream detectors to improve imputing performance. In this paper, a tensor based method considering the full spatial emporal information of traffic flow, is proposed to fuse the traffic flow data from multiple detecting locations. The traffic flow data is reconstructed in a 4-way tensor pattern, and the low-n-rank tensor completion algorithm is applied to impute missing data. This novel approach not only fully utilizes the spatial information from neighboring locations, but also can impute missing data in different locations under a unified framework. Experiments demonstrate that the proposed method achieves a better imputation performance than the method without spatial information. The experimental results show that the proposed method can address the extreme case where the data of a long period of one or several weeks are completely missing.
|
| [18] |
Understanding urban mobility patterns with a probabilistic tensor factorization framework [J].https://doi.org/10.1016/j.trb.2016.06.011 URL [本文引用: 2] 摘要
The rapid developments of ubiquitous mobile computing provide planners and researchers with new opportunities to understand and build smart cities by mining the massive spatial-temporal mobility data. However, given the increasing complexity and volume of the emerging mobility datasets, it also becomes challenging to build novel analytical framework that is capable of understanding the structural properties and critical features. In this paper, we introduce an analytical framework to deal with high-dimensional human mobility data. To this end, we formulate mobility data in a probabilistic setting and consider each record a multivariate observation sampled from an underlying distribution. In order to characterize this distribution, we use a multi-way probabilistic factorization model based on the concept of tensor decomposition and probabilistic latent semantic analysis (PLSA). The model provides us with a flexible approach to understand multi-way mobility involving higher-order interactions hich are difficult to characterize with conventional approaches sing simple latent structures. The model can be efficiently estimated using the expectation maximization (EM) algorithm. As a numerical example, this model is applied on a four-way dataset recording 14 million public transport journeys extracted from smart card transactions in Singapore. This framework can shed light on the modeling of urban structure by understanding mobility flows in both spatial and temporal dimensions.
|
| [19] |
Discovering urban spatio-temporal structure from time-evolving traffic networks [C]. |
| [20] |
Urban land uses and traffic “source-sink areas”: Evidence from GPS-enabled taxi data in Shanghai [J].https://doi.org/10.1016/j.landurbplan.2012.02.012 URL [本文引用: 1] 摘要
Most of the existing literature focuses on estimating traffic or explaining trip lengths from land use. This research attempts to reveal intraurban land use variations from traffic patterns. Using a seven-day taxi trajectory data set collected in Shanghai, we investigate the temporal variations of both pick-ups and drop-offs, and their association with different land use features. Based on the balance between the numbers of drop-offs and pick-ups and its distinctive temporal patterns, the study area is classified into six traffic ‘source-sink’ areas. These areas are closely associated with various land use types (commercial, industrial, residential, institutional and recreational) as well as land use intensity. The study shows that human mobility data from location aware devices provide us an opportunity to derive urban land use information in a timely fashion, and help urban planners and policy makers in mitigating traffic, planning for public services and resources, and other purposes.
|
| [21] |
A new insight into land use classification based on aggregated mobile phone data [J].https://doi.org/10.1080/13658816.2014.913794 URL [本文引用: 1] 摘要
Land-use classification is essential for urban planning. Urban land-use types can be differentiated either by their physical characteristics (such as reflectivity and texture) or social functions. Remote sensing techniques have been recognized as a vital method for urban land-use classification because of their ability to capture the physical characteristics of land use. Although significant progress has been achieved in remote sensing methods designed for urban land-use classification, most techniques focus on physical characteristics, whereas knowledge of social functions is not adequately used. Owing to the wide usage of mobile phones, the activities of residents, which can be retrieved from the mobile phone data, can be determined in order to indicate the social function of land use. This could bring about the opportunity to derive land-use information from mobile phone data. To verify the application of this new data source to urban land-use classification, we first construct a vector of aggregated mobile phone data to characterize land-use types. This vector is composed of two aspects: the normalized hourly call volume and the total call volume. A semi-supervised fuzzy c-means clustering approach is then applied to infer the land-use types. The method is validated using mobile phone data collected in Singapore. Land use is determined with a detection rate of 58.03%. An analysis of the land-use classification results shows that the detection rate decreases as the heterogeneity of land use increases, and increases as the density of cell phone towers increases.
|
| [22] |
Sparse higher order non-negative matrix factorization [J]. |

/
| 〈 |
|
〉 |


