周振超 , 李贺, 刘庆生
ZHOU Zhenchao, LI He, LIU Qingsheng
通讯作者:
收稿日期: 2018-05-16
修回日期: 2018-09-14
网络出版日期: 2018-11-20
版权声明: 2018 《地球信息科学学报》编辑部 《地球信息科学学报》编辑部 所有
基金资助:
作者简介:
作者简介:周振超(1992-),女,硕士生,主要从事林业遥感研究。E-mail: 657492111@qq.com
展开
摘要
红树林动态是地理学、生态学和湿地学等学科关注的热点之一。遥感技术具有宏观性、高效性和经济性等特点,在红树林动态监测中发挥日益重要的作用。本文通过关键词对Web of Science和中国知网2个数据库自2000年以来发表的文章进行梳理和归纳,从研究区域分布、文献数量、遥感监测数据源与方法、全球红树林动态以及全国红树林动态变化分析5个方面总结了近20年来国内外对于红树林遥感动态监测研究进展。研究结果表明,多传感器高时空分辨率数据将成为红树林遥感动态监测的重要数据源。将雷达数据和光学遥感数据进行融合,有助于进一步提升红树林卫星遥感监测能力。无人机平台搭载多种类型的传感器(如多光谱、高光谱或激光雷达传感器),可以从不同方面获取红树林生态系统参数,结合遥感智能分析算法,有助于推动红树林遥感研究向纵深方向发展。红树林遥感动态监测相关研究表明,全球红树林总面积范围大致在1.1×10⁸ ~2.4×10⁸ hm2,总体仍呈减少趋势,而在区域上中国红树林面积则有所恢复。本文最后对红树林遥感动态监测的发展趋势进行了展望。
关键词:
Abstract
:Mangrove dynamics is one of the hotspots of geography, ecology and wetland science. Remote sensing technology is characterized by macroscopicity, high efficiency and economy, and plays an increasingly important role in the dynamic monitoring of mangroves. This paper searches and summarizes the articles published by Web of Science and China Knowledge Network from 2000 on the basis of keywords, from research area distribution, number of documents, remote sensing data sources and methods, global mangrove dynamics and national red The five aspects of dynamic change analysis of forests summarize the research progress on dynamic monitoring of mangrove remote sensing in the past 20 years. The research results show that multi-sensor high spatial and temporal resolution data will become an important data source for mangrove remote sensing dynamic monitoring. The fusion of radar data and optical remote sensing data will help to further enhance the mangrove satellite remote sensing monitoring capability. The UAV platform is equipped with various types of sensors (such as multi-spectral, hyperspectral or lidar sensors), which can obtain mangrove ecosystem parameters from different aspects. Combined with remote sensing intelligent analysis algorithms, it helps mangrove remote sensing research in the depth direction. development of. The total area of mangrove forests monitored by mangrove remote sensing is roughly 11 million to 24 million hectares , and the overall trend is still decreasing. In the region, the area of mangroves in China has recovered. At the end of this paper, the development trend of mangrove remote sensing dynamic monitoring is prospected.
Keywords:
红树林受周期性涨落潮的影响,以常绿灌木或者乔木组成的耐盐木本植物群落[1,2,3,4],是同时拥有陆地和海洋特征的复杂生态系统。红树林具有多方面的生态系统服务功能,如防风搏浪、固岸护堤、净化海水、保护耕地、防止侵蚀等[5]功能,对维护和改善海湾、河口地区生态环境具有不可替代的作用[6,7]。但是受全球气候变化以及海洋环境污染等多方面的影响,红树林生长环境遭到严重破坏[8],而大量的围海造田、滩涂养殖、工业建设等人类开发利用更是导致大面积红树林被砍伐[9,10,11,12,13],面积急剧减少[14,15,16]。20世纪50年代以来,在自然因素和人为干扰的双因素作用下,红树林遭受了严重破坏[17],全球红树林面积减少35%左右。红树林资源的保护成为国际上湿地保护和生物多样性保护的重要对象[11,18],因此加强红树林保护、遏制红树林面积减少趋势已经迫在眉睫。
红树林资源调查和动态监测是红树林科学保护与管理的基础和前提,也是加强海洋生态系统的恢复机理与技术研究的重要步骤[19,20]。但红树林生长在地势开阔平坦的潮间带浅滩,传统的实地调查存在费时、费力、观测尺度小等问题[21,22,23]。与现场调查相比,遥感技术在红树林监测方面具有省时、省力、观测范围广、信息获取快等优势[24,25,26,27,28,29,30],已成为现今红树林监测和管理不可或缺的手段[1,5]。尤其是近年来,不同平台传感器技术的快速发展和广泛应用,红树林遥感数据源更为多样,相关研究日益增多,研究方法也不断深化[31,32,33,34,35,36,37,38,39]。系统性梳理和归纳当前红树林遥感动态监测研究进展,有助于及时掌握国内外研究前沿,理清技术发展脉络,探究今后研究趋势与方向。鉴于此,本研究在参阅2000年以来红树林遥感相关文献、调查报告、专著等的基础上,系统总结了红树林遥感动态监测的国内外应用进展,探讨了基于不同传感器红树林遥感提取方法的应用现状,以期为后续红树林遥感研究探明方向。
本文首先通过“Remote Sensing(遥感)”和“Mangrove(红树林)”2个关键词对Web of Science和中国知网2个数据库自2000年以来发表的文章进行搜索;进一步,利用“土地覆盖”和“湿地”为关键词,并在全文里加“红树林”为索引进一步扩大搜索范围。通过对上述文献及相关专著进行系统梳理和归纳,整理了从2000-2017年以来涉及红树林的文献共703篇,其中关于红树林遥感动态监测的文献是227篇。此外,还对一些主要的红树林专项调查报告、专著进行了参阅,如中国近海海洋综合调查与评价"专项(908专项)调查[17],全国红树林资源报告[12]等,更加详细地了解红树林研究进展。
通过对227篇文献进行研究,其中Web of Science数据库中的文献数量是153篇,载文比较多的期刊有ISPRS Journal of Photogrammetry and Remote Sensing、Remote Sensing、Estuarine Coastal and Shelf Science、Wetlands Ecology and Management等[30-31,34,38,40-43],其中 ISPRS Journal of Photogrammetry and Remote Sensing 和 Remote Sensing期刊的文章数量最多。中国知网数据库中的文献数量是50多篇,研究文献多发表在遥感、生态、湿地、林业等研究方向的期刊上,其中生态学报和湿地科学载文较多。其他载文较多的还包括海岸、热带生物、测绘等类型的期刊,说明随着对红树林生态系统重要性认识的不断深入,更多领域的学者也开始关注红树林研究,相关研究向多样化、学科交叉方向发展。
通过对Web of Science数据库中的文献作者进行统计(图1),可以发现红树林遥感动态监测的研究学者广泛分布于各个大洲,其中亚洲学者主要涉及7个国家,最多的是中国和印度(图1)。北美洲以美国的研究人数最多。总体看,学者呈现不断增长的趋势。由图2可以得知,从2007年开始,文献数量增加,但在2012年有所下降,之后一直呈增长趋势[32,45]。
图1 国内外对红树林遥感动态监测的研究者分布
Fig. 1 Researchers' distribution of remote sensing dynamic monitoring of mangrove in China and Abroad
图2 基于Web of Science的各个年份研究数量
Fig. 2 Number of studies in each year based on Web of Science
随着遥感和对地观测技术的发展,越来越多的遥感平台、传感器和分类方法运用到红树林遥感动态监测当中。本文从中、高分辨率多光谱数据、高光谱数据、雷达等不同数据源角度,总结常用的红树林提取方法以及它们的应用范围、优势和不足。
红树林遥感监测中最常用的中分辨率光学遥感数据源包括Landsat MSS/TM/ETM+/OLI[33,46-48]、SPOT HRV/HRG[49,50]等,对应的红树林遥感信息提取方法包括目视解译、最大似然法、面向对象分类法、支持向量机方法等。目视解译方法主要是利用研究者的遥感专业知识及经验,根据遥感图像上红树林及周围的影像特征以及影像上目标的空间组合关系等,经推理、分析来识别红树林。这种方法具有较高的精度,但费时费力[51]。Giri等[49]使用Landsat卫星数据绘制了南亚红树林目前的范围,并确定了2000-2012年的红树林覆盖变化[52]。 Hamilton等[53]合成了全球森林变化数据库,世界陆地生态系统数据库和世界红树林数据库,利用新数据库监测全球,国家和保护区范围内的红树林覆盖,结果显示红树林损失相对较多的国家包括缅甸、马来西亚、柬埔寨、印度尼西亚和危地马拉。印度尼西亚仍是迄今为止最大的红树林国家,占全球红树林库存的26%~29%,每年的森林砍伐率在0.26%~0.66%之间。红树林遥感自动分类方法以最大似然法和面向对象方法最为常见,最大似然法建立在像元的统计特征基础上,考虑了不同类别间的方差和协方差矩阵,具有较高的分类精度[54]。但是它所利用的地物形状、几何信息非常少,当光谱信息相似时,易与周围地物类型相混淆。面向对象的信息提取技术一方面利用红树林的光谱特征,同时将红树林斑块的形状、纹理及结构等信息考虑在内,使得分割后形成若干互不交叠的相对均匀的非空子区域,因而在一定程度上降低了周围相似地类的干扰[55]。Jia等[56]基于Landsat影像,运用面向对象的分类对1973-2010年中国广西省红树林和周边土地覆盖的动态进行分析,结果显示红树林面积正在减少,面向对象的分类方法适合小区域的红树林信息提取。章恒等[36]利用Landsat8、SPOT5和高分一号影像对海南东北部的东寨港地区的红树林进行监测,结果显示用最大似然法和支持向量机提取红树林信息的精度相似,但面向对象方法改善了基于像元分类中斑块破碎的现象,提取红树林边界更加清楚,影像的特征光谱信息量相关性较强[7]。Chen等[42]利用Lansat7/8 and Sentinel-1A影像在GEE平台的基础上,分析中国红树林的分布情况,结果显示2015年,中国红树林总面积为2.0303× 10⁸ hm2,其中约92%位于广西壮族自治区、广东省和海南省[42]。
综上,中分辨率影像以其易于访问或订购、数据获取时间序列长(2009年以后,Landsat系列卫星全部存档数据都免费公开)和视场范围大等优 点[57,58],自2000年以来,被广泛应用到红树林遥感动态监测中。但是,光学传感器易受天气状态的影响,这也为提取红树林遥感信息提取带来困难。
随着遥感传感器技术的不断进步,空间分辨率进一步提升,高分辨率数据源越来越多地应用于红树林遥感动态监测。主要用到的高分辨率(空间分辨率优于10 m)遥感数据源包括IKONOS、Quick-Bird、RapidEye、GeoEye-1、WorldView-2[59,60,61,62,63,64,65]等 (表1)。常用的方法包括目视解译、最大似然法、支持向量机、面向对象方法等。Guebas等[66]利用IKONOS影像,结合ISODATA算法和目视解译方法对斯里兰卡地区的红树林进行提取,结果显示目视解译结合地面调查信息,可以更好提取红树林遥感信息。Otero等[60]利用QuickBird和GeoEye数据,运用最大似然法,对西非毛里塔尼亚最北端的红树林进行了监测,结果表明,与神经网络技术相比,最大似然算法可以获得更好的分类结果。Jia等[67]利用EO-1 HYPERION传感器的高光谱数据和SPOT-5 高分辨率数据分析米埔沼泽自然保护区的红树林,结果显示2个地区面积分别为196.8 hm2和110.8 hm2。Suwanprasit等[50]基于QuickBird和IKONOS数据,利用NDVI、MSAVI、PVI、RDVI、RVI、SAVI和 TNDVI 7种植被指数来识别红树林,结果显示NDVI的精度是最高的。基于高分遥感数据的红树林信息提取方法以面向对象分类法最为常见,面向对象的分类方法不再以像元为基本分类单元,而是以对象为分类的最小单位,减少了红树林语义信息的损失[30,36]。此外,面向对象的分类方法可以充分利用高分辨率光学数据丰富的图像结构、几何、纹理等信息,以提高红树林信息提取精度[55,68]。但是,基于面向对象的分类方法也存在一定的不足,例如影像分类的智能化、自动化程度低,影像分割尺度缺乏统一标准,不同尺度的分割往往产生不同精度。
表1 红树林遥感动态监测运用的光学传感器和方法
Tab. 1 Overview of optical sensors and methods for dynamic monitoring mangrove remote sensing information
| 数据源 | 卫星传感器 | 目视解译 | 基于像元的分类法 | 智能化分类方法 | 面向对象 分类法 | 综合 提取法 | ||||
|---|---|---|---|---|---|---|---|---|---|---|
| 波段 组合法 | 像元 分解法 | 专家 决策树 | 人工神经 网络 | 支持 向量机 | 随机 森林 | |||||
| 中分辨率 影像 | Landsat MSS | 6 | 2 | 5 | 1 | 1 | 4 | 3 | ||
| Landsat-5 TM | 8 | 6 | 21 | 5 | 2 | 1 | 1 | 10 | 4 | |
| Landsat-7 ETM+ | 5 | 4 | 12 | 3 | 2 | 1 | 6 | 3 | ||
| Landsat-8 OLI | 5 | 9 | 2 | 4 | 1 | 6 | 2 | |||
| SPOT2-4 | 6 | 1 | 5 | 1 | 2 | |||||
| Sential-2 | 1 | 1 | ||||||||
| THEOS | 1 | 1 | 1 | |||||||
| SPOT5 | 4 | 3 | 3 | 2 | 2 | |||||
| IRS 1C/1D LISS III/IV | 2 | 1 | 1 | 1 | 1 | |||||
| ASTER | 1 | |||||||||
| 高分辨率 影像 | RapidEye | 2 | 1 | 1 | ||||||
| IKONOS | 1 | 4 | 1 | 1 | ||||||
| QuickBird | 5 | 2 | 1 | 1 | ||||||
| Worldview | 3 | 1 | 3 | 1 | 2 | 1 | 1 | |||
| GeoEye | 1 | 5 | 2 | 2 | 2 | |||||
| 航空摄影 | CIR videography/photography | 1 | 1 | 1 | 3 | 2 2 | 1 1 | |||
高光谱数据具有可见光、近红外、短波红外、热红外波段等多而很窄的连续的光谱波段,为提取红树林遥感信息提供了更为丰富的光谱信息[69]。常用的高光谱数据有ASIA+[70]、CASI[71]和EO-1 Hyperion[72]等(表2)。对于高光谱传感器,红树林遥感信息提取主要方法包括最大似然法、人工神经网络、支持向量机和专家决策树等方法。Kumar等[72]基于高光谱数据ASIA+的214个波段,对德克萨斯州的2个研究地点,测试了4种分类算法,包括最小距离法、马氏距离、最大似然法和波谱角填图分类法(SAM),结果显示马氏距离和最大似然法的精度明显优于最小距离法和SAM。综合前人研究,高光谱数据提供了许多非常窄的连续波段,具有丰富的空间、辐射和光谱信息,可以获得图像中每个像元的连续光谱数据,反映红树林更加精细光谱差异[73],然而相对于中、高分辨率光学传感器,高光谱传感器类型少,获得的数据波段多、波带窄,数据量大,数据输出率高、信息冗余较大、处理复杂。因此,高光谱数据在红树林遥感动态监测方面应用仍存在一定的局限性。
表2 红树林遥感动态监测运用高光谱数据和方法
Tab. 2 Overview of hyperspectral data and methods for extracting mangrove remote sensing information
| 数据源 | 卫星传感器 | 目视解译 | 基于像元的分类法 | 智能化分类方法 | 面向对象 分类法 | 综合 提取法 | ||||
|---|---|---|---|---|---|---|---|---|---|---|
| 波段 组合法 | 像元 分解法 | 专家 决策树 | 人工神经 网络 | 支持 向量机 | 随机 森林 | |||||
| 机载 | AISA+ | 2 | 1 | |||||||
| CASI | 1 | 1 | ||||||||
| 星载 | EO-1 Hyperion | 2 | 2 | 3 | 1 | 1 | ||||
虽然光学传感器是目前红树林遥感动态监测的主要传感器,但光学传感器易受天气状况的影响。与之相比,雷达传感器具有全天时全天候而且不受云、雾和雨影响的优势[72,74],所以雷达传感器一直是红树林遥感动态监测研究的重要组成部分。其中应用于红树林监测中的主要雷达传感器有ALOS、JERS- 1 、 Envisat ASAR 、 Radarsat-1 SAR 和Sential-1A SAR等[73,74,75,76,77](表2)。这些数据可以单独使用或与传统的光学遥感数据结合使用。Thomas等[44]利用JERS-1 SAR和ALOS PALSAR数据对1996-2010年全球9个地区的红树林进行监测,红树林提取的分类精度均高于90%。Singh等[78]基于JERS-1(L波段 HH极化)和ERS-1(C波段 VV极化)数据,运用专家决策树方法,对加蓬西部地区红树林动态进行了监测,结果显示,采用这2个数据的组合,相对于单波段数据,在红树林分类精度上提高了18%。Bui等[74]利用Landsat和ALOS数据,提取了越南地区的土地分类图,其中红树林面积被大部分的虾池塘所占领,导致面积减少。雷达传感器弥补了光学影像在云、雨、雾等天气受限的不足,具有一定的穿透能力,能够获得稳定的周期性影像,因此在红树林遥感监测中具有独特优势。但相对于光学影像而言,雷达本身受噪声影响严重,信息较弱,重访周期长,且数据成本较高。随着星载雷达传感器的发展,运用全极化/简缩极化雷达能够获得较多的遥感信息,在今后红树林动态监测中将会得到更广泛地应用。
近年来,无人机平台遥感技术快速发展,在红树林遥感动态监测中也逐渐开展[79,80]。Otero等[61]利用低空无人机对马来西亚地区的红树林保护区进行监测,结果表明使用无人机获得的数据可以为当地管理层创造有价值的信息和提供指导方针,特别是在发生木材采掘的地区。Cao等[40]基于无人机高光谱数据,利用最邻近法和支持向量机2种分类法对广东珠海淇澳-担杆岛省级自然保护区的红树林进行分类,总体精度分别为76.12%和82.39%。冯家莉等[82]通过无人机航拍得到英罗港港湾影像,利用最邻近法进行研究,结果表明红树林物种的总体分类精度达92%,Kappa系数为0.887。
与传统的遥感技术相比,无人机有诸多优势:① 高空间分辨率。无人机可以从地面之上几米到几百米高处获取厘米级分辨率的影像,可在物种尺度上对红树林进行监测。② 经济高效。红树林分布在沿海岸线狭长地带,导致单景影像中只有极少部分数据被利用;而红树林空间分布零散的特点也使得对于大区域红树林资源进行监测所需的遥感数据多,费用高。无人机平台通常设备体积小、轻便、移动性高,在运输、保管上节省费用,同时,可以针对红树林区域精准成像,大大降低了费用。③ 多次重复成像。传统卫星平台受重访周期限制,成像时间不易调整,同时卫星平台的光学传感器容易受云、雾、雨等恶劣天气的影响[83],大大降低了数据获取的可能性。而低空无人机平台可根据需要随时成像,而且受天气影响程度也较小,可在第一时间获取红树林影像数据,并可对同一区域重复多次成像。④ 可搭载多种传感器。当前,受限于无人机平台载重、续航、空中控制能力等,以搭载轻型光学相机、多光谱相机为主。随着无人机技术的飞速发展,进一步搭载更为复杂的高光谱、激光雷达等传感器也将更为普遍,可以获取红树林生态系统更多参数特征。
基于遥感技术,红树林分布的大多数历史估计是使用来自区域或国家研究的汇总数据的资料。例如,联合国粮食及农业组织(粮农组织)定期编制红树林覆盖全国范围的报告。这些报告中的许多数据是对每个后续报告和报告中传播的国家红树林覆盖率的单一估计。这些报告已被证明对红树林研究界描绘历史红树林覆盖和损失很重要,但不符合当前红树林研究议程的要求,因此需要具有高精度、高分辨率的的全球红树林数据库[53]。例如,在对马来西亚红树林覆盖率的历史估计进行文献检索时,Friess和Webb[84]指出红树林数据估计变化很大,在绘制红树林损失的情况会随时间推移的趋势时会产生大量不确定性。不同研究人员对全球红树林总面积的估计,范围大致在1.1×10⁸ ~2.4×10⁸ hm2[85]。Hamilton等[53]评估全球的红树林面积,面积为8.3495×10⁵ hm2。Giri等[51]利用1000幅Landsat数据,绘制了全球红树林分布图,结果显示全世界红树林的面积为1.3776×10⁶ hm2,占全球森林总面积的0.7%,其中亚洲拥有42%的红树林面积,非洲占20%,北美和中美洲占15%,大洋洲占12%和南美洲占11%,比Hamilton研究的面积增加了5.436×10⁵ hm2,对于各个国家的红树林分布(图3),印度尼西亚的红树林面积为3.11×10⁶ hm2,占全球22.6%的红树林面积,澳大利亚占据第二的位置,为9.8×10⁵ hm2,占全球红树林面积的7.1%[16,84,85],巴西、墨西哥、孟加拉国、古巴等地区也存在大量红树林(图3)。在Giri之前,有联合国粮农组织基于统计数据对全球红树林面积进行监测,其值是1.5×10⁷ hm2,比Giri估计的面积大12%,这主要是因为Giri等[51]使用的Landsat中分辨数据虽能够包含部分的细节来监测大范围红树林的分布和动态信息,但这些数据不能发现沿海的非常小斑块的红树林区域。
表3 红树林遥感动态监测运用雷达数据和方法
Tab. 3 Overview of RADAR data and methods for extracting mangrove remote sensing information
| 数据源 | 卫星传感器 | 目视解译 | 基于像元的分类法 | 智能化分类方法 | 面向对象 分类法 | 综合 提取法 | ||||
|---|---|---|---|---|---|---|---|---|---|---|
| 波段 组合法 | 像元 分解法 | 专家 决策树 | 人工神经 网络 | 支持 向量机 | 随机 森林 | |||||
| 机载 | AIRSAR | 1 | 1 | 1 | 1 | |||||
| ALOS PALSAR | 2 | 5 | 3 | 4 | 1 | |||||
| ALOS AVNIR | 1 | 3 | 3 | 1 | 1 | 1 | ||||
| JERS-1 | 1 | 2 | 1 | 1 | ||||||
| 星载 | Envisat ASAR | 1 | ||||||||
| Radarsat-1 SAR | 1 | 2 | 1 | |||||||
| Sential-1A SAR | 1 | 2 | ||||||||
针对典型区域的红树林动态研究,Giri等[52]利用Landsat ETM+数据对南亚的印度河三角洲、果阿邦和孙德尔本斯3个地区进行监测,结果表明,南亚地区的红树林面积约为1.19×10⁶ hm2,占全球红树林面积的7%,从2000年到2012年,红树林损失了9×10⁴ hm2,其主要原因是海平面上升导致的。Nardin等[68]基于Landsat MSS/TM/ETM+/OLI数据,对印度尼西亚塔纳凯克岛的红树林进行提取,结果表明,1927-2013年间,受水产养殖、居民地增加和火烧等人为因素的影响,红树林面积减少64%。Ibharim等[55]利用Landsat TM/ETM+数据对马来西亚半岛最大的红树林区域—马当红树林保护区进行监测,得出1993-2011年该区域的红树林受农业开垦、水产养殖和居民地增加等影响,面积损失 0.8×10³ hm2。Quader等[86]利用Landsat MSS/TM/ETM+数据对世界上最大面积的红树林地区—孙德尔本斯地区的红树林进行监测,结果显示在1975-2010年红树林面积减少约1.2%,即1×104 hm2的红树林面积,主要因为印度洋海啸和海岸侵蚀等影响。
中国红树林主要分布在东南沿海地区,涉及广西、广东、海南、福建、浙江以及港澳台地区[58]。在全国尺度上,国家林业局于2001年组织开展了全国红树林资源调查工作,初步查清了2001年全国红树林分布状况,其成果可作为全国红树林基线数 据[17]。2009-2013年国家林业局组织完成第二次全国湿地资源调查(未包括海南省三沙市和港澳台地区)工作是在三家中央技术支撑单位以及广东、广西、海南、福建、浙江省级调查组和各级林业主管部门中开展的[14],通过这次调查对全国红树林资源进一步摸底和核实(表4、图4)。此次调查不仅完成了斑块性质的全国湿地资源调查,而且还形成了全国湿地红树林数据库。2001年调查结果显示,中国红树林面积2.2025×10⁴ hm2。第二次全国湿地调查红树林面积为34 472hm2[14],面积增加显著。除国家林业局系统性的调查外,不同的研究人员也进行了全国红树林遥感监测研究。吴培强等[8]利用Landsat系列和HJ-1卫星数据对全国红树林进行监测,结果显示2000年和2010年,全国红树林面积分别为1.6054×10⁴ ~2.4578×10⁴ hm2。Jia等[39]利用Landsat数据进行的全国红树林监测结果表明,2010年红树林面积为20 778 hm2。由于这些研究所用的数据源、时相、分类方法、解译尺度等方面的差异,研究结果之间差异较大(表4)。相比于国家林业局普查数据,研究人员得到的红树林面积通常偏小。这可能是因为国家林业局在调查中包含了更多的野外调查,从而获取了许多低潮间带红树林数据;研究人员通常依赖遥感数据进行信息提取,所用遥感数据受成像时潮位影响,低潮间带这部分红树林提取会有一定的误差。
图4 国家林业局普查中各省份红树林面积对比
Fig. 4 The Changes of mangrove area in all provincesof the country
表4 基于不同研究的中国红树林面积对比及运用数据源
Tab. 4 The changes of mangrove area in China and application data sources
| 资料出处 | 总面积/ ×104hm2 | 数据源 |
|---|---|---|
| 国家林业局2001年调查 | 2.2025 | Aerial photography |
| 吴培强(2010) | 2.4579 | Landsat TM/ETM+/HJ-1 CCD |
| Jia(2013) | 3.2996 | Landsat MSS/TM/ETM+/OLI |
| 国家林业局2013年调查 | 3.4472 | CBERS-CCD |
在区域尺度上,不同省份红树林面积分布及变化也表现出不同特征(表5)。国家林业局第二次湿地调查结果表明,广东和广西地区的红树林分别为1.9751×10⁴ hm2和8.78×10³ hm2(图4),分别占全国面积的57.3%和25.5%,二者之和占中国红树林面积的80%以上。海南和福建的红树林面积分别为4.736×10³ hm2和1.184×10³ hm2,分别占全国面积的13.7%和3.4%。浙江省红树林面积很小,所占比例不到1%[89,90]。相比于2001年调查结果,广东省红树林面积近10年大幅度增长,增加了约1.0667×10⁴ hm2,而广西增幅不大,约4.06×10² hm2。福建和海南的红树林面积则分别增长了5.69×10² hm2和8.06×10² hm2。
表5 各省份红树林面积监测研究状况的对比
Tab. 5 Status of remote sensing monitoring of mangrove forests in each province
| 省份 | 各个年份红树林的面积/hm2 | 参考文献 | |||||||
|---|---|---|---|---|---|---|---|---|---|
| 2000 | 2001 | 2007 | 2008 | 2010 | 2012 | 2013 | 2014 | ||
| 广西 | 6.679×10³ | 6.448×10³ | 6.758×10³ | [98] | |||||
| 8.781×10³ | [78] | ||||||||
| 7.243×10³ | [99] | ||||||||
| 7.015×10³ | 6.743×10³ | 7.054×10³ | [87] | ||||||
| 1.9714×10⁴ | [78] | ||||||||
| 广东 | 1.0065×10⁴ | 9.5×101 | [9] | ||||||
| 8.722×10³ | 9.9×101 | [5] | |||||||
| 海南 | 4.891×10³ | [79] | |||||||
| 4.736×10³ | [78] | ||||||||
| 3.3×10³ | [88] | ||||||||
| 福建 | 1.184×10³ | [78] | |||||||
| 浙江 | 2×101 | [78] | |||||||
不同研究人员针对各省区的红树林调查结果则差异很大。吴培强等[8]研究表明,2000-2010年,广东和广西红树林面积都有较大程度的增加,分别增加了约3409 hm2和3347 hm2,而福建和海南则分别增加了6.73×10² hm2和1.096×10³ hm2。李春干等[5]监测广西2001、2010年红树林面积分别为6.679×10³ hm2和6.758×10³ hm2,面积基本稳定。
综上,相比较全球红树林面积减少的现象,2000年以来,中国红树林面积总体呈现增长的趋势,增加了1.2万多hm2,这是因为中国自80年代以来建立了多个国家级、省级的红树林保护区,起到了较好的保护效果[91];而且人们对红树林的保护意识逐步增强,大规模的毁林造塘行为、污染、围垦、过渡捕捞和挖财、城市建筑等行为正在慢慢[14];此外,政府还采取人工造林的方式使得红树林面积稳步增长[15, 92-97]。
综上所述,2000年以来,红树林遥感动态监测研究取得了长足发展。随着遥感平台及传感器技术的快速发展,未来红树林遥感监测数据来源也将更为多样,技术方法研究也会更为深入。以下4个方面值得关注:
(1)在卫星遥感方面,高时空分辨率数据将成为大尺度红树林遥感监测的重要数据源。红树林通常斑块面积不大,低空间分辨率遥感数据限制了其对红树林斑块识别及变化检测能力。因此,高空间分辨率卫星数据在红树林遥感监测中已成为趋势。而传统的高空间分辨率数据由于卫星重访周期长,时间分辨率较低,在动态监测的时效性方面仍有不足。近年来,高时空分辨率的卫星遥感数据已成为可能。欧盟于2015年和2017年发射了哨兵-2A和哨兵-2B卫星,重访周期5 d,空间分辨率10~60 m。这两颗卫星都携带了覆盖13个波段的多光谱成像仪,包含3个红边波段,有助于对红树林信息进行遥感识别。此外,2016年6月,中国首颗地球静止轨道对地观测卫星高分四号(GF-4)正式投入使用,其成像采用面阵凝视方式,具备可见光、多光谱和红外成像能力,通过与此前发射的运行于低轨的高分一号、高分二号卫星组成星座,可为红树林动态监测提供同时具备高时间分辨率和较高空间分辨率的卫星遥感数据。另一方面,卫星雷达数据可以弥补光学传感器易受恶劣天气的影响的不足,而且具有一定的穿透能力,将雷达数据和光学遥感数据进行融合,有助于进一步提升红树林卫星遥感监测能力。当前雷达传感器的时间分辨率比较低,欧盟在2014年发射首颗哨兵-1A雷达卫星,时间分辨率可达5 d,为红树林遥感动态监测提供了新的雷达数据源。
(2)基于无人机平台的多传感器数据将得到广泛应用。基于无人机平台的多光谱、高光谱或激光雷达传感器可以提供信息更丰富的遥感数据,能够从多方面对红树林生态系统进行监测。然而,这些先进传感器的应用也面临挑战,它们需要有效载荷容量更大的无人机系统,这对无人机的空中飞行控制、影像几何校正及高分数据后处理技术也提出更高的要求。GEE(Google Earth Engine)是全球大尺度卫星数据平台,可以批量处理卫星影像数据的工具,是Google Earth的系列工具,相比于ENVI等传统的处理影像工具,GEE可以快速、批量处理数量“巨大”的影像,是未来红树林大尺度数据分析的有力平台。
(3)在红树林遥感信息提取方法上,针对日益丰富的高时空分辨率数据,基于机器学习的遥感分类方法将会获得更大发展。传统的分类方法受红树林特殊生长环境和人为因素的影响,大量的信息噪声往往使分类精度降低。近年来自动化程度较高的智能分类算法成为遥感信息提取新的热点。基于机器学习的方法采用推理及样本学习等方式从大量数据中获得相应的分类规则,具有更好的泛化能力,尤其适于处理“噪声”模式及大规模数据集等问题,有助于提供红树林遥感信息提取精度。此外,高时空分辨率遥感数据的应用,还需要发展更加有效的时间序列遥感分析方法,从而实现对红树林动态变化的智能化、高精度识别。
(4)在研究区域上,虽然现今研究涉及了全球红树林的大部分区域,但对于非洲尼日利亚和北美洲古巴等地区(全球红树林面积前十的国家)的红树林研究鲜有报道,相应地,这些区域的红树林资料也非常缺乏,有待进一步加强。
The authors have declared that no competing interests exist.
| [1] |
红树林的种类及其分布 [J].
This paper discussed two problems concerning with the mangrove as follows:1. The distribution of mangrove species in the world was described. In which, there are 81 species belonging to 30 genera in 24 families.2. The composition of mangrove in the southeastern coast of China including Taiwan and Hainan Islands was described.Among them, there are 31 species, that is Acanthus ebrecteatus, A. ilicifolius, Acrostichum aurenm, A. speciosum, Aegiceras corniculatum, Avicennia marina, Barringtonia raeemosa, Bruguiera cylindrica, B. gymnorhiza, B. sexangula, B. sexangula var. rhynchopetala; cerbera manghas, ceriops tagal, Excoecaria agallocha, Heritiera littoralis, Hibiscus tiliaceus, Kandelia candel, Lumnitzera littorea, L. raeemosa, Nypa fruticans, Pemphis acidula, Rhizophora apiculata, R. mucronata, R. stylosa, Scyphiphora hydrophyllacea, Sonneratia alba, S. caseolaris, S. hainanensis, S. ovata, Thespesia populnea and Xyiocarpus granatus.
Distribution of mangrove species [J].
This paper discussed two problems concerning with the mangrove as follows:1. The distribution of mangrove species in the world was described. In which, there are 81 species belonging to 30 genera in 24 families.2. The composition of mangrove in the southeastern coast of China including Taiwan and Hainan Islands was described.Among them, there are 31 species, that is Acanthus ebrecteatus, A. ilicifolius, Acrostichum aurenm, A. speciosum, Aegiceras corniculatum, Avicennia marina, Barringtonia raeemosa, Bruguiera cylindrica, B. gymnorhiza, B. sexangula, B. sexangula var. rhynchopetala; cerbera manghas, ceriops tagal, Excoecaria agallocha, Heritiera littoralis, Hibiscus tiliaceus, Kandelia candel, Lumnitzera littorea, L. raeemosa, Nypa fruticans, Pemphis acidula, Rhizophora apiculata, R. mucronata, R. stylosa, Scyphiphora hydrophyllacea, Sonneratia alba, S. caseolaris, S. hainanensis, S. ovata, Thespesia populnea and Xyiocarpus granatus.
|
| [2] |
基于SPOT5影像的红树林种类图谱特征分析和制图 [J].https://doi.org/10.3969/j.issn.1007-7146.2014.06.017 URL [本文引用: 1] 摘要
本文以英罗港为研究区,利用 SPOT5假彩色合成影像,结合现场踏勘,提取了研究区内分布较广且面积较大的4种红树林种类(白骨壤、桐花、秋茄和红海榄)的图谱特征,并建立了相应的 遥感解译标志。利用SVM方法开展了研究区内红树林的分类制图,采用样点验证方法评价提取精度,结果显示,对4种红树林的总体分类精度为 86.67%,Kappa 系数为0.82。
The type of mangrove features analysis and mapping based on SPOT-5 image [J].https://doi.org/10.3969/j.issn.1007-7146.2014.06.017 URL [本文引用: 1] 摘要
本文以英罗港为研究区,利用 SPOT5假彩色合成影像,结合现场踏勘,提取了研究区内分布较广且面积较大的4种红树林种类(白骨壤、桐花、秋茄和红海榄)的图谱特征,并建立了相应的 遥感解译标志。利用SVM方法开展了研究区内红树林的分类制图,采用样点验证方法评价提取精度,结果显示,对4种红树林的总体分类精度为 86.67%,Kappa 系数为0.82。
|
| [3] |
基于高空间分辨率的红树林卫星遥感监测技术进展 [J].Development of mangrove monitoring technology using high spatial-resolution satellite images [J]. |
| [4] |
基于SPOT5的红树林遥感分类 [J].https://doi.org/10.3969/j.issn.1009-5470.2012.06.020 URL [本文引用: 1] 摘要
以海南岛东寨港国家级红树林自然保护区为例,实地测量了红树林等地物光谱,获取了较为准确的红树林的光谱特征;在采用最大似然分类法提纯红树林信息基础上,结合不同红树种类的光谱特征及植被指数差异,选定可分性阈值,建立决策树分类规则,对SPOT5图像进行种间分类,并检验其分类精度.结果显示,各红树种类的使用精度都达到80%以上,且总体精度达到90%以上,为红树林生态系统业务化遥感监测奠定基础.
Remote sensing classification of mangrove based on SPOT5 image [J].https://doi.org/10.3969/j.issn.1009-5470.2012.06.020 URL [本文引用: 1] 摘要
以海南岛东寨港国家级红树林自然保护区为例,实地测量了红树林等地物光谱,获取了较为准确的红树林的光谱特征;在采用最大似然分类法提纯红树林信息基础上,结合不同红树种类的光谱特征及植被指数差异,选定可分性阈值,建立决策树分类规则,对SPOT5图像进行种间分类,并检验其分类精度.结果显示,各红树种类的使用精度都达到80%以上,且总体精度达到90%以上,为红树林生态系统业务化遥感监测奠定基础.
|
| [5] |
1960-2010年广西红树林空间分布演变机制 [J].https://doi.org/10.5846/stxb201401160119 URL Magsci [本文引用: 3] 摘要
为全面摸清1960-2010年广西红树林空间分布及其演变机制,采用多源遥感数据提取不同年度的红树林空间分布信息,分析了广西红树林空间分布动态特点,采用基于斑块的红树林空间演变机理分析方法,研究了1960/1976-2010年广西红树林空间演变机制。结果表明:1960/1976年、1990s年、2001年、2007年和2010年广西红树林斑块数量分别为1020、829、1094、1718个和1712个,面积分别为9062.5、7430.1、7015.4、6743.2、7054.3 hm<sup>2</sup>,近50年间红树林面积减少了22.16%,年均减少0.53%,斑块数量增加了67.8%;斑块平均面积由1960/1976年的8.9 hm<sup>2</sup>减小至2010年的4.1 hm<sup>2</sup>,大斑块数量显著减少,斑块破碎化严重;不同时期、不同区域和海湾,红树林面积和斑块数量的变化量、变化速率均不同;1960/1976年的斑块中,只有24个斑块至2010年时尚保持稳定,占2.4%,绝大部分斑块都发生了某种程度的变化。进一步分析结果表明:1960/1976-2010年,斑块消失(46.1%)、碎化(40.4%)、萎缩(13.5%)是面积减少的主要途径,新增(70.0%)和碎化(29.9%)是斑块数量增加的主要途径,但在不同时期,斑块数量和面积在各个途径上发生的变化量不尽相同;养殖塘和盐田建设(80.0%)、工程建设(10.9%)和围垦(9.1%)是面积净减少的驱动因子,自然过程(92.6%)和人工造林(7.4%)是斑块数量净增加的驱动因子,不同驱动因子在不同时期对斑块数量和面积变化的影响程度不同;斑块数量变化主要由自然过程作用下通过新增(39.6%)、消失(-9.1%)两个途径,以及养殖塘和盐田作用下通过消失(-15.3%)、碎化(14.5%)两个途径发生,斑块面积变化主要由自然过程影响下通过新增(17.5%)、扩张(12.6%)、消失(-6.1%),以及养殖塘和盐田建设驱动下通过斑块消失(-14.8%)、碎化(-13.9%)、萎缩(-6.6%)3个途径发生。
The spatial spatial distribution evolution mechanism of mangroves in Guangxi from 1960 to 2010 [J].https://doi.org/10.5846/stxb201401160119 URL Magsci [本文引用: 3] 摘要
为全面摸清1960-2010年广西红树林空间分布及其演变机制,采用多源遥感数据提取不同年度的红树林空间分布信息,分析了广西红树林空间分布动态特点,采用基于斑块的红树林空间演变机理分析方法,研究了1960/1976-2010年广西红树林空间演变机制。结果表明:1960/1976年、1990s年、2001年、2007年和2010年广西红树林斑块数量分别为1020、829、1094、1718个和1712个,面积分别为9062.5、7430.1、7015.4、6743.2、7054.3 hm<sup>2</sup>,近50年间红树林面积减少了22.16%,年均减少0.53%,斑块数量增加了67.8%;斑块平均面积由1960/1976年的8.9 hm<sup>2</sup>减小至2010年的4.1 hm<sup>2</sup>,大斑块数量显著减少,斑块破碎化严重;不同时期、不同区域和海湾,红树林面积和斑块数量的变化量、变化速率均不同;1960/1976年的斑块中,只有24个斑块至2010年时尚保持稳定,占2.4%,绝大部分斑块都发生了某种程度的变化。进一步分析结果表明:1960/1976-2010年,斑块消失(46.1%)、碎化(40.4%)、萎缩(13.5%)是面积减少的主要途径,新增(70.0%)和碎化(29.9%)是斑块数量增加的主要途径,但在不同时期,斑块数量和面积在各个途径上发生的变化量不尽相同;养殖塘和盐田建设(80.0%)、工程建设(10.9%)和围垦(9.1%)是面积净减少的驱动因子,自然过程(92.6%)和人工造林(7.4%)是斑块数量净增加的驱动因子,不同驱动因子在不同时期对斑块数量和面积变化的影响程度不同;斑块数量变化主要由自然过程作用下通过新增(39.6%)、消失(-9.1%)两个途径,以及养殖塘和盐田作用下通过消失(-15.3%)、碎化(14.5%)两个途径发生,斑块面积变化主要由自然过程影响下通过新增(17.5%)、扩张(12.6%)、消失(-6.1%),以及养殖塘和盐田建设驱动下通过斑块消失(-14.8%)、碎化(-13.9%)、萎缩(-6.6%)3个途径发生。
|
| [6] |
中国红树林湿地物种多样性及其形成 [J].https://doi.org/10.3321/j.issn:1000-0933.2007.11.056 URL Magsci [本文引用: 1] 摘要
目前中国红树林湿地共记录了2854种生物,包括真菌136种、放线菌13种、细菌7种、小型藻类441种、大型藻类55种、维管束植物37种、浮游动物109种、底栖动物873种、游泳动物258种、昆虫434种、蜘蛛31种、两栖类13种、爬行类39种、鸟类421种和兽类28种。这些动物中有8种国家一级保护动物,75种二级保护动物。中国红树林湿地是中国濒危生物保存和发展的重要基地,并在跨国鸟类保护中起着重要作用。中国红树林湿地单位面积的物种丰度是海洋平均水平的1766倍。从初级生产物质基础、食物关系多样性、宏观尺度和微观尺度的空间异质性、生境利用的时序性等方面分析了中国红树林湿地物种多样性极其丰富的原因。
Species diversity in mangrove wetlands of China and its causation analyses [J].https://doi.org/10.3321/j.issn:1000-0933.2007.11.056 URL Magsci [本文引用: 1] 摘要
目前中国红树林湿地共记录了2854种生物,包括真菌136种、放线菌13种、细菌7种、小型藻类441种、大型藻类55种、维管束植物37种、浮游动物109种、底栖动物873种、游泳动物258种、昆虫434种、蜘蛛31种、两栖类13种、爬行类39种、鸟类421种和兽类28种。这些动物中有8种国家一级保护动物,75种二级保护动物。中国红树林湿地是中国濒危生物保存和发展的重要基地,并在跨国鸟类保护中起着重要作用。中国红树林湿地单位面积的物种丰度是海洋平均水平的1766倍。从初级生产物质基础、食物关系多样性、宏观尺度和微观尺度的空间异质性、生境利用的时序性等方面分析了中国红树林湿地物种多样性极其丰富的原因。
|
| [7] |
Status and trends in mangrove area extent world wide[R] . |
| [8] |
广东省红树林资源变化遥感监测 [J].https://doi.org/10.3969/j.issn.1001-909X.2011.04.003 URL [本文引用: 3] 摘要
利用1990年的Landsat-5 TM、2000年的Landsat-7 ETM+和2008年的CBERS-02B CCD3期遥感影像对广东省近18a来的红树林湿地资源进行监测,并对其时空变化情况进行分析。结果表明:广东省红树林呈现不断增加的趋势,1990年、2000年和2008年的面积分别为7733.2,8722.0和9593.3hm^2;红树林由沿岸分散分布趋于集中分布;天然林减少,人工林增加。
Remote sensing monitoring and analysis of the changes of mangrove resource in China in the pasts 20 years [J].https://doi.org/10.3969/j.issn.1001-909X.2011.04.003 URL [本文引用: 3] 摘要
利用1990年的Landsat-5 TM、2000年的Landsat-7 ETM+和2008年的CBERS-02B CCD3期遥感影像对广东省近18a来的红树林湿地资源进行监测,并对其时空变化情况进行分析。结果表明:广东省红树林呈现不断增加的趋势,1990年、2000年和2008年的面积分别为7733.2,8722.0和9593.3hm^2;红树林由沿岸分散分布趋于集中分布;天然林减少,人工林增加。
|
| [9] |
|
| [10] |
|
| [11] |
|
| [12] |
|
| [13] |
中国红树林生态系统健康评价指标体系研究[D] .Research on the health assessing system of Chinese mangrove ecosystems[D] . |
| [14] |
中国红树林湿地资源、保护现状和主要威胁 [J].Resources, conservation status and main threats of mangrove wetlands in China [J]. |
| [15] |
无人机遥感在红树林资源调查中的应用 [J].Application of unmanned aerial vehicles to mangrove resources monitoring [J]. |
| [16] |
无人机遥感在生态学中的应用进展 [J].
无人机与遥感技术的结合,即无人机遥感。与传统的以卫星和有人机遥感相比,无人机遥感具有高时效、高时空分辨率、云下低空飞行、高机动性等优势,是传统卫星和有人机遥感手段所无法比拟的。这些优点使得无人机在生态学和保护生物学等领域获得迅速发展。首先对无人机遥感技术的发展历程、系统组成、分类与选型、应用优势等进行了介绍。在此基础上,对无人机在生态学中的应用案例进行了总结,内容涉及生境监测、植物物候调查、动物监测等方面。最后通过比较国内外相关领域的研究进展对无人机生态学存在的问题(技术门槛较高和法律法规不完善等)和潜在应用前景进行了探讨。
Unmanned aerial vehicle remote sensing in ecology: Advances and prospects [J].
无人机与遥感技术的结合,即无人机遥感。与传统的以卫星和有人机遥感相比,无人机遥感具有高时效、高时空分辨率、云下低空飞行、高机动性等优势,是传统卫星和有人机遥感手段所无法比拟的。这些优点使得无人机在生态学和保护生物学等领域获得迅速发展。首先对无人机遥感技术的发展历程、系统组成、分类与选型、应用优势等进行了介绍。在此基础上,对无人机在生态学中的应用案例进行了总结,内容涉及生境监测、植物物候调查、动物监测等方面。最后通过比较国内外相关领域的研究进展对无人机生态学存在的问题(技术门槛较高和法律法规不完善等)和潜在应用前景进行了探讨。
|
| [17] |
|
| [18] |
基于斑块的东寨港红树林湿地景观格局变化及其驱动力 [J].
在解译1988、1998及2009年3期遥感影像基础上,运用叠加分析和基于斑块的红树林空间演变机理分析方法,分析了1988—2009年间东寨港红树林湿地景观格局变化及其驱动力差异.结果表明:1988、1998及2009年,研究区红树林总面积分别为1809.4、1738.7和1608.2 hm2,整体呈递减趋势,且破碎化程度加剧.景观类型主要表现为红树林、农用地、有林地等向建设用地、养殖塘用地转化.分别利用累计计数、按百分比计数、按主要途径计数3种方法的统计结果显示,导致东寨港红树林斑块数量变化的驱动力主要为自然因素,作用力百分比分别为58.6%、72.2%、72.1%,而导致斑块面积变化的驱动力主要为人为因素,作用力百分比相应为70.4%、70.3%、76.4%.
Landscape pattern change of Dongzhai Harbour mangrove, South China analyzed with a patch-based method and its driving forces Chinese [J].
在解译1988、1998及2009年3期遥感影像基础上,运用叠加分析和基于斑块的红树林空间演变机理分析方法,分析了1988—2009年间东寨港红树林湿地景观格局变化及其驱动力差异.结果表明:1988、1998及2009年,研究区红树林总面积分别为1809.4、1738.7和1608.2 hm2,整体呈递减趋势,且破碎化程度加剧.景观类型主要表现为红树林、农用地、有林地等向建设用地、养殖塘用地转化.分别利用累计计数、按百分比计数、按主要途径计数3种方法的统计结果显示,导致东寨港红树林斑块数量变化的驱动力主要为自然因素,作用力百分比分别为58.6%、72.2%、72.1%,而导致斑块面积变化的驱动力主要为人为因素,作用力百分比相应为70.4%、70.3%、76.4%.
|
| [19] |
基于Geoeye-1影像光谱特性的红树林冠层种类识别 [J].https://doi.org/10.3964/j.issn.1000-0593(2013)01-0136-06 URL [本文引用: 1] 摘要
基于Geoeye-1高空间分辨率影像与冠层实测高光谱数据,以广西北部湾五种红树群落为研究对象,分析影像光谱用于冠层种类识别的能力。首先研究红树林冠层光谱响应特征,再针对影像采用高光谱分析方法提取端元,结合实测训练样本进行不同方法的识别对比。结果表明:350~1 100nm谱段内以435,469,523,677,751和761nm为中心波段的红树群落冠层光谱表现最佳;木榄端元应用识别精度高于实测训练样本应用结果;光谱角制图法能够克服多光谱波段对全色波段分辨率的影响,并有效获取冠层轮廓。利用Geoeye-1影像光谱信息可有效识别三种红树植被,种类最高识别精度达93.03%。研究证实高空间分辨率影像光谱信息的重要性,从机理和应用角度为面向对象红树林种类识别提供了依据和参考。
Mangrove canopy species discrimination based on spectral fearures Geoeye-1 Imagery [J].https://doi.org/10.3964/j.issn.1000-0593(2013)01-0136-06 URL [本文引用: 1] 摘要
基于Geoeye-1高空间分辨率影像与冠层实测高光谱数据,以广西北部湾五种红树群落为研究对象,分析影像光谱用于冠层种类识别的能力。首先研究红树林冠层光谱响应特征,再针对影像采用高光谱分析方法提取端元,结合实测训练样本进行不同方法的识别对比。结果表明:350~1 100nm谱段内以435,469,523,677,751和761nm为中心波段的红树群落冠层光谱表现最佳;木榄端元应用识别精度高于实测训练样本应用结果;光谱角制图法能够克服多光谱波段对全色波段分辨率的影响,并有效获取冠层轮廓。利用Geoeye-1影像光谱信息可有效识别三种红树植被,种类最高识别精度达93.03%。研究证实高空间分辨率影像光谱信息的重要性,从机理和应用角度为面向对象红树林种类识别提供了依据和参考。
|
| [20] |
海洋生态系统多样性研究 [J].Study on diversity of marine ecosystems [J]. |
| [21] |
中国红树林的分布、面积和树种组成 [J].Area, distribution and species composition of mangroves in China [J]. |
| [22] |
中国红树林研究进展 [J].A Review on the Mangrove Research in China [J]. |
| [23] |
基于决策树的角度指数方法EO-1 ALI影像的红树林遥感识别 [J].Identifying mangrove forest with EO-1 1 ALI imagery combining decision tree with angle indices [J]. |
| [24] |
Next generation of global land cover characterization, mapping, and monitoring [J]. |
| [25] |
珠江口近20年红树林湿地的遥感动态监测 [J].Monitoring of the changes of the changes of mangrove wetland around the Zhujiang estuary in the past two decades by remote sensing [J]. |
| [26] |
基于多源遥感的广东镇海湾红树林演变分析 [J].Analysis on mangrove resources changes of Zhenhai Bay in Guangdong based on multi source remote sensing images [J]. |
| [27] |
红树林生态系统遥感监测研究进展 [J].https://doi.org/10.5846/stxb201205150715 URL [本文引用: 1] 摘要
随着现代遥感技术的迅速发展,遥感监测已经成为红树林生态系统变化监测的重要手段和方法。从遥感技术在生态系统变化监测应用领域入手,综述了国内外红树林遥感监测的发展历程,系统总结了遥感技术在红树林湿地动态、种间分类、群落结构(叶面积指数、冠幅、树高等)、生物量、灾害灾情(病虫害、风暴潮等)、景观格局动态、驱动力、红树林湿地保护与管理等领域应用现状,归纳了不同应用领域遥感监测的理论、方法及研究现状。指出我国在红树林遥感监测中存在的不足。提出红树林遥感监测应在分类标准体系规范化、分类精度提升、红树林生态学特征参数(物种多样性、优势度等)、生态系统环境空间演变过程及遥感监测的尺度效应方面加大研究力度。充分发挥区域综合监测模型在红树林生态系统变化遥感监测中的作用。
A review on the application of remote sensing in mangrove ecosystem monitoring [J].https://doi.org/10.5846/stxb201205150715 URL [本文引用: 1] 摘要
随着现代遥感技术的迅速发展,遥感监测已经成为红树林生态系统变化监测的重要手段和方法。从遥感技术在生态系统变化监测应用领域入手,综述了国内外红树林遥感监测的发展历程,系统总结了遥感技术在红树林湿地动态、种间分类、群落结构(叶面积指数、冠幅、树高等)、生物量、灾害灾情(病虫害、风暴潮等)、景观格局动态、驱动力、红树林湿地保护与管理等领域应用现状,归纳了不同应用领域遥感监测的理论、方法及研究现状。指出我国在红树林遥感监测中存在的不足。提出红树林遥感监测应在分类标准体系规范化、分类精度提升、红树林生态学特征参数(物种多样性、优势度等)、生态系统环境空间演变过程及遥感监测的尺度效应方面加大研究力度。充分发挥区域综合监测模型在红树林生态系统变化遥感监测中的作用。
|
| [28] |
近20a来我国红树林资源变化遥感监测与分析 [J].https://doi.org/10.3969/j.issn.1671-6647.2013.03.013 URL [本文引用: 1] 摘要
选择除港澳台外我国现有红树林分布的浙江省、福建省、广东省、广西壮族自治区和海南省作为研究区域,以1990年前后的Landsat-5TM影像、2000年前后的Landsat-7ETM+影像、2010年前后的HJ-1CCD影像共计48幅为主要数据源,采用卫星遥感调查与现场调查相结合的方法,开展红树林信息提取,分析了3个时期的红树林状况和20a间的红树林变化情况。结果表明:近20a来我国红树林呈现不断增加的趋势,1990年前后、2000年前后和2010年前后红树林面积分别为13 519.6,16 053.6和24 578.2hm2;分布由沿岸分散分布趋于保护区集中分布;天然林减少,人工林增加。围填海是造成红树林面积减少的主要原因,自然保护区是红树林面积增加的主要区域。
Remote Sensing monitoring and analysis of the changes of mangrove resource in China in the pasts 20 years [J].https://doi.org/10.3969/j.issn.1671-6647.2013.03.013 URL [本文引用: 1] 摘要
选择除港澳台外我国现有红树林分布的浙江省、福建省、广东省、广西壮族自治区和海南省作为研究区域,以1990年前后的Landsat-5TM影像、2000年前后的Landsat-7ETM+影像、2010年前后的HJ-1CCD影像共计48幅为主要数据源,采用卫星遥感调查与现场调查相结合的方法,开展红树林信息提取,分析了3个时期的红树林状况和20a间的红树林变化情况。结果表明:近20a来我国红树林呈现不断增加的趋势,1990年前后、2000年前后和2010年前后红树林面积分别为13 519.6,16 053.6和24 578.2hm2;分布由沿岸分散分布趋于保护区集中分布;天然林减少,人工林增加。围填海是造成红树林面积减少的主要原因,自然保护区是红树林面积增加的主要区域。
|
| [29] |
红树林湿地恢复遥感动态监测技术研究 [J].A study on dynamic monitoring of mangrove wetland restoration using remote sensing techniques [J]. |
| [30] |
A snow-free vegetation index for improved monitoring of vegetation spring green-up date in deciduous ecosystems [J].https://doi.org/10.1016/j.rse.2017.04.031 URL [本文引用: 3] 摘要
Vegetative spring green-up date (GUD), an indicator of plants' sensitivity to climate change, exerts an important influence on biogeochemical cycles. Conventionally, large-scale monitoring of spring phenology is primarily detected by satellite-based vegetation indices (VIs), e.g. the Normalized Difference Vegetation Index (NDVI). However, these indices have long been criticized, as the derived GUD can be biased by snowmelt. To minimize the snowmelt effect in monitoring spring phenology, we developed a new index, Normalized Difference Phenology Index (NDPI), which is a 3-band VI, designed to best contrast vegetation from the background (i.e. soil and snow in this study) as well as to minimize the difference among the backgrounds. We examined the rigorousness of NDPI in three ways. First, we conducted mathematical simulations to show that NDPI is mathematically robust and performs superior to NDVI for differentiating vegetation from the background, theoretically justifying NDPI for spring phenology monitoring. Second, we applied NDPI using MODIS land surface reflectance products to real vegetative ecosystems of three in-situ PhenoCam sites. Our results show that, despite large snow cover in the winter and snowmelt process in the spring, the temporal trajectories of NDPI closely track the vegetation green-up events. Finally, we applied NDPI to 11 eddy-covariance tower sites, spanning large gradients in latitude and vegetation types in deciduous ecosystems, using the same MODIS products. Our results suggest that the GUD derived by using NDPI is consistent with daily gross primary production (GPP) derived GUD, with R (Spearman's correlation)02=020.93, Bias02=022.9002days, and RMSE (the root mean square error)02=027.7502days, which outcompetes the snow removed NDVI approach, with R02=020.90, Bias02=027.3402days, and RMSE02=0210.9102days. We concluded that our newly-developed NDPI is robust to snowmelt effect and is a reliable approach for monitoring spring green-up in deciduous ecosystems.
|
| [31] |
Nvestigating the decline of ecosystem services in a production mangrove forest using Landsat and object-based image analysis [J].https://doi.org/10.1016/j.ecss.2015.07.047 URL [本文引用: 2] 摘要
The Matang Mangrove Forest Reserve is widely recognised as a sustainably managed mangrove forest. However, recently evidence of multiple ecosystem services decline has emerged. The primary objective of this study was to apply remote sensing techniques to assess the impact of the silviculture in the mangrove forest reserve on the provision of ecosystem services. It applied an object-based approach to classify multi-temporal Landsat imagery. The classified images enabled the study to characterise and analyse the spatiotemporal changes in the distribution of stand age composition and structure over a 35 year period. Links were established between the classified images and the ecosystem services assessment based on the assumption that the classification results provided a reliable proxy for an indirect analysis on the temporal and spatial distribution of aboveground biomass of the mangrove forest reserve. The relationship between the potential impacts of the observed changes derived from the classified images with the data obtained from the ecosystem services assessment were analysed. The analysis showed that the fluctuation in greenwood yield was affected by varying rates of regeneration, exposure to excessive thinning and delays in harvesting. The production of blood cockles around the mudflats of the mangrove forest reserve was determined to be influenced by both timber extraction and natural coastal erosion. An undetected ecological change in the late eighties and anthropogenic disturbances were possible key factors behind the decline in the population of the Milky Stork and migratory shorebirds. The study highlights the importance of understanding and managing the trade-offs between wood production and ecosystem services in a managed mangrove forest and provides an important reference for the future management of the Matang Forest Reserve and other multiple-use wetland forests.
|
| [32] |
基于决策树方法的Landsat8 OLI影像红树林信息自动提取 [J].https://doi.org/10.6046/gtzyyg.2016.02.28 URL [本文引用: 2] 摘要
基于广西山口国家红树林生态自然保护区的Landsat 8 OLI影像数据,选用广泛应用于植被液态水含量反演的归一化差值湿度指数(normalized difference moisture index,NDMI)和修正的归一化差值池塘指数(modified normalized difference pond index,MNDPI)作为分类特征,运用决策树方法进行红树林信息的自动提取。研究结果表明:红树林独特的滨海湿地生境特点,使其光谱同时包含植被和湿地信息;MNDPI和NDMI可分别反映可见光-近红外波段反射率同短波红外波段反射光谱的反差,可成功应用于湿地植被信息的提取,能有效地将红树林同其他地物相区分;采用Landsat8 OLI遥感数据,并结合NDMI和MNDPI分类特征构建的决策树模型可有效地提取红树林信息,其错分率和漏分率都较低,分别为5.34%和1.69%。
Decision tree algorithm of automatically extracting mangrove forests information from Landsat 8 OLI imagery [J].https://doi.org/10.6046/gtzyyg.2016.02.28 URL [本文引用: 2] 摘要
基于广西山口国家红树林生态自然保护区的Landsat 8 OLI影像数据,选用广泛应用于植被液态水含量反演的归一化差值湿度指数(normalized difference moisture index,NDMI)和修正的归一化差值池塘指数(modified normalized difference pond index,MNDPI)作为分类特征,运用决策树方法进行红树林信息的自动提取。研究结果表明:红树林独特的滨海湿地生境特点,使其光谱同时包含植被和湿地信息;MNDPI和NDMI可分别反映可见光-近红外波段反射率同短波红外波段反射光谱的反差,可成功应用于湿地植被信息的提取,能有效地将红树林同其他地物相区分;采用Landsat8 OLI遥感数据,并结合NDMI和MNDPI分类特征构建的决策树模型可有效地提取红树林信息,其错分率和漏分率都较低,分别为5.34%和1.69%。
|
| [33] |
利用温湿度指数提高红树林遥感识别精度 [J].https://doi.org/10.6046/gtzyyg.2012.03.13 URL [本文引用: 2] 摘要
The identification accuracy of mangrove by using TM reflective bands is always low due to the similarity of spectra between mangrove and land vegetation,especially water-vegetation mixed pixels. Based on reflective and thermal infrared information in the TM images of different tide levels,the authors proposed temperature-moisture index(TMI). The analytical results show that the thermal infrared band and TMI can obviously improve the separability between mangrove and other objects based on the tide level information. The thermal infrared band and TMI can also significantly increase the classification accuracy of mangrove by using spectral angle mapping (SAM) supervised classification method in comparison with the classification features employed by other researchers. The Kappa coefficient increases by 0.14, and the commission error of mangrove class decreases by 19.9%,suggesting that the remote sensing identification accuracy of mangrove can be improved by using the information of tide level,thermal infrared band and TMI.
Application of the temperature-moisture index to the improvement of remote sensing identification accuracy of mangrove [J].https://doi.org/10.6046/gtzyyg.2012.03.13 URL [本文引用: 2] 摘要
The identification accuracy of mangrove by using TM reflective bands is always low due to the similarity of spectra between mangrove and land vegetation,especially water-vegetation mixed pixels. Based on reflective and thermal infrared information in the TM images of different tide levels,the authors proposed temperature-moisture index(TMI). The analytical results show that the thermal infrared band and TMI can obviously improve the separability between mangrove and other objects based on the tide level information. The thermal infrared band and TMI can also significantly increase the classification accuracy of mangrove by using spectral angle mapping (SAM) supervised classification method in comparison with the classification features employed by other researchers. The Kappa coefficient increases by 0.14, and the commission error of mangrove class decreases by 19.9%,suggesting that the remote sensing identification accuracy of mangrove can be improved by using the information of tide level,thermal infrared band and TMI.
|
| [34] |
Mapping changes in the largest continuous Amazonian mangrove belt using object-based classification of multisensor satellite imagery .https://doi.org/10.1016/j.ecss.2012.10.005 URL [本文引用: 2] 摘要
Mapping and monitoring mangrove ecosystems is a crucial objective for tropical countries, particularly where human disturbance occurs and because of uncertainties associated with sea level and climatic fluctuation. In many tropical regions, such efforts have focused largely on the use of optical data despite low capture rates because of persistent cloud cover. Recognizing the ability of Synthetic Aperture Radar (SAR) for providing cloud-free observations, this study investigated the use of JERS-1 SAR and ALOS PALSAR data, acquired in 1996 and 2008 respectively, for mapping the extent of mangroves along the Brazilian coastline, from east of the Amazon River mouth, Pará State, to the Bay of S00o José in Maranh00o. For each year, an object-orientated classification of major land covers (mangrove, secondary vegetation, gallery and swamp forest, open water, intermittent lakes and bare areas) was performed with the resulting maps then compared to quantify change. Comparison with available ground truth data indicated a general accuracy in the 2008 image classification of all land covers of 96% (kappa02=0290.6%, tau02=0292.6%). Over the 12 year period, the area of mangrove increased by 718.602km2 from 670502m2 to 7423.6002km2, with 1931.002km05 of expansion and 121302km05 of erosion noted; 549302km05 remained unchanged in extent. The general accuracy relating to changes in mangroves was 83.3% (Kappa 66.1%; tau 66.7%). The study confirmed that these mangroves constituted the largest continuous belt globally and were experiencing significant change because of the dynamic coastal environment and the influence of sedimentation from the Amazon River along the shoreline. The study recommends continued observations using combinations of SAR and optical data to establish trends in mangrove distributions and implications for provision of ecosystem services (e.g., fish/invertebrate nurseries, carbon storage and coastal protection).
|
| [35] |
多源遥感影像红树林信息提取方法比较 [J].Comparison of different methods of mangrove extraction from multi-source remote sensing images [J]. |
| [36] |
Remote sensing of mangrove wetlands identification [J].https://doi.org/10.1016/j.proenv.2011.09.357 URL [本文引用: 3] |
| [37] |
高分辨率卫星遥感在红树林资源监测中的应用 [J].
Satellite remote sensing is the major tool to monitor mangrove resources. High resolution satellite remote sensing can provide more detailed information at fine scale, and therefore it is possibly the important development direction in the protection and monitoring of mangrove resources. This paper overviewed the application of high spatial resolution and hyperspectral remote sensing data to mangrove resources monitoring on the basis of international and national literature reviews, and discussed and analyzed the limitations and development trends regarding data sources, research contents and methods of the study on remote sensing as well as the applied study.
Application of high resolution satellite remote sensing to mangrove resources monitoring [J].
Satellite remote sensing is the major tool to monitor mangrove resources. High resolution satellite remote sensing can provide more detailed information at fine scale, and therefore it is possibly the important development direction in the protection and monitoring of mangrove resources. This paper overviewed the application of high spatial resolution and hyperspectral remote sensing data to mangrove resources monitoring on the basis of international and national literature reviews, and discussed and analyzed the limitations and development trends regarding data sources, research contents and methods of the study on remote sensing as well as the applied study.
|
| [38] |
Investigating the decline of ecosystem services in a production mangrove forest using Landsat and object-based image analysis [J].https://doi.org/10.1016/j.ecss.2015.07.047 URL [本文引用: 2] 摘要
The Matang Mangrove Forest Reserve is widely recognised as a sustainably managed mangrove forest. However, recently evidence of multiple ecosystem services decline has emerged. The primary objective of this study was to apply remote sensing techniques to assess the impact of the silviculture in the mangrove forest reserve on the provision of ecosystem services. It applied an object-based approach to classify multi-temporal Landsat imagery. The classified images enabled the study to characterise and analyse the spatiotemporal changes in the distribution of stand age composition and structure over a 35 year period. Links were established between the classified images and the ecosystem services assessment based on the assumption that the classification results provided a reliable proxy for an indirect analysis on the temporal and spatial distribution of aboveground biomass of the mangrove forest reserve. The relationship between the potential impacts of the observed changes derived from the classified images with the data obtained from the ecosystem services assessment were analysed. The analysis showed that the fluctuation in greenwood yield was affected by varying rates of regeneration, exposure to excessive thinning and delays in harvesting. The production of blood cockles around the mudflats of the mangrove forest reserve was determined to be influenced by both timber extraction and natural coastal erosion. An undetected ecological change in the late eighties and anthropogenic disturbances were possible key factors behind the decline in the population of the Milky Stork and migratory shorebirds. The study highlights the importance of understanding and managing the trade-offs between wood production and ecosystem services in a managed mangrove forest and provides an important reference for the future management of the Matang Forest Reserve and other multiple-use wetland forests.
|
| [39] |
-2013年中国红树林动态变化遥感分析[D] .Remote sensing analysis of dynamic changes of Chinese mangroves from 1973 to 2013[D] . |
| [40] |
Object-based mangrove species classification using unmanned aerial vehicle hyperspectral images and digital surface models [J]. |
| [41] |
Assessment of the health status of Indian mangrove ecosystems using multi temporal remote sensing data [J].
|
| [42] |
A mangrove forest map of China in 2015: Analysis of time series Landsat 7/8 and Sentinel-1A imagery in Google Earth Engine cloud computing platform [J].https://doi.org/10.1016/j.isprsjprs.2017.07.011 URL [本文引用: 2] |
| [43] |
Multi-Decadal mangrove forest change detection and Prediction in Honduras, Central America, with Landsat imagery and a Markov Chain model [J].https://doi.org/10.3390/rs5126408 URL [本文引用: 1] |
| [44] |
An approach to monitoringmangrove extents through time- series comparison of JERS-1 SAR and ALOS PALSAR data [J].https://doi.org/10.1007/s11273-014-9370-6 URL [本文引用: 1] 摘要
Between 2007 and 2010, Japan’s Advanced Land Observing Satellite (ALOS) Phased Arrayed L-band Synthetic Aperture Radar (PALSAR) captured dual polarization HH and HV data across the tropics and sub-tropics. A pan tropical dataset of Japanese Earth Resources Satellite (JERS-1) SAR (HH) data was also acquired between 1995 and 1998. The provision of these comparable cloud-free datasets provided an opportunity for observing changes in the extent of coastal mangroves over more than a decade. Focusing on nine sites distributed through the tropics, this paper demonstrates how these data can be used to backdate and update existing baseline maps of mangrove extent. The benefits of integrating dense time-series of Landsat sensor data for both validating assessments of change and determining the causes of change are outlined. The approach is evaluated for wider application across the geographical range of mangroves in order to advance the development of JAXA’s Global Mangrove Watch (GMW) program.
|
| [45] |
Mapping distinct forest types improves overall forest identification based on multi-spectral landsat imagery for Myanmar's Tanintharyi Region [J].https://doi.org/10.3390/rs8110882 URL [本文引用: 1] 摘要
We investigated the use of multi-spectral Landsat OLI imagery for delineating mangrove, lowland evergreen, upland evergreen and mixed deciduous forest types in Myanmar’s Tanintharyi Region and estimated the extent of degraded forest for each unique forest type. We mapped a total of 16 natural and human land use classes using both a Random Forest algorithm and a multivariate Gaussian model while considering scenarios with all natural forest classes grouped into a single intact or degraded category. Overall, classification accuracy increased for the multivariate Gaussian model with the partitioning of intact and degraded forest into separate forest cover classes but slightly decreased based on the Random Forest classifier. Natural forest cover was estimated to be 80.7% of total area in Tanintharyi. The most prevalent forest types are upland evergreen forest (42.3% of area) and lowland evergreen forest (21.6%). However, while just 27.1% of upland evergreen forest was classified as degraded (on the basis of canopy cover <80%), 66.0% of mangrove forest and 47.5% of the region’s biologically-rich lowland evergreen forest were classified as degraded. This information on the current status of Tanintharyi’s unique forest ecosystems and patterns of human land use is critical to effective conservation strategies and land-use planning.
|
| [46] |
The world's mangroves 1980-2005[R] . |
| [47] |
The State of World Fisheries and Aquaculture .
|
| [48] |
Mapping long-term changes in mangrove species composition and distribution in the Sundarbans [J]. |
| [49] |
Distribution and dynamics of mangrove forests of South Asia [J].https://doi.org/10.1016/j.jenvman.2014.01.020 URL PMID: 24735705 [本文引用: 2] 摘要
61Mapped the current extent of mangrove forests in South Asia.61Identified mangrove forest cover change from 2000 to 2012 using Landsat.61Conducted three case studies in greater spatial and thematic details.
|
| [50] |
Effects of near shore land-use dynamic on coastal erosion in Phuket, Thailand [C]// |
| [51] |
Next generation of global land cover characterization, mapping, and monitoring [J].https://doi.org/10.1016/j.jag.2013.03.005 URL [本文引用: 3] |
| [52] |
Distribution and dynamics of mangrove forests of South Asia [J].https://doi.org/10.1016/j.jenvman.2014.01.020 URL PMID: 24735705 [本文引用: 2] 摘要
61Mapped the current extent of mangrove forests in South Asia.61Identified mangrove forest cover change from 2000 to 2012 using Landsat.61Conducted three case studies in greater spatial and thematic details.
|
| [53] |
Creation of a high spatio-temporal resolution global database of continuous mangrove forest cover for the 21st century (CGMFC-21) [J].https://doi.org/10.1111/geb.12449 URL [本文引用: 3] 摘要
Aim To provide high-resolution local, regional, national and global estimates of annual mangrove forest area from 2000 through to 2012 with the goal of driving mangrove research questions pertaining to biodiversity, carbon stocks, climate change, functionality, food security, livelihoods, fisheries support and conservation that have been impeded until now by a lack of suitable data. Location Global, covering 99% of all mangrove forests. Methods We synthesized the Global Forest Change database, the Terrestrial Ecosystems of the World database and the Mangrove Forests of the World database to extract mangrove forest cover at high spatial and temporal resolutions. We then used the new database to monitor mangrove cover at the global, national and protected area scales. Results Countries showing relatively high amounts of mangrove loss include Myanmar, Malaysia, Cambodia, Indonesia and Guatemala. Indonesia remains by far the largest mangrove-holding nation, containing between 26% and 29% of the global mangrove inventory with a deforestation rate of between 0.26% and 0.66% per year. We have made our new database, CGMFC-21, freely available. Main conclusions Global mangrove deforestation continues but at a much reduced rate of between 0.16% and 0.39% per year. Southeast Asia is a region of concern with mangrove deforestation rates between 3.58% and 8.08%, this in a region containing half of the entire global mangrove forest inventory. The global mangrove deforestation pattern from 2000 to 2012 is one of decreasing rates of deforestation, with many nations essentially stable, with the exception of the largest mangrove-holding region of Southeast Asia. We provide a standardized spatial dataset that monitors mangrove deforestation globally at high spatio-temporal resolutions. These data can be used to drive the mangrove research agenda, particularly as it pertains to monitoring of mangrove carbon stocks and the establishment of baseline local mangrove forest inventories required for payment for ecosystem service initiatives.
|
| [54] |
An object-based classification of mangroves using a hybrid decision tree: Support vector machine approach [J]. |
| [55] |
Determination of mangrove change in Matang Mangrove Forest using multi temporal satellite imageries [J]. |
| [56] |
Landsat-based estimation of mangrove forest loss and restoration in Guangxi Province, China, influenced by human and natural factors [J]. |
| [57] |
Mangrove forest decline: Consequences for livelihoods and environment in South Sulawesi [J].https://doi.org/10.1007/s10113-016-0989-0 URL [本文引用: 1] 摘要
Mangrove forests in the tropics and subtropics grow in saline sediments in coastal and estuarine environments. Preservation of mangrove forests is important for many reasons, including the prevention of coastal erosion and seawater intrusion; the provision of spawning, nursery, and feeding grounds of diverse marine biota; and for direct use (such as firewood, charcoal, and construction material)—all of which benefit the sustainability of local communities. However, for many mangrove areas of the world, unsustainable resource utilization and the profit orientation of communities have often led to rapid and severe mangrove loss with serious consequences. The mangrove forests of the Takalar District, South Sulawesi, are studied here as a case area that has suffered from degradation and declining spatial extent during recent decades. On the basis of a post-classification comparison of change detection from satellite imagery and a survey of households, we provide an estimate of the mangrove change in the Takalar District during 1979–2011 and the consequences of those changes. Mangrove forest areas were reduced by 66.05 % (3344 hectares) during the 33-year period of analysis, and the biggest annual negative change in dense mangrove forest cover (8.37 %) occurred during the period 2006–2011. The changes were caused mainly by the mangrove clearing and conversion to aquaculture, and consequences have been increasing forest degradation, coastal abrasion, seawater intrusion, a decline in fish capture, a reduction in juvenile shrimp and milkfish, and outbreaks of shrimp disease. On the other hand, the clearing and impoundment of mangrove forests for shrimp and seaweed culture have provided a source of foreign exchange and new opportunities for employment in the study area.
|
| [58] |
Land cover changes in the Caroni Swamp Ramsar Site, Trinidad (1942 and 2007) implications for management [J].https://doi.org/10.1007/s11852-012-0225-0 URL [本文引用: 2] 摘要
Caroni Swamp Ramsar Site, the largest mangrove dominated wetland in Trinidad and Tobago, continues to be impacted by human activities. This study examines changes in land cover and land use from 1942 to 2007 using remote sensing technology, geographic information systems (GIS) and extensive field surveys. Land cover maps were produced for 1942, 1957, 1986, 1994, 2003 and 2007 from aerial photos and high resolution satellite imagery. Caroni Swamp's hydrology was altered in the 1920's to facilitate rice cultivation. This resulted in the formation of large tracts of freshwater marsh. From 1942 to 1957, freshwater marsh and agriculture lands increased, but after this period there was a steady decline in both, as freshwater was diverted away from the wetland and salt water intruded further inland. Although mangrove forest was cleared for built development, its coverage has consistently increased in the Swamp from 1957, with the exception of 2003 when there was a decrease by less than 100 ha. This is in contrast to most areas in the tropics where mangrove coverage continue to decline. In this case, the mangrove trees are out-competing/shading marsh vegetation, causing shift in the wetland communities. In the Caroni Ramsar Site, the natural wetland communities generally increased from 1942 to 2003, but declined in 2007, as built development more than doubled. The paper provides spatial coverage, and quantifies land cover from 1942 to 2007. It also identifies reasons for the changes in land cover and uses, and the implications for management.
|
| [59] |
Multitemporal analysis of high-spatial-resolution optical satellite imagery for mangrove species mapping in Bali, Indonesia [J].https://doi.org/10.1109/JSTARS.2016.2553170 URL [本文引用: 1] 摘要
Mapping zonations of mangrove species (ZMS) is important when assessing the functioning of such specific ecosystems. However, the reproducibility of remote sensing methods for discriminating and mapping mangrove habitats is often overstated due to the lack of temporal observations. Here, we investigated the potential use of temporal series of high-resolution multispectral satellite images to discriminate and map four typical Asian ZMS. This study was based on the analysis of eight images acquired between 2001 and 2014 over the mangrove area of Nusa Lembongan, Bali, Indonesia. Variations between years in the top-of-atmosphere reflectance signatures were examined as functions of the acquisition angles. We also applied maximum likelihood supervised classification to all of the images and determined the variability in the classification errors. We found that the distinction between spectral signatures of ZMS characterized by a close canopy was fairly independent of the season and sensor characteristics. By contrast, the variability in the multispectral signatures of ZMS with open canopies and associated classification errors could be attributed to variability in ground surface scattering. In both cases, sun-viewing geometry could alter the separability between ZMS classes in near-nadir viewing or frontward sun-viewing configurations, thereby explaining why the overall accuracy of ZMS classification might vary from 65% to 80%. Thus, multitemporal analysis is an important stage in the development of robust methods for ZMS mapping. It must be supported by physical-based research aiming to quantify the influences of canopy structure, species composition, ground surface properties, and viewing geometry parameters on ZMS multispectral signatures.
|
| [60] |
Textural-Spectral feature-based species classification of mangroves in Mai Po Nature reserve from worldview-3 iImagery [J].https://doi.org/10.3390/rs8010024 URL [本文引用: 2] 摘要
The identification of species within an ecosystem plays a key role in formulating an inventory for use in the development of conservation management plans. The classification of mangrove species typically involves intensive field surveys, whereas remote sensing techniques represent a cost-efficient means of mapping and monitoring mangrove forests at large scales. However, the coarse spectral resolution of remote sensing technology has up until recently restricted the ability to identify individual species. The more recent development of very high-resolution spatial optical remote sensing sensors and techniques has thus provided new opportunities for the accurate mapping of species within mangrove forests over large areas. When dealing with the complex problems associated with discriminating among species, classifier performance could be enhanced through the adoption of more intrinsic features; such as textural and differential spectral features. This study explored the effectiveness of textural and differential spectral features in mapping mangrove inter-species obtained from WorldView-3 high-spatial-resolution imagery for mangrove species in Hong Kong. Due to the different arrangement of leaves, the branch density, and the average height and size of plants, we found that the differential spectral features could aid in reducing inner-species variability and increasing intra-species separation. Using a combination of textural and differential spectral features thus represents a promising tool for discriminating among mangrove species. Experimental results suggest that combining these features can greatly improve mapping accuracy, thereby providing more reliable mapping results.
|
| [61] |
Mangroves at their limits: Detection and area estimation of mangroves along the Sahara desert coast [J].https://doi.org/10.3390/rs8060512 URL [本文引用: 2] 摘要
The northernmost and most arid mangrove ecosystem of West Africa is found in Mauritania, in the Parc National du Banc d’Arguin (PNBA). The existing global and regional maps of Mauritania’s mangroves have little detail, and available estimates of the mangrove area differ among studies. We assessed the use of automated Remote Sensing classification techniques to calculate the extent and map the distribution of the mangrove patches located at Cap Timiris, PNBA, using QuickBird and GeoEye imagery. It was possible to detect the northernmost contiguous mangrove patches of West Africa with an accuracy of 87% ± 2% using the Maximum Likelihood algorithm. The main source of error was the low spectral difference between mangroves and other types of terrestrial vegetation, which resulted in an erroneous classification between these two types of land cover. The most reliable estimate for the mangrove area obtained in this study was 19.48 ± 5.54 ha in 2011. Moreover, we present a special validation procedure that enables a detailed and reliable validation of the land cover maps.
|
| [62] |
Land use and land cover classification of LISS-III satellite image using KNN and decision tree [C]// |
| [63] |
The use of remote sensing for monitoring spatial and temporal changes in mangrove management [J].
Mangroves are important in protecting shorelines against tidal waves and erosion. Since the mangrove forests in the Matang Mangrove Forest Reserve (MMFR), Perak, Malaysia are managed with sustainable objectives, spatial information on the mangroves needs to be acquired and updated from time to time. This paper describes the application of SPOT 4 satellite images for mapping mangrove forest exte...
|
| [64] |
Appraisal of land use/land cover of mangrove forest ecosystem using support vector machine [J].https://doi.org/10.1007/s12665-013-2628-0 URL [本文引用: 1] 摘要
Human activities in many parts of the world have greatly changed the natural land cover. This study has been conducted on Pichavaram forest, south east coast of India, famous for its unique mangrove bio-diversity. The main objectives of this study were focused on monitoring land cover changes particularly for the mangrove forest in the Pichavaram area using multi-temporal Landsat images captured in the 1991, 2000, and 2009. The land use/land cover (LULC) estimation was done by a unique hybrid classification approach consisting of unsupervised and support vector machine (SVM)-based supervised classification. Once the vegetation and non-vegetation classes were separated, training site-based classification technology i.e., SVM-based supervised classification technique was used. The agricultural area, forest/plantation, degraded mangrove and mangrove forest layers were separated from the vegetation layer. Mud flat, sand/beach, swamp, sea water/sea, aquaculture pond, and fallow land were separated from non-vegetation layer. Water logged areas were delineated from the area initially considered under swamp and sea water-drowned areas. In this study, the object-based post-classification comparison method was employed for detecting changes. In order to evaluate the performance, an accuracy assessment was carried out using the randomly stratified sampling method, assuring distribution in a rational pattern so that a specific number of observations were assigned to each category on the classified image. The Kappa accuracy of SVM classified image was highest (94.53 %) for the 2000 image and about 94.14 and 89.45 % for the 2009 and 1991 images, respectively. The results indicated that the increased anthropogenic activities in Pichavaram have caused an irreversible loss of forest vegetation. These findings can be used both as a strategic planning tool to address the broad-scale mangrove ecosystem conservation projects and also as a tactical guide to help managers in designing effective restoration measures.
|
| [65] |
Object-oriented Zhangjiangkou mangrove communities classification Using quickbird imagery [J].https://doi.org/10.4028/www.scientific.net/AMR.605-607.2274 URL [本文引用: 1] 摘要
Mangroves are among the richest ecosystems in terms of natural resources. Because of the similar spectral characteristics and complex spatial structure among different mangrove communities, it is still difficult to extract accurate mangrove communities covers from the very high resolution (VHR) satellite images, based on the conventional pixel-based classification methods. Object-oriented classification methods are proposed to process VHR images because they can incorporate as much information on spatial neighbourhood properties as possible into the classification process. On the basis of object-oriented classification method, the paper extracted the Zhangjiangkou mangrove communities using Quickbird image, through image segmentation, merge segmentation, computing and selecting attributes, K Nearest Neighbor classification, et al. Mangrove communities were eventually divided into six types, i.e. Aegiceras corniculatum, Phragmites karka, Kandelia candel, Cyperus malaccensis, Avicennia marin, Aegiceras corniculatum & Kandelia candel. The extraction accuracy is 85.7%. In this paper, through many experiments, the scale level was determined to 50, and the merge threshold was chosen as 90. In this case, the resulting segments of mangrove communities had a obvious spatial characteristics, and the boundary can be delineated well, which would be help for later information extraction. Considering mangrove communities characters, the following object attributes are generated and added : NDVI, texture, and AVGBAND. This research shows very encouraging results for the use of image segmentation and Quickbird data for mapping mangrove communities.
|
| [66] |
Mangrove forest decline: Consequences for livelihoods and environment in South Sulawesi [J].https://doi.org/10.1007/s10113-016-0989-0 URL [本文引用: 1] 摘要
Mangrove forests in the tropics and subtropics grow in saline sediments in coastal and estuarine environments. Preservation of mangrove forests is important for many reasons, including the prevention of coastal erosion and seawater intrusion; the provision of spawning, nursery, and feeding grounds of diverse marine biota; and for direct use (such as firewood, charcoal, and construction material)—all of which benefit the sustainability of local communities. However, for many mangrove areas of the world, unsustainable resource utilization and the profit orientation of communities have often led to rapid and severe mangrove loss with serious consequences. The mangrove forests of the Takalar District, South Sulawesi, are studied here as a case area that has suffered from degradation and declining spatial extent during recent decades. On the basis of a post-classification comparison of change detection from satellite imagery and a survey of households, we provide an estimate of the mangrove change in the Takalar District during 1979–2011 and the consequences of those changes. Mangrove forest areas were reduced by 66.05 % (3344 hectares) during the 33-year period of analysis, and the biggest annual negative change in dense mangrove forest cover (8.37 %) occurred during the period 2006–2011. The changes were caused mainly by the mangrove clearing and conversion to aquaculture, and consequences have been increasing forest degradation, coastal abrasion, seawater intrusion, a decline in fish capture, a reduction in juvenile shrimp and milkfish, and outbreaks of shrimp disease. On the other hand, the clearing and impoundment of mangrove forests for shrimp and seaweed culture have provided a source of foreign exchange and new opportunities for employment in the study area.
|
| [67] |
Mapping the distribution of mangrove species in the Core Zone of Mai Po Marshes Nature Reserve, Hong Kong, using hyperspectral data and high-resolution data [J].https://doi.org/10.1016/j.jag.2014.06.006 URL [本文引用: 1] 摘要
Mangrove species compositions and distributions are essential for conservation and restoration efforts. In this study, hyperspectral data of EO-1 HYPERION sensor and high spatial resolution data of SPOT-5 sensor were used in Mai Po mangrove species mapping. Objected-oriented method was used in mangrove species classification processing. Firstly, mangrove objects were obtained via segmenting high spatial resolution data of SPOT-5. Then the objects were classified into different mangrove species based on the spectral differences of HYPERION image. The classification result showed that in the top canopy, Kandelia obovata and Avicennia marina dominated Mai Po Marshes Natural Reserve, with area of 196.8ha and 110.8ha, respectively, Acanthus ilicifolius and Aegiceras corniculatum were mixed together and living at the edge of channels with an area of 11.7ha. Additionally, mangrove species shows clearly zonations and associations in the Mai Po Core Zone. The overall accuracy of our mangrove map was 88% and the Kappa confidence was 0.83, which indicated great potential of using hyperspectral and high-resolution data for distinguishing and mapping mangrove species.
|
| [68] |
Bottom sediments affect Sonneratia mangrove forests in the prograding Mekong delta, Vietnam [J].https://doi.org/10.1016/j.ecss.2016.04.019 URL [本文引用: 2] 摘要
Mangrove forests exert a strong influence on tropical deltas by trapping sediments discharged by rivers and by stabilizing the substrate with roots. Understanding the dynamics of sediments and morphology in and around mangrove forests is critical in order to assess the resilience of coastlines in a period of accelerated sea level rise. In this research, sediment samples, mangrove forest characteristics, and remote sensing data are used to investigate the relationship between mangroves and sediment substrate in the Mekong Delta, Vietnam. Our data show a significant correlation between percent of sand in bottom sediments and density ofSonneratia caseolarisforest. We ascribe this result to higher sediment disturbance in muddy areas that prevents seedling establishment. This correlation potentially allows the determination of substrate characteristics from vegetation attributes detected by remote sensing, despite the impenetrability of the forest canopy. The results presented herein suggest that a supply of sand from the river and hydrodynamic processes moving the sand ashore control the density of theSonneratiamangrove forests at this location, promoting tidal flat colonization and canopy expansion.
|
| [69] |
Mapping changes in the largest continuous Amazonian mangrove belt using object-based classification of multisensor satellite imagery [J].https://doi.org/10.1016/j.ecss.2012.10.005 URL [本文引用: 1] 摘要
Mapping and monitoring mangrove ecosystems is a crucial objective for tropical countries, particularly where human disturbance occurs and because of uncertainties associated with sea level and climatic fluctuation. In many tropical regions, such efforts have focused largely on the use of optical data despite low capture rates because of persistent cloud cover. Recognizing the ability of Synthetic Aperture Radar (SAR) for providing cloud-free observations, this study investigated the use of JERS-1 SAR and ALOS PALSAR data, acquired in 1996 and 2008 respectively, for mapping the extent of mangroves along the Brazilian coastline, from east of the Amazon River mouth, Pará State, to the Bay of S00o José in Maranh00o. For each year, an object-orientated classification of major land covers (mangrove, secondary vegetation, gallery and swamp forest, open water, intermittent lakes and bare areas) was performed with the resulting maps then compared to quantify change. Comparison with available ground truth data indicated a general accuracy in the 2008 image classification of all land covers of 96% (kappa02=0290.6%, tau02=0292.6%). Over the 12 year period, the area of mangrove increased by 718.602km2 from 670502m2 to 7423.6002km2, with 1931.002km05 of expansion and 121302km05 of erosion noted; 549302km05 remained unchanged in extent. The general accuracy relating to changes in mangroves was 83.3% (Kappa 66.1%; tau 66.7%). The study confirmed that these mangroves constituted the largest continuous belt globally and were experiencing significant change because of the dynamic coastal environment and the influence of sedimentation from the Amazon River along the shoreline. The study recommends continued observations using combinations of SAR and optical data to establish trends in mangrove distributions and implications for provision of ecosystem services (e.g., fish/invertebrate nurseries, carbon storage and coastal protection).
|
| [70] |
The application of support vector machine using cielab color model, color intensity and color constancy as features for ortho image classification of benthic habitats in Hinatuan, Surigao del Sur, Philippines [J].https://doi.org/10.5194/isprsarchives-XLI-B7-189-2016 URL [本文引用: 1] |
| [71] |
Combining EO-1 hyperion and envisat ASAR data for mangrove species classification in Mai Po Ramsar Site, Hong Kong [J].https://doi.org/10.1080/01431161.2014.978034 URL [本文引用: 1] 摘要
Mangrove habitat is one of the most highly productive ecosystems. The distribution of mangrove species acts as an inventory to formulate conservation management plans. This study explored the potential of combining hyperspectral (Earth-observing (EO)-1 Hyperion) and multi-temporal synthetic aperture radar (SAR) (Environmental Satellite (Envisat) ASAR) data, supported by in situ field surveys, to map mangrove species. Hyperspectral imaging captures a number of narrow contiguous spectral bands providing richer spectral details than those obtained from traditional broadband sensors. All-weather radar sensing allows continuous data acquisition and its signal penetrability can reveal canopy structural characteristics, which offer an additional data dimension that is not available in optical sensing. Through combining the two data types, this study achieved three objectives. First, facing the issue of dimensionality and limited field samples, feature selection techniques from computer science were adopted to select spectral and radar features that are crucial for mangrove species discrimination. Second, classification accuracy using various combinations of spectral and radar features was evaluated. Third, classification algorithms including maximum likelihood (ML), decision tree (DT), artificial neural network (ANN), and support vector machine (SVM) were used to estimate species distribution, and classification accuracy was compared. Results suggested that feature selection techniques are capable of identifying salient features in spectral and radar space that can effectively discriminate between mangrove species. Combining optical and radar data can improve classification accuracy. Among the classifiers, ANN produces more accurate and robust estimation.
|
| [72] |
Classification of floristic composition of mangrove forests using, hyperspectral data: Case study of Bhitarkanika National Park, India [J].https://doi.org/10.1007/s11852-012-0223-2 URL [本文引用: 3] |
| [73] |
Remote sensing of mangrove forest phenology and its environmental drivers [J].https://doi.org/10.1016/j.rse.2017.11.009 URL [本文引用: 2] 摘要
Mangrove forest phenology at the regional scale have been poorly investigated and its driving factors remain unclear. Multi-temporal remote sensing represents a key tool to investigate vegetation phenology, particularly in environments with limited accessibility and lack of in situ measurements. This paper presents the first characterisation of mangrove forest phenology from the Yucatan Peninsula, south east Mexico. We used 15-year time-series of four vegetation indices (EVI, NDVI, gNDVI and NDWI) derived from MODIS surface reflectance to estimate phenological parameters which were then compared with in situ climatic variables, salinity and litterfall. The Discrete Fourier Transform (DFT) was used to smooth the raw data and four phenological parameters were estimated: start of season (SOS), time of maximum greenness (Max Green), end of season (EOS) and length of season (LOS). Litterfall showed a distinct seasonal pattern with higher rates during the end of the dry season and during the wet season. Litterfall was positively correlated with temperature (r = 0.88, p < 0.01) and salinity (r = 0.70, p < 0.01). The results revealed that although mangroves are evergreen species the mangrove forest has clear greenness seasonality which is negatively correlated with litterfall and generally lagged behind maximum rainfall. The dates of phenological metrics varied depending on the choice of vegetation indices reflecting the sensitivity of each index to a particular aspect of vegetation growth. NDWI, an index associated to canopy water content and soil moisture had advanced dates of SOS, Max Green and EOS while gNDVI, an index primarily related to canopy chlorophyll content had delayed dates. SOS ranged between day of the year (DOY) 144 (late dry season) and DOY 220 (rainy season) while the EOS occurred between DOY 104 (mid-dry season) to DOY 160 (early rainy season). The length of the growing season ranged between 228 and 264 days. Sites receiving a greater amount of rainfall between January and March showed an advanced SOS and Max Green. This phenological characterisation is useful to understand the mangrove forest dynamics at the landscape scale and to monitor the status of mangrove. In addition the results will serve as a baseline against which to compare future changes in mangrove phenology due to natural or anthropogenic causes.
|
| [74] |
Land cover and land use change related to shrimp farming in coastal areas of Quang Ninh, Vietnam using remotely sensed data [J].https://doi.org/10.1007/s12665-013-2964-0 URL [本文引用: 3] 摘要
Rapid development of shrimp farming may lead to unrecognized and undesirable changes of land cover/land use patterns in coastal areas. Of special concern is the loss of mangrove forest in coastal areas such as Quang Ninh, Vietnam, which is adjacent to the World Heritage-listed Ha Long Bay. Understanding the status and changes of land cover/land use for coastal shrimp farms and mangrove forests can support environmental protection and decision-making for sustainable development in coastal areas. Within this context, this paper uses the 1999/2001 Landsat ETM+ and the 2008 ALOS AVNIR-2 imagery to investigate the contraction and expansion of shrimp farms and mangrove forests in coastal areas of Ha Long and Mong Cai, which now have a high concentration of intensive and semi-intensive shrimp farms. Images were separately analyzed and classified before using post-classification comparisons to detect land cover/land use changes in the study area. The results of this study found that the area of mangrove forest has been reduced by an estimated 927.5 ha in Ha Long and 1,144.4 ha in Mong Cai, while shrimp farming areas increased by an estimated 1,195.9 and 1,702.5 ha, respectively, over the same period. The majority of shrimp farms in Mong Cai were established at the expense of mangrove forest (49.4 %) while shrimp farms in Ha Long were mainly constructed on areas previously occupied by bare ground (46.5 %) and a significant proportion also replaced mangroves (23.9 %). The remarkable rate of mangrove loss and shrimp farming expansion detected in this study, over a relatively short time scale indicate that greater awareness of environmental impacts of shrimp farm expansion is required if this industry is to be sustainable, the important estuarine and coastal marine ecosystems are to be protected over the long term, and the capturing and storing of carbon in mangrove systems are to be enhanced for global climate change mitigation and for use as carbon offsets.
|
| [75] |
Remote sensing in mapping mangrove ecosystems: An Object-Based approach [J].https://doi.org/10.3390/rs5010183 URL [本文引用: 1] |
| [76] |
Spatio-temporal changes of a mangrove-saltmarsh ecotone in the northeastern coast of Florida, USA [J].https://doi.org/10.1016/j.gecco.2016.07.005 URL [本文引用: 1] 摘要
61We found mangrove expansion/contraction near their northern range limit.61Significant effect of climate variables on habitat areal extent.61Cyclical spatio-temporal dynamism over a 71-year period.61Reversals in habitat dominance may point to complex biotic–abiotic interactions.61Results may contribute to management/conservation strategies under climate change.
|
| [77] |
Development of a Global Backscatter Model in support to the Sentinel-1 mission design [J].https://doi.org/10.1016/j.rse.2011.09.028 URL [本文引用: 1] 摘要
78 Global analysis of ENVISAT ASAR time series data. 78 Developed 1km resolution parameter database for C-band SAR over land. 78 Realistic simulation of Sentinel-1 IWS sigma nought images. 78 Used for performance validation of Sentinel-1 on-board SAR data compression.
|
| [78] |
Assessment and monitoring of estuarine mangrove forests of Goa using satellite remote sensing [J].https://doi.org/10.1007/BF03030873 URL [本文引用: 1] 摘要
The present study highlights the application of satellite remote sensing in the assessment and monitoring of the mangrove forests along the coastline in Goa state of India. Based on onscreen visual interpretation techniques various land use and land cover classes have been mapped and classified. An attempt has been made to analyse changes in the mangrove forest cover from 1994 to 2001 using IRS-1B LISS-II and IRS-1D LISS-III data. An increase in the mangrove vegetation in the important estuaries has been found during 1994 and 2001. During this period, the mangrove forest increased by 44.90 per cent as a result of increased protection and consequent regeneration. Plantation of mangrove species has been raised in 876 ha (1985 to 1997) by the State Forest Department
|
| [79] |
雷州半岛红树林及其保护策略研究[D] .Study on mangrove and its conservational strategy of Leizhou Peninsula, China[D] . |
| [80] |
无人机遥感在海岛海岸带监测中的应用研究[D] .Application of UAV remote sensing in island coastal zone monitoring[D]. |
| [81] |
Research overview and trend on biological invasion in mangrove forests [J].https://doi.org/10.17521/cjpe.2015.0028 URL 摘要
To examine our current understanding on biological invasions in mangrove forests, relevant information from literature was reviewed and several key points were summarized based on the database of ISI Web of Science and the information analysis software Hist Cite. First, most of the studies have focused on the invasion of plant species in mangrove forests, and little attention are paid to other organisms. Secondly, there is an obvious bias on the locations of study sites, with most being situated in the southern and southeastern coasts of China(especially in the Pearl River Estuary and west of the Leizhou Peninsula) and the southeastern coast and Hawaiian Islands of the United States. Thirdly, that whether Sonneratia apetala can result in invasion is still a hot but controversial topic. Introduction of this species should be cautious. Forth, Spartina alterniflora and Mikania micrantha are the most notorious invaders around the world; both possess fast growth rate, high reproductive and competitive capacity, and strong allelopathic effects. They have invaded mangrove forests and caused severe ecological consequences, and apparently deteriorated the microhabitat and changed the benthic organisms' community. Fifth, Rhizophora mangle has invaded Hawaiian Islands as an exotic mangrove species, modified the sedimentary environment, and enriched the benthic organisms, but the impacts are yet to be considered at the global scale. In general, studies on biological invasions in mangrove forests are still at the infant stage and we know little about the underlying mechanisms of the invasions. Specific strategies are lacking for controlling the invasion. The state of invasion and corresponding impacts should be continually focused in future studies. Exploration of the mechanisms and controlling strategies of invasion in mangroves should be launched as soon as possible. The assessment of the effects of biological invasion on ecological services of mangroves should also be emphasized. Finally, a sound management system for the control of biological invasions in mangrove forests is urgently needed.
|
| [82] |
Mangrove mapping and change detection in Ca Mau Peninsula, Vietnam, Using Landsat data and Object-Based image analysis [J].https://doi.org/10.1109/JSTARS.2014.2360691 URL [本文引用: 1] 摘要
Mangrove forests provide important ecosystem goods and services for human society. Extensive coastal development in many developing countries has converted mangrove forests to other land uses without regard to their ecosystem service values; thus, the ecosystem state of mangrove forests is critical for officials to evaluate sustainable coastal management strategies. The objective of this study is to investigate the multidecadal change in mangrove forests in Ca Mau peninsula, South Vietnam, based on Landsat data from 1979 to 2013. The data were processed through four main steps: 1) data preprocessing; 2) image processing using the object-based image analysis (OBIA); 3) accuracy assessment; and 4) multitemporal change detection and spatial analysis of mangrove forests. The classification maps compared with the ground reference data showed the satisfactory agreement with the overall accuracy higher than 82%. From 1979 to 2013, the area of mangrove forests in the study region had decreased by 74%, mainly due to the boom of local aquaculture industry in the study region. Given that mangrove reforestation and afforestation only contributed about 13.2% during the last three decades, advanced mangrove management strategies are in an acute need for promoting environmental sustainability in the future.
|
| [83] |
Identification of hot spots and well managed areas of Pichavaram mangrove using Landsat TM and Resourcesat: 1 LISS IV: An example of coastal resource conservation along Tamil Nadu Coast, India [J]. |
| [84] |
Webb. Bad data equals bad policy: How to trust estimates of ecosystem loss when there is somuch uncertainty? https://doi.org/10.1017/S0376892911000026 URL [本文引用: 2] |
| [85] |
Global land cover mapping at 30 m resolution: A POK- based operational approach [J].https://doi.org/10.1016/j.isprsjprs.2014.09.002 URL [本文引用: 2] |
| [86] |
Multi-decadal land cover evolution in the Sundarban, the largest mangrove forest in the world [J].https://doi.org/10.1016/j.ocecoaman.2017.02.008 URL [本文引用: 1] 摘要
61Mangrove change is mostly characterized by density decrease than net loss.61Forest density better preserved in Bangladesh than Indian part of Sundarban.61Net loss of 99,30002ha (10%) dense forest and 12,00002ha (1.2%) net erosion in Sundarban in 35 years.61Anthropogenic drivers are equally significant as natural ones on the observed changes in Sundarban.
|
| [87] |
Spatiotemporal changes and fragmentation of mangroves and its effects on fish diversity in Ca Mau Province (Vietnam) [J].https://doi.org/10.1007/s11852-017-0513-9 URL |
| [88] |
Fusion of multi-frequency polarimetric SAR and LISS-3 optical data for classification of various land covers [J].URL 摘要
A comparative assessment of optical and microwave data is essential to find out the complementarity of data for classification of various land features. In this paper, the classification accuracy of LISS-3 (IRS-P6) optical data over Mumbai is compared with multi-frequency PolSAR data to study the synergy between both the remote sensing techniques. SVM classifier is applied on optical and PolSAR data. Before applying SVM classifier, optical data is registered with PolSAR data. The overall accuracy of optical IRS data (87.31%) is less than that of fully polarized SAR data (93.54%). Optical data cannot differentiate well between grasslands and mangroves and also saltpans and wetlands, whereas PolSAR data gave high classification accuracy. However, forest is well classified with optical data. Since the forest is on hilly area, foreshortening and layover in PolSAR data affect the classification accuracy. It is observed that the combination of both optical and PolSAR gives better results (98.62%).
|
| [89] |
Detection of mangrove distribution in Pongok Island [C]//Setiawan Y, Prasetyo L B, Siregar I Z, et al. |
| [90] |
中国红树林的分布、面积和树种组成 [J].Area, distribution and species composition of mangroves in China [J]. |
| [91] |
Application of multi-temporal ENVISAT ASAR data to agricultural area mapping in the Pearl River Delta [J].https://doi.org/10.1080/01431160903475258 URL [本文引用: 1] 摘要
This study investigates a method using multi-temporal, multi-polarization ENVISAT (Environmental Satellite) Advanced Synthetic Aperture Radar (ASAR) data for mapping an agricultural area in a sub-tropical cloud-prone and rainy area of Pearl River Delta in south China. A total of six scenes of HH (radio waves transmitted and received in horizontal polarization) and VV (radio waves transmitted and received in vertical polarization) polarization ASAR data acquired from March to November 2006 were used for land cover classification. Meanwhile, four field surveys of 320 test sites were carried out simultaneously with ASAR image acquisition in May, July, September and November 2006. A decision tree classifier is used to classify seven main types of land cover features including sugarcane, banana fields, lotus ponds, fish ponds, mangrove wetland, seawater and buildings. As a result, a classification map of Nansha Island was generated with overall accuracy of 80% and a kappa coefficient of 77%. The results show that the multi-temporal and multi-polarization ASAR images can have good performance in separating the basic land cover categories in a sub-tropical cloud-prone and rainy area. The decision tree classifier is also approved to work efficiently on satellite SAR images with good classification accuracy. The analysis to get the best combination of radar scenes for the decision tree also proves that multi-temporal radar backscatter information received in the crop growth period is important in improving classification accuracy.
|
| [92] |
Textural-spectral feature-based species classification of mangroves in Mai Po Nature Reserve from Worldview-3 imagery [J].https://doi.org/10.3390/rs8020100 URL [本文引用: 1] 摘要
Magnetite is a type of iron ore and a valuable commodity that occurs naturally in black sand beaches in the Philippines. However, black sand mining often takes place illegally and increases the likelihood and magnitude of geohazards, such as land subsidence, which augments the exposure of local communities to sea level rise and to typhoon-related threats. Detection of black sand mining activities traditionally relies on word of mouth, while measurement of their environmental effects requires on-the-ground geological surveys, which are precise, but costly and limited in scope. Here we show that systematic analysis of remote sensing data provides an objective, reliable, safe, and cost-effective way to monitor black sand mining activities and their impacts. First, we show that optical satellite data can be used to identify legal and illegal mining sites and characterize the direct effect of mining on the landscape. Second, we demonstrate that Interferometric Synthetic Aperture Radar (InSAR) can be used to evaluate the environmental impacts of black sand mining despite the small spatial extent of the activities. We detected a total of twenty black sand mining sites on Luzon Island and InSAR ALOS data reveal that out of the thirteen sites with coherence, nine experienced land subsidence at rates ranging from 1.5 to 5.7 cm/year during 2007 2011. The mean ground velocity map also highlights that the spatial extent of the subsiding areas is 10 to 100 times larger than the mining sites, likely associated with groundwater use or sediment redistribution. As a result of this subsidence, several coastal areas will be lowered to sea level elevation in a few decades and exposed to permanent flooding. This work demonstrates that remote sensing data are critical in monitoring the development of such activities and their environmental and societal impacts.
|
| [93] |
Fortune. Status and trends of mangrove area worldwide[R]. Forest Resources Assessment Working Paper No. 63 .
|
| [94] |
Combining EO-1 Hyperion and Envisat ASAR data for mangrove species classification in Mai Po Ramsar Site, Hong Kong [J].https://doi.org/10.1080/01431161.2014.978034 URL 摘要
Mangrove habitat is one of the most highly productive ecosystems. The distribution of mangrove species acts as an inventory to formulate conservation management plans. This study explored the potential of combining hyperspectral (Earth-observing (EO)-1 Hyperion) and multi-temporal synthetic aperture radar (SAR) (Environmental Satellite (Envisat) ASAR) data, supported by in situ field surveys, to map mangrove species. Hyperspectral imaging captures a number of narrow contiguous spectral bands providing richer spectral details than those obtained from traditional broadband sensors. All-weather radar sensing allows continuous data acquisition and its signal penetrability can reveal canopy structural characteristics, which offer an additional data dimension that is not available in optical sensing. Through combining the two data types, this study achieved three objectives. First, facing the issue of dimensionality and limited field samples, feature selection techniques from computer science were adopted to select spectral and radar features that are crucial for mangrove species discrimination. Second, classification accuracy using various combinations of spectral and radar features was evaluated. Third, classification algorithms including maximum likelihood (ML), decision tree (DT), artificial neural network (ANN), and support vector machine (SVM) were used to estimate species distribution, and classification accuracy was compared. Results suggested that feature selection techniques are capable of identifying salient features in spectral and radar space that can effectively discriminate between mangrove species. Combining optical and radar data can improve classification accuracy. Among the classifiers, ANN produces more accurate and robust estimation.
|
| [95] |
Evaluating AISA hyperspectral imagery for mapping black mangrove along the South Texas Gulf coast [J].https://doi.org/10.14358/PERS.75.4.425 URL 摘要
Mangrove wetlands are economically and ecologically important ecosystems and accurate assessment of these wetlands with remote sensing can assist in their management and conservation. This study was conducted to evaluate airborne AISA+ hyperspectral imagery and image transformation and classification techniques for mapping black mangrove populations on the south Texas Gulf coast. AISA+ hyperspe...
|
| [96] |
Evaluation of the 2010 MODIS collection 5.1 land cover type product over China [J].https://doi.org/10.3390/rs70201981 URL 摘要
Although the MODIS Collection 5.1 Land Cover Type (MODIS v5.1 LCT) product is one of the most recent global land cover datasets and has the shortest updating cycle, evaluations regarding this collection have not been reported. Given the importance of evaluating global land cover data for producers and potential users, the 2010 MODIS v5.1 LCT product IGBP (International Geosphere-Biosphere Programme) layer was evaluated based on two grid maps at scales of 100-m and 500-m,which were derived by rasterizing the 2010 data from the national land use/cover database of China (NLUD-C). This comparison was conducted based on a new legend consisting of nine classes constructed based on the definitions of classes in the IGBP and NLUD-C legends. The overall accuracies of the aggregated classification data were 64.62% and 66.42% at the sub-pixel and pixel scales, respectively. These accuracies differed significantly in different regions. Specifically, high-quality data were obtained more easily for regions with a single land cover type, such as Xinjiang province and the northeast plain of China. The lowest accuracies were obtained for the middle of China, including Ningxia, Shaanxi, Chongqing, Yunnan and Guizhou. At the sub-pixel scale, relatively high producer and user accuracies were obtained for cropland, grass and barren regions; the highest producer accuracy was obtained for forests, and the highest user accuracy was obtained for water bodies. Shrublands and wetlands were associated with low producer and user accuracies at the sub-pixel and pixel scales, of less than 10%. Based on dominant-type reference data, the errors were classified as mixed-pixel errors and labeling errors. Labeling errors primarily originated from misclassification between grassland and barren lands. Mixed pixel errors increased as the pixel diversity increased and as the percentage of dominant-type sub-pixels decreased. Overall, mixed pixels were sources of error for most land cover types other than grassland and barren lands; whereas labeling errors were more prevalent than mixed pixel errors when considering all of the land cover data over China, due to the large amount of misclassification between the pure pixels of grassland and barren lands. Next, the accuracy of cropland/natural vegetation mosaics was assessed based on the qualitative (a mosaic of croplands, forests, shrublands, and grasslands) and quantitative (no single component composes more than 60% of the landscape) parts in the definition, which resulted in accuracies of 91.43% and less than 19.26%, respectively. These results are summarized with their implications for the development of the next generation of MCD12Q1 data and with suggestions for potential users of MCD12Q1 v5.1.
|
| [97] |
Remote monitoring of expansion of aquaculture ponds along coastal region of the Yellow River Delta from 1983 to 2015 [J].https://doi.org/10.1007/s11769-017-0926-2 URL [本文引用: 1] |
| [98] |
A mangrove recognition index for remote sensing of mangrove forest from space [J].
|
| [99] |
Mapping mangrove forests using multi-tidal remotely-sensed data and a decision-tree-based procedure [J].https://doi.org/10.1016/j.jag.2017.06.010 URL 摘要
Mangrove forests grow in intertidal zones in tropical and subtropical regions and have suffered a dramatic decline globally over the past few decades. Remote sensing data, collected at various spatial resolutions, provide an effective way to map the spatial distribution of mangrove forests over time. However, the spectral signatures of mangrove forests are significantly affected by tide levels. Therefore, mangrove forests may not be accurately mapped with remote sensing data collected during a single-tidal event, especially if not acquired at low tide. This research reports how a decision-tree -based procedure was developed to map mangrove forests using multi-tidal Landsat 5 Thematic Mapper (TM) data and a Digital Elevation Model (DEM). Three indices, including the Normalized Difference Moisture Index (NDMI), the Normalized Difference Vegetation Index (NDVI) and NDVI NDMI(the multiplication of NDVIby NDMI, L: low tide level, H: high tide level) were used in this algorithm to differentiate mangrove forests from other land-cover and land-use types in Fangchenggang City, China. Additionally, the recent Landsat 8 OLI (Operational Land Imager) data were selected to validate the results and compare if the methodology is reliable. The results demonstrate that short-term multi-tidal remotely-sensed data better represent the unique nearshore coastal wetland habitats of mangrove forests than single-tidal data. Furthermore, multi-tidal remotely-sensed data has led to improved accuracies using two classification approaches: i.e. decision trees and the maximum likelihood classification (MLC). Since mangrove forests are typically found at low elevations, the inclusion of elevation data in the two classification procedures was tested. Given the decision-tree method does not assume strict data distribution parameters, it was able to optimize the application of multi-tidal and elevation data, resulting in higher classification accuracies of mangrove forests. When using multi-source data of differing types and distributions to map mangrove forests, a decision-tree method appears to be superior to traditional statistical classifiers.
|

/
| 〈 |
|
〉 |
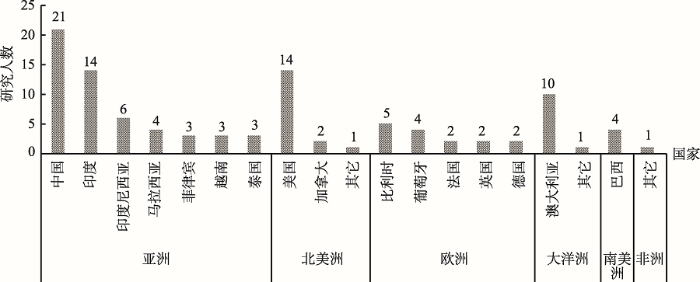
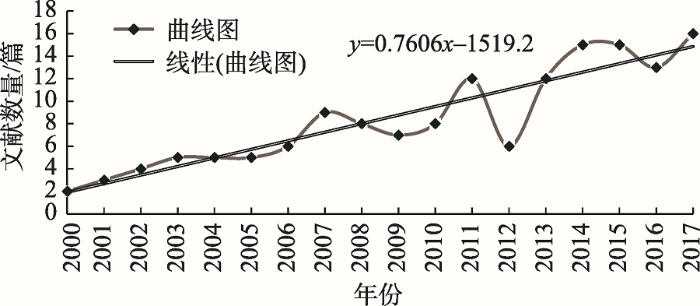
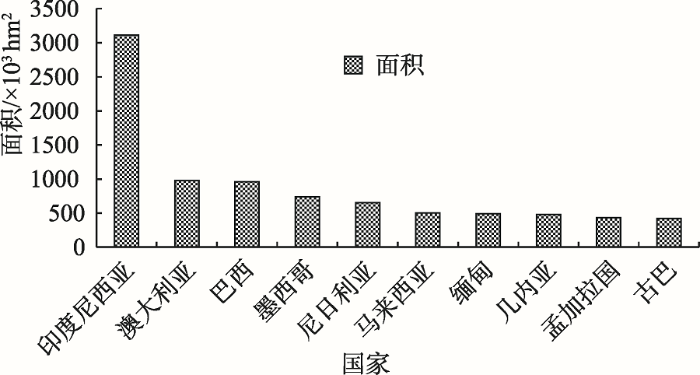
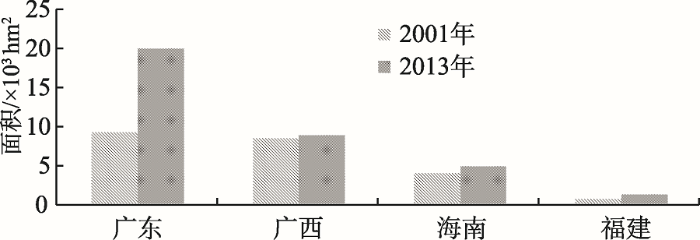