向超 , 朱翔, 胡德勇
XIANG Chao, ZHU Xiang, HU Deyong
通讯作者:
版权声明: 2018 《地球信息科学学报》编辑部 《地球信息科学学报》编辑部 所有
基金资助:
作者简介:
作者简介:向超(1974-),男,博士生,主要从事资源开发与区域可持续发展研究。E-mail: xiangchao2008cn@163.com
展开
摘要
不透水面是衡量城市化程度的重要指标之一,对京津唐城市群的不透水面进行深入研究,可以量化城市群扩张过程及其影响,对该区域多城市协调发展及规划布局具有重要意义。本文结合高分辨遥感影像、生长季及落叶季的Landsat TM遥感影像和夜间灯光数据等,采用分类和回归树(Classification and rRegression Tree, CART)算法,构建了适于京津唐地区不透水面盖度提取的技术方案,获取了京津唐地区1995-2016年共5期地表不透水面盖度专题信息,并分析了地表不透水面的时空演变规律,结论为:① 适于京津唐地区不透水面盖度提取的CART算法的最佳输入变量组合为:生长季和落叶季的Landsat TM图像以及对应的夜间灯光数据;其次为生长季Landsat TM遥感图像和夜间灯光数据组合方案。利用该组合方案,ISP估算输出结果的交叉验证精度R值可以达到约0.85,可以满足地表不透水面纵向对比分析的需要。② 从地表不透水面总面积数量值来看,1995-2016年京津唐主体城市区域整体上呈增长趋势,其中2011-2016年地表不透水面积增加愈加明显;③ 从地表不透水面盖度值的高低来看,1995-2016年京津唐中、高盖度不透水面的占比都是在不断增长的,低盖度不透水面占比存在少量下降现象,且京、津、唐3城市的主体城区各阶段变化差异较大,反映出了各城市扩张具有各自不同的时空演变特征。
关键词:
Abstract
Impervious surface refers to the surface unable to allow water to percolate through, such as pavements that are covered by impenetrable materials and rooftops. Increased impervious surface area is a consequence of urbanization. Impervious surface percent (ISP) is an indicator to quantify the urbanization level. Therefore, accurate mapping and estimation of ISP in Beijing-Tianjin-Tangshan urban agglomeration are significant for multi-city coordinated development and urban layout. Based on classification and regression tree (CART) algorithm, a technical scheme of extracting ISP which is suitable for Beijing-Tianjin-Tangshan urban agglomeration was constructed in this paper. High-resolution remote sensing data (i.e. QuickBird images), medium-resolution remote sensing data (i.e. Landsat TM images in leaf-on and leaf-off seasons), and nighttime light data were used as basic data in this scheme. Five-year ISP results from 1995 to 2016 were estimated to analyze the spatial-temporal evolution patterns of ISP using this scheme. The main conclusions are as follows: (1) The optimal input variables are the Landsat TM images in leaf-on and leaf-off seasons and the corresponding nighttime light data. Since the number of Landsat TM images in leaf-off season is less in line with the quality requirements, the alternative choice is to use the Landsat TM images in leaf-on season and the corresponding nighttime light data as the input variables. After the accuracy verification, the correlation coefficient (R) is about 0.85, which can meet the need of the comparison of ISP results between different years. (2) During 1995 to 2016, the total impervious surface area increased gradually in Beijing-Tianjin-Tangshan urban agglomeration. Within the period, the most dramatic growth was between the year 2011 and 2016. (3) ISP results were divided into areas with high-, medium- and low-density impervious cover. During 1995 to 2016, the high-density and medium-density impervious cover increased gradually in Beijing-Tianjin-Tangshan urban agglomeration, while the low-density impervious cover decreased slightly. The changes of ISP results in each stage were significantly different among cities of Beijing, Tianjin and Tangshan. It shows that the spatial-temporal evolution patterns are different in the process of urban expansion of each city.
Keywords:
不透水面是指诸如屋顶、沥青或水泥道路以及停车场等具有不透水性的地表面[1]。作为城市化过程中人为改造地表的产物,其面积占比在很大程度上影响着区域生态环境质量,并主导着城市景观格局演变过程[2,3]。地表不透水面面积、盖度和空间格局在一定程度上能够代表城镇化的程度,因此准确提取不透水面具有十分重要的意义。
对地观测技术的快速发展,为大区域不透水面制图提供了技术支撑。长期对地观测、运行时间最久的Landsat系列遥感数据,为陆地地表的长期观测提供了宝贵的数据源[4],但由于空间分辨率的限制和城市地表构成的复杂性,使得影像单个像元中往往包含有多种地物,形成混合像元[5]。若能提取每个像元内不透水面所占的百分比(impervious surface percent, ISP)信息,即不透水面盖度,则能够有效地实现地表不透水面覆盖程度的专题信息提取。
目前,ISP遥感估算方法主要有多元回归法[6,7]、人工神经网络法[8,9,10]、决策树方法[11,12]、光谱混合模型[13,14,15]等。其中,决策树方法通过一系列树形结构的决策规则来建立ISP预测模型,决策树在连续变量回归问题中具有非线性学习能力,且实现简单,运算效率高。分类与回归树分析(Classification and Regression Tree, CART)是一种通用的决策树构建算法,它可以实例化为各种不同的决策树,当因变量或目标变量为离散的分类类别值时称为分类树,而为连续值时称为回归树[16]。CART继承了一般决策树具备的所有优点,既可以用于分类研究,又能够进行连续变量的预测和回归[17,18],它在美国地质调查局的地学分析和监测计划中得到了成功应用和推广,获取的不透水层数据已加入美国国家土地覆盖数据库[19,20,21]。CART算法在不透水面盖度提取中具有较好的应用价值,但也因研究区的不同,需要通过本地化验证和分析实验,对比结果,选择适宜研究区的最佳输入变量。
本文基于CART算法,综合利用中、高分辨率遥感数据,构建不同的回归树输入变量,对预测模型及其预测结果进行对比分析,选取出适用于典型温带半干旱地区的ISP提取方法,并提出适于植被覆盖年内变化较大区域的长时序ISP制图方案,将其应用于1995-2016年京津唐地区的ISP提取,并采用统计分析方法分析近20年来京津唐地区不透水面变化情况。
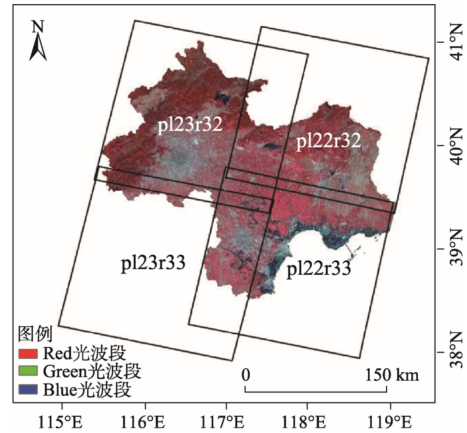
研究区包括京津唐三市范围,总面积约为4.2万km2,总人口约为2579.8万。涵盖以首都北京、中央直辖市天津和河北工业城市唐山为核心的华北平原东北部区域,位于38°25′ ~41°5′ N,115°25′ ~119°25′ E之间(图1)。
图1 研究区及Landsat TM影像景幅、标准假彩色合成示意图
Fig. 1 The study area and examples of Landsat TM images
研究区东临渤海,北部为燕山山脉,西部为太行山山脉。地势自北向南倾斜,北部山地属于低山丘陵地带,一般海拔在200~1000 m之间,南部属于华北平原地带,平均海拔较低,约为20~60 m之间[22]。
研究区位于暖温带半湿润气候区,受季风影响明显,夏季高温多雨,冬季寒冷干燥,年平均气温为10~14 ℃。地表植物冬枯夏荣,季相变化十分鲜明。研究区内主要土地利用类型有城镇和居民用地、林地、荒草地、农用地、裸露土地、水域等,整个研究区内各种地物类型交错分布,地块较为细碎。
本研究所用的数据及其特性如表1所示。其中,选择Landsat系列影像作为ISP制图的主要数据源,使用夏季影像代表生长季数据,冬季影像代表落叶季数据。包含整个京津唐城市群,需要4景影像产品(p122r32, p122r33, p123r32和p123r33)。为挑选卫星过境时研究区上空晴朗无云,影像质量较好的数据以满足建模需求,因此非同一轨道的影像之间的时相会存在少量月份的差距。选取了同期覆盖研究区的高分辨率多光谱遥感影像(QuickBird,分辨率为2.4 m)作为地物目视判读的参考数据,同时也是ISP训练数据的主要数据源。影像数据无云,成像质量较好。
表1 本研究所用数据及其特性
Tab. 1 Data used in this study
| 数据集 | 影像获取日期 | |||||
|---|---|---|---|---|---|---|
| 年份 | 行列号(列/行) | |||||
| 122/32 | 122/33 | 123/32 | 123/33 | |||
| 遥感数据 | Landsat 5 TM/ Landsat 7 ETM+(*) | 1995 | 1995-04-02 | 1995-04-18 | 1995-09-16 | 1995-09-16 |
| 2001 | 2001-09-17 | 2001-09-01 | 2001-05-19(*) | 2001-05-27(*) | ||
| 2001-08-31 | 2001-08-31 | |||||
| 2005 | 2005-08-19 | 2005-08-19 | 2005-05-06 | 2005-05-06 | ||
| 2005-11-14 | 2005-11-14 | |||||
| 2011 | 2010-04-27 | 2010-04-27 | 2011-06-08 | 2011-06-08 | ||
| Landsat 8 OLI | 2015 | 2015-03-24 | 2015-03-24 | 2014-09-04 | 2014-09-04 | |
| 2016-05-13 | 2016-05-13 | 2015-02-11 | 2015-02-11 | |||
| QuickBird | 2005年 | |||||
| DMSP/OLS | 1 km空间分辨率的夜间灯光数据(1995-2011年) | |||||
| Suomi NPP/VIIRS | 500 m空间分辨率的夜间灯光数据(2016年) | |||||
| 地形数据 | ASTER GDEM (30 m空间分辨率) | |||||
| 其他 | 县区级的行政区划数据 | |||||
另外,还收集了覆盖整个研究区的辅助数据,包括DMSP/OLS(Defense Meteorological Satellite Program/Operational Linescan System)夜间灯光数据、Suomi NPP/VIIRS(Suomi National Polar-orbiting Partnership/Visible Infrared Imaging Radiometer suite)夜间灯光数据、ASTER GDEM(Advanced Spaceborne Thermal Emission and Reflection RadiOmeter Global Digital Elevation Model)数字高程模型数据(分辨率为30 m)以及由其提取的坡度数据。为了便于后续处理,对上述影像数据进行了预处理。首先对QuickBird影像和Landsat系列影像进行了精确的几何配准,然后经投影和坐标转换后统一到UTM/WGS-84(Universal Transverse Mercator Projection/World Geodetic System-84)投影坐标系下,其次对夜间灯光数据进行重采样。因模型输入变量选择的需要,对LandsatTM影像进行进一步的信息提取:① 对Landsat TM影像进行缨帽变换提取出亮度、绿度和湿度;② 提取归一化植被指数(Normalized Difference Vegetation Index, NDVI)和归一化水体指数(Normalized Difference Water Index, NDWI)。
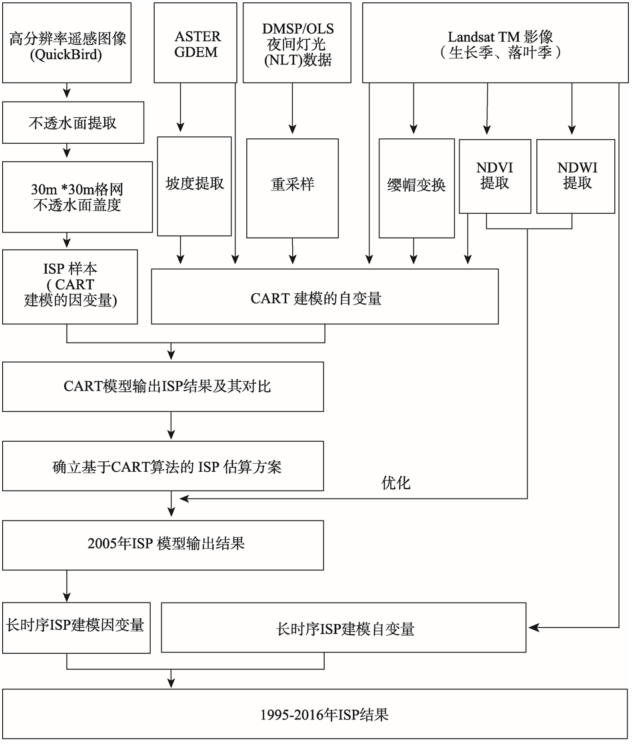
集成CART算法和多源遥感数据估算长时序ISP主要包括以下几步:① 训练数据和验证数据的生成,包括CART建模的因变量(ISP样本)和自变量(如Landsat TM图像、坡度、NDVI、夜间灯光数据等)数据集;② 输入变量的选择与优化:开展不同变量组合方案ISP估算精度对比,选择适合研究区的变量组合方案;③ 开展基期(本文定为2005年度,其他年度依托基期进行推演)研究区ISP估算和制图,包括输出结果的分析和精度验证;④ 长时序ISP制图,如图2所示。
图2 长时序ISP估算和制图的技术流程图
Fig. 2 The procedure of long-term ISP evaluating and mapping
CART算法是一种二分递归分割的过程,将每个母节点分割成两个子节点,此过程不断重复,每个子节点都作为潜在的母节点继续分割,最终形成结构简洁的二叉树。CART在分割的过程中以大量的训练数据为基础产生一系列的规则集,每一种规则都定义了多元线性回归模型建立的条件,以此为基础来进行离散目标的分类和连续变量的回归预测。它既允许连续变量的输入也能够进行离散变量的输入,相比于简单的线性回归模型来说具有更好的分类和回归精度与预测能力[23,24]。
构建基于CART算法的估算模型,其关键是确定输入变量。为了选择适合京津唐地区地表不透水面盖度制图的最佳输入变量,通过设计对比方案,共尝试了14种变量组合,不同变量组合方案如表2所示。
表2 14种对比方案中输入变量组合方式
Tab. 2 Fourteen schemes with different input variables
| 方案 | 1 | 2 | 3 | 4 | 5 | 6 | 7 | 8 | 9 | 10 | 11 | 12 | 13 | 14 |
|---|---|---|---|---|---|---|---|---|---|---|---|---|---|---|
| onb1-7 | √ | √ | √ | √ | √ | |||||||||
| offb1-7 | √ | √ | √ | √ | √ | |||||||||
| onb145 | √ | √ | ||||||||||||
| offb145 | √ | |||||||||||||
| onb1456 | √ | √ | √ | √ | √ | √ | ||||||||
| offb1456 | √ | √ | √ | |||||||||||
| onNDVI | √ | √ | ||||||||||||
| offNDVI | √ | |||||||||||||
| onTC | √ | √ | ||||||||||||
| offTC | √ | √ | ||||||||||||
| light | √ | √ | √ | √ | √ | √ | √ | √ | √ | √ | √ | |||
| DEM | √ | |||||||||||||
| slope | √ |
主要使用3个指标来对CART模型的估算效果进行评估,包括平均误差(AE)、相对误差(RE)和相关系数(R),表达式如下:
式中:N为样本个数;p(xi)为得到的预测值;yi为与预测对应的实际值;AP为得到的预测值的平均值。
以上3个统计度量值被用来评估所构建14种不同模型的估算质量。在本文研究中,CART算法的实现采用的是Rulequest公司的数据挖掘工具软件Cubist。Cubist的另一个特征是运用n倍交叉验证来估算预测精度,运用这一个选项可将训练样本集划分为n块,依次轮流对每一块进行验证,剩下的块用来建立模型,保留的块用来测试验证[25]。
针对长时序ISP估算的推广方法分2种情况:① 由前期ISP推后期ISP:以2011年ISP估算为例,在前期2005年ISP估算基础上,利用夜间灯光数据设定合适的阈值,滤掉夜间灯光指数较低的区域,利用保留的高值区的ISP作为CART算法的因变量,训练得到后期2011年的ISP结果;② 由后期ISP推前期ISP:以2001年ISP估算为例,在后期2005年ISP估算的基础上,利用夜间灯光数据设定合适的阈值,滤掉夜间灯光指数较高的区域,利用保留中低值区的ISP作为CART算法的因变量,训练得到前期2001年的ISP结果。具体规则形式如下:
输入:“2005年夜间灯光数据”和“2005年ISP”
规则:if “2005年夜间灯光数据”>20
then “2001年ISP训练样本”=“2005年ISP”
输出:“2001年ISP训练样本”
上述规则中,“2005年夜间灯光数据值>20”为通过目视判断和先验经验设定的阈值,用于过滤夜间灯光亮度低值区域,保留代表城市化程度较高的高值区,作为进一步建模的训练样本提取区域;“2001年ISP训练样本”为规则输出结果示意,它是用于进一步CART建模的因变量,用于估计基期前或者后的ISP数值。
表3列出了各变量组合模型平均误差、相对误差和相关系数。由表3可以看出,各变量组合的相关系数范围为0.81~0.86,平均误差范围为12.7%~15.2%,相对误差范围为0.39%~0.46%,由此可见各变量组合模型的评估指数相差甚微。为了进一步检验各模型的评估效果,将预测得到的城市不透水面盖度结果与同时期Google earth上的高分辨率影像进行对比分析,并通过目视解译判断其合理性。
表3 14种对比方案的模型输出精度评估结果及其对比
Tab. 3 Accuracy evaluation and comparison of the fourteen schemes
| 精度评价指标 | 1 | 2 | 3 | 4 | 5 | 6 | 7 | 8 | 9 | 10 | 11 | 12 | 13 | 14 |
|---|---|---|---|---|---|---|---|---|---|---|---|---|---|---|
| AE/% | 13.5 | 13.6 | 12.7 | 12.8 | 13.6 | 15.2 | 13.4 | 14.2 | 13.4 | 14.6 | 12.9 | 13.7 | 13.2 | 14 |
| RE/% | 0.41 | 0.42 | 0.39 | 0.39 | 0.41 | 0.46 | 0.41 | 0.43 | 0.41 | 0.45 | 0.4 | 0.42 | 0.4 | 0.43 |
| R | 0.84 | 0.84 | 0.86 | 0.86 | 0.84 | 0.81 | 0.85 | 0.83 | 0.85 | 0.81 | 0.86 | 0.84 | 0.85 | 0.83 |
对比发现,输入变量中包含不同季节影像的方案,其ISP结果在研究区耕地类型的表现较好。不同的耕作特征和植被物候会导致的不同时相耕地光谱表现的差异性,可通过使用不同季节的图像有效地体现出这种差异性,从而优化建模过程、提高模型预测精度,并有效地改善研究区ISP估计效果;而输入变量中包含夜间灯光数据的方案,能够有效改善由光谱相似性带来的裸露地表误分为不透水地表的现象。
综合考虑各变量组合模型的估算结果和遥感影像的可用性,最终选项方案4(即生长季和落叶季遥感图像、夜间灯光数据等3种数据组合方案)作为预测独立变量的组合;若没有较好质量的落叶季遥感影像可用,则可以独选生长季遥感影像(即选择方案5)。
预测独立变量确定后,将从高分辨率遥感影像上得到的30 m分辨率的ISP参考数据作为目标变量。将上述独立变量和目标变量输入模型中进行训练,建立最终ISP回归模型,得到2005年覆盖整个研究区的不透水面盖度分布图。
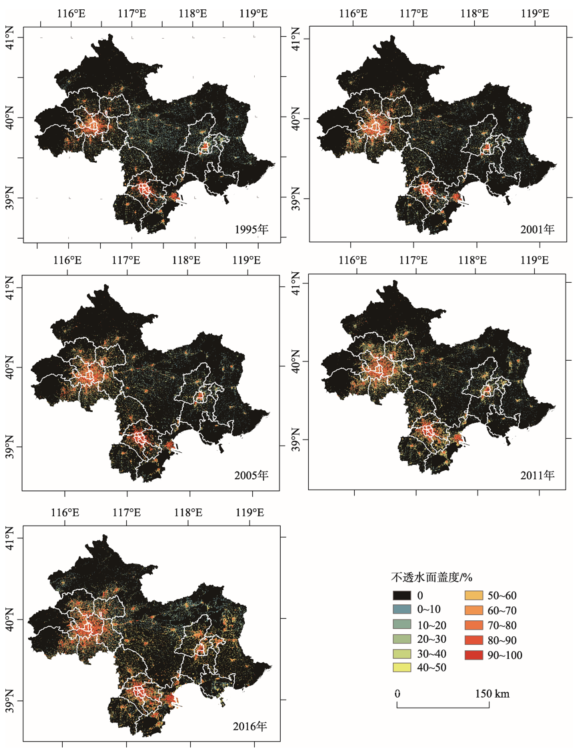
以2005年的ISP结果为基础,将其优化后作为模型因变量,1995、2001、2011和2016年的Landsat影像和夜间灯光数据作为自变量,估算得到1995、2001、2011和2016年覆盖整个研究区的不透水面盖度分布图,各年份京津唐城市群的不透水面盖度分布如图3所示。
为了验证长时序ISP制图方案的精度,将得到的不透水面盖度与高分辨影像计算得到不透水面盖度进行对比,绘制出真实值与估计值的散点图。图4为2005年的精度验证散点图,散点大都位于对角线附近,说明模型估计结果与真实值较为接近。
图3 1995-2016年京津唐城市群不透水面盖度分布图
Fig. 3 ISP results of Beijing-Tianjin-Tangshan urban agglomeration from 1995 to 2016
图4 2005年城市不透水面盖度精度评估散点图
Fig. 4 Scatter plot of the accuracy evaluation of ISP result in 2005
各年份具体精度评估结果如表4所示,从3个评价指标的定量分析和对比显示,本文所用方法估算得到的研究区ISP结果R值都在0.75以上,可以满足后续的纵向对比需要。
表4 长时序ISP制图方案精度评价结果
Tab. 4 Accuracy evaluation results of long-term ISP mapping
| 精度评价指标 | 1995年 | 2001年 | 2005年 | 2011年 | 2016年 |
|---|---|---|---|---|---|
| AE/% | 9.7 | 8.9 | 12.8 | 8.6 | 14.9 |
| RE | 0.41 | 0.36 | 0.39 | 0.44 | 0.43 |
| R | 0.75 | 0.8 | 0.86 | 0.76 | 0.76 |
(1)主体城区不透水面面积的变化及对比
依据各年份提取的不透水面盖度信息,即分辨率为30 m×30 m的不透水面盖度图,利用代表不透水面盖度的像元值乘以像元面积(900 m2),分别统计每个像元中不透水面的面积;再汇总各行政区划内部所有像元的不透水面面积,进而求和得到各行政区划的不透水面面积。
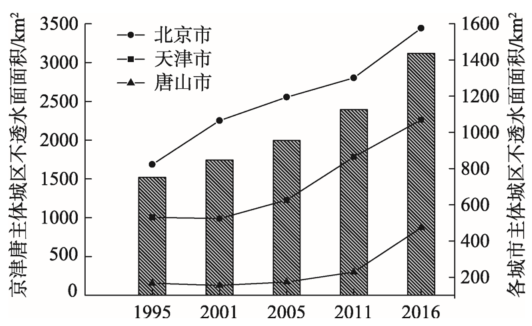
由统计得到的各市不透水面面积结果对比可知,从1995-2016年京津唐地区不透水面范围在不断增加。为进一步定量分析不透水面范围变化程度,分别对1995、2001、2005、2011和2016年的京津唐地区主体城市的不透水面面积进行了统计,统计结果如图5所示。
图5 京津唐主体城区各年不透水地表面积
Fig. 5 Impervious surface area of Beijing-Tianjin-Tangshan urban agglomeration
京津唐主体城市区域不透水面面积自1995年以来呈梯度上升趋势,2016年达到面积最大,其中,2011-2016年,不透水面积明显增加。从区域上而言,主体城区不透水面面积由大到小依次为北京市、天津市和唐山市。北京市自1995-2016年整体不透水面面积增长速率大于天津市和唐山市,其中2011-2016年面积增长较多,总体增长了752.4 km2。天津市1995-2005年不透水面面积增长较小,2005年以后增长较多,2016年天津市主体城区不透水面面积达到1069.8 km2,约为1995年的2倍;唐山市1995-2011年不透水面面积无明显变化,2011-2016年有明显增长,面积扩大约3倍。总体来讲,京津唐主体城区不透水面面积呈上升趋势,对比来讲,北京市不透水面面积最大,扩展速度最快,天津市2005年之后面积增加速度加快,而唐山市在2011年之后不透水面面积明显增加。
此外,统计各年份不透水面盖度的均值和标准差,如表5所示。从1995-2016年城市地表不透水面盖度均值整体呈上升趋势而标准差呈逐年下降的趋势,说明京津唐地区城市不透水面盖度有所增加,但其分布的离散程度在减弱。
表5 京津唐地区各年份城市不透水面盖度均值及标准差
Tab. 5 Mean value and standard deviation of ISP in different years of Beijing-Tianjin-Tangshan urban agglomeration
| 1995年 | 2001年 | 2005年 | 2011年 | 2016年 | |
|---|---|---|---|---|---|
| 均值/% | 49.72 | 50.47 | 53.87 | 52.03 | 57.17 |
| 标准差/% | 31.98 | 30.47 | 29.73 | 27.84 | 27.86 |
(2)京津唐地区不透水面盖度的变化及对比
为进一步对比不透水面盖度在空间形态上的变化,将城市不透水面盖度数据重新归为3类,低盖度不透水面(10%~60%)、中盖度不透水面(60%~80%)和高盖度不透水面(80%~100%),以探讨各市的城市扩展方式。
从图6可以看出,从1995-2016年北京、天津和唐山中盖度不透水面和高盖度不透水面的面积都是在不断增长的,低盖度不透水面存在少量下降现象。此外,还可以看出3个城市区域的各类别不透水面盖度的面积分布是有一定差别。
(1)北京市中盖度和高盖度不透水面面积相对较小。1995-2011年,北京市各级不透水面盖度呈上升趋势,其中低盖度不透水面增长明显,中盖度和高盖度不透水面面积变化不大,均在300~600 km2之间,说明此期间,北京市城市扩张主要以低盖度扩展为主,城市外围不断出现由自然地表到人工地表的转换,城市建成区范围逐步扩张。2011年之后,北京市低盖度不透水面面积有所下降,而中盖度和高盖度不透水面面积明显增长,变化幅度增大,不透水面盖度由低向中高盖度变化,城市紧凑度不断提高。
图6 京津唐城市群各市各盖度不透水面积
Fig. 6 Impervious surface area of different categories in Beijing-Tianjin-Tangshan urban agglomeration
(2)天津市低盖度不透水面和高盖度不透水面的面积比较大,中盖度不透水面面积较少,呈U型分布,各盖度不透水面整体上呈现增长趋势,天津市城市扩张中低盖度扩展和高盖度填充并重,外延扩展和内在填充稳定发展。2011年之后中盖度和高盖度不透水面面积相差不大,但低盖度不透水面积增加幅度较大,说明此期间城市扩张模式以城市外延扩展为主,天津市建成区范围扩张程度较大。
(3)唐山市不同类别的不透水面盖度面积差别较大,从低盖度不透水面到高盖度不透水面面积依次递减,低盖度不透水面面积比较高,逐年均匀增长趋势。低盖度不透水面面积远高于中、高盖度不透水面面积,说明唐山市内植被、裸土等透水面所占比例较高,极为密集的人工地表较少。1995-2011年不透水面面积相对变化较小,2011年之后各类别不透水面面积均出现明显增长。
1995-2016年,是京津唐城市群城市化、城镇化快速发展的阶段。从各类别不透水面盖度的变化情况来看看:其不透水面范围及其强度增幅明显,呈快速“蛙跳式”蔓延发展。土地利用类型变化主要表现为:城市建成区范围的快速扩张以及农业生产用地的减少。与历史研究结果相符[26,27,28]。
不透水面的变化一定程度上能够反映城市空间扩张的情况。1995-2016年,北京、天津、唐山的不透水面虽然整体上都呈现增长的趋势,但从不同类别不透水面盖度的变化情况上来看,各城市空间扩张特征存在一定的差异,造成这些差异的原因可能来自自然地理环境、经济发展水平、人口增长、基础设施建设以及政策与规划等因素。
利用CART模型,以QuickBird高分辨遥感图像、生长季及落叶季的Landsat TM遥感图像和夜间灯光数据等为数据源,构建了适于京津唐地区不透水面盖度提取的技术方案,获取了京津唐地区1991-2016年的长时序地表不透水面盖度结果,并对其变化特征进行了分析和对比,结论如下:
(1)针对京津唐地区的地表不透水面盖度提取,构建了基于CART算法估算技术方案,其最佳输入变量组合为:生长季和落叶季的Landsat TM图像以及对应的夜间灯光数据;其次为生长季Landsat TM遥感图像和夜间灯光数据组合方案。利用该组合方案,ISP估算输出结果的交叉验证精度R值可以达到约0.85,可以满足地表不透水面纵向对比分析的需要。
(2)从地表不透水面面积来看,1995-2016年京津唐主体城市区域整体上呈增长趋势,其中2011-2016年地表不透水面积增加愈加明显。
(3)从地表不透水面盖度来看,1995-2016年京津唐中、高盖度不透水面的占比都是在不断增长的,低盖度不透水面占比存在少量下降现象。1995-2011年,北京市各级不透水面盖度呈上升趋势,其中低盖度不透水面增长明显,中盖度和高盖度不透水面面积变化不大。2011年后,北京市低盖度不透水面占比有所下降,而中盖度和高盖度不透水面面积明显增长,变化幅度增大;天津市1995-2005年低、高盖度不透水面的面积占比比较大,中盖度不透水面面积较少。2011年后中、高盖度不透水面面积占比相差不大;唐山市不同类别的不透水面盖度面积差别较大,从低盖至高不透水面占比依次递减,1995-2011年各级盖度不透水面占比缓慢增长,2011年后各类别不透水面占比均出现明显增长。
The authors have declared that no competing interests exist.
| [1] |
Impervious surface coverage: The emergence of a key environmental indicator [J].https://doi.org/10.1080/01944369608975688 URL [本文引用: 1] |
| [2] |
Urban landscape pattern study based on sub-pixel estimation of impervious surface [J].
The urban impervious surface(IS)refers to any nonporous land cover that prevents water from infiltrating into sub-surface layers,e.g.,buildings,roads,parking lots,sidewalks,and other built surfaces.In addition to its use as an indicator of environmental influences,IS has also been applied to determine the spatial extent,intensity,and type of urban land use/cover changes.In recent years there has been increased interest in the use of classification and regression tree model(CART)technology to map sub-pixel impervious surfaces.This process uses medium-resolution Landsat imagery to extrapolate IS over large-scale areas with high-resolution imagery as training data to represent the urban land-cover heterogeneity.The main advantage of the regression tree algorithm is that it can account for non-linear relations between predictive and target variables,and thus allows both continuous and discrete variables to be used as input(predictive)data.The distribution of impervious surface index(ISI)distribution was deriveded fom Landsat Thematic Mapper(TM)and Enhanced Thematic Mapper Plus(ETM+)data by comparing it with CART and multi-stepwise regression(MSR).The results demonstrated that CART provided with the correlation coefficient of 0.94 and the average error of 8.59% with consistent and acceptable accuracy,which was better than MSR.The average ISI value for the total study area was 20.80% with standard deviation of 0.29.However,in most grids(58.60%)the average ISI was less than 10%.ISI percentage values in different regions also varied dramatically ranging from 67.32% in Zone 1 to 9.32% in Zone 6.Further,the spatial distribution patterns of IS exhibited spatial gradients increasing in value from the city outskirts to the inner urban areas.Utilizing ISI a new landscape classification system was developed,composed of the following four categories:natural cover(ISI鈮10%),low-density urban(10 ISI鈮40),medium-density urban(41ISI鈮60),and high-density urban(ISI60).The results of landscape pattern analysis demonstrate that high-density urban is the dominant landscape within the 4th ring-road covering 67.41% of the surface area,while natural cover is the dominant form of land cover outside the 5th ring-road.Landscape patterns varied extremely with landscape fragmentation index and average patch area,and the average area of natural cover exhibits a U shape as you moved from the inner urban area to the outskirts.It can be concluded that ISI is able to serve as a useful indicator for landscape classification and landscape pattern analysis.
|
| [3] |
Impacts of landscape structure on surface urban heat islands: A case study of Shanghai, China [J].https://doi.org/10.1016/j.rse.2011.07.008 URL [本文引用: 1] 摘要
Urbanization is taking place at an unprecedented rate around the world, particularly in China in the past few decades. One of the key impacts of rapid urbanization on the environment is the effect of urban heat island (UHI). Understanding the effects of landscape pattern on UHI is crucial for improving the ecology and sustainability of cities. This study investigated how landscape composition and configuration would affect UHI in the Shanghai metropolitan region of China, based on the analysis of land surface temperature (LST) in relation to normalized difference vegetation index (NDVI), vegetation fraction (Fv), and percent impervious surface area (ISA). Two Landsat ETM+ images acquired on March 13 and July 2, 2001 were used to estimate LST, Fv, and percent ISA. Landscape metrics were calculated from a high spatial resolution (2.5聽脳聽2.5聽m) land-cover/land-use map. Our results have showed that, although there are significant variations in LST at a given fraction of vegetation or impervious surface on a per-pixel basis, NDVI, Fv, and percent ISA are all good predictors of LST on the regional scale. There is a strong negative linear relationship between LST and positive NDVI over the region. Similar but stronger negative linear relationship exists between LST and Fv. Urban vegetation could mitigate the surface UHI better in summer than in early spring. A strong positive relationship exists between mean LST and percent ISA. The residential land is the biggest contributor to UHI, followed by industrial land. Although industrial land has the highest LST, it has limited contribution to the overall surface UHI due to its small spatial extend in Shanghai. Among the residential land-uses, areas with low- to-middle-rise buildings and low vegetation cover have much high temperatures than areas with high-rise buildings or areas with high vegetation cover. A strong correlation between the mean LST and landscape metrics indicates that urban landscape configuration also influences the surface UHI. These findings are helpful for understanding urban ecology as well as land use planning to minimize the potential environmental impacts of urbanization.
|
| [4] |
Annual dynamics of impervious surface in the Pearl River Delta, China, from 1988 to 2013, using time series Landsat imagery [J].https://doi.org/10.1016/j.isprsjprs.2016.01.003 URL [本文引用: 1] 摘要
Information on impervious surface distribution and dynamics is useful for understanding urbanization and its impacts on hydrological cycle, water management, surface energy balances, urban heat island, and biodiversity. Numerous methods have been developed and successfully applied to estimate impervious surfaces. Previous methods of impervious surface estimation mainly focused on the spectral differences between impervious surfaces and other land covers. Moreover, the accuracy of estimation from single or multi-temporal images was often limited by the mixed pixel problem in coarse- or medium-resolution imagery or by the intra-class spectral variability problem in high resolution imagery. Time series satellite imagery provides potential to resolve the above problems as well as the spectral confusion with similar surface characteristics due to phenological change, inter-annual climatic variability, and long-term changes of vegetation. Since Landsat time series has a long record with an effective spatial resolution, this study aimed at estimating and mapping impervious surfaces by analyzing temporal spectral differences between impervious and pervious surfaces that were extracted from dense time series Landsat imagery. Specifically, this study developed an efficient method to extract annual impervious surfaces from time series Landsat data and applied it to the Pearl River Delta, southern China, from 1988 to 2013. The annual classification accuracy yielded from 71% to 91% for all classes, while the mapping accuracy of impervious surfaces ranged from 80.5% to 94.5%. Furthermore, it is found that the use of more than 50% of Scan Line Corrector (SLC)-off images after 2003 did not substantially reduced annual classification accuracy, which ranged from 78% to 91%. It is also worthy to note that more than 80% of classification accuracies were achieved in both 2002 and 2010 despite of more than 40% of cloud cover detected in these two years. These results suggested that the proposed method was effective and efficient in mapping impervious surfaces and detecting impervious surface changes by using temporal spectral differences from dense time series Landsat imagery. The value of full sampling was revealed for enhancing temporal resolution and identifying temporal differences between impervious and pervious surfaces in time series analysis.
|
| [5] |
Remote sensing of impervious surfaces in the urban areas: Requirements, methods, and trends [J].https://doi.org/10.1016/j.rse.2011.02.030 URL [本文引用: 1] 摘要
78 Comprehensive review on methods to extract, estimate and map impervious surfaces. 78 Discussions on the mapping requirements of urban impervious surfaces. 78 Problems and prospects in remote sensing of impervious surfaces in the urban areas. 78 Impact of new sensing systems on the models and algorithms in urban remote sensing. 78 First to discuss about research traditions in urban remote sensing.
|
| [6] |
Estimating landscape imperviousness index from satellite imagery [J].https://doi.org/10.1109/LGRS.2005.853929 URL [本文引用: 1] 摘要
This letter presents a practical method for landscape imperviousness estimation through the synergistic use of Landsat Enhanced Thematic Mapper Plus (ETM+) and high-resolution imagery. A 1-m resolution color-infrared digital orthophoto was used to calibrate a stepwise multivariate statistical model for continuous landscape imperviousness estimation from medium-resolution ETM+ data. A variety of predictive variables were initially considered, but only brightness and greenness images were retained because they were account for most of the imperviousness variation measured from the calibration data. The performance of this method was assessed, both visually and statistically. Operationally, this method is promising because it does not involve any more sophisticated algorithms, such as classification tree or neural networks, but offers comparable mapping accuracy. Further improvements are also discussed.
|
| [7] |
Integration of urban growth modelling products with image-based urban change analysis [J].https://doi.org/10.1080/01431161.2013.791760 URL [本文引用: 1] 摘要
Urban change detection using remotely sensed data has been extensively studied. One current application of detection products is the formulation of calibration data for urban change prediction models. As multi-temporal scenes become available and urban growth prediction models increase in popularity and accuracy, it is natural to envisage a bi-directional relationship where, in addition to detection products assisting prediction models, the prediction information acts as ancillary input to enhance spectral-based change detection products. This closed feedback loop has the potential to significantly increase the accuracy of both detection and prediction efforts. Consequently, our objective is to evaluate the integration of prediction information with spectral data for urban change monitoring. A case study was carried out in the Denver, Colorado metropolitan area. Probabilities of urban change generated from two existing urban prediction models (based on decision trees and logistic regression) are combined as additional information content with a Landsat Thematic Mapper (TM) scene. Detailed assessments at the pixel and block scales are implemented to evaluate urban change classification accuracy using different input data and training sample sizes. Results show that in pixel-based assessments, the fusion of decision tree change probabilities and TM spectral bands with sufficient training samples leads to improvements. In terms of overall accuracies, the improvement is 2.0-2.4%, from 87.3% (spectral-only model) and 87.7% (prediction probability model) to 89.7% for the fused model. Similarly, the corresponding kappa coefficients show increases of 0.07-0.08, from 0.60 for the spectral model and 0.61 for the urban prediction model to 0.68 for the fused model. Accuracies aggregated at the block scale present an approximate 2.1-4.3% increase when the fusion-based model is employed compared with the exclusive use of either spectral or prediction probability data, namely 87.6% (fused) vs 83.4% (spectral) and 85.7% (prediction). It is also important to state that the standard deviation of accuracies between blocks is significantly reduced by more than 3% (11.5% vs 14.9% and 14.7%), suggesting higher consistency in classification performance. This is a desirable attribute for subsequent use of these products, for example by the urban planning community. Statistical tests at the block scale also demonstrate that such improvements are significant. It is also observed that to receive the integration benefits, the remote sensing classifier needs a large but reasonable training data set size, while the prediction model should be based on advanced modelling methods. Further assessments on block accuracy with respect to urbanization conditions (i.e. urban presence and change sizes) indicate the ability of the fusion to address spectral limitations, especially in blocks with high relative change. These initial results encourage the expansion of spectral/prediction data fusion to other sites, modelling techniques, and input data.
|
| [8] |
Subpixel Analysis of Landsat ETM/sup+/Using Self-organizing Map(SOM) Neural Networks for Urban Land Cover Characterization [J].https://doi.org/10.1109/TGRS.2006.869984 URL [本文引用: 1] 摘要
This paper examines the subpixel analysis of Landsat ETM/sup +/ data to estimate the percent cover of impervious surface, lawn, and woody tree cover in typical urban/suburban landscapes. By combining Self-Organizing Map (SOM), Learning Vector Quantization (LVQ), and Gaussian Mixture Model (GMM) methods, the posterior probability of the various land cover components were estimated for each pixel as a means of subpixel analysis. The estimation of impervious surface and the differentiation of urban vegetation-grass versus woody tree cover-are the main objectives of this paper. Overall, the output estimates compared favorably with those obtained using higher spatial resolution aerial photograph and IKONOS satellite image and traditional hard classification techniques as independent reference. The SOM-LVQ-GMM model showed a moderate degree of similarity in the estimates of impervious surface [root mean-square errors (RMSEs) of </spl plusmn/12% for the aerial photo reference plots and </spl plusmn/18% for the IKONOS classified results at a 3/spl times/3 pixel scale]. The vegetation components of woody tree and grass cover had an RMSE of </spl plusmn/10% and 11% for the aerial photo reference plots and </spl plusmn/15% and 22% for the IKONOS classified results at a 3/spl times/3 pixel scale, respectively. While further work is needed to improve the partition of grass versus woody tree cover estimation, the SOM-LVQ-GMM approach was sufficient to effectively discriminate between those areas dominated by grass cover versus those with significant woody tree cover. The ability to separate the grass versus woody tree components in urban vegetation analysis provides a more nuanced view of urban ecosystems.
|
| [9] |
Fuzzy ARTMAP算法在城市不透水面估算中的应用研究 [J].
为了克服线性光谱混合分析模型 的缺陷,兼顾Landsat ETM+和Quickbird遥感数据多源信息及Fuzzy ARTMAP神经网络自适应学习的优势,提出了利用Fuzzy ARTMAP方法来估算城市不透水面覆盖度(ISP)。以武汉市为例,结果表明,与线性光谱混合分析模型相比,基于Fuzzy ARTMAP神经网络方法估算结果精度较高,与实际城市不透水面覆盖度分布范围一致。
Estimating impervious surfaces using the fuzzy artmap [J].
为了克服线性光谱混合分析模型 的缺陷,兼顾Landsat ETM+和Quickbird遥感数据多源信息及Fuzzy ARTMAP神经网络自适应学习的优势,提出了利用Fuzzy ARTMAP方法来估算城市不透水面覆盖度(ISP)。以武汉市为例,结果表明,与线性光谱混合分析模型相比,基于Fuzzy ARTMAP神经网络方法估算结果精度较高,与实际城市不透水面覆盖度分布范围一致。
|
| [10] |
Extraction of impervious features from spectral indices using artificial neural network [J].https://doi.org/10.1007/s12517-014-1492-x URL [本文引用: 1] 摘要
An urban area comprises a complex mix of diverse land cover types and materials. Urban ecology and environment is significantly influenced by the proportion of impervious cover that is increasing considerably with time due to the continuous influx of people into urban areas. Therefore, it is of vital importance to determine the spatiotemporal pattern and magnitude of urbanization. In the present study, we have employed a supervised backpropagation neural network in order to extract the impervious features using five spectral indices, such as one vegetation index—Soil-Adjusted Vegetation Index (SAVI), one water index—Modified Normalized Water Index (MNDWI), and three urban indices—Normalized Difference Built-up Index (NDBI), Built-up Index (BUI), and Index-Based Built-up Index (IBI). The study has been performed using Landsat Thematic Mapper data of November, 2011, of the rapidly urbanizing city of Ranchi, capital of Jharkhand state, India. Using different combinations of these spectral indices while keeping SAVI and MNDWI constant, seven composite images were built, and from each of these composites, impervious features were classified and its accuracy assessed with reference to high-resolution images provided by Microsoft Bing Imagery and adequate ground truthing. It was observed that along with SAVI and MNDWI, whenever IBI was used in any combination, it decreased the classification efficiency. On the other hand, NDBI and BUI, individually or when used together, discriminated the impervious features from the others with high accuracy with the combination of SAVI, MNDWI, and BUI achieving the highest accuracy of 90.1402%.
|
| [11] |
An approach for mapping large-area impervious surfaces: Synergistic use of Landsat 7 ETM+ and high spatial resolution imagery [J].https://doi.org/10.5589/m02-098 URL [本文引用: 1] |
| [12] |
Assessments of urban growth in the tampa bay watershed using remote sensing data [J].https://doi.org/10.1016/j.rse.2005.04.017 URL [本文引用: 1] 摘要
Urban development has expanded rapidly in the Tampa Bay area of west-central Florida over the past century. A major effect associated with this population trend is transformation of the landscape from natural cover types to increasingly impervious urban land. This research utilizes an innovative approach for mapping urban extent and its changes through determining impervious surfaces from Landsat satellite remote sensing data. By 2002, areas with subpixel impervious surface greater than 10% accounted for approximately 1800 km 2, or 27 percent of the total watershed area. The impervious surface area increases approximately three-fold from 1991 to 2002. The resulting imperviousness data are used with a defined suite of geospatial data sets to simulate historical urban development and predict future urban and suburban extent, density, and growth patterns using SLEUTH model. Also examined is the increasingly important influence that urbanization and its associated imperviousness extent have on the individual drainage basins of the Tampa Bay watershed.
|
| [13] |
Estimating impervious surface distribution by spectral mixture analysis [J].https://doi.org/10.1016/S0034-4257(02)00136-0 URL [本文引用: 1] 摘要
Estimating the distribution of impervious surface, a major component of the vegetation–impervious surface–soil (V–I–S) model, is important in monitoring urban areas and understanding human activities. Besides its applications in physical geography, such as run-off models and urban change studies, maps showing impervious surface distribution are essential for estimating socio-economic factors, such as population density and social conditions. In this paper, impervious surface distribution, together with vegetation and soil cover, is estimated through a fully constrained linear spectral mixture model using Landsat Enhanced Thematic Mapper Plus (ETM+) data within the metropolitan area of Columbus, OH in the United States. Four endmembers, low albedo, high albedo, vegetation, and soil were selected to model heterogeneous urban land cover. Impervious surface fraction was estimated by analyzing low and high albedo endmembers. The estimation accuracy for impervious surface was assessed using Digital Orthophoto Quarterquadrangle (DOQQ) images. The overall root mean square (RMS) error was 10.6%, which is comparable to the digitizing errors of DOQQ images. Results indicate that impervious surface distribution can be derived from remotely sensed imagery with promising accuracy.
|
| [14] |
北京城市不透水层覆盖度遥感估算 [J].https://doi.org/10.3969/j.issn.1001-070X.2007.03.003 URL Magsci [本文引用: 1] 摘要
应用线性光谱混合模型研究城市环境生物物理组成,端元的确定是其关键。城市地表同物异谱现象显著,光谱变异强烈,对于高反照率地物尤其突出。端元的光谱变异对线性光谱混合模型拟合结果产生重要影响。以同种纯净地物光谱曲线形状具有相似性为出发点,提出了一种端元优化选取方法,在此基础上计算了北京城市地表不透水层覆盖度。研究结果表明,该方法能够在一定程度上减小端元光谱变异性对线性光谱混合模型拟合结果的影响,进而提高城市不透水层覆盖度的估算精度。
Estimating impervious surfaces using the fuzzy artmap [J].https://doi.org/10.3969/j.issn.1001-070X.2007.03.003 URL Magsci [本文引用: 1] 摘要
应用线性光谱混合模型研究城市环境生物物理组成,端元的确定是其关键。城市地表同物异谱现象显著,光谱变异强烈,对于高反照率地物尤其突出。端元的光谱变异对线性光谱混合模型拟合结果产生重要影响。以同种纯净地物光谱曲线形状具有相似性为出发点,提出了一种端元优化选取方法,在此基础上计算了北京城市地表不透水层覆盖度。研究结果表明,该方法能够在一定程度上减小端元光谱变异性对线性光谱混合模型拟合结果的影响,进而提高城市不透水层覆盖度的估算精度。
|
| [15] |
Extraction of impervious surface in Hai Basin using remote sensing [J].https://doi.org/10.3724/SP.J.1011.2011.00403 URL [本文引用: 1] 摘要
Impervious surface coverage in a region is not only an indicator of the degree of urbanization but also a major indicator of environmental quality.Most of the existing methods of extracting impervious surface based on remote sensing concentrate on an urban scale,but the rapid and accurate methods of extracting impervious surfaces in a basin scale are nearly nonexistent in China and abroad.In this study,we used Landsat images acquired in same season covering the entire Hai Basin as data source,and generated a mask for removing the non-impervious surfaces using a land-use data set of roads,and urban,rural,and industrial land.Then,by selecting bright and dark vegetation endmember,high albedo and low albedo impervious surface endmember,and dry and wet soil endmember,we applied a Multiple Endmember Spectral Mixture Analysis(MESMA) model to extract impervious surfaces in the basin scale.The accuracy assessment results showed high accuracy,in that the mean relative error(MRE) and correlation coefficient(R) of all samples were 12.1% and 0.83,respectively,which indicated that the method of extracting impervious surfaces in a basin scale was feasible.
|
| [16] |
Classification and Regression Tree [M]. |
| [17] |
Maximizing land cover classification accuracies produced by decision trees at continental to global scales [J].https://doi.org/10.1109/36.752215 URL [本文引用: 1] 摘要
Abstract Classification of land cover from remotely sensed data at continental to global scales requires sophisticated algorithms and feature selection techniques to optimize classifier performance. The authors examine methods to maximize classification accuracies using decision trees to map land cover from multitemporal AVHRR imagery at continental and global scales. As part of their analysis they test the utility of -渂oosting-, a new technique developed to increase classification accuracy by forcing the learning (classification) algorithm to concentrate on those training observations that are most difficult to classify. Their results show that boosting consistently reduces misclassification rates by 20-50% depending on the data set in question, and that most of the benefit gained by boosting is achieved after seven boosting iterations. They also assess the utility of including phenological metrics and geographic position as additional features to the classification algorithm. They find that using derived phenological metrics produces little improvement in classification accuracy relative to using an annual time series of NDVI data, but that geographic position provides substantial power for predicting land cover types at continental and global scales. However, in order to avoid generating spurious classification accuracies using geographic position, training data must be distributed evenly in geographic space
|
| [18] |
Classification of remotely sensed imagery using stochastic gradient boosting as a refinement of classification tree analysis [J].https://doi.org/10.1016/j.rse.2004.01.007 URL [本文引用: 1] 摘要
Classification tree analysis (CTA) provides an effective suite of algorithms for classifying remotely sensed data, but it has the limitations of (1) not searching for optimal tree structures and (2) being adversely affected by outliers, inaccurate training data, and unbalanced data sets. Stochastic gradient boosting (SGB) is a refinement of standard CTA that attempts to minimize these limitations by (1) using classification errors to iteratively refine the trees using a random sample of the training data and (2) combining the multiple trees iteratively developed to classify the data. We compared traditional CTA results to SGB for three remote sensing based data sets, an IKONOS image from the Sierra Nevada Mountains of California, a Probe-1 hyperspectral image from the Virginia City mining district of Montana, and a series of Landsat ETM+ images from the Greater Yellowstone Ecosystem (GYE). SGB improved the overall accuracy of the IKONOS classification from 84% to 95% and the Probe-1 classification from 83% to 93%. The worst performing classes using CTA exhibited the largest increases in class accuracy using SGB. A slight decrease in overall classification accuracy resulted from the SGB analysis of the Landsat data.
|
| [19] |
Completion of the 2011 national land cover database for the conterminous united states representing a decade of land cover change information [J].https://doi.org/10.1016/S0099-1112(15)30100-2 URL [本文引用: 1] 摘要
The National Land Cover Database (NLCD) provides nationwide data on land cover and land cover change at the native 30-m spatial resolution of the Landsat Thematic Mapper (TM). The database is designed to provide five-year cyclical updating of United States land cover and associated changes. The recent release of NLCD 2011 products now represents a decade of consistently produced land cover and impervious surface for the Nation across three periods: 2001, 2006, and 2011 (Homer et al., 2007; Fry et al., 2011). Tree canopy cover has also been produced for 2011 (Coluston et al., 2012; Coluston et al., 2013). With the release of NLCD 2011, the database provides the ability to move beyond simple change detection to monitoring and trend assessments. NLCD 2011 represents the latest evolution of NLCD products, continuing its focus on consistency, production, efficiency, and product accuracy. NLCD products are designed for widespread application in biology, climate, education, land management, hydrology, environmental planning, risk and disease analysis, telecommunications and visualization, and are available for no cost at http://www.mrlc.gov. NLCD is produced by a Federal agency consortium called the Multi-Resolution Land Characteristics Consortium (MRLC) (Wickham et al., 2014). In the consortium arrangement, the U.S. Geological Survey (USGS) leads NLCD land cover and imperviousness production for the bulk of the Nation; the National Oceanic and Atmospheric Administration (NOAA) completes NLCD land cover for the conterminous U.S. (CONUS) coastal zones; and the U.S. Forest Service (USFS) designs and produces the NLCD tree canopy cover product. Other MRLC partners collaborate through resource or data contribution to ensure NLCD products meet their respective program needs (Wickham et al., 2014).
|
| [20] |
Updating the 2001 national land cover database impervious surface products to 2006 using landsat imagery change detection methods [J].https://doi.org/10.1016/j.rse.2010.02.018 URL [本文引用: 1] 摘要
A prototype method was developed to update the U.S. Geological Survey (USGS) National Land Cover Database (NLCD) 2001 to a nominal date of 2006. NLCD 2001 is widely used as a baseline for national land cover and impervious cover conditions. To enable the updating of this database in an optimal manner, methods are designed to be accomplished by individual Landsat scene. Using conservative change thresholds based on land cover classes, areas of change and no-change were segregated from change vectors calculated from normalized Landsat scenes from 2001 and 2006. By sampling from NLCD 2001 impervious surface in unchanged areas, impervious surface predictions were estimated for changed areas within an urban extent defined by a companion land cover classification. Methods were developed and tested for national application across six study sites containing a variety of urban impervious surface. Results show the vast majority of impervious surface change associated with urban development was captured, with overall RMSE from 6.86 to 13.12% for these areas. Changes of urban development density were also evaluated by characterizing the categories of change by percentile for impervious surface. This prototype method provides a relatively low cost, flexible approach to generate updated impervious surface using NLCD 2001 as the baseline.
|
| [21] |
Updating the 2001 National Land Cover Database land cover classification to 2006 by using Landsat imagery change detection methods .[J].https://doi.org/10.1016/j.rse.2009.02.004 URL [本文引用: 1] 摘要
The recent release of the U.S. Geological Survey (USGS) National Land Cover Database (NLCD) 2001, which represents the nation's land cover status based on a nominal date of 2001, is widely used as a baseline for national land cover conditions. To enable the updating of this land cover information in a consistent and continuous manner, a prototype method was developed to update land cover by an individual Landsat path and row. This method updates NLCD 2001 to a nominal date of 2006 by using both Landsat imagery and data from NLCD 2001 as the baseline. Pairs of Landsat scenes in the same season in 2001 and 2006 were acquired according to satellite paths and rows and normalized to allow calculation of change vectors between the two dates. Conservative thresholds based on Anderson Level I land cover classes were used to segregate the change vectors and determine areas of change and no-change. Once change areas had been identified, land cover classifications at the full NLCD resolution for 2006 areas of change were completed by sampling from NLCD 2001 in unchanged areas. Methods were developed and tested across five Landsat path/row study sites that contain several metropolitan areas including Seattle, Washington; San Diego, California; Sioux Falls, South Dakota; Jackson, Mississippi; and Manchester, New Hampshire. Results from the five study areas show that the vast majority of land cover change was captured and updated with overall land cover classification accuracies of 78.32%, 87.5%, 88.57%, 78.36%, and 83.33% for these areas. The method optimizes mapping efficiency and has the potential to provide users a flexible method to generate updated land cover at national and regional scales by using NLCD 2001 as the baseline.
|
| [22] |
|
| [23] |
Townshend J R G. A stepwise regression tree for nonlinear approximation: Application to estimating subpixel land cover [J].https://doi.org/10.1080/01431160305001 URL [本文引用: 1] 摘要
A stepwise regression tree (SRT) algorithm was developed for approximating complex nonlinear relationships. Based on the regression tree of Breiman et al . (BRT) and a stepwise linear regression (SLR) method, this algorithm represents an improvement over SLR in that it can approximate nonlinear relationships and over BRT in that it gives more realistic predictions. The applicability of this method to estimating subpixel forest was demonstrated using three test data sets, on all of which it gave more accurate predictions than SLR and BRT. SRT also generated more compact trees and performed better than or at least as well as BRT at all 10 equal forest proportion interval ranging from 0 to 100%. This method is appealing to estimating subpixel land cover over large areas.
|
| [24] |
Research and application of the decision tree classification using MODIS data [J].
Decision tree classification algorithms have significant potential in remote sensing data classification. In this research, two popular decision tree algorithms——CART and C4.5 are presented, and two techniques known as boosting and bagging in machine learning area are introduced. We examined these methods to maximize classification accuracies using these decision trees and techniques to map land cover of Huabei area in China from MODIS 250m data. The result indicates that decision tree with abundance training samples has higher classification accuracy than maximum likelihood classifier(MLC)in the land cover classification test, whereas insufficient samples resulted in a lower accuracy for decision tree than MLC. The result also shows CART algorithm has more advantageous than C4.5 algorithm in classification accuracy and tree structure. And the decision tree classification accuracy depends on the optimal structure and pruning process. We also tested the behaviour of boosting and bagging techniques combined with CART and the result shows that adding boosting technique to decision tree can increase classification accuracies by 18.5%—25.6% for the poorly separable classes in MLC.
|
| [25] |
Research and application of the decision tree classification using MODIS data [J].
Decision tree classification algorithms have significant potential in remote sensing data classification. In this research, two popular decision tree algorithms——CART and C4.5 are presented, and two techniques known as boosting and bagging in machine learning area are introduced. We examined these methods to maximize classification accuracies using these decision trees and techniques to map land cover of Huabei area in China from MODIS 250m data. The result indicates that decision tree with abundance training samples has higher classification accuracy than maximum likelihood classifier(MLC)in the land cover classification test, whereas insufficient samples resulted in a lower accuracy for decision tree than MLC. The result also shows CART algorithm has more advantageous than C4.5 algorithm in classification accuracy and tree structure. And the decision tree classification accuracy depends on the optimal structure and pruning process. We also tested the behaviour of boosting and bagging techniques combined with CART and the result shows that adding boosting technique to decision tree can increase classification accuracies by 18.5%—25.6% for the poorly separable classes in MLC.
|
| [26] |
Detection of urban expansion in an urban-rural landscape with multitemporalQuickBird images [J]. |
| [27] |
A 30-year (1984-2013) record of annual urban dynamics of Beijing City derived from Landsat data [J].https://doi.org/10.1016/j.rse.2015.06.007 URL [本文引用: 1] 摘要
61An annual sequence of urban land has been produced in Beijing over a 30-year period.61Many Landsat images have been employed to make full use of their temporal contexts.61A temporal consistency check was conducted to make the sequence more reasonable.61The growth rates are different in Beijing during the past three decades.
|
| [28] |
Seasonal land cover dynamics in beijing derived from Landsat 8 data using a spatio-temporal contextual approach [J].https://doi.org/10.3390/rs70100865 URL [本文引用: 1] 摘要
Seasonal dynamic land cover maps could provide useful information to ecosystem, water-resource and climate modelers. However, they are rarely mapped more frequent than annually. Here, we propose an approach to map dynamic land cover types with frequently available satellite data. Landsat 8 data acquired from nine dates over Beijing within a one-year period were used to map seasonal land cover dynamics. A two-step procedure was performed for training sample collection to get better results. Sample sets were interpreted for each acquisition date of Landsat 8 image. We used the random forest classifier to realize the mapping. Nine sets of experiments were designed to incorporate different input features and use of spatial temporal information into the dynamic land cover classification. Land cover maps obtained with single-date data in the optical spectral region were used as benchmarks. Texture, NDVI and thermal infrared bands were added as new features for improvements. A Markov random field (MRF) model was applied to maintain the spatio-temporal consistency. Classifications with all features from all images were performed, and an MRF model was also applied to the results estimated with all features. The best overall accuracies achieved for each date ranged from 75.31% to 85.61%.
|

/
| 〈 |
|
〉 |

