刘嘉慧 , 赵小锋, 林剑艺
LIU Jiahui, ZHAO Xiaofeng, LIN Jianyi
通讯作者:
收稿日期: 2017-09-26
修回日期: 2018-02-12
网络出版日期: 2018-07-20
版权声明: 2018 《地球信息科学学报》编辑部 《地球信息科学学报》编辑部 所有
基金资助:
作者简介:
作者简介:刘嘉慧(1992-),女,硕士生,主要从事城市环境遥感与GIS研究。E-mail: jhliu@iue.ac.cn
展开
摘要
人为热排放不仅是城市热岛形成的重要因子,而且是与能源消耗密切相关的指标,对其大小和变化特征进行分析有利于减缓城市热岛与节能减排。本文以厦门岛为研究区,利用2009年多时相的Landsat TM影像和地表能量平衡模型反演出不同季节的人为热排放,在此基础上结合IKONOS影像解译的城市功能区,分析不同类型城市功能区人为热排放的时空变化特征。结果表明:不同类型城市功能区的人为热排放均在夏季达到最大,春季最小;工业区的人为热排放一直高于其他类型的城市功能区;工业区人为热排放高值区主要集中厦门岛西部传统的重点工业区,交通区人为热排放高值区的空间分布与厦门岛“三纵四横”的交通干线分布格局相吻合,居住区人为热排放高值区主要集中在旧城区,商业及公共设施区人为热排放高值区主要集中在单体建筑大的商圈和公共设施;总体上厦门岛西部的人为热排放比东部要高。这种时空分布的差异性与用地类型、人口数量与经济发展程度密切相关,而且建筑物的密度、高度和下垫面的材料通过影响其他地表通量来改变人为热排放的大小。通过分析不同城市功能区人为热排放的时空变化特征,可以从更微观的角度理解城市热环境和能源利用现状,为促进城市可持续发展提供理论依据。
关键词:
Abstract
Anthropogenic heat discharge not only constitutes the cause of urban heat island (UHI) formation, but also is an important indicator related to energy consumption. It is important to analysis the magnitude and variation of anthropogenic heat discharge in order to mitigate UHI effect and improve energy efficiency. This paper examined the spatio-temporal variation of anthropogenic heat discharge in the Xiamen Island, China using Landsat TM data and meteorological data. First, the anthropogenic heat discharge was estimated with a remote sensing-based surface energy balance model. Then, the urban functional regions derived from IKONOS data were combined with the anthropogenic heat discharge. The results indicate that the anthropogenic heat discharge in different types of urban functional regions reaches the maximum in summer and the minimum in spring. The anthropogenic heat discharge of industrial area was higher than those in the other regions for all seasons. The high anthropogenic heat discharge occurred in the old industrial bases in the west of Xiamen Island. In traffic area, high anthropogenic heat discharge was observed in the Changan Road, Jiahe Road, Chenggong Avenue, Xianyue Road, North Hubin Road-Lvling Road, South Hubin Road-East Lianqian Road. In residential area, high anthropogenic heat discharge was observed in the old town. The high anthropogenic heat discharge occurred in the large single buildings in commercial and public area. Overall, the anthropogenic heat discharge in the western part of Xiamen Island was higher than that in the east. The differences of spatial and seasonal distribution were closely related to land cover types, population and the degree of economic development. Moreover, the density and height of the buildings and materials of land cover change the amount of anthropogenic heat discharge by affecting other surface fluxes. This paper brings a more microscopic perspective by analyzing the spatio-temporal variation of anthropogenic heat discharge in different urban functional regions to study urban thermal environment and energy utilization, as well as to provide a theoretical basis for promoting urban sustainable development.
Keywords:
随着城市中人类活动愈加频繁,城市热岛效应日益明显,对城市气候与环境、能源消耗和居民健康产生重要影响[1,2,3,4,5]。人为热排放是导致城市热岛效应的重要原因之一[6],它是指人们对能源的不充分利用而排放到周边环境中的废热[7,8]。研究表明人为热排放对城市热岛效应具有很大的贡献:东京地区的人为热排放使市中心白天的城市热岛强度增加1℃,夜晚强度增加2~3 ℃[9];费城的人为热排放在冬季可以使夜间城市热岛强度增加2~3 ℃[10];北京的人为热排放使白天城市中心温度增加0.5 ℃左右,夜晚增加1~3 ℃左右[11]。研究人为热排放的大小和时空变化规律,不仅有利于从生态环境的角度识别城市热污染源的空间分布及动态特征,而且可以从节能减排的角度反映城市中能源利用的水平。
国内外已有不少学者对不同尺度的人为热排放进行了定量研究[12,13,14,15,16,17],其研究方法可分为3类:能源消耗清单法、建筑物能耗模型法和地表能量平衡法。就城市尺度而言,相较于前面的两种方法,基于遥感的地表能量平衡法数据获取容易,而且根据所选遥感数据源能够估算出高分辨率的人为热排放,有利于发现人为热排放在城市内部的空间分布特征。Zhou等[15]使用ASTER 影像和地表能量平衡法,估算出Indianapolis地区夏季的人为热排放为32 W/m2,且人为热排放与建筑能耗的空间格局相一致;Kato等[16]利用ASTER 、 ETM+影像及气象数据对名古屋的人为热排放采用能量平衡余值法进行估算,结果显示,夏季的人为热排放在市中心超过100 W/m2,且冬夏两季人为热排放明显大于春秋两季,这同该地区的能耗变化相吻合;Wong等[17]基于地表能量平衡法利用HJ-1B对香港秋季和冬季的人为热排放进行估算,得到的平均人为热排放分别为289.16 W/m2和283.17 W/m2,而且人为热排放与建筑密度、建筑高度相关;Chakraborty等[18]基于地表能量平衡法分别利用Landsat 和 MODIS影像估算Delhi地区的人为热排放,得到不透水面人为热排放分别为38 W/m2和62 W/m2;肖捷颖等[19]利用Landsat TM数据对石家庄市的地表能量平衡进行分析,发现城市中心区人为热最高,高密度不透水面人为热排放均值为41.3 W/m2;朱婷媛[20]利用Landsat TM遥感影像,基于地表能量平衡方程,获取了杭州市不同年份的人为热排放的空间分布图,发现人为热排放随着城市化扩展方向在空间上不断扩张,而且在时间上与人口密度、GDP呈正相关关系。然而既有研究均是针对建成区的人为热排放特征进行分析,缺乏对于建成区内部不同类型城市功能区的人为热排放空间分布进行研究。城市功能区是建成区内部土地使用功能、利用强度、基准地价大体一致的区域,其集约利用程度和使用潜力也应基本相同[21]。从城市规划的视角来看,掌握建成区的人为热排放特征有助于从中观层面划定城市开发边界,防止建成区无限扩张;而分析城市功能区的人为热排放特征则是从微观层面针对具体的场所和地块落实相应规划政策,具有可执行性和实用性。定量研究城市功能区人为热排放的时空演变特征,是制定具体可行的城市热岛效应缓解措施和节能减排方案的基础。
本文以厦门岛为研究区,基于多时相Landsat TM影像,利用地表能量平衡法估算出不同季节的人为热排放,并利用IKONOS影像提取建成区内部不同城市功能区。在此基础上获得不同类型城市功能区的人为热排放,进而分析不同类型城市功能区人为热排放的时空变化特征。本研究对城市热环境分析、能源规划乃至于城市可持续发展有重要意义。
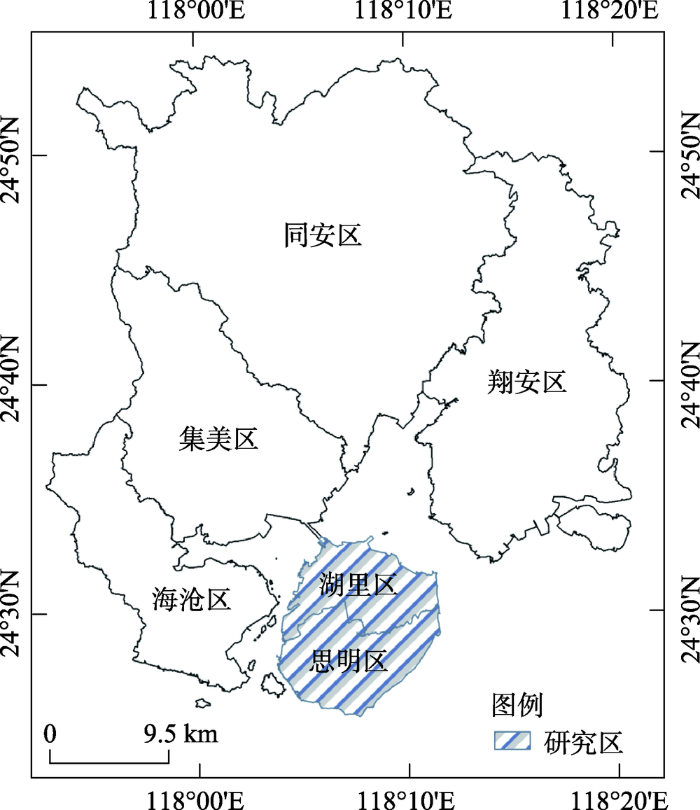
厦门市经纬度范围为117°53'~118°26' E、 24°23'~24°54' N,地处中国东南沿海,位于闽南金三角中部,与漳州、泉州相连,与金门岛隔海相望。地形以滨海平原、台地和丘陵为主,地势由西北山区向东南沿海倾斜;气候属于亚热带海洋性季风气候,年平均气温在21 ℃左右。市域由沿厦门湾的大陆部分和厦门岛、鼓浪屿等岛屿以及厦门湾海域组成,全市土地面积1699.39 km2,其中厦门岛土地面积132.5 km2(图1)。改革开放之后,经济的迅速发展,加快了厦门的城市化进程。1981年厦门建成区面积仅为12 km2,2009年扩大至212 km2。常住人口从2000年的205万增长至2009的330万,其中城镇人口为142 万人[22]。与此同时,城市热岛的空间范围也逐渐扩大[23,24],从而对居民生活和城市发展产生了重要的影响。考虑到IKONOS影像获取成本及处理分析等因素,本文选择厦门市主城区所在的厦门岛作为研究区。
本文所用遥感数据包括Landsat TM影像、GLASS数据产品和IKONOS 影像。Landsat TM影像来自于地理空间数据云(http://www.gscloud.cn/),影像获取时间分别为2009年1月13日(冬季)、2009年3月18日(春季)、2009年6月6日(夏季)和2010年10月31日(秋季)。卫星过境时的研究区上空无云,图像质量较高。GLASS数据产品包括下行短波辐射和光合有效辐射,来源于北京师范大学(http://glass-product.bnu.edu.cn),投影为Sinusoidal投影,空间分辨率为5 km,时间分辨率为3 h[25]。IKONOS 影像获取时间为2009年1月18日,共有4个波段,包括空间分辨率为4 m的3个多光谱波段及空间分辨率为1 m的全色波段。
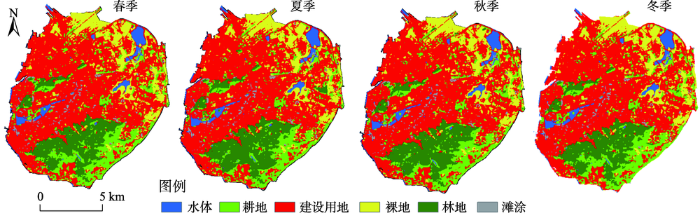
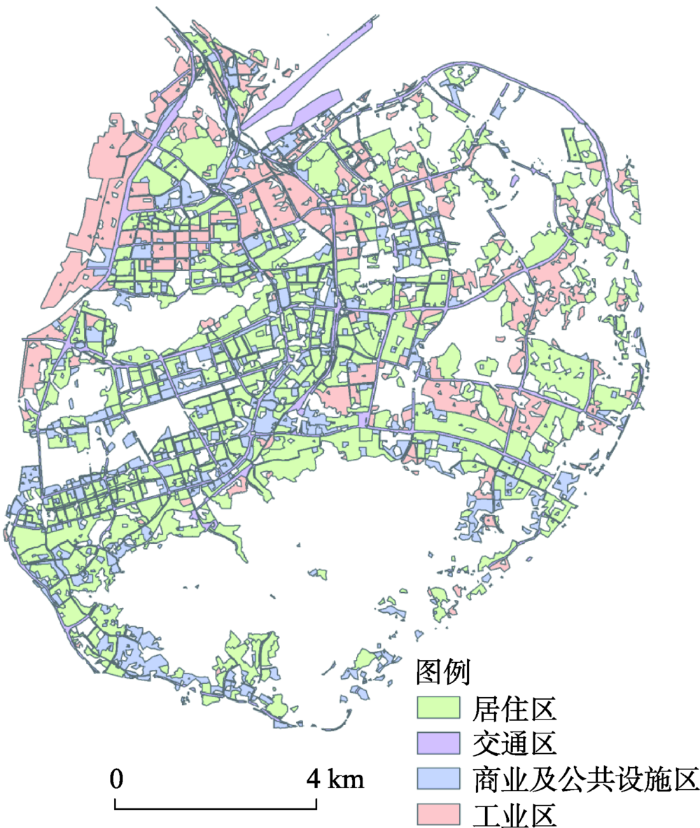
所有Landsat TM影像和GLASS数据产品均采用WGS-84 椭球和基准面,精纠正到UTM 投影坐标系,并重采样为30 m分辨率。选择最大似然法将研究区TM影像分为6种土地利用类型,即水体、耕地、建设用地(建成区)、裸地、林地和滩涂(图2)。春、夏、秋、冬4景影像的总体分类精度分别为:83.3%、87.2%、88.3%、87.8%, Kappa 系数均大于0.8,达到Landsat TM数据的分类精度要求。在对IKONOS影像进行几何校正、数据融合之后,通过目视解译将建成区分为工业区、居住区、商业及公共设施区、交通区4种城市功能区(图3)。
图2 2009年厦门岛不同季节TM影像土地利用分类结果图
Fig. 2 Land use and cover classification maps of Xiamen Island in four seasons in 2009 derived from the TM data
图3 2009年厦门岛IKONOS影像土地利用分类结果图
Fig. 3 Land use and cover classification maps of Xiamen Island in 2009 derived from the IKONOS data
除了遥感数据以外,本研究还需要包括气温、风速、水汽压和大气压强等气象数据。气象数据来自于厦门市气象服务中心提供的逐小时观测数据,选取其中与Landsat TM卫星过境时间相近的观测记录(表1)。由于只有一个基准站点的气象数据和研究区范围相对较小,参考已有文献[26,27]中的处理方法,本文认为这些气象数据在研究区范围内是常数。
表1 气象数据
Tab. 1 Meteorological data
| 时间 | 气象数据 | |||
|---|---|---|---|---|
| 大气压/hpa | 大气温度/℃ | 风速/(m/s) | 水汽压/hpa | |
| 2009-01-13(冬) | 1016.6 | 9.2 | 3.4 | 5.1 |
| 2009-03-18(春) | 998.3 | 20.8 | 1.9 | 16 |
| 2009-06-06(夏) | 1001.7 | 28.9 | 1.8 | 20.7 |
| 2010-10-31(秋) | 1019.4 | 21.3 | 2.4 | 8.9 |
在城市地区,除了净辐射之外,人类活动在建筑、交通运输和工业生产中的能源消耗所释放的人为热也是地表接收的能量之一。依据热力学第一定律,地表接收的能量通过转换为其他形式的能量使系统保持平衡。这一交换过程可用地表能量平衡方程来表示[16]。
式中:
地表净辐射是指到达地表的太阳总辐射减去被地表反射部分后所得到的辐射差额,是地表能量平衡方程中重要的能量收入部分,可由式(2)计算[16]。
式中:
表2 不同土地覆盖类型和不同季节的cg值
Tab. 2 Coefficient cg for different surface coverage types and seasons
| 分类 | 月份 | |||
|---|---|---|---|---|
| 1 | 3 | 6 | 10 | |
| 建设用地 | 0.9 | 0.7 | 0.6 | 0.7 |
| 裸地 | 0.3 | 0.3 | 0.3 | 0.3 |
| 水体 | 0.2 | 0.2 | 0.2 | 0.2 |
| 农田 | 0.3 | 0.3 | 0.3 | 0.3 |
| 林地 | 0.13 | 0.15 | 0.15 | 0.15 |
| 滩涂 | 0.3 | 0.3 | 0.3 | 0.3 |
表3 不同土地利用类型的ɛ 、Z0m、Z0h和d的值
Tab. 3 ɛ 、Z0m、Z0h and d for different surface coverage types
| 分类 | 建设用地 | 裸地 | 水体 | 农田 | 林地 | 滩涂 |
|---|---|---|---|---|---|---|
| ɛ | 0.967 | 0.975 | 0.995 | 0.985 | 0.986 | 0.998 |
| Z0m | 0.33 | 0.001 | 0.00003 | 0.1 | 0.3 | 0.001 |
| Z0h | 0.0033 | 0.00002 | 0.000088 | 0.001 | 0.0003 | 0.00002 |
| d | 1.66 | 0.05 | 0.05 | 0.1 | 1.5 | 0.05 |
地表反照率
反演地表温度T_s主要有3步:① 对TM影像的热红外波段进行辐射定标,得到热红外波段的表观辐射亮度值;② 使用Coll提出的大气校正模型[31],将表观辐射亮度值转化为地表真实辐射亮度值
土壤热通量是土壤表面与下层之间热交换的表征,已有文献[32,33]表明土壤热通量与地表净辐射之间存在统计关系。Kato等[16]总结前人的研究,认为土壤热通量可由地表净辐射来估算,提出了一个经验方程:
式中:G为土壤热通量/(W/m2);
显热通量是通过传导或对流的方式将地表能量向大气传输,进而对大气加热,由大气与地表之间的能量梯度决定。显热通量H可用以下公式进行计算[16]:
式中:
式中:
潜热通量指下垫面与大气间水汽热交换所吸收的热量,是水分循环的重要组成部分,主要以蒸散发的形式参与能量循环。本文使用Kato等[16]提出的公式计算潜热通量LE。
式中:
根据城市地表能量平衡方程,在得到了地表净辐射Rn、土壤热通量G、显热通量H及潜热通量LE后,将人为热排放A作为剩余项来进行估算:
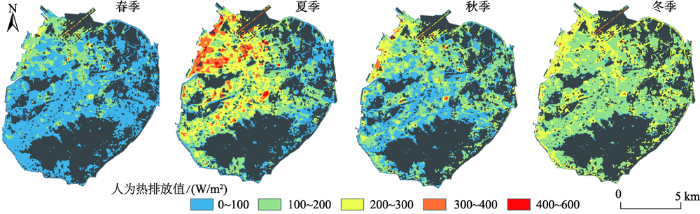
厦门岛建成区人为热排放在春、夏、秋、冬四季的分布和变化情况如图4所示,人为热排放存在明显的季节性和空间差异,其中黑灰色部分为非建成区。利用ArcGIS的空间分析功能,得到建成区春、夏、秋、冬季的人为热排放均值分别是34.4 、106.6 、66.5 和103.3 W/m2,冬、夏季人为热排放明显高于春、秋两季,这与Kato等[16]在名古屋市的研究结果基本一致。冬、夏两季人为热排放在空间上分布较广,春季人为热排放在空间上分布最小。冬、夏两季的人为热排放均值虽然数值上相当,但是有区别:夏季人为热排放的主要分布区间为200~400 W/m2,而冬季人为热排放的主要分布区间为100~300 W/m2,且分布面积较大。结合四季的人为热排放的空间分布,可以看出厦门岛西北部的人为热排放在四季中一直比其他地区要高,这是因为该地区是港口码头、加工制造区和仓储堆场,大量的物流运输、工业生产释放了大量的废热,形成了人为热排放的高值区。
图4 2009年不同季节厦门岛建成区人为热排放分布图
Fig. 4 Anthropogenic heat discharge distribution for built-up area of Xiamen Island in four seasons in 2009
不同类型城市功能区四季人为热排放的平均值和最大值统计结果如表4所示。由表4可看出, 4种不同类型城市功能区人为热排放的均值和最大值都是在夏季达到最大,其次是冬季、秋季,最小的是春季。从空间分布上看,不论哪一个季节,工业区人为热排放的平均值和最大值是最大的,其次是交通区、商业及公共设施区,居住区最小。这与厦门市2009年不同部门碳排放大小的排序一致:工业部门>交通运输部门>商业及公共机构>居住生活[49]。
表4 四季不同类型城市功能区人为热排放的平均值和最大值(W/m2)
Tab. 4 Averages and maximums of anthropogenic heat discharge for different types of urban functional regions on four seasons
| 城市功能区 | 春季 | 夏季 | 秋季 | 冬季 | |||||||
|---|---|---|---|---|---|---|---|---|---|---|---|
| 平均值 | 最大值 | 平均值 | 最大值 | 平均值 | 最大值 | 平均值 | 最大值 | ||||
| 工业区 | 96.8 | 298.1 | 223.7 | 513.5 | 158.5 | 374.1 | 197.7 | 394.7 | |||
| 交通区 | 48.1 | 294.7 | 182.4 | 447.9 | 115.3 | 368.9 | 184.1 | 396.5 | |||
| 居住区 | 20.1 | 247.7 | 159.8 | 433.6 | 82.2 | 290.4 | 154.3 | 321.5 | |||
| 商业及公共设施区 | 27.9 | 258.3 | 172.9 | 430.2 | 103.4 | 350.7 | 165.8 | 370.2 | |||
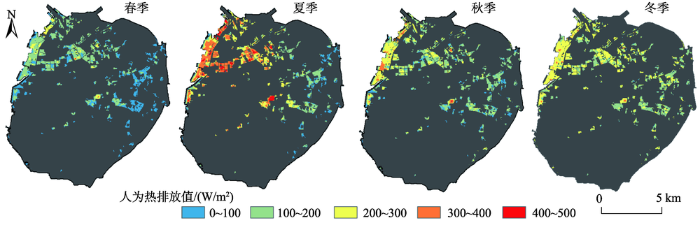
工业区人为热排放的分布和变化情况如图5 所示,可以发现具有显著的空间差异性和季节差异性(其中黑灰色部分为非建成区和其他类型城市功能区,下同)。夏季厦门岛西北部工业区与东部工业区人为热排放的差别较大,而春季、冬季则差别相对较小。不论哪一个季节,工业区人为热排放的高值区主要集中在厦门岛西北部,即东渡港区、湖里工业区、火炬高新区,以及厦门岛中部的龙山工业区;人为热排放的低值区主要分布在厦门岛东部的以轻工业为主的前埔工业区和一些村镇工业集中区。总体来看,厦门岛工业区人为热排放西部要高于东部,这是因为厦门传统上主要的重点工业区分布在厦门岛西北部,工业用地是逐渐从西部扩张到东部。
图5 2009年不同季节工业区人为热排放分布图
Fig. 5 Anthropogenic heat discharge distribution for industrial area of Xiamen Island in four seasons in 2009
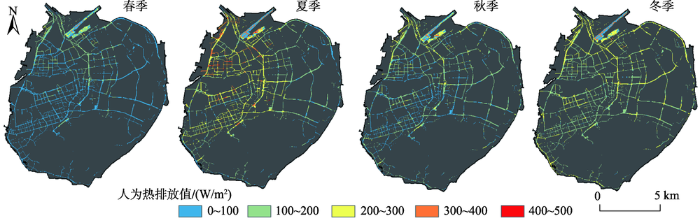
由图6可以看出,交通区的人为热排放同样具有明显的季节性和空间性差异。夏季交通区人为热排放在空间上分布差异最大,高值区主要集中在 300 W/m2以上,分布在机场地区和成功大道以西:自西向东包括长岸路、嘉禾路和成功大道(“三纵”),自北向南包括湖里大道、南山路、仙岳路和湖滨南路(“四横”);秋季交通区人为热排放在空间上分布差异较大,除机场地区、长岸路、成功大道和仙岳路之外,其他地区人为热排放多集中在0~100 W/m2之间;春季和冬季的交通区人为热排放在空间上分布较为均匀,春季人为热排放主要集中在0~100 W/m2之间,冬季则集中在100~300 W/m2之间。总体上,机场地区和前述“三纵四横” 的交通干线人为热排放一直比其他地区高。这是由于机场区和“三纵四横”的路面是沥青路面,其热容量与导热率相对其他地区的水泥路面较大,因此土壤热通量更大,从而人为热排放的值更高。另外也与机场区频繁的航空运输,以及交通干线巨大的车流量相关。
图6 2009年不同季节交通区人为热排放分布图
Fig. 6 Anthropogenic heat discharge distribution for traffic area of Xiamen Island in four seasons in 2009
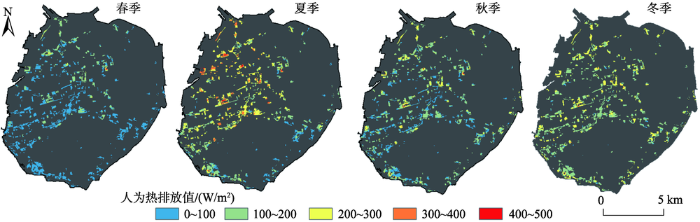
居住区人为热排放分布和变化情况如图7所示,可以发现人为热排放分布具有显著的时空差异性。春季居住区人为热排放基本上小于100 W/m2,在空间上分布最为均匀;秋、冬两季居住区人为热排放空间分布具有高度相似性,但冬季人为热排放强度比秋季大;夏季人为热排放在空间上分布差异最大,厦门岛西部居住区人为热排放基本大于 200 W/m2,东部则小于200 W/m2。总体上,岛西南部的传统老城区和西部改革开放后建设的经济特区部分的人为热排放在四季中比其他地区要高。因为这些居住区人口集中、建筑密度大,所消耗的能源多因而人为热排放大;而且由于建筑物密度大,通风不良,不利于显热通量向外扩散;同时因为建筑老化,导致对太阳辐射的反射率下降,吸收更多的能量转化为显热通量,从而人为热排放也大。
图7 2009年不同季节居住区人为热排放分布图
Fig. 7 Anthropogenic heat discharge distribution for residential area of Xiamen Island in four seasons in 2009
商业及公共设施区人为热排放分布具有显著的空间差异性(图8)。春季和冬季的商业及公共设施区人为热排放在空间上分布均匀,但冬季人为热排放主要集中在100~300 W/m2之间,而春季则基本小于100 W/m2;夏、秋两季的人为热排放空间分布差异较大,尤其是夏季,空间差异性明显,人为热排放高值区基本覆盖了厦门岛西部的商业及公共设施区。总体上,厦门岛北部的夏商国际商城、水产市场和酒店超市区,中部的SM商圈、火车站商圈和厦门市体育中心,东部的家具建材城在四季中一直是人为热排放的高值区。这些商圈和公共设施由于单体建筑占地面积大且建筑物高度较之周边偏低,导致动量传输粗糙度和热量传输粗糙度偏低,从而显热通量更大,使得人为热排放的值更高;同时上述高值区人流车流密集,且各类活动频繁,因而人为热排放高。
图8 2009年不同季节商业及公共设施区人为热排放分布图
Fig. 8 Anthropogenic heat discharge distribution for commercial and public area of Xiamen Island in four seasons in 2009
由于城市存在空气温度和风速的分布差异,精确的空间分布气象数据可以减少地表通量的估算误差。但是鉴于多站点气象数据难以获取,本文只利用了一个气象基准站点的数据来估算表通量,因此有必要对本研究估算的地表通量精度进行检验。由于缺乏厦门岛地表通量的测量数据,把本研究的地表通量反演结果与在其他城市的研究结果进行对比分析(表5)。本研究冬季的显热通量、潜热通量占净辐射的比值分别为0.47 和0.02,与名古屋的结果基本一致。本研究夏季的H/Rn比名古屋夏季的结果要低,但是又比印第安纳波利斯夏季的结果要高,主要是入射的太阳辐射和地表特征不同造成的[38]。本研究中,夏季的LE/Rn与名古屋的结果一致,但比印第安纳波利斯的结果要低,这与不透水面的比例有关[39]。本文的人为热排放反演结果在冬季和夏季都要比名古屋和印第安纳波利斯的结果略高,但是与名古屋的季节变化一致,即夏季的人为热排放最大,冬季比夏季略小。通过上述对比分析,发现本研究结果与其他已有的研究结果是吻合的,表明本研究估算的地表通量结果具有可信性。
表5 本研究与其他研究的地表通量占净辐射比例结果对比
Tab. 5 Heat fluxes ratios to net radiation between the present study and previous studies
| 研究区 | 时间 | H/Rn | LE/Rn | A |
|---|---|---|---|---|
| 厦门岛 | 2009-01-13 | 0.47 | 0.02 | 103.3 |
| 2009-03-18 | 0.25 | 0.01 | 34.4 | |
| 2009-06-06 | 0.38 | 0.02 | 106.6 | |
| 2010-10-31 | 0.34 | 0.02 | 66 | |
| 印第安纳波利斯[15,36] | 2012-10-11 | 0.39 | 0.18 | - |
| 2001-06-16 | 0.28 | 0.23 | 78 | |
| 名古屋[16] | 2000-07-10 | 0.56 | 0.02 | 99 |
| 2000-12-08 | 0.46 | 0.02 | 82 |
本文以Landsat TM多时相遥感影像为数据源,结合气象数据,利用地表能量平衡法估算出人为热排放;在此基础上,结合IKONOS影像解译的厦门岛建成区内部不同类型城市功能区,对不同类型城市功能区的人为热排放的时空变化特征进行分析,得出如下主要结论:
(1)建成区及其内部各种不同类型城市功能区不同季节人为热排放均值排序均为:夏季>冬季>秋季>春季,这是由于夏、冬2个季需要消耗大量能源来制冷和采暖,而春、秋相对较少;每个季节各不同类型城市功能区的人为热排放均值排序均为:工业区>交通区>商服及公共设施区>居住区。
(2)工业区人为热排放高值区主要集中在厦门岛西部传统的重点工业区,工业类型以电子机械、仓储物流为主;交通区人为热排放高值区的空间分布与厦门岛“三纵四横”的交通干线分布格局相吻合;居住区人为热排放高值区主要集中在旧城区,人为热排放强度与人口、建筑密度相关;商业及公共设施区人为热排放高值区主要集中在单体建筑大的商圈和公共设施。从总体上看,不同类型城市功能区人为热排放的空间分布具有一致性,厦门岛西部的人为热排放比东部要高。这是因为西部的经济发展、城市化水平比东部高。
(3)建筑物的密度、高度和下垫面的材料通过影响其他地表通量来改变人为热排放的大小。高密度的建筑群通风不良,不易于显热通量向外扩散;低建筑物的粗糙度较低,其显热通量较大;老建筑比新建筑对太阳辐射的反射率更低,释放更多的显热通量;沥青路面比水泥路面具有更大的热容量与导热率,其土壤热通量更大。总体上,显热通量和土壤热通量的增大导致更高的人为热排放。
由于IKONOS影像获取成本及处理分析等因素,本文仅对厦门岛城市功能区的人为热排放时空变化特征进行分析,在后续研究中将收集多景厦门市的高分辨率影像,进一步分析在城市化过程中不同类型城市功能区的人为热排放特征,为改善城市热环境及促进城市可持续发展提供理论依据。由于缺乏厦门岛地表通量的实地测量数据,因此难以直接对人为热排放进行精度验证,目前仅能通过与其他文献的研究结果进行对比分析。Kato等[3]对名古屋四季的人为热排放进行遥感估算,结果表明冬、夏两季的人为热排放高于春秋两季,这与本文的研究结果一致。同时,在后续研究中可以争取获得研究区内多个自动观测站的气象数据,通过空间插值的方法,进一步提高地表通量的估算精度。另外,为了提高在建成区地表通量的估算精度,在以后的研究中,将采用混合像元分解法提取建成区不透水面像元中亚像元的植被、水体等其他地物的覆盖度。
The authors have declared that no competing interests exist.
| [38] |
利用Landsat 遥感影像进行福州市地表热通量估算的研究试验 [J].https://doi.org/10.3969/j.issn.1000-3177.2013.02.006 URL [本文引用: 1] 摘要
利用福州市1989年和2001年Landsat TM/ETM+遥感影像数据估算地表温度、地表反照率和植被覆盖度等地表参数,再结合气象站观测资料,估算与城市热岛密切相关的气候因子即显热通量和潜热通量。然后根据植被覆盖度对由人工建筑物和水泥道路等构成的不透水面覆盖区的潜热通量进行修正,改进了不透水面潜热通量的计算,并且探讨了地表热通量随土地覆盖变化的时空分布特征。最后对地表热通量精度进行分析和检验,论证了本研究的地表热通量估算结果是合理的。
Remote sensing study on the surface heat flux in Fuzhou City [J].https://doi.org/10.3969/j.issn.1000-3177.2013.02.006 URL [本文引用: 1] 摘要
利用福州市1989年和2001年Landsat TM/ETM+遥感影像数据估算地表温度、地表反照率和植被覆盖度等地表参数,再结合气象站观测资料,估算与城市热岛密切相关的气候因子即显热通量和潜热通量。然后根据植被覆盖度对由人工建筑物和水泥道路等构成的不透水面覆盖区的潜热通量进行修正,改进了不透水面潜热通量的计算,并且探讨了地表热通量随土地覆盖变化的时空分布特征。最后对地表热通量精度进行分析和检验,论证了本研究的地表热通量估算结果是合理的。
|
| [1] |
Modeling of the urban heat island in the form of mesoscale wind and of its effect on air pollution dispersal [J].https://doi.org/10.1016/j.apm.2009.11.016 URL [本文引用: 1] 摘要
A steady state two-dimensional mathematical model is presented to study the dispersion of air pollutants under the effect of urban heat island (UHI), when the pollutants are assumed to be emitted from the ground based area source. Urban heat islands generate their own mesoscale (or local) winds; therefore, for the simulation of UHI, the mesoscale wind is included in the model. The model takes into account the removal of pollutants through wet and dry deposition processes. The obtained mathematical model is solved using implicit Crank icolson finite difference scheme under stability dependent meteorological parameters involved in wind velocities and eddy diffusivity profiles. The results show that the mesoscale wind produced by urban heat island help the pollutants to circulate and move in upward direction, thus making the problem of air pollution more severe in urban areas. The analysis of the proposed mathematical model leads to conclude that the concentration level of pollutants aggravates under urban heat island effect in all atmospheric conditions viz. unstable, neutral and stable; however, the concentration distribution of pollutants differs in each atmospheric condition.
|
| [2] |
Global change and the ecology of cities [J].https://doi.org/10.1126/science.1150195 URL [本文引用: 1] |
| [3] |
A preliminary study on the local cool-island intensity of Taipei city parks [J].https://doi.org/10.1016/j.landurbplan.2006.09.005 URL [本文引用: 2] 摘要
That green-spaces relieve urban heat is well known in urban landscape planning. Scientific information on what kinds of green-spaces best reduce heat, however, is still largely unknown. This is a preliminary study aimed at (1) devising a method to detect and compare the local cool-island intensities of various urban parks; (2) verifying that this local cool-island intensity differs among parks; (3) determining whether this local cool-island intensity is related to park characteristics.Results from air–temperature measurements in and around 61 Taipei city parks showed that urban parks were on average cooler than their surroundings, confirming the term “urban cool-islands.” However, approximately one-fifth of the parks were warmer than their urban surroundings. At noon in summer, parks with ≥50% paved coverage and little tree- and shrub-cover were on average warmer than their surroundings. Large parks were on average cooler than the smaller ones, but this relationship was non-linear.In Taipei, parks differed in their local cool-island intensity and this intensity can be related to park characteristics. Before further details concerning better planning and design approaches to mitigate urban heat-islands can be addressed, a neighborhood-scaled understanding of the urban microclimate is first needed as a basis.
|
| [4] |
Impact of regional climate change on human health [J].https://doi.org/10.1038/nature04188 URL PMID: 16292302 [本文引用: 1] 摘要
Abstract The World Health Organisation estimates that the warming and precipitation trends due to anthropogenic climate change of the past 30 years already claim over 150,000 lives annually. Many prevalent human diseases are linked to climate fluctuations, from cardiovascular mortality and respiratory illnesses due to heatwaves, to altered transmission of infectious diseases and malnutrition from crop failures. Uncertainty remains in attributing the expansion or resurgence of diseases to climate change, owing to lack of long-term, high-quality data sets as well as the large influence of socio-economic factors and changes in immunity and drug resistance. Here we review the growing evidence that climate-health relationships pose increasing health risks under future projections of climate change and that the warming trend over recent decades has already contributed to increased morbidity and mortality in many regions of the world. Potentially vulnerable regions include the temperate latitudes, which are projected to warm disproportionately, the regions around the Pacific and Indian oceans that are currently subjected to large rainfall variability due to the El Ni脙卤o/Southern Oscillation sub-Saharan Africa and sprawling cities where the urban heat island effect could intensify extreme climatic events.
|
| [5] |
Urban heat island effect analysis for San Juan, Puerto Rico [J].https://doi.org/10.1016/j.atmosenv.2005.09.074 URL [本文引用: 1] 摘要
A climatological analysis of the differences of air temperature between rural and urban areas (d T(U–R)) corroborates the existence of an urban heat island (UHI) in the tropical coastal city of San Juan, Puerto Rico that has been increasing at a rate of 0.06 °C year 611 for the last 40 years with predicted differences as high as 8 °C for the year 2050. The Regional Atmospheric Model System (RAMS) was used to validate the presence of this UHI and to simulate and compare three different land use scenarios consisting of potential natural vegetation, present, and projected future to quantify the impact of the urban development in the regional climate of Puerto Rico. RAMS simulated the UHI conditions at the lower and upper atmosphere revealing significant changes in sensible heat fluxes and sinks, and an increasing low turbulent-kinetic-energy zone (LTKEZ) over the urbanized area of San Juan.
|
| [6] |
Canyon geometry and the nocturnal urban heat island: Comparison of scale model and field observations [J].https://doi.org/10.1002/joc.3370010304 URL [本文引用: 1] 摘要
A simple hardware scale model is used to simulate nocturnal cooling rates for rural and urban environments under calm and cloudless conditions. Comparison with field observations gathered under similar conditions shows the model capable of reproducing many of the features of the temporal development of urban heat islands and the long-wave radiative exchange in urban canyons. The model is used to investigate the roles played by rural/urban differences in geometry and thermal admittance. The results of the experiments show that canyon geometry in the central portion of a city (as measured by the sky view factor) is a relevant variable in producing nocturnal urban heat islands due to its role in regulating long-wave radiative heat loss. It is also demonstrated that this measure is central to the relationship between city size and heat island intensity. The importance of canyon geometry as a feature of urban design is discussed. Thermal admittance differences can also produce realistic heat island features but their magnitude requires quantification in the field.
|
| [7] |
Energy efficiency: Super savers meters to manage the future [J].https://doi.org/10.1038/445586a URL [本文引用: 1] |
| [8] |
|
| [9] |
The effects of land-use and anthropogenic heating on the surface temperature in the Tokyo metropolitan area: A numerical experiment [J].https://doi.org/10.1016/0957-1272(91)90050-O URL [本文引用: 1] 摘要
The diurnal variation of the simulated surface air temperature agrees well with the observed value; an average over 36 days which represent typical summer days; i.e. negligible gradient winds and almost clear skies. The model shows that the contribution of anthropogenic heat is much larger at night, in spite of the lower energy consumption as compared to daytime use. Due to the scarcity of green vegetated areas in the central part of the city, the surface air temperature is enhanced in this region during daytime, however this enhancement is small after midnight.
|
| [10] |
Modeling the impacts of anthropogenic heating on the urban climate of Philadelphia: A comparison of implementations in two PBL schemes [J].https://doi.org/10.1016/j.atmosenv.2004.09.031 URL [本文引用: 1] 摘要
Waste heat released from human activities (anthropogenic heating) can be a significant contributor to the urban energy balance, and can thus play an important role in affecting the urban thermal environment, ambient air quality, and other attributes of the urban climate system. To quantify the impacts of anthropogenic heating we have incorporated it as a source term in the near-surface energy balance within the MM5 mesoscale atmospheric model. This energy balance is calculated as part of the planetary boundary layer (PBL) module within the MM5. Because of the multiple PBL scheme options available within the MM5 and other atmospheric modeling systems we have enabled anthropogenic heating within two commonly used PBL modules—Blackadar (BL) and Gayno–Seaman (GS). Results from a case study series of simulations for Philadelphia suggest that anthropogenic heating plays an important role in the formation of the urban heat island, particularly during the night and winter. Control simulations (without anthropogenic heating) consistently underestimated urban air temperatures and the observed urban heat island effect. Simulations for winter suggest that anthropogenic heating contributes 2–302°C to the nighttime heat island. In addition, anthropogenic heating is also found to have impacts on the nocturnal PBL stability and PBL structure during the morning transition. The choice of PBL scheme affects the magnitude of these modeled impacts. In winter, for example, the addition of anthropogenic heating in the BL scheme resulted in a 302°C temperature increase at night compared with about a 202°C temperature increase in the corresponding GS simulation.
|
| [11] |
城市人为热对北京热环境的影响 [J].The impact of urban anthropogenic heat on Beijing heat environment [J]. |
| [12] |
A top-down methodology for developing diurnal and seasonal anthropogenic heating profiles for urban areas [J].https://doi.org/10.1016/j.atmosenv.2004.01.034 URL [本文引用: 1] 摘要
A generalized approach for estimating season-specific diurnal profiles of anthropogenic heating for cities is presented. Each profile consists of heat released from three components: building sector, transportation sector, and metabolism. In turn, the building sector is divided into heat released from electricity consumption and heat released from heating fuels such as natural gas and fuel oil. Each component is developed separately based on a population density formulation. The profiles are based on commonly available data resources that are mapped onto the diurnal cycle using seasonal profile functions. Representative winter and summer weekday profiles are developed and presented for six large US cities. The diurnal profiles have morning and evening peaks, with summertime maxima up to 6002W02m. Anthropogenic heating in winter is generally larger, with maxima up to 7502W02m. While these analyses were carried out at the city-scale the paper discusses how the same data sources could be applied at scales down to the individual census tract (or traffic analysis zone), resulting in high spatial resolution profiles and larger maxima corresponding to higher population densities in the urban core. Based on our analysis of San Francisco we find that the urban core region may have a daytime population density that is 5–10 times that of the city-scale value. Hence, the corresponding anthropogenic heating values in the urban core will be 5–10 times the magnitudes of the city-scale values presented in this paper.
|
| [13] |
中国地区人为热分布特征研究 .
利用中国统计年鉴中全国各省份的非再生能源消费资料和2.5min×2.5min分辨率的人口格点数据,对中国地区人为热排放的时空分布进行研究,讨论了其分布特征和影响因素.结果表明,中国地区人为热通量随时间持续增长,特别是在2000年后增长加速,1985年到2000年从0.09W/m2增长到0.16W/m2,而到2013年已经增长到0.38W/m2.中国地区的人为热排放具有显著的地域特征,在华北、华东和华南,由于人口密度大、经济发达,人为热的污染很严重;在华中地区,人为热污染较严重的区域主要分布在以武汉为中心的经济圈;在东北地区,以大连、沈阳、长春和哈尔滨为中心的城市区域人为热污染也较为严重;而在西北和西南的大部分地区,人为热排放量很小,仅在以成都、重庆为中心的区域较大.历年来全国年均人为热的最大值都出现在上海,其中2010年最大,为113.5W/m2,上海人为热排放的年均值增长明显,可达到0.6W/m2/a.随着城市化进程的加快,人为热的排放愈来愈强,热污染对城市和区域的气候以及空气污染的影响也会越来越重要.
Study on the distribution of anthropogenic heat flux over China [J].
利用中国统计年鉴中全国各省份的非再生能源消费资料和2.5min×2.5min分辨率的人口格点数据,对中国地区人为热排放的时空分布进行研究,讨论了其分布特征和影响因素.结果表明,中国地区人为热通量随时间持续增长,特别是在2000年后增长加速,1985年到2000年从0.09W/m2增长到0.16W/m2,而到2013年已经增长到0.38W/m2.中国地区的人为热排放具有显著的地域特征,在华北、华东和华南,由于人口密度大、经济发达,人为热的污染很严重;在华中地区,人为热污染较严重的区域主要分布在以武汉为中心的经济圈;在东北地区,以大连、沈阳、长春和哈尔滨为中心的城市区域人为热污染也较为严重;而在西北和西南的大部分地区,人为热排放量很小,仅在以成都、重庆为中心的区域较大.历年来全国年均人为热的最大值都出现在上海,其中2010年最大,为113.5W/m2,上海人为热排放的年均值增长明显,可达到0.6W/m2/a.随着城市化进程的加快,人为热的排放愈来愈强,热污染对城市和区域的气候以及空气污染的影响也会越来越重要.
|
| [14] |
Combining a detailed building energy model with a physically-based urban canopy model [J].https://doi.org/10.1007/s10546-011-9620-6 URL [本文引用: 1] 摘要
A scheme that couples a detailed building energy model, EnergyPlus, and an urban canopy model, the Town Energy Balance (TEB), is presented. Both models are well accepted and evaluated within their individual scientific communities. The coupled scheme proposes a more realistic representation of buildings and heating, ventilation and air-conditioning (HVAC) systems, which allows a broader analysis of the two-way interactions between the energy performance of buildings and the urban climate around the buildings. The scheme can be used to evaluate the building energy models that are being developed within the urban climate community. In this study, the coupled scheme is evaluated using measurements conducted over the dense urban centre of Toulouse, France. The comparison includes electricity and natural gas energy consumption of buildings, building fa ade temperatures, and urban canyon air temperatures. The coupled scheme is then used to analyze the effect of different building and HVAC system configurations on building energy consumption, waste heat released from HVAC systems, and outdoor air temperatures for the case study of Toulouse. Three different energy efficiency strategies are analyzed: shading devices, economizers, and heat recovery.
|
| [15] |
Estimation of the relationship between remotely sensed anthropogenic heat discharge and building energy use [J].https://doi.org/10.1016/j.isprsjprs.2011.10.007 URL [本文引用: 5] 摘要
This paper examined the relationship between remotely sensed anthropogenic heat discharge and energy use from residential and commercial buildings across multiple scales in the city of Indianapolis, Indiana, USA. The anthropogenic heat discharge was estimated with a remote sensing-based surface energy balance model, which was parameterized using land cover, land surface temperature, albedo, and meteorological data. The building energy use was estimated using a GIS-based building energy simulation model in conjunction with Department of Energy/Energy Information Administration survey data, the Assessor parcel data, GIS floor areas data, and remote sensing-derived building height data. The spatial patterns of anthropogenic heat discharge and energy use from residential and commercial buildings were analyzed and compared. Quantitative relationships were evaluated across multiple scales from pixel aggregation to census block. The results indicate that anthropogenic heat discharge is consistent with building energy use in terms of the spatial pattern, and that building energy use accounts for a significant fraction of anthropogenic heat discharge. The research also implies that the relationship between anthropogenic heat discharge and building energy use is scale-dependent. The simultaneous estimation of anthropogenic heat discharge and building energy use via two independent methods improves the understanding of the surface energy balance in an urban landscape. The anthropogenic heat discharge derived from remote sensing and meteorological data may be able to serve as a spatial distribution proxy for spatially-resolved building energy use, and even for fossil-fuel CO 2 emissions if additional factors are considered.
|
| [16] |
Analysis of urban heat-island effect using ASTER and ETM+ Data: Separation of anthropogenic heat discharge and natural heat radiation from sensible heat flux [J].https://doi.org/10.1016/j.rse.2005.04.026 URL [本文引用: 14] 摘要
The urban heat-island effect occurs as a result of increased sensible heat flux from the land surface to the atmosphere near cities. Sensible heat flux consists of two components: exhausted anthropogenic heat, and heat radiation due to solar input. The latter may be enhanced by changes in the usage of artificial land surface. The authors have developed a new method to separate the anthropogenically discharged heat and natural heat radiation from the sensible heat flux, based on a heat-balance model using satellite remote sensing and ground meteorological data. This method was applied to ASTER and ETM+ data for the daytime during spring, summer and winter and for the nighttime during autumn in Nagoya, Japan. The increased sensible heat flux was approximately 100 W/m 2 in the central part of the city during the summer. Sensible heat flux at night during autumn was approximately 0 W/m 2, except in urban areas and over bodies of water. During the winter, anthropogenic heat accounted for almost all of the sensible heat flux in urban areas. The contribution of anthropogenic heat to sensible heat flux in spring was lower than the contributions in summer and winter. The anthropogenic heat flux was high in industrial areas throughout the year. These results are consistent with the fact that anthropogenic energy consumption is high in summer and winter and low in spring and autumn.
|
| [17] |
Modeling of anthropogenic heat flux using HJ-1B Chinese small satellite image: A study of heterogeneous urbanized areas in Hong Kong [J].https://doi.org/10.1109/LGRS.2015.2409111 URL [本文引用: 2] 摘要
Anthropogenic heat is the heat flux generated by human activities and is a major contributor to the formation of an urban heat island. In a city such as Hong Kong, obtaining pure pixels from medium- or coarse-resolution remote sensing images is challenging. Considering the completely different thermal properties of vegetation and impervious surfaces, this letter developed a novel algorithm to estimate anthropogenic heat fluxes by decomposing image pixels into fractions of impervious surfaces and vegetation, and by estimating the total heat flux for the mixed pixel. The Chinese small satellite HJ-1B images with a spatial resolution of 30 and 300 m for visible and thermal wavebands, respectively, and the temporal resolution of four days were used for the heat flux modeling. Results show that anthropogenic heat fluxes in Hong Kong are correlated to the building density and the building height, with r2 = 0.92 and 0.58 on October 11, 2012 and r2 = 0.94 and 0.62 on January 13, 2013, respectively. The average anthropogenic heat fluxes in urban areas are 289.16 and 283.17 W/m2 on October 11, 2012 and on January 13, 2013, respectively, and the commercial areas emit the largest anthropogenic heat fluxes around 500-600 W/m2 compared with other land-use types. The derived anthropogenic heat fluxes can help in planning and environmental authorities to pinpoint ot-spot areas, and they can be used for compliance monitoring.
|
| [18] |
Assessment of land surface temperature and heat fluxes over Delhi using remote sensing data [J].https://doi.org/10.1016/j.jenvman.2013.11.034 URL PMID: 24360191 [本文引用: 1] 摘要
Surface energy processes has an essential role in urban weather, climate and hydrosphere cycles, as well in urban heat redistribution. The research was undertaken to analyze the potential of Landsat and MODIS data in retrieving biophysical parameters in estimating land surface temperature & heat fluxes diurnally in summer and winter seasons of years 2000 and 2010 and understanding its effect on anthropogenic heat disturbance over Delhi and surrounding region. Results show that during years 2000–2010, settlement and industrial area increased from 5.66 to 11.74% and 4.92 to 11.87% respectively which in turn has direct effect on land surface temperature (LST) and heat fluxes including anthropogenic heat flux. Based on the energy balance model for land surface, a method to estimate the increase in anthropogenic heat flux (Has) has been proposed. The settlement and industrial areas has higher amounts of energy consumed and has high values of Has in all seasons. The comparison of satellite derived LST with that of field measured values show that Landsat estimated values are in close agreement within error of ±202°C than MODIS with an error of ±302°C. It was observed that, during 2000 and 2010, the average change in surface temperature using Landsat over settlement & industrial areas of both seasons is 1.402°C & for MODIS data is 3.702°C. The seasonal average change in anthropogenic heat flux (Has) estimated using Landsat & MODIS is up by around 3802W/m2 and 6202W/m2 respectively while higher change is observed over settlement and concrete structures. The study reveals that the dynamic range of Has values has increased in the 10 year period due to the strong anthropogenic influence over the area. The study showed that anthropogenic heat flux is an indicator of the strength of urban heat island effect, and can be used to quantify the magnitude of the urban heat island effect.
|
| [19] |
基于地表能量平衡的城市热环境遥感研究——以石家庄市为例 [J].Urban surface heat flux analysis based on remote sensing: A case study of Shijiazhuang City [J]. |
| [20] |
|
| [21] |
城市功能区划分空间聚类算法研究 [J].Spatial clustering algorithm on urban function oriented zone [J]. |
| [22] |
|
| [23] |
A study on urban heat island and its spatial relationship with urban expansion: Xiamen, SE China [J].
A study on urban heat island (UHI) and its spatial relationship with urban expansion of Xiamen of China has been carried out using remote sensing technology. Satellite thermal infrared images have been used to determine surface radiant temperatures. Thermal remote sensing data have been obtained from band 6 of two Landsat TM/ETM+ images of 1989 and 2000 to cover an 11-year study period. The thermal infrared bands were processed through several image enhancement technologies. This generated two 3-dimension-view images of Xiamen's urban heat island in 1989 and 2000, respectively and revealed heat characteristics and spatial distribution features of the UHI. To find out the change of the UHI between 1989 and 2000, the two thermal images were first normalized and scaled to seven grades to reduce seasonal difference and then overlaid to produce a difference image by subtracting corresponding pixels. The difference image shows an evident development of the urban heat island through the 11-study years. This change was due largely to the urban expansion with a consequent alteration in the ratio of sensible heat flux to latent heat flux. To quantitatively compare UHI, an index, Urban-Heat-Island Ratio Index (URI), was introduced. It can reveal the intensity of the UHI within the urban area. The calculation of the index for the Xiamen case indicates that the ratio of UHI area to urban area in 2000 is less than that in 1989. High temperatures in several areas in 1989 have been reduced or just disappeared, like those in old downtown area. For the potential mitigation of UHI in Xiamen, a long-term heat island reduction strategy of planting shade trees and using light-colored, highly reflective roof and paving materials should be included in the plans of the city planers.
|
| [24] |
Spatiotemporal changes of the urban heat island of a coastal city in the context of urbanization [J].https://doi.org/10.1080/13504509.2010.490333 URL [本文引用: 1] 摘要
This study quantitatively analysed the spatiotemporal changes of the urban heat island (UHI) of Xiamen City in the context of urbanisation, using Landsat Thematic Mapper (TM) and Enhanced Thematic Mapper Plus (ETM+) thermal images acquired on similar dates in the winter of 1987, 1992, 1997, 2002 and 2007. UHI intensity and extent were used to quantify the changes, together with landscape metrics PLAND, PD, CA, NP, P-UHI, NP-UHI, PD-UHI, etc. The results show that the winter UHI of Xiamen has become more and more striking in the past 20 years in almost all the indices used. The UHI intensity increased to over 10 C, and UHI extent and thermal patch number also increased remarkably. At the same time, UHI was more dominated and fragmented by high-grade thermal patches. In winter these UHI formed several hot spots and areas of significance, distributed along the coastline. This pattern was related to industrial zones and large infrastructure constructed in coastal areas during the rapid course of urbanisation, since both large impervious ground surfaces, large-sized and endothermic factory building roofs were the sources of these hot spots. A similar seasonal analysis was also carried out, which proved that autumn UHI was most intense in Xiamen and the change in season does not change the number of UHI areas of significance.
|
| [25] |
Estimation of incident photosynthetically active radiation from Moderate Resolution Imaging Spectrometer data [J]. |
| [26] |
Surface heat balance analysis of Tainan City on March 6, 2001 using ASTER and Formosat-2 data [J].https://doi.org/10.3390/s8096026 URL PMID: 3705546 [本文引用: 1] 摘要
The urban heat island phenomenon occurs as a mixed result of anthropogenic heat discharge, decreased vegetation, and increased artificial impervious surfaces. To clarify the contribution of each factor to the urban heat island, it is necessary to evaluate the surface heat balance. Satellite remote sensing data of Tainan City, Taiwan, obtained from Terra ASTER and Formosat-2 were used to estimate surface heat balance in this study. ASTER data is suitable for analyzing heat balance because of the wide spectral range. We used Formosat-2 multispectral data to classify the land surface, which was used to interpolate some surface parameters for estimating heat fluxes. Because of the high spatial resolution of the Formosat-2 image, more roads, open spaces and small vegetation areas could be distinguished from buildings in urban areas; however, misclassifications of land cover in such areas using ASTER data would overestimate the sensible heat flux. On the other hand, the small vegetated areas detected from the Formosat-2 image slightly increased the estimation of latent heat flux. As a result, the storage heat flux derived from Formosat-2 is higher than that derived from ASTER data in most areas. From these results, we can conclude that the higher resolution land coverage map increases accuracy of the heat balance analysis. Storage heat flux occupies about 60 to 80% of the net radiation in most of the artificial surface areas in spite of their usages. Because of the homogeneity of the building roof materials, there is no contrast between the storage heat flux in business and residential areas. In sparsely vegetated urban areas, more heat is stored and latent heat is smaller than that in the forested suburbs. This result implies that density of vegetation has a significant influence in decreasing temperatures.
|
| [27] |
Comparison of surface heat balance in three cities in Taiwan using Terra ASTER and Formosat-2 RSI data [J].https://doi.org/10.1016/j.jag.2012.02.007 URL [本文引用: 1] 摘要
In order to investigate the influences of the city scale, usage, topography, and climate on surface heat balance, the authors compared the surface heat balance for three urban areas in Taiwan, namely, Kaohsiung City, Taichung City, and Tainan City, estimated using ASTER and Formosat-2 data. The net radiation was in a similar range in all three study areas because the cities are in close proximity to each other. Tainan City released 60 70% of the sensible heat flux of the other cities because of its smaller size. Taichung City, which is located in a basin, exhibited the largest sensible heat flux, due to the radiation cooling during the night before the observation. Anthropogenic heat discharge clearly decreased the storage heat flux in certain industrial areas in Kaohsiung City and Taichung City, while the small scale urban functions moderated the variation of storage heat flux in Tainan City. These results imply that the terrain around a given city as well as the scale of urban activity significantly affect the heat balance in the cities.
|
| [28] |
Development of a land-cover characteristics database for the conterminous United States [J].https://doi.org/10.1080/09553009114552631 URL [本文引用: 1] 摘要
Information regarding the characteristics and spatial distribution of the Earth's land cover is critical to global environmental research. A prototype land-cover database for the conterminous United States designed for use in a variety of global modelling, monitoring, mapping, and analytical endeavors has been created. The resultant database contains multiple layers, including the source AVHRR data, the ancillary data layers, the land-cover regions defined by the research, and translation tables linking the regions to other land classification schema (for example, UNESCO, USGS Anderson System). The land-cover characteristics database can be analyzed, transformed, or aggregated by users to meet a broad spectrum of requirements. -from Authors
|
| [29] |
A comparative study of land surface emissivity retrieval from NOAA data [J].https://doi.org/10.1016/S0034-4257(00)00171-1 URL [本文引用: 1] 摘要
A comparative study has been carried out on the most recent algorithms for the estimation of land surface emissivity (03) using Advanced Very High Resolution Radiometer (AVHRR) data. Three of the algorithms are based on the Temperature-Independent Spectral Indices (TISI) concept using atmospherically corrected channels 3, 4, and/or 5, namely: (1) TISI BL, (2) TS-RAM, and (3) Δday. The fourth is a simplified method based on the estimation of 03 using atmospherically corrected data in the visible and near-infrared channels, called Normalized Difference Vegetation Index (NDVI) Thresholds Method (NDVI THM). This method integrates a wide spectral data set of bare soil reflectivity measurements in the 0.4–14-μm band and uses different approaches in function of the NDVI value. All methods have been applied to the Iberian Peninsula using AVHRR/National Oceanic and Atmospheric Administration (NOAA-14) data during March 17th, 1997. In terms of emissivity, the results show that the difference between the NDVI THM method and the other methods is always positive, with a bias of less than 0.010 and a root mean square (rms) error of less than 0.010 when compared to the TISI BL method, a bias of 0.018 and an rms error of 0.020 when compared to the Δday method, and a bias of 0.025 and an rms error of 0.012 when compared to the TS-RAM method. In terms of land surface temperature, the NDVI THM method shows a bias of less than 610.4 K and an rms error of less than 1.0 K when compared to TISI BL, a bias of 611.0 K and a rms error of 1.3 K when compared to Δday, and a bias of 611.1 K and an rms error of 0.5 K when compared to TS-RAM. In conclusion, although the TISI BL is a precise method, it needs the AVHRR channel 3 for its application, which is not always available, for example, as in the AVHRR archives provided in the frame of the Pathfinder AVHRR Land project (more than 18 years of data). In this case we have shown that the NDVI THM method shows promising results and can be applied to obtain land surface temperature and emissivity from NOAA data without losing accuracy.
|
| [30] |
Narrowband to broadband conversions of land surface albedo I: Algorithms [J].https://doi.org/10.1016/S0034-4257(00)00205-4 URL [本文引用: 1] 摘要
Land surface broadband albedo is a critical variable for many scientific applications. High-resolution narrowband satellite observations contain important information that enables us to map land surface albedo globally, and validate the coarse-resolution albedo products from the broadband sensors using ground oint/plot measurements. However, the conversions from narrowband to broadband albedos of a general surface type have not been well established. Most studies compute total shortwave albedo based on either the empirical relations between surface total shortwave albedo measurements and satellite observations or radiative transfer simulations with the limited number of surface reflectance spectra because of the computational constraints. As a result, many conversion formulae for the same sensors are quite different. In this study, we applied an approach that decouples surface reflectance spectra from the real-time radiative transfer simulations so that many different surface reflectance spectra and the atmospheric conditions can be effectively incorporated. The conversion formulae, based on extensive radiative transfer simulations, are provided in this paper for calculating the total shortwave albedo, total-, direct-, and diffuse-visible, and near-infrared broadband albedos for several narrowband sensors, including ASTER, AVHRR, ETM+/TM, GOES, MODIS, MISR, POLDER, and VEGETATION. Some of these formulae were compared with the published formulae of the same sensors and further validations using extensive ground measurements will be discussed in the companion paper.
|
| [31] |
Validation of landsat-7/ETM+ thermal-band calibration and atmospheric correction with ground-based measurements [J].https://doi.org/10.1109/TGRS.2009.2024934 URL [本文引用: 1] 摘要
Ground-based measurements of land-surface temperature (LST) performed in a homogeneous site of rice crops close to Valencia, Spain, were used for the validation of the calibration and the atmospheric correction of the Landsat-7 Enhanced Thematic Mapper Plus (ETM+) thermal band. Atmospheric radiosondes were launched at the test site around the satellite overpasses. Field-emissivity measurements of the near-full-vegetated rice crops were also performed. Seven concurrences of Landsat-7 and ground data were obtained in July and August 2004-2007. The ground measurements were used with the MODTRAN-4 radiative transfer model to simulate at-sensor radiances and brightness temperatures, which were compared with the calibrated ETM+ observations over the test site. For the cases analyzed here, the differences between the simulated and ETM+ brightness temperatures show an average bias of 0.6 K and a rootmean-square difference (rmsd) of 0.8 K. The ground-based measurements were also used for the validation of LSTs derived from ETM+ at-sensor radiances with atmospheric correction calculated from the following: 1) the local-radiosonde profiles and 2) the operational atmospheric-correction tool available at http://atmcorr.gsfc.nasa.gov. For the first case, the differences between the ground and satellite LSTs ranged from -0.6 to 1.4 K, with a mean bias of 0.7 K and an rmsd = 1.0 K. For the second case, the differences ranged between -1.8 and 1.3 K, with a zero average bias and an rmsd = 卤1.1 K. Although the validation cases are few and limited to one land cover at morning and summer, results show the good LST accuracy that can be achieved with ETM+ thermal data.
|
| [32] |
Estimation of soil heat flux from net radiation during the growth of alfalfa [J].https://doi.org/10.1016/0168-1923(86)90069-9 URL [本文引用: 1] 摘要
Soil heat flux studies have indicated that the instantaneous daytime flux can be estimated as a fraction of the net radiation, the ratio ranging from 0.1 to 0.5, depending on the amount of vegetation present and on the time of day. Soil heat flux and net radiation were measured for an alfalfa crop over two regrowth cycles during the fall growing season. For both sparse alfalfa stubble and full vegetative canopy, the surface soil water content did not significantly affect the fraction of net radiation consumed as soil heat flux. The ratio of soil heat flux to net radiation around midday was found to be a linearly decreasing function of crop height only for heights up to 450 mm. As crop growth continued beyond this height, the ratio remained nearly constant at 0.1. The ratio data were also found to be well-fitted by a linearly decreasing function of a spectral vegetation index (near-IR to Red ratio) over both regrowth cycles. These results indicate that both crop height and spectral vegetation indices can be used to estimate soil heat flux from net radiation measurements.
|
| [33] |
Mapping surface energy balance components by combining landsat thematic mapper and ground-based meteorological data [J].https://doi.org/10.1016/0034-4257(89)90049-7 URL [本文引用: 1] 摘要
Surface energy balance components were evaluated by combining satellite-based spectral data with on-site measurements of solar irradiance, air temperature, wind speed, and vapor pressure. Maps of latent heat flux density (λE) and net radiant flux density (R n) were produced using Landsat Thematic Mapper (TM) data for three dates: 23 July 1985, 5 April 1986, and 24 June 1986. On each date, a Bowen-ratio apparatus, located in a vegetated field, was used to measure λE and R n at a point within the field. Estimates of λE and R n were also obtained using radiometers aboard an aircraft flown at 150 m above ground level. The TM-based estimates differed from the Bowen-ratio and aircraft-based estimates by less than 12 % over mature fields of cotton, wheat, and alfalfa, where λE and R n ranged from 400 to 700 Wm 612.
|
| [34] |
Estimation of urban energy heat flux and anthropogenic heat discharge using aster image and meteorological data: Case study in Beijing metropolitan area [J].https://doi.org/10.1117/1.JRS.6.063559 URL [本文引用: 2] 摘要
In order to analyze the mechanism of the urban heat island, it is paramount and meaningful to estimate the anthropogenic heat flux in cities. A case study was carried out to study the energy balance process in Beijing, China, based on a canopy energy balance equation and to estimate the urban energy fluxes and anthropogenic heat discharge and their seasonal and spatial variations. Two ASTER images and meteorological observation data from the winter and summer seasons were used for the study. The results showed that: (1) in Beijing, the anthropogenic heat discharge flux reached a maximum of 163.76 W min winter and 288.26 W min summer. Spatially, the magnitude of the flux was significantly affected by urban land cover types. In winter, the highest value occurred at an urban commercial district with an average value of 47.60 W m. In summer, the highest value occurred at the airport and the industrial areas with the regional average reaching 47.29 W mthe spatial pattern of the heat discharge appears to be clustered, with some, localized high-accumulation centers such as in industrial areas and commercial districts. (2) The anthropogenic discharge was one of the important contributors to the surface-atmosphere energy exchange in cities. The heat discharge had a positive effect on elevating the surface temperature and formation of the urban heat island, especially in the summer. The study confirms the importance to account for the impact of the anthropogenic heat flux on urban energy budget.
|
| [35] |
An operational remote sensing algorithm of land surface evaporation [J].https://doi.org/10.1029/2002JD002062 URL [本文引用: 1] 摘要
[1] Partitioning of solar energy at the Earth surface has significant implications in climate dynamics, hydrology, and ecology. Consequently, spatial mapping of energy partitioning from satellite remote sensing data has been an active research area for over two decades. We developed an algorithm for estimating evaporation fraction (EF), expressed as a ratio of actual evapotranspiration (ET) to the available energy (sum of ET and sensible heat flux), from satellite data. The algorithm is a simple two-source model of ET. We characterize a landscape as a mixture of bare soil and vegetation and thus we estimate EF as a mixture of EF of bare soil and EF of vegetation. In the estimation of EF of vegetation, we use the complementary relationship of the actual and the potential ET for the formulation of EF. In that, we use the canopy conductance model for describing vegetation physiology. On the other hand, we use 090008VI-Ts090009 (vegetation index-surface temperature) diagram for estimation of EF of bare soil. As operational production of EF globally is our goal, the algorithm is primarily driven by remote sensing data but flexible enough to ingest ancillary data when available. We validated EF from this prototype algorithm using NOAA/AVHRR data with actual observations of EF at AmeriFlux stations (standard error 0.17 and R2 0.71). Global distribution of EF every 8 days will be operationally produced by this algorithm using the data of MODIS on EOS-PM (Aqua) satellite.
|
| [36] |
Assessing intra-urban surface energy fluxes using remotely sensed ASTER imagery and routine meteorological data: A case study in Indianapolis, USA [J].https://doi.org/10.1109/JSTARS.2013.2281776 URL [本文引用: 1] 摘要
The seasonal and spatial variability of surface heat fluxes is crucial to the understanding of urban heat island phenomenon and dynamics. To estimate energy fluxes, remote sensing derived biophysical variables need to be integrated with surface atmospheric parameters measured in meteorological stations or in situ field measurements. In this study, based on the two-source energy balance algorithm, we applied a method to estimate surface energy fluxes by combined use of multispectral ASTER images and routine meteorological data, and applied it to the City of Indianapolis, United States, aiming at in-depth understanding of the spatial patterns of energy fluxes. By computing the fluxes by land use and land cover (LULC) type, we further investigated the spatial variability of heat fluxes. Results show that the energy fluxes possessed a strong seasonality, with the highest net radiation in summer, followed by spring, fall and winter. Sensible heat flux tended to change largely with surface temperature, while latent heat was largely modulated by the change in vegetation abundance and vigor and the accompanying moisture condition. The fluctuation in all heat fluxes tended to be high in the summer months and low in the winter months. Sensible and latent heat fluxes showed a stronger spatial variability than net radiation and ground heat flux. The variations of net radiation among the land use/cover types were mainly attributable to surface albedo and temperature, while the within-class variability in the turbulent heat fluxes was more associated with the changes in vegetation, water bodies, and other surface factors.
|
| [37] |
城市能源利用碳足迹分析——以厦门市为例 [J].https://doi.org/10.5846/stxb201109251408 URL Magsci 摘要
城市能源利用碳足迹分析综合考虑直接与间接碳排放,对于深度分析碳排放的本质过程、制定科学全面的碳减排计划具有重要意义。以厦门市为研究案例,应用碳足迹的混合分析方法,对厦门市2009年能源利用碳足迹进行了分析,除了包括传统研究中的城市能源终端利用产生的直接碳排放,还计算了跨界交通和城市主要消耗物质的内含能引起的间接碳排放。研究结果表明:(1)城市边界内的工业、交通、商业等部门的能源消耗产生的直接碳排放(即层次1和层次2)只占到总碳足迹的64%,而一直被忽略的跨界交通和城市主要消耗物质的内含能引起的间接碳排放(层次3)占到36%;(2)在直接碳排放中,工业部门的碳排放贡献率最大,占到直接碳排放的55%,其中化工行业带来的碳排放占到工业部门的25%;(3)在间接碳排放中,跨界交通引起的碳排放占间接碳排放的27%,其中长途道路运输贡献率最大,占跨界交通碳排放的38%;主要材料内含能碳排放占间接碳排的73%,其中燃料的内含能碳排放占总内含能的份额最大,达51%。;(4)从人均碳足迹角度比较,厦门市人均碳足迹和丹佛市的人均直接碳排(层次1+层次2)分别为5.74 t CO<sub>2</sub>e/人、18.9 t CO<sub>2</sub>e/人,包含3个层次的人均碳足迹分别为9.01 t CO<sub>2</sub>e/人、25.3 t CO<sub>2</sub>e/人,其中跨界交通引起的碳排放均占总碳足迹的10%左右,主要材料的内含能引起的碳排放分别占到总碳足迹的26%、15%;通过国内外典型城市不同层次碳足迹比较可见厦门还是相对低碳的,但有个显著的特点是主要消耗物质的内含碳排放比例较高,这在一定程度上说明了发展中国家城市消耗更多的基础材料,进一步证明了传统核算中忽略的第3层次碳排放核算与管理的重要性。
Carbon footprint analysis on urban energy use: A case study of Xiamen, China [J].https://doi.org/10.5846/stxb201109251408 URL Magsci 摘要
城市能源利用碳足迹分析综合考虑直接与间接碳排放,对于深度分析碳排放的本质过程、制定科学全面的碳减排计划具有重要意义。以厦门市为研究案例,应用碳足迹的混合分析方法,对厦门市2009年能源利用碳足迹进行了分析,除了包括传统研究中的城市能源终端利用产生的直接碳排放,还计算了跨界交通和城市主要消耗物质的内含能引起的间接碳排放。研究结果表明:(1)城市边界内的工业、交通、商业等部门的能源消耗产生的直接碳排放(即层次1和层次2)只占到总碳足迹的64%,而一直被忽略的跨界交通和城市主要消耗物质的内含能引起的间接碳排放(层次3)占到36%;(2)在直接碳排放中,工业部门的碳排放贡献率最大,占到直接碳排放的55%,其中化工行业带来的碳排放占到工业部门的25%;(3)在间接碳排放中,跨界交通引起的碳排放占间接碳排放的27%,其中长途道路运输贡献率最大,占跨界交通碳排放的38%;主要材料内含能碳排放占间接碳排的73%,其中燃料的内含能碳排放占总内含能的份额最大,达51%。;(4)从人均碳足迹角度比较,厦门市人均碳足迹和丹佛市的人均直接碳排(层次1+层次2)分别为5.74 t CO<sub>2</sub>e/人、18.9 t CO<sub>2</sub>e/人,包含3个层次的人均碳足迹分别为9.01 t CO<sub>2</sub>e/人、25.3 t CO<sub>2</sub>e/人,其中跨界交通引起的碳排放均占总碳足迹的10%左右,主要材料的内含能引起的碳排放分别占到总碳足迹的26%、15%;通过国内外典型城市不同层次碳足迹比较可见厦门还是相对低碳的,但有个显著的特点是主要消耗物质的内含碳排放比例较高,这在一定程度上说明了发展中国家城市消耗更多的基础材料,进一步证明了传统核算中忽略的第3层次碳排放核算与管理的重要性。
|
| [39] |
Urban surface heat fluxes infrared remote sensing inversion and their relationship with land use types [J].https://doi.org/10.1007/s11442-012-0957-7 URL [本文引用: 1] 摘要
AbstractUsing ASTER (Advanced Spaceborne Thermal Emission and Reflection Radiometer) infrared remote sensing data we inversed the parameters of urban surface heat fluxes applying the PCACA model and theoretical position algorithm, and then we analyzed the influence of different land use types on the surface heat fluxes and energy balance. In this study, Kumagaya, a city in Saitama Prefecture, Japan, was selected as the experimental area. The result shows that the PCACA model is feasible for the surface heat fluxes estimation in urban areas because this model requires less parameters in the procedure of heat fluxes estimation in urban areas with complicated surface structure and can decrease the uncertainty. And we found that different land-use types have indicated the height heterogeneity on the surface heat fluxes significantly. The magnitudes of Bowen ratio in descending order are industrial, residential, transportation, institutional, dry farmland, green space, and water body. Under the same meteorological condition, there are distinct characteristics and regional differences in Bowen ratios among different surface covers, indicating higher sensible heat flux and lower latent heat flux in the urban construction land, while lower sensible heat flux and higher latent heat flux in the vegetation-covered area, the outskirt of the urban area. The increase of urban impervious surface area caused by the urban sprawl can enlarge the sensible heat flux and the Bowen ratio, so that it causes the increasing of urban surface temperature and air temperature, which is the mechanism of the so-called heat island effect.
|

/
| 〈 |
|
〉 |
