段炼 , 党兰学, 胡涛
DUAN Lian, DANG Lanxue, HU Tao
通讯作者:
收稿日期: 2018-01-16
修回日期: 2018-04-16
网络出版日期: 2018-07-20
版权声明: 2018 《地球信息科学学报》编辑部 《地球信息科学学报》编辑部 所有
基金资助:
作者简介:
作者简介:段 炼(1981-),男,湖南祁阳人,博士,副教授,硕士生导师,研究方向为时空数据挖掘与犯罪时空预测。E-mail:wtusm@163.com
展开
摘要
由于重点跟踪人员(疑犯)的社会活动监控数据可获取性差,难以直接反映疑犯的社会活动时空模式,降低了案情分析和犯罪风险预测的有效性。为此,本文提出了融合犯罪记录的位置预测(Crime Records enhanced Location Prediction,CReLP)模型,将疑犯犯罪记录信息融入协同过滤算法,预测疑犯在未来对任意位置的访问频度。该方法利用张量(Tensor)表达疑犯在不同时段和位置上的访问频度,基于疑犯的犯罪事件数据构建疑犯时空关联度矩阵,利用该矩阵约束正则化的张量分解(Tensor Decomposition)过程,以解算出张量中的缺失值,进而获得各疑犯的潜在时空分布模式。实验采用包含了241个疑犯、1.9万个位置记录的真实疑犯位置数据集进行了模型测试,结果表明本文方法在均方根误差和 top-k 最小搜寻距离2个指标上都超过其他Baseline方法32%~63%和14%~26%,大幅提高了位置时空预测的有效性和健壮性。
关键词:
Abstract
Suspect mobility prediction enables proactive experiences for location-aware crime investigations and offers essential intelligence to the crime initiative prevention. Recent practical studies and Rational Choice Theory suggest that the crime suspect mobility is predictable. The previous approaches for suspect location prediction focused on the forecasting the spatial likelihood of anchor point (i.e. the residential or future offending place) for a suspect who committed a series of crimes. However, the monitoring data are usually poor in availability for tracking suspects. Thus, the existing methodologies failed to capture the complex social location transition patterns for suspects and lacked the capacity to address the mobility data scarcity issue. Therefore, it is intractable to reflect suspects mobility patterns from sparse monitoring data, which reduces the effectiveness of case analysis and crime risk prediction. To address this challenge, we presented a novel Crime Records enhanced Location Prediction (CReLP) model. By merging the historical crime cases information by a collaborative filtering process, the CReLP model the estimate the visiting intensity at any arbitrary spatiotemporal node for and individual suspect. Particularly, we first obtained basic spatial and temporal units by partitioning the target areas into 100×100 2D grids and segmenting the daytime into 24 time bins. Second, we built a 3D tensor to model the social mobilities of all suspects with each entry in it representing the visiting intensity at each location and each time bin for each suspect. Meanwhile, this approach employed two matrices to express general movement trends among all suspects. Third, we created a suspect-correlation matrix relying on the spatial and temporal proximities of their historical crime events, as well as the similarities between their personal properties. At last, the missing entries in the 3D tensor were filled through the joint decomposition across all tensors and matrices mentioned above. This way were able to uncover the spatial distribution pattern for each suspect at any time. We evaluated the CReLP model using a real-world suspect mobility dataset collected from 241 suspects over 6 months with about 19 thousand location records. The results showed that our model outperformed three baseline approaches by 32% to 63% at RMSE (Root Mean Square Error) and 14% to 26% in TMSD (Top-k Minimum Search Distance), respectively. Finally, a suspect's visiting spatial distributions of the ground truth and predicting results between 8 to 12 a.m. were illustrated to show the performance of our proposed model.
Keywords:
警务时空预测有助于执法机构识别犯罪的扩散模式[1],对防控力量的有效部署和公共安全提升[2]具有重要意义。其中,对疑犯的监控[3]是当前警务时空预测的重要方向之一,利用其位置监控数据进行疑犯位置预测,能为犯罪风险时空预测[4]和案件侦破[5,6]提供重要技术支撑。在犯罪地理学中,犯罪地理画像(Crime Geographic Profiling, CGP)基于系列犯罪分子个体的历史犯罪位置预测锚点(住址、工作地点或下个犯罪位置)。其主要分为近犯罪效应(Morphology)[7]和犯罪行程(Journey-to-Crime,JTC)[8]。Morphology是指疑犯倾向与在其住址或工作地点等锚点位置附近作案的倾向,人们采用几何中心、圆心、线段中位线、几何均值、调和均值和最小距离中心进行锚地预测[9]。JTC是指随着与锚点空间距离的增加,疑犯作案的概率逐渐降低的倾向,人们采用距离衰减函数[10]、平均作案距离[11]、用地类型[12]、路网结构[13]、动力学模型[14]和回归模型[15]进行锚地预测;此外,研究者还基于Bayes方法引入了用地类型、交通可达性、收入等社会环境因素以提高预测结果的精度和可靠性[16]。然而,大部分 CGP研究估算惯犯的住址,而不是预测疑犯的社会活动位置;其次,现实中位置探测源数量和类型有限,导致疑犯个体位置跟踪数据非常稀疏,但已有研究较少考虑数据稀疏对预测性能的影响[17,18]。此外,已有CGP模型较少考虑时间因素对预测准确性的影响。因此,已有研究在数据来源、目的和方法上都难以满足本文要求。近年来,基于车辆定位数据[19]、移动手机信令数据、公共交通刷卡数据[22]和地理社交网络数据[23]等的位置预测成为学术界和工业界的研究热点。他们将社交亲密度、路网密度或社会经济环境等外部信息引入预测模型[25],有效缓减了位置数据稀疏性的不利影响。然而,我们的应用中缺少疑犯间社交或通讯数据,也没有社会经济环境信息的支持;而且,本文关注的是疑犯等非正常人员的位置分布,侧重对其潜在作案位置的估算。因此,常规人员的位置预测方法也不适用本文目标。
已有研究指出,疑犯曾经作案的位置是其较为熟悉也倾向再次作案的场所[26];同时,具有相似社会化习性或社会关联紧密人员,他们的历史作案位置往往也十分类似。如盗窃类疑犯日常集中在火车站广场伺机作案,街头抢劫类疑犯日常集聚在城中偏僻小道(城中道路系统的发达利于案发后迅速逃离)寻找受害者。可见,引入疑犯历史犯罪时空信息及其之间的社会移动关联性,能表达疑犯在更多位置的分布情况,这为降低疑犯位置跟踪数据稀疏性带来的问题带来了曙光,而目前还未见相关研究报道。
基于以上思路,本文将疑犯轨迹数据与历史作案时空信息融合以实现疑犯位置的时空预测。该方法利用张量和矩阵表达疑犯的时空分布情况,依据疑犯历史犯罪数据中构造疑犯时空相似度矩阵,再通过张量与矩阵的协同分解,表达疑犯间的关联性与其作案位置间的潜在约束关系,进而提高疑犯位置时空预测的精度。
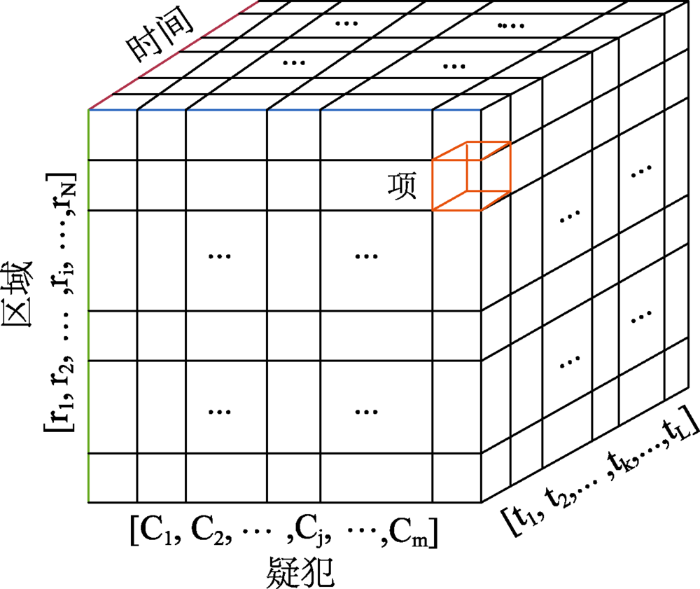
本文目的是预测疑犯在任意时段内在各位置上的访问频度。具体流程如图1所示。首先对研究区域进行空间网格化,对一天中的时间进行分段,获取基本空间单元和基本时间单元;接着,构建反映疑犯个体的时空位置访问频度“疑犯-位置-时间”张量,并建立“位置-时间”矩阵和“疑犯-位置”矩阵,以表达疑犯群体的时空分布特征;其次,利用疑犯历史犯罪数据,计算出疑犯间的犯罪时空相似度,建立“疑犯-疑犯”关联度矩阵;最终,对以上张量和矩阵进行协同分解,以融合疑犯群体的统计先验知识和疑犯历史作案信息计算出“疑犯-位置-时间”张量中的缺失值,利用该张量即可算出疑犯在任意时段位于各位置上的概率。
将研究区域网格化,获得g×g格网G,G={p1, p2, …, pi, …, pg×g},如图2所示。其中,pi为格网G中的单个网格。本文g=100。每个网格作为样本和结果表达基本空间单元,用以表示疑犯在该位置的时空驻留强度和犯罪事件数量。
2.3.1 “疑犯-位置-时段”张量
利用每个疑犯在各网格上的驻留次数,构建三维张量
2.3.2 疑犯-位置访问矩阵
基于疑犯跟踪数据,构建“疑犯-位置”矩阵
2.3.3 位置-时间访问矩阵
为刻画所有疑犯的全局时空分布模式,构建矩阵D∈ℝ|G|×|T|。其中,|G|表示位置数量,|T|表示时段数量。D中第i行和第j列的项表示所有疑犯在j时段访问i位置的次数。该矩阵能为那些仅有很少跟踪记录的疑犯提供其时空分布的先验知识。
疑犯历史案情关联度表现为疑犯在历史犯罪时空节点上的共现或邻近程度。依据社会日常理论(social conformity theory),若两疑犯在相同/邻近位置作案次数越多,他们的潜在驻留位置就越可能相近。据此,本文将通过疑犯的犯罪时空共现情况表达疑犯间的关联性,并据此建立“疑犯-疑犯”关联矩阵
式中:
2.4.1 疑犯属性差异度
疑犯个体属性包括出生地、民族、性别、年龄、居住地、教育程度和工作类型7个指标。利用余弦公式来表达疑犯间的个体属性相似度:
$r_{u,v}=\frac{R_{u}﹒R_{v}}{||R_{u}||||R_{v}||}=\frac{\sum_{i}^{n}R_{ui}R_{vi}}{\sqrt{\sum_{i}^{n}R_{ui}^{2}}\sqrt{\sum_{i}^{n}R_{vi}^{2}}}$ (2)
式中:
2.4.2 历史犯罪事件时空相似度
依据疑犯的历史案件数据隐含的时空位置信息和犯罪类型信息刻画他们的犯罪时空共现度。首先按照时间顺序将疑犯历史案件位置(作为轨迹点)串起来形成轨迹,再通过比较两疑犯历史犯罪轨迹的最短k距离序列计算他们的犯罪时空共现度。疑犯m的历史犯罪轨迹定义为Hm(式(3)):
式中:
最短k距离序列(Shortest k Distance Sequence):给定2个轨迹H1=[a1, a2, …, ak]和H2=[b1, b2, …, bl],它们的最短k距离序列为:
其遵循下面的3个条件:
(1)k
(2)
(3)时空语义距离d(.)的计算公式为:
式中:
当获取最短k距离序列
作案类型和作案位置具有多尺度语义含义,如街头犯罪,可进一步细化为街头抢劫和街头盗窃;作案位置的空间语义如休闲类型可细分为酒吧和网吧等子类型。因此,下面将基于这类特征阐述 t( ),c( )和p( )的计算方法。
(1)犯罪位置语义相似性
本文将犯罪位置对应的POI类型作为其位置语义。位置语义越相近,表明犯罪人员的作案习性越类似。通过比较犯罪位置在POI类型层次树上的距离,表达两两犯罪事件间的位置语义相似性。
POI层次树
表1 POI类型
Table 1 POIs categories
| POI大类 | POI中类 | POI小类 |
|---|---|---|
| 餐饮 | 11 | 47 |
| 汽车服务 | 9 | 16 |
| 运动休闲 | 7 | 51 |
| 地产小区 | 3 | 10 |
| 购物 | 18 | 45 |
| 生活服务 | 19 | 32 |
| 医疗卫生 | 10 | 27 |
| 宾馆酒店 | 4 | 9 |
| 旅游景点 | 5 | 18 |
| 政府机构 | 7 | 116 |
| 文化教育 | 8 | 36 |
| 交通设施 | 11 | 27 |
| 金融行业 | 7 | 8 |
| 地名地址 | 5 | 35 |
| 公司企业 | 3 | 18 |
| 公共设施 | 4 | 4 |
因此,给定犯罪事件ni和nj,它们的位置语义相似度为:
式中:
(2)犯罪类型相似性
类似POI类型层次树,构造类似图5的犯罪类型层次树,并基于两犯罪事件在其各层次犯罪类型上的一致性来表示它们的相似度。
如果2个犯罪类型一致,则
(3)犯罪时间量度
为全面发现和比较疑犯的作案时间模式,将作案时间分为物理时间(如2015年12月3日)和语义时间(如上午、节假日、冬季等)。其中,物理时间能表达2个疑犯作案时间的邻近性;而语义时间能体现疑犯作案的某种时态模式,如夜间作案模式。本文依据社会作息规律,将语义时间分为3类:
①将一天划分为4个语义时间,即7∶00-12∶00(上午),13∶00-18∶00(下午),19∶00-23∶00(晚上),0∶00-6∶00(凌晨);
②将时间划分为:节日、双休、工作日;
③将季节分为:春、夏、秋、冬。
至此,时间相似度为:
其中,
式中:
位置预测的准确性十分依赖数据详细程度[17,18]。而多个矩阵(张量)联合分解,能通过多源数据间的相互约束,提高分解精度[20,21]。因此,利用“疑犯-位置”矩阵E、“位置-时间”矩阵D和疑犯关联矩阵F等与
| 算法1 协同张量分解算法 |
|---|
| Input: Output: Initialize Set While losst-losst+1< Foreach |
式中:核张量(core tensor)
“疑犯-位置”矩阵E可因子分解为
同理,“位置-时间”矩阵
依据以上信息交互关系,得到融合疑犯移动趋势和疑犯间关联性的张量因子分解目标函数:
式中:
疑犯位置数据集包括了W市6个月内(2012年1月-2012年6月)210名疑犯的18 754个停留点,分布在1083个不同的位置上。该数据集中个体疑犯轨迹数据极为稀疏。其中,70%疑犯的轨迹点少于50个,且80%疑犯仅具有6个以内的不同位置,即疑犯的活动集中出现在少数若干位置;此外,疑犯停留的POI类型中,与ATM机相关的位置类型高达11 000多次,其次是网吧、旅店、出租屋、交通站点(机场和车站等)和其他类型(如商场等)。
疑犯历史案情数据集包括这210名疑犯的1208条犯罪记录,平均5.8起/人,中值为3起,最大为12起,最小为1起。每条犯罪记录包括了作案者姓名、身份证号码、案件类型、案情描述、办案派出所、作案时间与地点等信息。
疑犯属性数据库包括了这210名疑犯的出生地、民族、性别、年龄、居住地、教育程度和工作类型7个指标信息。
实验硬件配置为 Intel (R) Core (TM)i7 7700 3.6 GHz (4核), 16 G 内存,操作系统为 Windows 7,软件采用MATLAB2016 a 和 Tensor Toolbox 包。
采用交叉验证,即随机从位置数据集抽取 40%~80%为训练数据,其余的作为测试数据。每轮进行10次交叉验证,记录每轮各方法的指标均值。
采用以下2项为性能指标:
Top-k最小搜索距离(Top-k Minimum Search Distance, TMSD)[29]:描述了结果中top-k个概率最大的位置与正确位置间的最短距离。本文k=8。
均方根误差(Root Mean Square Error,RMSE):
$RMSE=\sqrt{\frac{\sum\limits_{t=1}^{N}(\widehat{y}_{t}-y_{t})^{2}}{N}}$ (13)
式中:
本模型为CReLP。用于比较的Baseline方法为:
(1)MF(Most Frequent Model):该模型利用多项式分布对疑犯在每个时段的位置分布建模,通过该分布计算得到疑犯个体在特定时段下任意位置出现的次数。
(2)PMM(Periodic Mobility Model)[27]:该模型基于以“住址”和“工作地点”为中心的高斯混合模型进行个体预测。本文基于具有两个中心的混合高斯模型对疑犯个体位置进行建模,进而计算得到疑犯个体在任意位置出现的次数。
(3)MFBH[28]:以时间槽为单位为每个疑犯构建“疑犯-位置”矩阵,再基于低阶因子分解方法填充这些矩阵中的缺失值。
此外,还将基于λ1~λ4的变化对预测性能的影响。
CReLP的λ1=λ2=λ3=λ4=0.1,潜在因子数量k=10。图6表示随训练样本的增加各模型的Top-k 最小搜索距离的变化情况。总体来看,CReLP的Top-k距离偏离度优于其他3个模型,仅在训练样本为70%时,CReLP的top-k距离偏离度要稍稍高于PMM。随着训练样本数量的增加,包括CReLP在内的所有模型都获得了更多的数据,它们的Top-k距离偏离度的指标性能开始提升。当训练样本比例达到80%时,各模型达到了其最小距离偏离度。其中,CReLP的最优top-k距离偏离为705 m,优于其他模型7%~15%。这说明本文提出方法能更有效的发现疑犯社会移动模式。
图7展现了各模型的TMSD在一天内6个连续时段的变化情况。对于CReLP来说,晚上8:00至第二天4:00间的TMSD较差,在8:00-12:00间的 TMSD性能最好。PMM模型也具有类似的时态分布模式。而MF和MFBH模型的TMSD时态分布起伏较大,且在各时段上的性能也低于提出的 CReLP模型。
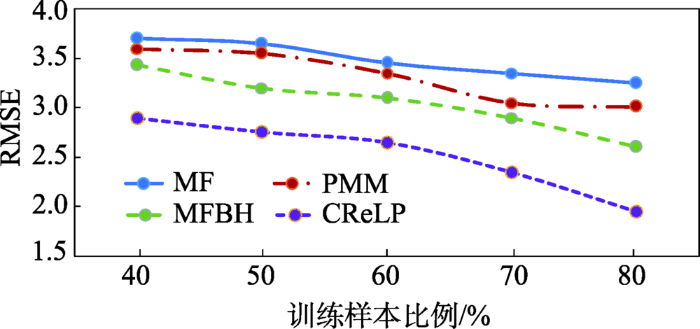
CReLP的λ1=λ2=λ3=λ4=0.1,潜在因子数量k=10。由图8可知,本文提出的CReLP方法在RMSE指标上优于其他3个方法,当训练样本达到总数的80%时,其RMSE为1.93,高于第二名MFBH方法33%,高于最差的MF方法66%。这说明引入疑犯历史犯罪时空信息对疑犯未来时空节点的估算是有效的。MF方法利用多项式分布对疑犯在每个时段的位置分布建模,然而,其在各样本量下的性能值均为最差。有趣的是,缺少时间约束的PMM方法反而比MF的预测性能要好,这可能是时间要素的直接引入导致数据更加稀疏,无法充分刻画疑犯位置分布模式。相比较而言,基于矩阵/张量分解的方法,包括MFBH和本文的CReLP,在各样本量条件下均优于PMM和MF,这表明,在数据稀疏情况下,位置间的潜在环境相似性(潜在因子的相似性)能为疑犯时空分布模式的挖掘提供更多信息。
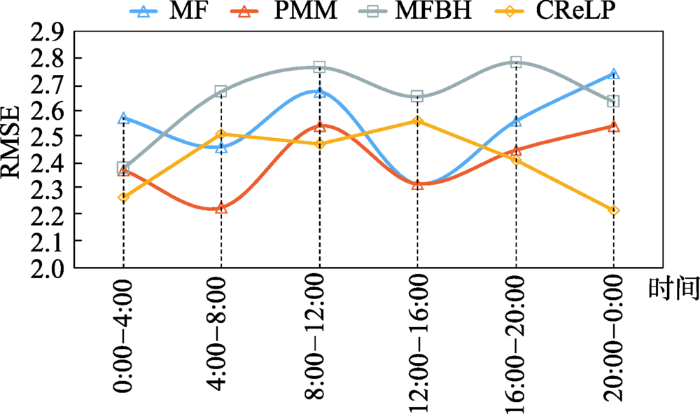
图9展现了各模型的RMSE在一天6个连续时段内的变化模式。可发现,CReLP模型在晚上8时至第二天4时的RMSE较好,与图7得到的结论形成一定的反差,这表明RMSE与TMSD指标的时态分布不具有一致性,需要依据具体应用来确定以哪个指标为主。MF和PMM的RMSE时态分布较为相似,而MFBH的RMSE的时态分布性能最差。
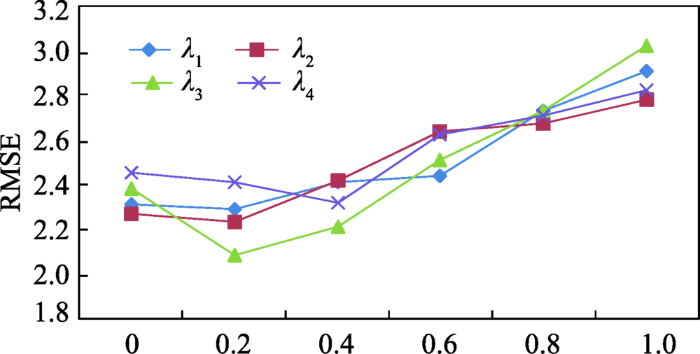
将λ1~λ4控制在0-1之间,通过观察RMSE指标的变化,验证疑犯总体位移信息、疑犯关联信息及正则对位置预测性能的影响。默认情况下, λ1=λ2=λ3=λ4=0.1。如图10所示,集成了疑犯移动的总体趋势信息和疑犯间关联信息后(各λi≠0),模型预测性能有了明显提升。如λ1=λ2=λ3=λ4=0.2时,模型的RMSE都较λ1=λ2=λ3=λ4=0时都有所下降,其中以λ3相关的下降特别明显,表明疑犯历史案情时空相似性的确对疑犯位置的分布具有明显的指示作用。当λ4为0.4时,其RMSE达到最小值,而λ1~λ3都在0.2时,达到各自的最小值,这说明在大量缺失值的情况下,正则化的作用非常重要。但是随着λ1~λ4数值的继续增加,RMSE都开始增加,表明总体性的移动趋势和历史犯罪案情的关联性权重一旦过大,该算法容易模糊疑犯间位移模式的差异性。当λ1~λ4都为1时,RMSE都达到了各自的最大值,同时,疑犯关联度涉及的λ3权重造成的RMSE最大,表明过多依靠历史犯罪案情的相似性较过多依赖疑犯位移总体趋势来说,更加不利于性能的提升。λ1~λ4对TMSD的影响与对RMSE的类似。
图11展现了某疑犯在一天中的8:00~12:00内的真实分布情况和预测结果。其中,黄点表示疑犯的真实驻留位置,褐蓝色的范围表示其在该位置的空间驻留次数,次数越高,颜色越深,影响范围越大。方块表示CReLP模型的预测结果,不同颜色代表其成为目标位置的不同概率。可以看出,一些没有被记录的地方也被模型认为可能存在疑犯的驻留迹象,这为该时段下未报案件和疑犯潜在作案位置的发现提供了支撑;同时,预测结果大都围绕着真实驻留位置而分布,概率高的位置主要围绕着驻留次数多的点,表明预测后的待搜索范围距离疑犯历史位置较近。
为获得疑犯在任何位置上的停留强度(概率),掌握疑犯个体近期和未来的潜在时空位置分布模式,本文设计了一个融入犯罪时空信息的疑犯位置预测方法。该方法利用三维张量和二维矩阵描述疑犯的时空访问模式,基于疑犯历史案情时空分布表达疑犯间的时空关联度,在“疑犯-位置-时间”张量的分解过程中引入疑犯时空关联度,以解算出该张量中的缺失值。该方法有效缓解了疑犯位置数据稀疏性造成的位置预测精度低下的问题。实验利用真实疑犯位置数据集和历史案情数据集对本文所提方法进行了测试,结果表明,本文提出的算法在RMSE和TMSD两个指标上显著高于baseline方法。今后的工作将考虑引入社会位置环境数据或疑犯社交数据进一步提高位置预测模型的性能。
The authors have declared that no competing interests exist.
| [1] |
Visualising space and time in crime patterns: A comparison of methods [J].https://doi.org/10.1016/j.compenvurbsys.2005.07.009 URL [本文引用: 1] 摘要
Previous research exploring space–time patterns has focused on the relative merits and drawbacks of the effectiveness of static maps vis-à-vis interactive dynamic visualisation techniques. In particular, they have tended to concentrate on the role of animation in interpretation of patterns and the understanding of underlying factors influencing such patterns. The aim of this paper is to broaden this debate out to consider the effectiveness of a wider range of visualisation techniques in permitting an understanding of spatio-temporal trends. The merits of three visualisation techniques, (map animation, the comap and the isosurface) are evaluated on their ability to assist in the exploration of space–time patterns of crime disturbance data. We conclude that each technique has some merit for crime analysts charged with studying such trends but that further research is needed to apply the techniques to other sources of crime data (and to other sectors such as health) to permit a comprehensive evaluation of their respective strengths and limitations as exploratory visualisation tools.
|
| [2] |
The use of predictive analysis in spatiotemporal crime forecasting: Building and testing a model in an urban context [J].https://doi.org/10.1016/j.apgeog.2017.06.011 URL [本文引用: 1] 摘要
Police databases hold a large amount of crime data that could be used to inform us about current and future crime trends and patterns. Predictive analysis aims to optimize the use of these data to anticipate criminal events. It utilizes specific statistical methods to predict the likelihood of new crime events at small spatiotemporal units of analysis. The aim of this study is to investigate the potential of applying predictive analysis in an urban context. To this end, the available crime data for three types of crime (home burglary, street robbery, and battery) are spatially aggregated to grids of 200 by 200m and retrospectively analyzed. An ensemble model is applied, synthesizing the results of a logistic regression and neural network model, resulting in bi-weekly predictions for 2014, based on crime data from the previous three years. Temporally disaggregated (day versus night predictions) monthly predictions are also made. The quality of the predictions is evaluated based on the following criteria: direct hit rate (proportion of incidents correctly predicted), precision (proportion of correct predictions versus the total number of predictions), and prediction index (ratio of direct hit rate versus proportion of total area predicted as high risk). Results indicate that it is possible to attain functional predictions by applying predictive analysis to grid-level crime data. The monthly predictions with a distinction between day and night produce better results overall than the bi-weekly predictions, indicating that the temporal resolution can have an important impact on the prediction performance.
|
| [3] |
Novel evaluation metrics for sparse spatio-temporal point process hotspot predictions:Crime Case Study [J].https://doi.org/10.1080/13658816.2016.1159684 URL [本文引用: 1] |
| [4] |
Predictable policing: Predictive crime mapping and geographies of policing and race [J].https://doi.org/10.1080/24694452.2017.1293500 URL [本文引用: 1] 摘要
Abstract This article draws on critical geographic engagements with policing and race and geographic information systems (GIS) to investigate the implications that predictive crime mapping has for racialized modes of urban policing. Focusing on the Chicago Police Department (CPD), it analyzes collaborations between geographic information scientists, crime experts, and police who have recently begun integrating temporal data into GIS-based maps to predict when and where future crimes will occur. The article builds the case that predictive crime mapping further entrenches and legitimizes racialized policing as it (1) rearticulates police data sets as scientifically valid and (2) correlates those data with other geocoded information to create new rationalizations for controlling racialized districts through differential policing practices. The article uses a mixed-methods approach that includes analysis of open-ended interviews with computer scientists involved with the CPD's Predictive Analytics Group and city technical documents to explain the recursive relation between GIS-based knowledge production and racialized policing. The article casts into relief the central role that the production of geographic information plays in current modes of racialized policing and how this contributes to the ongoing racial differentiation of urban geographies.
|
| [5] |
警用多源数据轨迹分析系统设计与实现 [J].
公安5要素中存在各种轨迹信息,不同轨迹之间的关联性对于警务判案、决策分析有着重要的作用。本文通过信息交换共享、多轨联动分析和GIS技术,基于公安部的警用地理信息系统平台建立了一个多源数据轨迹分析系统,实现了警用车辆、营运车辆、网吧上网人员、旅店住宿人员等多源数据的轨迹查询和多轨联动分析。
Design and implementation of multi-source data track analysis system based on PGIS [J].
公安5要素中存在各种轨迹信息,不同轨迹之间的关联性对于警务判案、决策分析有着重要的作用。本文通过信息交换共享、多轨联动分析和GIS技术,基于公安部的警用地理信息系统平台建立了一个多源数据轨迹分析系统,实现了警用车辆、营运车辆、网吧上网人员、旅店住宿人员等多源数据的轨迹查询和多轨联动分析。
|
| [6] |
|
| [7] |
Geographical profiling in a novel context: Prioritising the search for New Zealand sex offfenders [J].https://doi.org/10.1080/1068316X.2013.793331 URL [本文引用: 1] 摘要
The present work explores the utility and value of geographical offender profiling methodologies within a novel context, considering both theoretical and practical issues relating to their application. The effectiveness of a well-known geographical profiling system, Dragnet, was tested across 101 New Zealand sex offence series, and findings compared with those derived for an equivalent sample from the UK. Average search costs (the amount of the total offence area that needed to be searched, starting from predicted offender home location, before the offender's actual home was reached) were far greater for the New Zealand sample than their UK offending counterparts. It is argued that this is because the spatial behaviour of New Zealand offenders violates many of the assumptions that Dragnet and other similar geographical profiling systems make in predicting offenders' home locations. Calibration of the system to the specific home-crime distance patterns of the New Zealand offenders did not enhance the efficacy of predictions made to a significant extent. It is consequently argued that, in their current form, geographical profiling systems are limited in their ability to account for samples displaying very different spatial characteristics to those that they were developed from and for. The implications of these findings for the general utility of geographical profiling are discussed, and ways in which systems might be developed in order to broaden their scope and applicability are suggested.
|
| [8] |
CrimeStat: A spatial statistical program for the analysis of crime incidents [J].https://doi.org/10.1007/978-3-319-17885-1_229 URL [本文引用: 1] 摘要
SynonymsCrimeStat; Spatial statistics program;Crime mapping;Hotspot;Centrographic measures;Interpolation;Space-time interaction;Knox test;Mantel test;Correlated walk;Journey to crime analysis
|
| [9] |
On the complexity and accuracy of geographic profiling strategies [J].https://doi.org/10.1007/s10940-004-1785-4 URL [本文引用: 1] |
| [10] |
The bounds of cognitive heuristic performance on the geographic profiling task [J].https://doi.org/10.1002/acp.1469 URL [本文引用: 1] 摘要
Human performance on the geographic profiling task - where the goal is to predict an offender's home location from their crime locations - has been shown to equal that of complex actuarial methods when it is based on appropriate heuristics. However, this evidence is derived from comparisons of X-marks-the-spot predictions, which ignore the fact that some algorithms provide a prioritization of the offender's area of spatial activity. Using search area as a measure of performance, we examine the predictions of students ( N = 200) and an actuarial method under three levels of information load and two levels of heuristic-environment fit. Results show that the actuarial method produces a smaller search area than a concentric search outward from students' X-marks-the-spot predictions, but that students are able to produce search areas that are smaller than those provided by the actuarial method. Students' performance did not decrease under greater information load and was not improved by adding a descriptive qualifier to the taught heuristic. Copyright 2008 John Wiley & Sons, Ltd.
|
| [11] |
Prediction of series criminals: An approach based on modeling [C]. |
| [12] |
Incorporating land cover within Bayesian journey-to-crime estimation models [J].https://doi.org/10.5539/ijps.v4n2p120 URL [本文引用: 1] 摘要
Crime occurs within asymmetrical landscapes that are occupied by physical and cultural structures that influence a criminal's behavior in space. These structures manipulate the distribution of available targets and bias the offender's perceptions of opportunity and target attractiveness. A recent study demonstrated that criminal geographic profiles can be enhanced to accommodate such ecological characteristics by using land cover classifications as a proxy for these structures. This study expands on these earlier findings by incorporating land cover classes within a Bayesian probability framework. Seven traditional and land cover enhanced geographic profile models for fifty-two burglary, robbery, and larceny serial offenses were compared. Overall, land cover enhanced models performed significantly better than non-enhanced techniques for measures of search costs andprobability estimation. Tests measuring a profile's error distance were mixed and failed to confirm significance between paired comparisons.
|
| [13] |
Weighted-traffic-network-based geographic profiling for serial crime location prediction [J].https://doi.org/10.1209/0295-5075/93/68006 URL [本文引用: 1] |
| [14] |
Geographic profiling from kinetic models of criminal behavior [J].https://doi.org/10.2307/41582570 URL [本文引用: 1] 摘要
We consider the problem of estimating the probability density of the “anchor point” (residence, place of work, etc.) of a criminal offender given a set of observed spatial locations of crimes committed by the offender. Starting from kinetic models of criminal motion and target selection, we derive the probability density of anchor points using the Fokker–Planck equation and Bayes' theorem. Here, geographic inhomogeneities such as housing densities and geographic barriers (bodies of water, parks, etc.) are naturally incorporated into the probability density estimate, as well as directional bias and distance to crime preferences in offender target selection. The resulting equations are steady state advection-diffusion-reaction PDEs. We test our methodology against crime data provided by the Los Angeles Police Department, and our results highlight the benefits of incorporating these elements of criminal behavior and geographic inhomogeneities into profiling estimates.
|
| [15] |
Journey to murder: Examining the correlates of criminal mobility in sexual homicide [J].https://doi.org/10.1080/15614263.2014.994215 URL [本文引用: 1] 摘要
Although the empirical research on the journey to crime seems to indicate that most crimes are committed close to home, only a few studies have specifically examined the journey to crime in cases of sexual homicide. Using a sample of 214 sexual homicide cases, the current study investigates, using logistic regression, offenders who travel during the crime to those offenders who commit their crime, all at the same location. Current findings suggest that sexual murderers who engage in intra-crime travel tend to use a vehicle in the commission of their offence, target adult victims who are involved in the sex trade and move the body post murder.
|
| [16] |
Bayesian network modeling of offender behavior for criminal profiling [C]. |
| [17] |
Modelling the scaling properties of human mobility [J].https://doi.org/10.1038/nphys1760 URL [本文引用: 2] |
| [18] |
The Research of tree topology model for growth of natural selection and application in geographical profile for criminal [C]. |
| [19] |
Where next: A location predictor on trajectory pattern mining [C]. |
| [20] |
Structured data fusion [J].https://doi.org/10.1109/JSTSP.2015.2400415 URL [本文引用: 1] |
| [21] |
Collaborative filtering meets mobile recommendation: A user-centered approach [C]. |
| [22] |
Reconstructing individual mobility from smart card transactions: A space alignment approach [J].https://doi.org/10.1007/s10115-014-0763-x URL [本文引用: 1] 摘要
Smart card transactions capture rich information of human mobility and urban dynamics, therefore are of particular interest to urban planners and location-based service providers. However, since most transaction systems are only designated for billing purpose, typically, fine-grained location information, such as the exact boarding and alighting stops of a bus trip, is only partially or not available at all, which blocks deep exploitation of this rich and valuable data at individual level.This paper presents a "space alignment" framework to reconstruct individual mobility history from a large-scale smart card transaction dataset pertaining to a metropolitan city. Specifically, we show that by delicately aligning the monetary space and geospatial space with the temporal space, we are able to extrapolate a series of critical domain specific constraints. Later, these constraints are naturally incorporated into a semi-supervised conditional random field to infer the exact boarding and alighting stops of all transit routes with a surprisingly high accuracy, e. g., given only 10% trips with known alighting/boarding stops, we successfully inferred more than 78% alighting and boarding stops from all unlabeled trips. In addition, we demonstrated that the smart card data enriched by the proposed approach dramatically improved the performance of a conventional method for identifying users' home and work places (with 88% improvement on home detection and 35% improvement on work place detection).The proposed method offers the possibility to mine individual mobility from common public transit transactions, and showcases how uncertain data can be leveraged with domain knowledge and constraints, to support cross-application data mining tasks.
|
| [23] |
Geolocation prediction in Twitter using social networks: A critical analysis and review of current practice [C]. |
| [24] |
Understanding individual human mobility patterns [J].https://doi.org/10.1038/nature06958 URL 摘要
Understanding human mobility patterns is of major importance for a number of areas, ranging from urban planning to traffic forecasting, transportation geography, and preventing the spread of biological and mobile viruses. Yet, in the absence of tools to monitor the time resolved location of a large number of individuals, our understanding of the basic laws governing human trajectories remains limited. Here we study the individual mobility pattern of mobile phone users whose position is tracked in a time resolved manner. We find that the displacement distribution of the whole population can be approximated with a truncated L\'{e}vy statistics, in agreement with earlier measurements. We show, however, that the main contribution to the observed distribution comes from the differences in the travel pattern of individuals. Furthermore, we find that the individual trajectories are bounded in space and are highly anisotropic, an effect that increases with the trajectory's radius of gyration. After we correct for differences in the radius of gyration and anisotropy all individuals are described by the same universal mobility pattern. These results open new avenues for modeling human motion, with important impact on agent based modeling, epidemic prevention, emergency response and urban planing.
|
| [25] |
Modelling heterogeneous location habits in human populations for location prediction under data sparsity [C]. |
| [26] |
A computational model for predicting the location of crime attractors on a road network [C]. |
| [27] |
Friendship and mobility:user movement in location-based social networks [C]. |
| [28] |
Weighted low-rank approximations [C]. |
| [29] |
Bayesian Journey-to-crime estimation: An improvement in geographic profiling methodology [J].https://doi.org/10.1080/00330124.2010.547152 URL [本文引用: 1] 摘要
A Bayesian approach to geographic profiling methodology involves updating journey-to-crime probability estimates with probabilities based on the distribution of residences of other offenders who committed crimes in the same locations. Tests were conducted on serial offenders from Baltimore County and Chicago and six different methods using five different criteria were compared. The Bayesian method was more accurate than the existing journey-to-crime methods and was as accurate as the center of minimum distance, the current best method. Suggestions for improving the methodology further are provided.
|

/
| 〈 |
|
〉 |


