芦蕊 , 马廷
, 马廷
LU Rui, MA Ting
通讯作者:
收稿日期: 2018-03-15
修回日期: 2018-05-29
网络出版日期: 2018-07-20
版权声明: 2018 《地球信息科学学报》编辑部 《地球信息科学学报》编辑部 所有
基金资助:
作者简介:
作者简介:芦蕊(1994-),女,硕士生,主要从事地理空间分析与系统模拟研究。E-mail: lur@lreis.ac.cn
展开
摘要
本文以中国市域单元为研究对象,利用1990-2010年人口普查数据,采用探索性空间数据分析的方法,分析了过去20 年间中国市级人口增长率的空间分布特征和多变量的空间依赖关系。使用空间计量模型和空间滤波后的经典线性回归模型分别探究了经济、气候、地形、社会文化等因素对中国市级人口增长率的影响。模型对比结果显示,经过空间滤波后的经典线性回归模型能够更好的模拟中国市级人口增长率的变化。在该模型中,经济因素是影响中国城市人口增长率的主要因素,例如代表城市经济发展水平的城市夜光指数密度。气候因素对人口增长率也有着不可忽视的作用,如七月热指数随着等级的提升对人口增长率有着越来越强的负向影响。研究结果表明:人口的区域增长模式是多要素综合作用的结果,在相关建模研究和政策制定中需要重点考虑经济发展水平和气候条件因素对人口增长趋势的不同影响。
关键词:
Abstract
This paper is aimed at exploring the determinants of population growth in Chinese urban areas. With the method of exploratory spatial data analysis and the data of traditional population census between 1990 and 2010, we could delve into the spatial distribution characteristics of the population growth rate and the multivariable spatial dependency during the past twenty years in Chinese city-level. Based on a thorough interpretation of population data, we are able to discover an existing spatial dependency between different cities. Obviously, spatial relations should not be negligible, because the spatial dependency is much stronger within cities living in shorter distance. It is more reasonable to use spatial regression model for our work, therefore, we use spatial lag regression model, spatial error model and classical linear regression model with spatial filtering to explore the influences of economic factors, climate factors, sociocultural factors and topography factors on population growth rate. It is showed that the classical linear regression model with spatial filtering can simulate the urban population growth rate batter than other models in our outcomes. The findings also suggest that economy is the most pivotal factors in population growth, such as the total amount of economy reflected by density of urban nightlight index plays an important role in driving population growth. Meanwhile other factors are following as well. Climatic variation is another systematic and significant factor affecting the rates of urban population growth. Some weather-related movement appears. People are willing to leave the unpleasant places and move to the places with nice weather. For example, with the increase of July heat index, there is a more and more stronger negative impact on population growth. The research shows that Chinese population growth is a complex question. There is a comprehensive action of multi-factor in generating the model of regional population growth. It is necessary to consider the different effects of economic development and climate conditions on the population growth in the researches on corresponding modeling and formulation of policy.
Keywords:
据联合国经济和社会事务部人口司的研究表明2030年世界人口将增加到85亿[1],这种快速的人口增长对发展中国家的影响更为明显,中国是世界上的人口大国并且正处于发展中国家阶段,因此研究中国人口增长与区域动态分布问题具有重要的意义。近几十年来,随着城市化和社会经济的快速发展以及相关政策的引领,中国的人口增长趋势呈现出一定的时空格局特征[2]。从时间上看,人口数量从1990年的11.3亿快速增长到2010年的13.32亿[3]。从空间上看,人口数量的增长呈现出区域间不均衡的态势,不同地区和城市间差异较大[4,5],造成这种差异的因素很多。因此,深入探究人口增长的影响因素对合理引导人口增长、实现城市资源合理配置、促进区域协调发展具有十分重要的意义[6]。
人口增长问题,是一个涉及经济、气候、环境、社会、文化、地形等多方面因素的复杂问题[7,8,9],随着研究尺度和研究区域的不同,影响人口增长的因素也有差异。省际人口流动受到地区经济水平、产业结构、就业机会等因素的影响较强,省内人口流动受经济、教育、交通等因素的影响较强[10]。长江三角洲地区经济水平、产业结构、房价水平、环境是影响人口分布的关键变量[11],东北地区经济水平、行政级别、就业水平、医疗服务水平可以更好的解释人口数量的变化[12],京津冀地区教育水平和交通便利程度是影响人口分布的重要因素[13]。因此,要根据研究尺度和研究区域选择合适的影响因子分析人口增长问题[14]。
在探究人口增长影响因素的模型中,常用的主要有2类:① 传统统计学模型,主要包括经典线性回归模型、面板数据模型以及经济计量模型等,例如,基于多元回归模型探究经济、地形、气候等因素对城市人口增长率的影响[15],基于固定效应的静态和动态面板数据模型讨论区域人口增长的影响因素[16],基于经济计量模型分析城市人口增长的决定因素[17,18]。此类模型通常只考虑人口的统计特征,忽略了人口增长的空间特征,极易导致模型结果出现偏差或错误。② 空间分析模型,此类模型考虑了人口分布的空间关系,将空间关系纳入模型的计量之中。例如,基于Getis-Ord Gi*方法揭示人口密度空间变化与降水量空间分布间的关系[19],基于地理加权回归模型考察自然、经济和社会因素对一个地区人口密度的影响[20],基于空间滞后模型分析人口增长的空间自相关关系[10]。
本文以中国市级人口增长数据的空间特征为基础,通过比较空间滞后模型、空间误差模型和经过空间滤波后的经典线性回归模型的拟合结果,得到最佳拟合模型并分析影响中国市级人口增长的重要因素。
以中国344个市级行政区划单元为研究对象,包含333个地级行政区划单位、4个直辖县区、4个直辖市区以及3个省级直辖区域(河南济源市、新疆石河子市、湖北省直辖行政区)。香港、澳门、台湾地区数据缺失,故本研究不包含这3个地区。
本文使用的人口数据来自第四、第五、第六次人口普查数据,经济数据来自1992-2012年的21幅DMSP/OLS遥感影像,道路里程数据来自中国1 km格网的道路长度数据,气象数据来自中国气象科学数据共享服务网,社会文化数据来自国家统计局的统计数据。数据预处理过程如下:
(1)空间数据与属性数据匹配。用ArcMap软件中的空间连接工具对气候数据、夜光数据、道路数据进行连接[21]。其中,夜光遥感影像数据和道路栅格数据在投影变换的过程中会产生一定的形变,导致距离赤道越远的地方形变越大,所以在空间连接前要先进行数值矫正。
(2)探索人口增长率的空间分布特征及空间依赖关系。如图1所示,从空间分布上看,人口增长率呈现出西高东低,增多减少的趋势。新疆、西藏地区由于国家宽松的人口政策和西部大开发计划的实施,人口增长率普遍要高,中部和四川盆地的一些城市人口增长率因大量人口迁出而呈现出负增长,省会城市的人口增长率普遍较高。从统计结果来看,人口增长率呈现正增长的城市共有282个,呈现负增长的城市共有62个。
图1 1990-2010年中国市级人口增长率分布图
注:香港、澳门、台湾数据暂缺
Fig.1 Distribution of Chinese population growth rate from 1990 to 2010
人口增长率的空间依赖关系用全局莫兰指数(Global Moran's I)分析,如式(1)所示。
式中:n表示研究单元的总数;yi和yj表示i区域和j区域的属性值;
表1 Global Moran's I 统计结果表
Tab. 1 Statistics of Global Moran's I
| 统计量 | 值 |
|---|---|
| Moran I statistic | 0.338 |
| E(I) | -0.003 |
| Var(I) | 0.001 |
| Z(I) | 10.850 |
| P-value | 0.000 |
Global Moran's I的值为0.338,对其进行近似正态分布的相关性检验。假设中国344个市的人口增长率在空间分布上不存在相关性,在α=0.05显著水平下检验的临界值Z0.05=1.96。本文Z(I)>1.96,拒绝假设,即中国各市的人口增长率在空间上存在正相关关系。
在模型选择方面主要采用两种思路来处理人口增长率的空间正相关关系:① 将空间自相关关系纳入模型中,包括空间滞后模型和空间误差模型;② 在模型分析前过滤掉空间自相关关系,即经过空间滤波的经典线性回归模型。在解释变量选择的过程中使用了逐步回归的方法。
以1990-2010年中国各个城市人口增长率为因变量,用popgrowth表示。人口增长率的计算方式如式(2)所示。
式中:popgrowthi表示第i个城市的人口增长率;POP1990i表示第i个城市1990年人口数量;POP2010i表示第i个城市2010年人口数量;i表示344个城市 (i=1,2,…,344)。
在多因素作用下人口增长率的研究中,解释变量的选择往往要基于相关的理论假设,或借鉴已有研究,有些难以精确测量或无法测量的变量,只能使用替代变量或相似变量[22]。本文参考了相关研究[11,14-17],在充分考虑数据可获得性的基础上,选择了经济、气候、地形、社会文化4类影响因素,共12个解释变量(表2)。其中,为了减少通货膨胀带来的影响,本文使用夜晚灯光指数代替GDP数值;考虑到少数民族人口增长迅速的问题[23],加入了少数民族区域的影响;引入Heat Index(HI)表征一个城市七月的人体舒适程度[24]。
表2 变量说明表
Tab. 2 Definitions of the variables
| 变量名 | 含义 | 计算方法 |
|---|---|---|
| NLDens | 城市夜光密度 | 城市夜光指数之和除以城市面积 |
| NLGrow | 城市夜光指数的增长趋势 | 计算城市20年夜光指数的变化趋势 |
| RLSum | 城市道路总里程 | 城市铺装道路总长度 |
| SIRGR | 城市第二产业区位熵 | 城市第二产业从业人数百分比/城市从业人数占全国从业人数的百分比 |
| TIRGR | 城市第三产业区位熵 | 城市第三产业从业人数百分比/城市从业人数占全国从业人数的百分比 |
| APMean | 年降雨量 | 年平均降水量小于400 mm时值为1,否则值为0 |
| JTMean | 城市一月平均气温 | 1月日平均气温的算数平均值 |
| HI | 7月热指数 | 根据城市7月平均气温(T)和7月相对湿度(H)计算得出 |
| APArea | 少数民族自治区域 | 少数民族自治区域值为1,否则值为0 |
| Patent | 专利申请量 | 无 |
| UENum | 大学招生数量 | 无 |
| CoastC | 城市是否临海 | 临海值为1,否则值为0 |
AIC准则是1974年日本统计学家Akaike根据极大似然估计原理提出的一种回归模型自变量选择准则,其核心思想是从m元回归分析开始,每一步舍去一个不显著且导致AIC值大的变量。假设回归模型的似然函数为L(θ, x),AIC定义为:
式中:
逐步回归前人口增长率的经典线性回归模型(全模型)如式(8)所示。
式中:popgrowthi表示人口增长率;α表示常数项;βn表示回归系数;εi表示随机误差;i表示344个城市(i=1,2,…,344)。
逐步回归后简化模型如式(9)所示。
式中:popgrowthi表示人口增长率;α表示常数项;βn表示回归系数;εi表示随机误差;
空间统计学认为在有关地理因素的研究中忽略空间效应会给模型的分析结果带来一定的偏差,甚至导致模型得出错误的结果。所以在经典线性回归的基础上又加入了空间因素,构建了空间滞后模型。空间滞后模型把因变量的空间自相关关系作为一个变量引入模型,通过建立空间权重Wij,将空间关系纳入了模型。如式(10)所示。
式中:popgrowthi表示人口增长率;α表示常数项;ρ表示空间回归系数;Wij表示空间权重矩阵;βn表示回归系数;
空间误差模型是一种常用的空间统计模型,将空间自相关关系作为残差的一部分纳入模型中,如式(11)所示。
式中:popgrowthi表示人口增长率;α表示常数项;βn表示回归系数;
空间滤波是一种比较新颖的空间统计方法。常用的空间滤波方法有3种:① 参数空间滤波,最早通过交叉相关系数的方法来比较2个变量之间的空间自相关关系,与时间序列分析中,预先确定2个序列之间潜在的传递函数的方法相似。② 非参数空间滤波,主要是运用一系列的空间代理变量,从被观测空间对象的基础空间关系矩阵中提取特征向量,通过特征向量移除被观测对象的空间依赖关系[25,26,27]。③ 半参数空间滤波,该方法是在参数空间滤波和非参数空间滤波的基础上发展而来的,主要用空间代理变量来代替空间滞后模型和空间误差模型中的误差项,并且在非参数空间滤波的基础上优化了特征向量的选取,运用最小化残差平方和的原则搜索特征向量[28]。
空间滤波后的经典线性回归模型使用的是半参数空间滤波的方法,首先选取特征变量识别和过滤掉被观测对象的空间依赖关系,然后再使用经典线性回归模型对各个因素进行拟合分析。
本文在运用逐步回归方法确定解释变量后,通过AIC最小准则和方差分析结果对模型进行对比分析,从而找到市级人口增长的最佳拟合模型,并对影响因素进行了分析。
对12个解释变量进行后向逐步回归,用得到的9个解释变量建立简化回归模型。分析逐步回归前后的全模型和简化模型得到(表3):简化模型的判定系数R2更优(0.525<0.529),简化模型的AIC值更小(AIC可以衡量模型拟合的优良和模型的复杂度,为了避免过度拟合,通常选择AIC值较小的模型),并且2个模型不显著的概率都是2.2e-16。所以简化模型的9个解释变量可以更好地拟合中国市级人口增长率。
表3 经典线性回归模型(OLS)统计表
Tab. 3 Statistics of OLS model
| 解释变量 | 模型 | |
|---|---|---|
| 全模型 | 简化模型 | |
| NLDens | 0.529*** | 0.543*** |
| NLGrow | -0.106* | -0.107* |
| RLSum | 0.231‴ | 0.216‴ |
| SIRGRs | -0.026 | - |
| TIRGR | 0.209*** | 0.202*** |
| APMean | 0.468** | 0.449** |
| JTMean | 0.270*** | 0.274*** |
| HIb | -0.106 | -0.105 |
| HIc | -0.545** | -0.535** |
| HId | -0.587** | -0.587*** |
| APArea | 0.280* | 0.277* |
| Patent | -0.182** | -0.179*** |
| UENum | 0.167 | - |
| CoastC | 0.074 | - |
| F-statistic | 28.120*** | 36.01*** |
| AIC | 736.506 | 731.092 |
通过探索性空间数据分析发现,中国市级人口增长率具有空间正相关关系,使用经典线性回归模型而不考虑人口增长率的空间依赖关系会导致模拟结果出现一定偏差。本文给出了空间滞后模型、空间误差模型以及空间过滤后的经典线性回归模型的参数估计结果(表4)。
表4 空间回归模型统计表
Tab. 4 Statistics of spatial regression
| 解释变量 | 空间统计模型 | ||
|---|---|---|---|
| LAG模型 | SEM模型 | SFOLS模型 | |
| NLDens | 0.479*** | 0.645*** | 0.543*** |
| NLGrow | -0.092* | -0.098* | -0.107** |
| RLSum | 0.161 | 0.037 | 0.216‴ |
| TIRGR | 0.219*** | 0.264*** | 0.202*** |
| APMean | 0.304* | 0.368* | 0.449*** |
| JTMean | 0.237*** | 0.326*** | 0.274*** |
| HIb | -0.090 | -0.092 | -0.105 |
| HIc | -0.439** | -0.511** | -0.535*** |
| HId | -0.488** | -0.572** | -0.587*** |
| APArea | 0.226* | 0.232‴ | 0.277** |
| Patent | -0.178*** | -0.166** | -0.180*** |
| RHO | 0.299 | - | - |
| LAMBDA | - | 0.318 | - |
| LR test | 20.385*** | 13.329*** | - |
| ASE | 0.061*** | 0.073*** | - |
| Wald statistic | 24.397*** | 19.165*** | - |
| Log likelihood | -342.353 | -345.882 | -319.109 |
| ML residual variance | 0.421 | 0.428 | - |
| LM test | 12.001(0.000) | - | - |
| SSR | 144.746 | 147.376 | 128.773 |
| AIC | 712.710 | 719.760 | 678.218 |
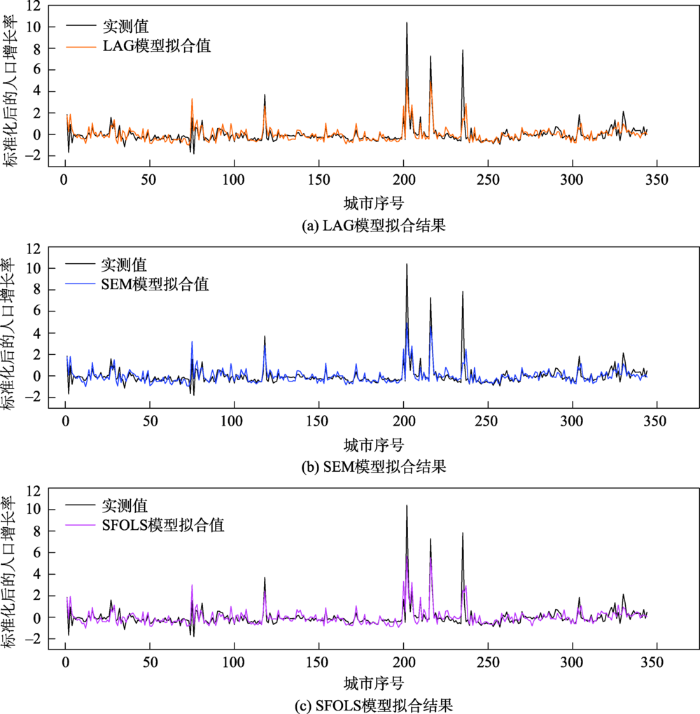
图2中3个模型的预测值与人口增长率的实测值比较接近。本文使用方差分析的方法,两两比较模型的拟合程度。首先比较空间滞后模型和空间误差模型(表5)。根据Anselin等提出的标准[29],Log likelihood的值越大,模型拟合的效果越好,因此空间滞后模型优于空间误差模型。从AIC的结果分析,空间滞后模型的AIC值较小。所以在空间计量模型中,空间滞后模型的拟合效果优于空间误差模型。
图2 3种模型对344个城市的人口增长率模拟结果比较
Fig.2 Comparisons of modelled results of growth rate of human population from three models across 344 cities
表5 方差分析结果1
Tab. 5 Statistics of anova analysis 1
| TEST | LAG | SEM |
|---|---|---|
| df | 14.000 | 14.000 |
| AIC | 712.710 | 719.760 |
| logLik | -342.350 | -345.880 |
对比分析空间滞后模型与经过空间滤波后的经典线性回归模型。方差分析结果显示(表6),经过空间滤波后的线性回归模型的AIC值为678.220,低于空间滞后模型,Log likelihood值为-319.110,高于空间滞后模型。所以经过空间滤波后的经典线性回归模型的拟合效果更优。
表6 方差分析结果2
Tab. 6 Statistics of anova analysis 2
| TEST | SFOLS | LAG |
|---|---|---|
| df | 20.000 | 14.000 |
| AIC | 678.220 | 712.710 |
| logLik | -319.110 | -342.350 |
| L.Ratio | 46.488 | |
| p-value | 0.000 |
在空间滤波后的经典线性回归模型中:经济因素是影响人口增长的主要因素,除了城市道路密度外,都通过了0.01%水平的显著性检验。城市夜光密度的影响系数为0.543,对人口的增长有着显著的正向作用,表明一个城市的经济总量是导致人口增长的重要原因,经济水平较高的城市,对人口流动吸引力较大,导致城市人口增长率快速增加。城市夜光值增长率的影响系数为-0.107,夜光值的增长率表征一个城市经济发展的速度,人口的增长与经济的发展速度间通常有一个相对滞后的过程,经济增长速度快的城市可能现有经济总量还未达到一定的规模,对人口迁移流的吸引还需要一个过程,甚至会出现短期的人口流出现象,所以在分析结果中与人口增长率呈负相关关系。城市道路密度对人口的增长率有着正向但不显著的作用,交通通达性不仅反映城市与外部区域联系的便利程度,而且重要交通枢纽及交通要道沿线对人口的流动具有很强的吸引力,尤其是新的道路的出现,更容易吸引人口流入。第三产业区位熵的系数为0.202,说明对人口的增长有着正向的显著作用,第三产业属于劳动密集型产业,第三产业的增加,带动了就业岗位的增加,促使城市人口数量增加。
在气候因素中,降水量因素的影响系数达到0.449,通过了显著性检验,表明干旱区域人口增长率相对较高,干旱区多分布在中国西北地区,降水量较少,生态脆弱,但人口出生率却普遍较高,而且西部大开发的政策导向使得西北干旱区人口大量增加。1月平均气温的影响系数为0.274,通过了显著性检验,随着中国经济的发展,国民收入的不断增加,冬季气候宜人,风景优美的地方对人口的吸引力不断提高,例如中国海南省,近几年大量外来人口涌入。7月热指数对人口增长的影响随着等级的不同而有所不同。如表4中所示,体感温度在27~32 ℃时(Ⅱ级),热指数的影响系数为-0.105,未通过显著性检验。体感温度在32~41 ℃时(Ⅲ级),热指数的影响系数为-0.535,通过了显著性检验。体感温度在41~54 ℃时(Ⅳ级),热指数的影响系数为-0.587,且通过了显著性检验。整体来看,7月热指数对人口增长率有着负向的作用,并且这种作用随着体感温度的增加而增加。
在社会文化因素方面,少数民族自治区对中国市级人口的增长也有着重要的作用,其影响系数为0.277,通过了显著性检验,我国在少数民族自治区域实施了较为宽松的生育政策,所以少数民族自治区域的人口出生率较高。专利申请量往往代表一个城市的科技水平,它对人口增长率的影响系数为-0.180,且通过了显著性检验,说明专利申请量对一个城市的人口增长率有着负向的作用。专利申请量代表了城市的科技水平和创新水平,科技水平的进步将推动人口的增加,但是将专利成果转化为实用产品需要一个过程,并且科技水平高的地区,人们生育率会下降,导致人口的自然增长缓慢,所以会对城市的人口增长率有负向的作用。
本文通过利用最近三次人口普查数据对中国344个城市的人口数据进行了探索性空间数据分析,在发现中国市级人口增长率具有空间正相关关系后,运用空间滞后模型、空间误差模型以及经过空间滤波后的经典线性回归模型对中国市级人口增长率进行了模拟,得出以下结论:
空间滤波后的经典线性回归模型的拟合效果最好。结果显示,经济因素是影响人口增长率的重要因素,尤其是一个城市的经济总量对人口的增长率有着十分重要的积极作用,经济发达的地区,人口增长率高。气候因素也有着不可忽视的作用,气候条件好的城市人口增长率更高,例如,7月热指数对城市人口的增长有着负向作用,1月气温高的地方会使人口增长较快,年平均降水量少的地方人口增长率较高。社会文化因素中少数民族自治区域对人口增长率有着正向的影响。
本文虽然从经济、气候、地形和社会文化4个方面研究了影响中国市级人口增长率的因素,但是涉及社会文化的因素较少。随着时代的发展,气候环境因素和社会文化因素的影响力将会加强,特别是经济发展到一定阶段时,社会文化因素将会越来越重要,所以在以后的研究中要加强对这方面的因素的考虑,并且加强对相关模型地学机理的研究。
The authors have declared that no competing interests exist.
| [1] |
Department of Economic and Social Affairs, Population Division (2015) . |
| [2] |
近300年来中国人口变化及时空分布格局 [J].Population change and spatiotemporal distribution of China in recent 300 years [J]. |
| [3] |
|
| [4] |
|
| [5] |
中国城市人口流动增长的空间类型及影响因素 [J].
文章利用2000年第五次人口普查和2010年第六次人口普查数据,从地级城市层面分析中国流动人口类型、时空变迁及影响因素。研究结论是:(1)城市人口流入符合集聚规律和规模报酬递增假说,东部发达城市地区和其他区域重要经济中心城市保持着极强的人口集聚能力。(2)城市人口流入增长主要取决于城市所能提供的"综合机会",现代性和国际性特征及生活质量成为吸引外来人口的重要"拉力"条件。(3)城市人口流动存在明显的地域差异。东部地区城市人口流入的主要拉力因素开始呈现高生活质量驱动、知识密集型和技术密集型的创新驱动及高端服务业驱动,而中西部城市流动人口增长驱动力较为复杂。(4)投资对城市流动人口增长,特别是东部和发达城市仍具有较强的驱动作用,消费等因素的影响则不突出。
Spatial-temporal features and influential factors of China urban floating population growth [J].
文章利用2000年第五次人口普查和2010年第六次人口普查数据,从地级城市层面分析中国流动人口类型、时空变迁及影响因素。研究结论是:(1)城市人口流入符合集聚规律和规模报酬递增假说,东部发达城市地区和其他区域重要经济中心城市保持着极强的人口集聚能力。(2)城市人口流入增长主要取决于城市所能提供的"综合机会",现代性和国际性特征及生活质量成为吸引外来人口的重要"拉力"条件。(3)城市人口流动存在明显的地域差异。东部地区城市人口流入的主要拉力因素开始呈现高生活质量驱动、知识密集型和技术密集型的创新驱动及高端服务业驱动,而中西部城市流动人口增长驱动力较为复杂。(4)投资对城市流动人口增长,特别是东部和发达城市仍具有较强的驱动作用,消费等因素的影响则不突出。
|
| [6] |
|
| [7] |
中国人口迁移特征及其影响因素-基于第六次人口普查数据的分析 [J].Characteristics and impact factors of migration in China: Based on the analysis of the sixth census data [J]. |
| [8] |
Recent improvement and projected worsening of weather in the United States [J].https://doi.org/10.1038/nature17441 URL PMID: 27127821 [本文引用: 1] 摘要
Abstract As climate change unfolds, weather systems in the United States have been shifting in patterns that vary across regions and seasons. Climate science research typically assesses these changes by examining individual weather indicators, such as temperature or precipitation, in isolation, and averaging their values across the spatial surface. As a result, little is known about population exposure to changes in weather and how people experience and evaluate these changes considered together. Here we show that in the United States from 1974 to 2013, the weather conditions experienced by the vast majority of the population improved. Using previous research on how weather affects local population growth to develop an index of people090005s weather preferences, we find that 80% of Americans live in counties that are experiencing more pleasant weather than they did four decades ago. Virtually all Americans are now experiencing the much milder winters that they typically prefer, and these mild winters have not been offset by markedly more uncomfortable summers or other negative changes. Climate change models predict that this trend is temporary, however, because US summers will eventually warm more than winters. Under a scenario in which greenhouse gas emissions proceed at an unabated rate (Representative Concentration Pathway 8.5), we estimate that 88% of the US public will experience weather at the end of the century that is less preferable than weather in the recent past. Our results have implications for the public090005s understanding of the climate change problem, which is shaped in part by experiences with local weather. Whereas weather patterns in recent decades have served as a poor source of motivation for Americans to demand a policy response to climate change, public concern may rise once people090005s everyday experiences of climate change effects start to become less pleasant.
|
| [9] |
中国地形起伏度及其与人口分布的相关性 [J].https://doi.org/10.3321/j.issn:0375-5444.2007.10.007 URL [本文引用: 1] 摘要
基于人居环境自然评价的需要,运用GIS技术,采用窗口分析等方法,提取了基于栅格尺度(10km×10km)的中国地形起伏度,并从比例结构、空间分布和高度特征3个方面系统分析了中国地形起伏度的分布规律及其与人口分布的相关性。研究表明:中国的地形起伏度以低值为主,63%的区域低于1(相对高差≤500m);空间分布呈现西高东低、南高北低的格局;随着经度和纬度增高,地形起伏度呈逐渐下降趋势,28oN、35oN、42oN纬线和85oE、102oE、115oE经线上的地形起伏度符合中国三大阶梯的地貌特征;随着海拔高度增加,地形起伏度呈现逐渐升高趋势。实证分析表明:中国的地形起伏度与人口密度有较好的对数拟合关系,拟合度高达0.91;全国85%以上的人口居住在地形起伏度小于1的地区,在地形起伏度大于3的地区居住的人口总数只占全国0.57%。中国地形起伏度与人口分布的相关性区域差异显著,东北、华北、华中和华南等地相关性显著,内蒙古与青藏地区几乎不存在相关性。
The relief degree of land surface in China and its correlation with population distribution [J].https://doi.org/10.3321/j.issn:0375-5444.2007.10.007 URL [本文引用: 1] 摘要
基于人居环境自然评价的需要,运用GIS技术,采用窗口分析等方法,提取了基于栅格尺度(10km×10km)的中国地形起伏度,并从比例结构、空间分布和高度特征3个方面系统分析了中国地形起伏度的分布规律及其与人口分布的相关性。研究表明:中国的地形起伏度以低值为主,63%的区域低于1(相对高差≤500m);空间分布呈现西高东低、南高北低的格局;随着经度和纬度增高,地形起伏度呈逐渐下降趋势,28oN、35oN、42oN纬线和85oE、102oE、115oE经线上的地形起伏度符合中国三大阶梯的地貌特征;随着海拔高度增加,地形起伏度呈现逐渐升高趋势。实证分析表明:中国的地形起伏度与人口密度有较好的对数拟合关系,拟合度高达0.91;全国85%以上的人口居住在地形起伏度小于1的地区,在地形起伏度大于3的地区居住的人口总数只占全国0.57%。中国地形起伏度与人口分布的相关性区域差异显著,东北、华北、华中和华南等地相关性显著,内蒙古与青藏地区几乎不存在相关性。
|
| [10] |
中国人口空间流动格局与省际流动影响因素研究 [J].
利用“五普”及“六普”数据,运用空间分析方法,从省内流动和省际流动两个角度,分省、市、县三个层面对我国人口空间流动格局进行了空间自相关分析。结果表明,省外流入人口呈现明显的空间集聚,中、西部人口向东部沿海集中化流动,热点分析进一步验证了珠三角、长三角、京津冀三个全国性集聚中心的存在。运用一般回归模型和空间回归模型,结论表明影响省内和省外人口流入的因素同中有异。第三产业的发展和较高的职工工资是城市吸引省内和省外流动人口的重要因素,社会公共资源对省内人口流入影响较大,而就业率和城市化水平对省外人口流入影响较大。这些发现可为国家新型城镇化过程中培育发展中西部城市群、加快发展中小城市等战略提供有益参考。
Spatial patterns of population mobility and determinants of inter-provincial migration in China [J].
利用“五普”及“六普”数据,运用空间分析方法,从省内流动和省际流动两个角度,分省、市、县三个层面对我国人口空间流动格局进行了空间自相关分析。结果表明,省外流入人口呈现明显的空间集聚,中、西部人口向东部沿海集中化流动,热点分析进一步验证了珠三角、长三角、京津冀三个全国性集聚中心的存在。运用一般回归模型和空间回归模型,结论表明影响省内和省外人口流入的因素同中有异。第三产业的发展和较高的职工工资是城市吸引省内和省外流动人口的重要因素,社会公共资源对省内人口流入影响较大,而就业率和城市化水平对省外人口流入影响较大。这些发现可为国家新型城镇化过程中培育发展中西部城市群、加快发展中小城市等战略提供有益参考。
|
| [11] |
长三角城市群人口空间分布的时空演变及影响因素研究 [J].https://doi.org/10.3969/j.issn.1674-7178.2017.05.001 URL [本文引用: 2] 摘要
从总体结构、偏移增长、圈层结构以及不均衡特征等四个层面剖析了长三角城市群人口分布的时空演变特征,从人口自然增长因素、经济环境因素、社会环境因素以及自然环境因素等四个方面探析人口空间格局演变的主要影响因素,并基于16个核心城市的面板数据实证检验了影响长三角城市群人口空间分布的关键因素。结果显示:(1)长三角城市群的性别比例较为均衡,老龄化程度较严重且城市群内部差异较大,学历结构要优于全国其他地区;(2)长三角城市群的人口偏移增长量呈现上升趋势,并逐步形成了以上海为中心、南京和杭州为副中心的人口空间圈层体系结构,但人口空间分布的不均衡指数总体上呈现上升趋势;(3)地区经济发展水平、产业结构、房价水平、环境质量和就业率是影响长三角人口空间分布的关键性变量。
Research on the spatial evolution and its influencing factor of population distribution in the Yangtze River urban agglomeration [J].https://doi.org/10.3969/j.issn.1674-7178.2017.05.001 URL [本文引用: 2] 摘要
从总体结构、偏移增长、圈层结构以及不均衡特征等四个层面剖析了长三角城市群人口分布的时空演变特征,从人口自然增长因素、经济环境因素、社会环境因素以及自然环境因素等四个方面探析人口空间格局演变的主要影响因素,并基于16个核心城市的面板数据实证检验了影响长三角城市群人口空间分布的关键因素。结果显示:(1)长三角城市群的性别比例较为均衡,老龄化程度较严重且城市群内部差异较大,学历结构要优于全国其他地区;(2)长三角城市群的人口偏移增长量呈现上升趋势,并逐步形成了以上海为中心、南京和杭州为副中心的人口空间圈层体系结构,但人口空间分布的不均衡指数总体上呈现上升趋势;(3)地区经济发展水平、产业结构、房价水平、环境质量和就业率是影响长三角人口空间分布的关键性变量。
|
| [12] |
1990-2010年东北地区人口变化的空间格局及影响因素 [J].
基于地理空间视角,根据第四、五、六次人口普查数据,运用统计分析、空间分析以及多元逐步回归,探究了东北地区1990~2010年人口变化的时空间特征及其影响因素,以期为东北地区推进新一轮振兴战略并实现人口、经济、社会、环境协调发展提供依据。研究结果表明:①研究时段内东北地区人口增长率低于全国平均水平且增速趋缓,尤其是进入新世纪以后,人口增长愈加乏力。②区域内部人口增长的主要动力不同。人口的迁移流动对人口空间格局重塑起到决定性作用,人口南移已是东北地区人口空间演变的主要趋势。③人口分布的“核心—外围”梯级格局表现出“极化”发展态势,人口空间分布的非均衡性加剧。④人口增减变化空间配置不均匀,人口减少单元明显多于人口增加单元。大部分地级市市区人口快速增加,而中心城市周边市县、资源型市县以及边境市县的人口则不断减少。⑤经济水平、行政级别、就业水平、医疗水平、产业结构均在不同程度上对1990~2010年东北地区的人口变化具有显著影响,而经济水平对人口变化的牵引作用最强。
Spatial pattern of population change and its influencing factors in northeast China from 1990 to 2010 [J].
基于地理空间视角,根据第四、五、六次人口普查数据,运用统计分析、空间分析以及多元逐步回归,探究了东北地区1990~2010年人口变化的时空间特征及其影响因素,以期为东北地区推进新一轮振兴战略并实现人口、经济、社会、环境协调发展提供依据。研究结果表明:①研究时段内东北地区人口增长率低于全国平均水平且增速趋缓,尤其是进入新世纪以后,人口增长愈加乏力。②区域内部人口增长的主要动力不同。人口的迁移流动对人口空间格局重塑起到决定性作用,人口南移已是东北地区人口空间演变的主要趋势。③人口分布的“核心—外围”梯级格局表现出“极化”发展态势,人口空间分布的非均衡性加剧。④人口增减变化空间配置不均匀,人口减少单元明显多于人口增加单元。大部分地级市市区人口快速增加,而中心城市周边市县、资源型市县以及边境市县的人口则不断减少。⑤经济水平、行政级别、就业水平、医疗水平、产业结构均在不同程度上对1990~2010年东北地区的人口变化具有显著影响,而经济水平对人口变化的牵引作用最强。
|
| [13] |
The impact of new transportation modes on population distribution in Jing-Jin-Ji region of China [J].
This paper conducts a novel study in China Jing-Jin-Ji region to investigate the determinants of population distribution and short-term migration based on a comprehensive dataset including traditional census data, earth observation data, and emerging Internet data. Our results show that due to the high level of urbanization in this region, natural conditions are no longer the strongest determinants of population distribution. New transportation modes, such as high-speed rail, have arisen as a significant determinant of population distribution and short-term migration, particularly in large cities. Socio-economic factors such as GDP, investment, urbanization level, and technology, which are traditionally assumed to govern population distribution and short-term migration, have less influence although education still remains an important factor affecting population distribution. These findings will contribute valuable information to regional planning decision-making in the Jing-Jin-Ji region.
|
| [14] |
中国城市人口规模的空间演化及影响因素-基于264个地级市的实证研究 [J].https://doi.org/10.3969/j.issn.1000-4149.2017.06.004 URL [本文引用: 2] 摘要
从集聚收益与成本角度探讨城市人口规模的空间演化机制,并采用含有地理距离、经济距离和流动网络权重的空间自回归模型,实证检验不同层级城市人口规模的空间演化路径与影响因素.研究发现不同层级城市人口规模演化路径均表现出显著的收敛增长特性,且1类大及以上城市的收敛增长系数最大,2类大城市和小城市系数大小相当并居中,中等城市的系数最小;工资、 第三产业发展、 教育、 医疗水平是促进人口规模增长的主要收益因素,环境污染强度是抑制人口规模增长的主要成本因素.
The spatial evolution and influence factors of urban population: Empirical analysis on 264 cities' data in China [J].https://doi.org/10.3969/j.issn.1000-4149.2017.06.004 URL [本文引用: 2] 摘要
从集聚收益与成本角度探讨城市人口规模的空间演化机制,并采用含有地理距离、经济距离和流动网络权重的空间自回归模型,实证检验不同层级城市人口规模的空间演化路径与影响因素.研究发现不同层级城市人口规模演化路径均表现出显著的收敛增长特性,且1类大及以上城市的收敛增长系数最大,2类大城市和小城市系数大小相当并居中,中等城市的系数最小;工资、 第三产业发展、 教育、 医疗水平是促进人口规模增长的主要收益因素,环境污染强度是抑制人口规模增长的主要成本因素.
|
| [15] |
Population growth in European cities: Weather matters - but only nationally [J].https://doi.org/10.1080/00343400500449259 URL [本文引用: 1] 摘要
CHESHIRE P. C. and MAGRINI S. (2006) Population growth in European cities: weather matters – but only nationally, Regional Studies 40, 23–37. This paper investigates differences in the rate of growth of population across the large city-regions of the European Union (EU)-12 between 1980 and 2000. The US model, which assumes perfect factor mobility, does not seem well adapted to European conditions. There is evidence strongly suggesting that equilibrating migration flows between cities in different countr
|
| [16] |
Do local amenities affect the appeal of regions in Europe for migrants [J].https://doi.org/10.1111/j.1467-9787.2012.00779.x URL [本文引用: 1] 摘要
ABSTRACT This paper delves into the factors, which determine the attractiveness of regions in Europe for migrants. Contrary to the literature on the United States, which has increasingly focused on the role of amenities, existing research in Europe tends to highlight the predominance of economic conditions as the main drivers of migration. Differentiating between economic, sociodemographic and amenity-related territorial features, we examine the appeal of various regional characteristics for migrants by analyzing net migration data for 133 European regions between 1990 and 2006. Our results show that, in addition to economic, human capital-related and demographic aspects, network effects and—in contrast to existing literature—different types of regional amenities exert an important influence on the relative attractiveness of sub-national territories across the European Union. Our findings therefore indicate that locational choices in Europe may be much more similar to place-based preferences in the United States than originally thought.
|
| [17] |
Consumption amenities and city population density [J].https://doi.org/10.1016/j.regsciurbeco.2008.02.001 URL [本文引用: 2] 摘要
Population density varies widely among U.S. metro areas. A simple, static general equilibrium model demonstrates that moderate differences in metro areas' consumption amenities can cause extremely large differences in their population density. Such amenities are more strongly capitalized into housing prices than into wages. Empirical results suggest that amenities do indeed help support high density levels and that amenities are becoming a more important determinant of where people choose to live. Matching the empirical correlation between wages and density requires that amenities cause approximately one fifth of the cross-sectional variation in metro population density.
|
| [18] |
中国城市人口增长的决定因素分析 [J].https://doi.org/10.3969/j.issn.1000-7881.2004.05.002 URL [本文引用: 1] 摘要
文章从城市发展的基本理论出发,利用计量经济学模型,分析了中国20世纪90年代城市人口增长的决定因素.实证分析的结果表明:(1)中国城市的发展具有趋同性,即城市规模越大,人口增长率越低;(2)迁移的惯性对城市人口增长起促进作用;(3)对外开放能显著促进城市的发展,在经济还处于相对封闭状态的内陆地区,其作用尤为显著;(4)基础设施条件能显著影响城市人口增长的节奏.
The determinants of urban population growth in China [J].https://doi.org/10.3969/j.issn.1000-7881.2004.05.002 URL [本文引用: 1] 摘要
文章从城市发展的基本理论出发,利用计量经济学模型,分析了中国20世纪90年代城市人口增长的决定因素.实证分析的结果表明:(1)中国城市的发展具有趋同性,即城市规模越大,人口增长率越低;(2)迁移的惯性对城市人口增长起促进作用;(3)对外开放能显著促进城市的发展,在经济还处于相对封闭状态的内陆地区,其作用尤为显著;(4)基础设施条件能显著影响城市人口增长的节奏.
|
| [19] |
A spatial analysis of population dynamics and climate change in Africa: potential vulnerability hot spots emerge where precipitation declines and demographic pressures coincide [J].https://doi.org/10.1007/s11111-014-0209-0 URL [本文引用: 1] 摘要
We present an integrative measure of exposure and sensitivity components of vulnerability to climatic and demographic change for the African continent in order to identify “hot spots” of high potential population vulnerability. Getis-Ord Gi* spatial clustering analyses reveal statistically significant locations of spatio-temporal precipitation decline coinciding with high population density and increase. Statistically significant areas are evident, particularly across central, southern, and eastern Africa. The highly populated Lake Victoria basin emerges as a particularly salient hot spot. People located in the regions highlighted in this analysis suffer exceptionally high exposure to negative climate change impacts (as populations increase on lands with decreasing rainfall). Results may help inform further hot spot mapping and related research on demographic vulnerabilities to climate change. Results may also inform more suitable geographical targeting of policy interventions across the continent.
|
| [20] |
|
| [21] |
A comparison of methods for calculating population exposure estimates of daily weather for health research [J].https://doi.org/10.1186/1476-072X-5-1 URL [本文引用: 1] |
| [22] |
|
| [23] |
基于“胡焕庸线”的中国少数民族人口分布及其变动 [J].
"胡焕庸线"作为中国人口的突变线,从1935年提出至今的80余年里,在国内外引起广泛的关注和深刻的思考。文章从民族人口的视角出发,收集和整理1953~2010年期间六次全国人口普查的县级资料,运用Arc GIS、Geo Data的空间分析技术,对"胡焕庸线"两侧的民族人口分布状况、变动趋势进行统计和分析。结果表明:中国少数民族人口空间分布不均衡,具有显著的空间集聚性,少数民族人口在传统分布区形成多个热点分布区域;中国少数民族人口分布广泛,民族人口向东部地区乃至全国范围迁移扩散的态势显著;中国少数民族人口分布格局具有非凡的稳定性。从1953~2010年东南半壁和西北半壁少数民族人口75∶25的比重一直相对稳定,可以说"胡焕庸线"也是中国少数民族人口的突变线。
Distribution and change of the ethnic minority population in China: A “Hu Line” perspective [J].
"胡焕庸线"作为中国人口的突变线,从1935年提出至今的80余年里,在国内外引起广泛的关注和深刻的思考。文章从民族人口的视角出发,收集和整理1953~2010年期间六次全国人口普查的县级资料,运用Arc GIS、Geo Data的空间分析技术,对"胡焕庸线"两侧的民族人口分布状况、变动趋势进行统计和分析。结果表明:中国少数民族人口空间分布不均衡,具有显著的空间集聚性,少数民族人口在传统分布区形成多个热点分布区域;中国少数民族人口分布广泛,民族人口向东部地区乃至全国范围迁移扩散的态势显著;中国少数民族人口分布格局具有非凡的稳定性。从1953~2010年东南半壁和西北半壁少数民族人口75∶25的比重一直相对稳定,可以说"胡焕庸线"也是中国少数民族人口的突变线。
|
| [24] |
The assessment of sultriness. part I: A temperature-humidity index based on human physiology and clothing science [J].https://doi.org/10.1175/1520-0450(1979)018<0861:TAOSPI>2.0.CO;2 URL [本文引用: 1] |
| [25] |
Comparative spatial filtering in regression analysis [J].https://doi.org/10.1111/j.1538-4632.2002.tb01080.x URL [本文引用: 1] 摘要
Abstract One approach to dealing with spatial autocorrelation in regression analysis involves the filtering of variables in order to separate spatial effects from the variables’ total effects. In this paper we compare two filtering approaches, both of which allow spatial statistical analysts to use conventional linear regression models. Getis’ filtering approach is based on the autocorrelation observed with the use of the G i local statistic. Griffith's approach uses an eigenfunction decomposition based on the geographic connectivity matrix used to compute a Moran's I statistic. Economic data are used to compare the workings of the two approaches. A final comparison with an autoregressive model strengthens the conclusion that both techniques are effective filtering devices, and that they yield similar regression models. We do note, however, that each technique should be used in its appropriate context.
|
| [26] |
Semiparametric filtering of spatial autocorrelation: The eigenvector approach [J].https://doi.org/10.1068/a37378 URL [本文引用: 1] |
| [27] |
Peres-Neto P R. Spatial modeling in ecology: The flexibility of eigenfunction spatial analyses [J].https://doi.org/10.1890/0012-9658(2006)87[2603:SMIETF]2.0.CO;2 URL PMID: 17089668 [本文引用: 1] 摘要
Recently, analytical approaches based on the eigenfunctions of spatial configuration matrices have been proposed in order to consider explicitly spatial predictors. The present study demonstrates the usefulness of eigenfunctions in spatial modeling applied to ecological problems and shows equivalencies of and differences between the two current implementations of this methodology. The two approaches in this category are the distance-based (DB) eigenvector maps proposed by P. Legendre and his colleagues, and spatial filtering based upon geographic connectivity matrices (i.e., topology-based; CB) developed by D. A. Griffith and his colleagues. In both cases, the goal is to create spatial predictors that can be easily incorporated into conventional regression models. One important advantage of these two approaches over any other spatial approach is that they provide a flexible tool that allows the full range of general and generalized linear modeling theory to be applied to ecological and geographical problems in the presence of nonzero spatial autocorrelation.
|
| [28] |
Comparative spatial filtering in regression analysis [J].https://doi.org/10.1111/j.1538-4632.2002.tb01080.x URL [本文引用: 1] 摘要
Abstract One approach to dealing with spatial autocorrelation in regression analysis involves the filtering of variables in order to separate spatial effects from the variables’ total effects. In this paper we compare two filtering approaches, both of which allow spatial statistical analysts to use conventional linear regression models. Getis’ filtering approach is based on the autocorrelation observed with the use of the G i local statistic. Griffith's approach uses an eigenfunction decomposition based on the geographic connectivity matrix used to compute a Moran's I statistic. Economic data are used to compare the workings of the two approaches. A final comparison with an autoregressive model strengthens the conclusion that both techniques are effective filtering devices, and that they yield similar regression models. We do note, however, that each technique should be used in its appropriate context.
|
| [29] |
|

/
| 〈 |
|
〉 |
