郑海亮 , 房世峰
, 房世峰
ZHENG Hailiang, FANG Shifeng
通讯作者:
收稿日期: 2018-09-11
修回日期: 2018-11-11
网络出版日期: 2019-02-20
版权声明: 2019 《地球信息科学学报》编辑部 《地球信息科学学报》编辑部 所有
基金资助:
作者简介:
作者简介:郑海亮(1979-),男,安徽淮南人,高级工程师,博士,主要从事生态环境保护、医学影像技术、生物力学等研究。 E-mail: doczheng@126.com
展开
摘要
青藏高原脆弱的高寒植被对外界干扰十分敏感,使其成为研究植被对气候变化响应的理想区域之一。青藏高原气候变化剧烈,在较短的合成时间研究气候变化对植被的影响十分必要。因此,本文利用GIMMS NDVI时间序列数据集,研究了1982-2012年青藏高原生长季月尺度植被生长的时空动态变化,探讨了其与气温、降水量和日照时数等气候因子的响应关系。结果表明:在区域尺度上,除8月外,其他各月份植被均呈增加趋势,显著增加多发生在4-7月和9月;大部分月份的NDVI增加速率随着时段的延长显著减小,表明NDVI增加趋势放缓;在像元尺度上,月NDVI显著变化的区域多呈增加趋势,但显著减少范围的扩张多快于显著增加。4月和7月植被生长主要是受气温和日照时数共同作用,6月和9月受气温的控制,而8月则主要受降水量的影响。长时间序列NDVI数据集的出现为采用嵌套时段研究植被生长变化趋势奠定了前提,而植被活动变化趋势的持续性则有助于形象表征植被活动变化过程、深入理解植被对气候变化的响应和预测植被未来生长变化趋势。由此推测,青藏高原月NDVI未来增加趋势总体上趋于缓和,但在像元尺度显著变化的区域趋于增加。
关键词:
Abstract
Understanding the spatial pattern and dynamic processes of vegetation changes and their causes is one of the key topics in research on global change of terrestrial ecosystems. Characterized by vulnerable alpine vegetation, which is sensitive to external disturbance, the Qinghai-Tibet Plateau is one of the ideal areas for studying the response of vegetation to climate change. It is necessary to investigate the impacts of climate change on vegetation in a short synthetic period because of the intense climate variations in the Qinghai-Tibet Plateau. Previous studies have not sufficiently investigated NDVI change comparisons between various periods and the persistence of NDVI trends. In this study, we investigated monthly vegetation dynamics in the Qinghai-Tibet Plateau and their relationships with climatic factors over 15 progressive periods of 18-32 years starting in 1982. This was accomplished by using the updated Global Inventory Modeling and Mapping Studies (GIMMS) third generation global satellite Advanced Very High Resolution Radiometer (AVHRR) Normalized Difference Vegetation Index (NDVI) dataset and climate data. The NDVI time-synthesis method of each season masks the trends of NDVI variations within the single month. Except for August, vegetation increased in other six months, with a significant increase occurring in April-July and September. The increase rate of NDVI in most months decreased significantly with the extension of the period, indicating that the increasing trend of NDVI slowed down. At pixel scale, the regions with significant changes (including both increase and decrease) in NDVI showed increasing trends in most months, but the range of significant decreases in NDVI expanded faster than that of significant increases. Vegetation activities in the Qinghai-Tibet Plateau are generally controlled by temperature changes, but the dominant climatic factors affecting vegetation are varied in different months and regions. The vegetation activities in April and July were mainly promoted by temperature and sunshine hours, and those in June and September were controlled by temperature, and in August were mainly affected by precipitation. The emergence of long time series NDVI data sets provides a precondition for application of nested time series to study the trend analysis of vegetation growth and change. The persistence of the trend of vegetation activity may help to visualize the process of vegetation change, understand the vegetation response to climate change, and to predict thevegetation growth trend. It is inferred that the increases of NDVI in the future tend to be more moderate in general, but areas with significant pixel-scale changes in NDVI tend to increase in most months.
Keywords:
作为生态功能的综合测量[1,2],植被生产力的时空变化对于陆地碳汇估算、自然资源管理、生态学研究非常重要[3],监测植被生长变化、理解其成因已经成为过去几十年全球变化的关键问题之一[4,5,6]。归一化植被指数(Normalized Difference Vegetation Index, NDVI)作为表征地表植被覆盖和植被生长状况的敏感度量参数,可以很好地反映地表植被覆盖与生长状况及其动态变化[7],是公认的用于定量表征植被生长状态及植被覆盖度的最佳因子[8];同时,NDVI也被认为是植被生产力的有效代理指标[1,2,9-12],是土地退化的关键度量指标之一[11,13-14],从区域到全球尺度均得到了非常广泛的关注和应用[15]。长时间序列的NDVI数据是了解植被过去、监测现状、迎接未来挑战的强有力工具[4,16-17]。
青藏高原是地球上最高的高原,具有独特的植被组成和气候特征,处于生物极限水平的水热条件使得区域生态系统十分脆弱[18,19],被认为是全球气候变化的敏感区[19,20-23]。最近几十年,青藏高原经历了比同纬度地区更剧烈的气候变化[20,24-25],环境状况发生了较大改变[26,27,28]。在此情况下,青藏高原地表植被的变化及其对气候变化的响应受到了非常广泛的关注。在青藏高原应用较多的NDVI时间序列数据集包括GIMMS NDVI、MODIS NDVI和SPOT-VGT NDVI等。基于GIMMS NDVI数据集的研究,研究时段的起点多为1982年,结束点包括1999、2002、2003、2006、2008、2009、2012年等时段[12,21-22,29-34];使用SPOT VGT和MODIS NDVI的研究起始点分别为1998年和2000年。研究时段的不同造成研究结果不完全相同,无法直接进行相互验证、对比,也缺乏多个时段之间的对比分析。在上述研究中,NDVI的合成时间多为生长季或季节,在月尺度上的研究较少,而不同的合成时段长度对结果有一定的影响。由于气候因子的年内变化和差异,植被在一年内的不同生长时期对气温、降水量等气候要素的需求、对气候变化的敏感程度也可能不同,因此,需要在月尺度上进行植被与气候变化的关系研究。本文利用GIMMS NDVI3g数据集,分别在1982-1999年、1982-2000年、……、1982-2012年共14个时段研究青藏高原月尺度的植被生长动态变化,以及其对气候变化和人类活动的响应,识别显著的区域,尤其是植被覆盖明显降低的区域,以期指导区域未来的生态保护与恢复工作。
青藏高原位于中国西南部,地域辽阔(73˚18'52" E-104˚46'59" E,26˚00'12" N-39˚46'50" N),面积约257万km2,东西长约2945 km,南北宽达1532 km。区域自然地理环境独特,地势高耸,山脉绵亘,地形复杂多样。青藏高原是中国最高的一级地形阶梯,也是中国乃至亚洲的重要生态屏障[35]。海拔、纬度和与海距离等因素的综合作用,造就了区域气候的水平地带分布:从东南部的温暖湿润转变为西北部的寒冷干燥,具有典型的高原气候特征。同时,由于区域内海拔的变化,植被分布也存在一定的垂直地带性。因此,青藏高原是研究植被对气候变化响应的理想区域之一。草地植被是本区的主要植被类型。
最新发布的1982-2012年的GIMMS NDVI3g数据来源于NASA戈达德航天中心全球监测与模拟研究组[36,37],合成时间为15 d,空间分辨率为 8 km×8 km。该数据集消除了火山爆发、太阳高度角和传感器灵敏度随时间变化等的影响,能够满足区域植被监测的需求[38,39],具有数据质量较好、时间序列长、数据一致性好等特点,为植被动态变化监测研究提供了数据基础。
1982-2012年气象数据来源于中国气象科学数据共享服务网[40],包括青藏高原及其周边的142个站点的月气温、降水量数据。
一般认为,NDVI为负值和较小值时,地表多为水体和裸地,非植被覆盖。青藏高原植被覆盖相对较差,若不排除非植被区域,则可能对结果产生较大影响。参考相关研究[4,20-21,41-42],采用0.1的NDVI值作为植被阈值,排除非植被因素的干扰。
为了定量描述月NDVI的变化趋势,采用其与年份的线性回归系数和相关系数来表征变化量和变化趋势的显著性。利用月NDVI与气候因子的线性相关性判断植被与气候因子作用关系的性质和强度。
为深入探讨植被变化的动态过程、展望未来变化趋势,并与各种时段的已有研究便于对比,采用嵌套时段研究青藏高原的植被变化趋势,即在1982-1999年、1982-2000年、……、1982-2012年14个时间段上计算月NDVI的变化趋势及其与气候要素之间的相关性。14个时段之间变化趋势的对比,有助于进一步理解植被动态变化过程。14个时段NDVI变化量的变化趋势、强度,采用其与1999-2012年的Pearson相关系数、斜率来计算。对于上述所有趋势计算、相关性分析,根据显著性检验结果将变化趋势和相关性分为3个等级:极显著(P<0.01);显著(P<0.05);不显著(P ≥ 0.05)。
3.1.1 区域尺度
1982-2012年,各月份NDVI均呈增加趋势,尤其是4月和9月增加趋势显著。除8月大多数时段NDVI变化量为负值外,其他月份所有时段的变化量均为正值(表1),总体呈波动增加趋势(图1)。 4月的大部分时段、5-7月的前几个时段和9月后 2个时段变化显著(表1)。4-7月NDVI变化量随时段延长而持续显著减少(R2 = 0.69, R2 = 0.93, R2 = 0.787, R2 = 0.85, n = 14),8月略有减少。9月和10月NDVI变化量随时段延长呈不显著增加趋势(图1)。
图1 青藏高原生长季月尺度NDVI变化趋势
Fig. 1 Trends in monthly NDVI in the Qinghai-Tibet Plateau
表1 青藏高原各时段月NDVI变化率
Tab. 1 Slopes in monthly NDVI during nested periods in the Qinghai-Tibet Plateau (10-4/yr)
| 4月 | 5月 | 6月 | 7月 | 8月 | 9月 | 10月 | |
|---|---|---|---|---|---|---|---|
| 1982-1999 | 14.51** | 13.72* | 17.96* | 13.37* | -1.15 | 6.32 | 0.51 |
| 1982-2000 | 9.96* | 11.37* | 20.68* | 15.37* | -0.89 | 4.61 | 0.77 |
| 1982-2001 | 7.96 | 9.52* | 16.36* | 14.18** | -0.45 | 3.59 | 5.05 |
| 1982-2002 | 8.30* | 9.42* | 17.25* | 12.31* | 0.37 | 1.87 | 4.54 |
| 1982-2003 | 8.10* | 7.83* | 12.32 | 10.11* | -1.55 | 0.42 | 3.35 |
| 1982-2004 | 8.78* | 6.18 | 8.18 | 7.50 | -2.61 | 2.43 | 3.02 |
| 1982-2005 | 6.41 | 5.84 | 8.50 | 4.40 | -4.70 | 5.24 | 3.61 |
| 1982-2006 | 6.18 | 5.55 | 7.53 | 5.23 | -4.08 | 4.47 | 3.13 |
| 1982-2007 | 6.44* | 5.69* | 6.79 | 3.33 | -4.33 | 5.29 | 2.71 |
| 1982-2008 | 5.64* | 4.71 | 6.44 | 3.37 | -6.38 | 3.38 | 3.02 |
| 1982-2009 | 6.71* | 4.45 | 6.43 | 3.16 | -4.27 | 4.33 | 2.45 |
| 1982-2010 | 6.00* | 3.77 | 4.75 | 3.77 | -2.17 | 6.14 | 3.98 |
| 1982-2011 | 5.42* | 2.53 | 5.44 | 4.08 | 0.53 | 6.72* | 3.82 |
| 1982-2012 | 4.78* | 1.52 | 2.82 | 1.74 | 0.96 | 6.41* | 2.94 |
3.1.2 像元尺度
除5月、8月外,4-10月所有时段NDVI呈增加趋势的面积均超过50%,呈显著增加趋势的区域也远大于呈显著减少的区域(表2,见第205页)。8-10月显著增加的区域主要集中在东北部和西南部,4月主要分布在东部地区,5-7月则比较分散;5月最后一个时段显著减少的像元较为集中,主要分布在西南和东北部分地区,其他月份显著减少范围较少,且分布较为分散(图2,见第206页)。
图2 青藏高原部分月份NDVI变化的空间格局
Fig. 2 Spatial patterns of monthly NDVI changes in the Qinghai-Tibet Plateau
表2 青藏高原月NDVI呈增加、显著增加和显著减少区域比例
Tab. 2 Area proportions of significant increase and decrease in monthly NDVI (%)
| 时段 | 4月 | 5月 | 6月 | 7月 | ||||||||
|---|---|---|---|---|---|---|---|---|---|---|---|---|
| 增加 P | 显著减少SN | 显著增加SP | 增加 P | 显著减少SN | 显著增加SP | 增加 P | 显著减少SN | 显著增加SP | 增加 P | 显著减少SN | 显著增加SP | |
| 1982-1999 | 80.00 | 0.23 | 11.92 | 84.73 | 0.21 | 22.10 | 75.40 | 0.73 | 13.41 | 72.69 | 1.47 | 13.51 |
| 1982-2000 | 74.04 | 0.32 | 7.43 | 83.74 | 0.24 | 20.74 | 85.08 | 0.32 | 18.97 | 79.02 | 0.65 | 16.83 |
| 1982-2001 | 74.36 | 0.33 | 7.66 | 81.69 | 0.33 | 19.47 | 83.49 | 0.31 | 14.44 | 76.60 | 0.77 | 17.30 |
| 1982-2002 | 70.25 | 0.75 | 8.35 | 81.40 | 0.45 | 22.32 | 85.24 | 0.32 | 16.87 | 74.76 | 0.85 | 16.21 |
| 1982-2003 | 67.18 | 1.51 | 8.69 | 78.46 | 0.90 | 23.08 | 80.42 | 0.52 | 12.74 | 71.71 | 1.15 | 14.47 |
| 1982-2004 | 68.92 | 1.88 | 11.20 | 75.34 | 1.29 | 23.49 | 75.60 | 0.94 | 10.58 | 67.68 | 1.78 | 13.44 |
| 1982-2005 | 62.47 | 3.13 | 9.12 | 73.36 | 2.06 | 24.09 | 75.06 | 1.06 | 10.31 | 61.95 | 2.41 | 8.65 |
| 1982-2006 | 58.80 | 5.14 | 10.03 | 71.49 | 2.74 | 23.91 | 74.27 | 1.30 | 10.53 | 63.87 | 2.28 | 9.74 |
| 1982-2007 | 57.09 | 6.70 | 11.08 | 71.11 | 3.50 | 25.68 | 73.74 | 1.48 | 9.69 | 60.25 | 2.55 | 7.58 |
| 1982-2008 | 54.65 | 8.31 | 11.25 | 67.59 | 5.17 | 24.23 | 74.63 | 1.68 | 10.82 | 59.82 | 2.89 | 8.72 |
| 1982-2009 | 61.08 | 5.91 | 14.46 | 62.63 | 7.30 | 18.91 | 73.99 | 1.67 | 10.97 | 60.17 | 3.30 | 8.60 |
| 1982-2010 | 62.48 | 5.93 | 15.73 | 58.88 | 9.96 | 18.37 | 68.17 | 2.83 | 10.43 | 61.72 | 2.06 | 8.14 |
| 1982-2011 | 63.21 | 6.22 | 16.94 | 53.42 | 13.45 | 16.17 | 69.76 | 3.00 | 13.15 | 65.47 | 2.34 | 10.36 |
| 1982-2012 | 63.06 | 6.67 | 17.72 | 50.26 | 15.98 | 15.63 | 63.17 | 4.70 | 11.67 | 58.19 | 3.96 | 8.98 |
| 时段 | 8月 | 9月 | 10月 | |||||||||
| 增加 P | 显著减少SN | 显著增加SP | 增加 P | 显著减少SN | 显著增加SP | 增加 P | 显著减少SN | 显著增加SP | ||||
| 1982-1999 | 54.84 | 1.99 | 4.38 | 62.30 | 1.14 | 3.23 | 53.69 | 1.42 | 2.64 | |||
| 1982-2000 | 58.95 | 2.00 | 6.66 | 61.75 | 1.08 | 3.08 | 55.68 | 1.28 | 2.76 | |||
| 1982-2001 | 57.73 | 2.30 | 7.44 | 61.78 | 1.04 | 3.77 | 63.73 | 0.67 | 4.43 | |||
| 1982-2002 | 57.00 | 2.52 | 7.94 | 56.92 | 1.68 | 3.22 | 60.21 | 1.09 | 5.54 | |||
| 1982-2003 | 51.82 | 4.13 | 6.26 | 53.89 | 2.06 | 3.03 | 59.05 | 1.51 | 5.58 | |||
| 1982-2004 | 48.56 | 5.71 | 6.26 | 57.78 | 2.09 | 4.86 | 53.21 | 2.77 | 6.01 | |||
| 1982-2005 | 44.81 | 7.74 | 6.22 | 63.67 | 2.02 | 8.44 | 55.55 | 3.32 | 7.75 | |||
| 1982-2006 | 42.97 | 7.47 | 4.72 | 61.09 | 2.13 | 7.14 | 52.29 | 4.34 | 7.94 | |||
| 1982-2007 | 40.32 | 8.42 | 3.57 | 61.94 | 2.22 | 8.94 | 53.45 | 4.82 | 7.47 | |||
| 1982-2008 | 36.19 | 11.62 | 3.26 | 56.55 | 3.14 | 6.59 | 53.29 | 5.87 | 7.94 | |||
| 1982-2009 | 42.19 | 8.47 | 4.43 | 59.13 | 3.23 | 8.60 | 52.79 | 6.06 | 8.07 | |||
| 1982-2010 | 48.30 | 5.66 | 6.20 | 67.96 | 2.11 | 13.02 | 59.82 | 4.17 | 12.45 | |||
| 1982-2011 | 56.42 | 4.31 | 9.53 | 71.46 | 2.02 | 16.65 | 61.36 | 4.32 | 13.37 | |||
| 1982-2012 | 57.46 | 4.85 | 12.15 | 72.84 | 2.11 | 19.01 | 60.90 | 5.18 | 15.68 | |||
4月NDVI呈显著提升、显著减少的区域均呈随时段延长而极显著增加(R2 = 0.69, R2 = 0.82, n = 14),呈增加趋势的区域极显著减少(R2 = 0.60, n = 14,表2)。5月NDVI呈增加趋势、显著提升趋势的区域随时段延长分别呈极显著减少(R2 = 0.96, n = 14)和不显著减少,而显著减少区域极显著大幅增加(R2 = 0.82, n = 14)。6月和7月NDVI呈增长、显著提升的区域均呈随时段延长而显著减少(6月:R2 = 0.71, R2 = 0.35;7月:R2 = 0.74, R2 = 0.65,n = 14),显著减少区域呈极显著增加趋势(R2 = 0.78, R2 = 0.71, n = 14)。8月NDVI呈增长、显著提升的区域随时段变化不显著,而显著减少区域则呈显著增加趋势(R2 = 0.32, n = 14)。尽管9月和10月NDVI呈显著提升、显著减少的区域均呈随时段延长而极显著增加(9月:R2 = 0.80, R2 = 0.48;10月:R2 = 0.88, R2 = 0.76,n = 14),但显著提升区域的增加速率明显高于显著减少区域(9月:1.11%/yr/时段 vs 0.11%/yr/时段,10月:0.86%/yr/时段 vs 0.39%/yr/时段),呈增加趋势的区域也分别显著和不显著增加(9月:R2 = 0.74, n = 14,表2)。
3.2.1 区域尺度
除8月部分时段外,4-10月NDVI与气温的相关系数在所有时段均为正值,4月、6-7月和9月相关性较强,尤其是4月和6月在14个时段多呈显著正相关。10月的正相关均不显著,而8月则出现了负的相关系数,但相关性较弱(表3,见206页)。除5月外,其他6个月份NDVI与降水量的相关系数均为负值,显著负相关主要发生在4月、7月和8月,且14个时段基本均呈显著负相关(表4,见第207页)。NDVI与日照时数的相关性在8月和4月最强,多为极显著正相关,7月正相关性也较强,后几个时段达到了显著水平,其他月份相关性较弱(表5,见第207页)。
表3 研究区域NDVI与气温的相关系数
Tab. 3 Relationships between monthly NDVI and temperature in the Qinghai-Tibet Plateau
| 时段 | 4月 | 5月 | 6月 | 7月 | 8月 | 9月 | 10月 |
|---|---|---|---|---|---|---|---|
| 1982-1999 | 0.55** | 0.40 | 0.36 | 0.38 | 0.08 | 0.46 | 0.32 |
| 1982-2000 | 0.56** | 0.39 | 0.40 | 0.48* | 0.07 | 0.46* | 0.32 |
| 1982-2001 | 0.56** | 0.39 | 0.41 | 0.47* | 0.08 | 0.41 | 0.38 |
| 1982-2002 | 0.58** | 0.29 | 0.44* | 0.46* | 0.10 | 0.41 | 0.38 |
| 1982-2003 | 0.59** | 0.30 | 0.47* | 0.45* | -0.07 | 0.35 | 0.33 |
| 1982-2004 | 0.62** | 0.28 | 0.48* | 0.47* | -0.12 | 0.39 | 0.32 |
| 1982-2005 | 0.58** | 0.27 | 0.49* | 0.33 | -0.24 | 0.49* | 0.33 |
| 1982-2006 | 0.58** | 0.27 | 0.48* | 0.38 | -0.20 | 0.47* | 0.33 |
| 1982-2007 | 0.60** | 0.31 | 0.48* | 0.36 | -0.24 | 0.49* | 0.30 |
| 1982-2008 | 0.58** | 0.27 | 0.48* | 0.37 | -0.16 | 0.43* | 0.29 |
| 1982-2009 | 0.64** | 0.28 | 0.48** | 0.35 | -0.11 | 0.48* | 0.27 |
| 1982-2010 | 0.63** | 0.26 | 0.45* | 0.39* | 0.03 | 0.52** | 0.29 |
| 1982-2011 | 0.63** | 0.22 | 0.46* | 0.39* | 0.07 | 0.54** | 0.29 |
| 1982-2012 | 0.63** | 0.16 | 0.36* | 0.29 | 0.09 | 0.54** | 0.30 |
表4 研究区域NDVI与降水量的相关系数
Tab. 4 Relationships between monthly NDVI and precipitation in the Qinghai-Tibet Plateau
| 时段 | 4月 | 5月 | 6月 | 7月 | 8月 | 9月 | 10月 |
|---|---|---|---|---|---|---|---|
| 1982-1999 | -0.56* | 0.08 | -0.25 | -0.56* | -0.77** | -0.22 | -0.16 |
| 1982-2000 | -0.61** | 0.07 | -0.10 | -0.57* | -0.75** | -0.23 | -0.17 |
| 1982-2001 | -0.60** | 0.06 | -0.12 | -0.58** | -0.74** | -0.23 | -0.19 |
| 1982-2002 | -0.56** | 0.10 | -0.11 | -0.57** | -0.75** | -0.22 | -0.19 |
| 1982-2003 | -0.57** | 0.09 | -0.18 | -0.57** | -0.76** | -0.25 | -0.18 |
| 1982-2004 | -0.51* | 0.06 | -0.22 | -0.59** | -0.74** | -0.32 | -0.18 |
| 1982-2005 | -0.51* | 0.06 | -0.24 | -0.58** | -0.76** | -0.36 | -0.13 |
| 1982-2006 | -0.49* | 0.08 | -0.24 | -0.60** | -0.75** | -0.35 | -0.13 |
| 1982-2007 | -0.48* | 0.10 | -0.23 | -0.62** | -0.75** | -0.33 | -0.13 |
| 1982-2008 | -0.48* | 0.08 | -0.22 | -0.60** | -0.74** | -0.32 | -0.09 |
| 1982-2009 | -0.51** | 0.09 | -0.24 | -0.60** | -0.69** | -0.38* | -0.09 |
| 1982-2010 | -0.50** | 0.06 | -0.23 | -0.60** | -0.59** | -0.30 | -0.07 |
| 1982-2011 | -0.50** | 0.03 | -0.20 | -0.57** | -0.62** | -0.26 | -0.08 |
| 1982-2012 | -0.49** | 0.07 | -0.22 | -0.62** | -0.62** | -0.27 | -0.06 |
表5 研究区域NDVI与日照时数的相关系数
Tab. 5 Relationships between monthly NDVI and sunshine hour in the Qinghai-Tibet Plateau
| 时段 | 4月 | 5月 | 6月 | 7月 | 8月 | 9月 | 10月 |
|---|---|---|---|---|---|---|---|
| 1982-1999 | 0.60** | 0.07 | 0.04 | 0.45 | 0.69** | -0.05 | 0.28 |
| 1982-2000 | 0.61** | 0.07 | -0.05 | 0.38 | 0.67** | -0.03 | 0.28 |
| 1982-2001 | 0.60** | 0.07 | 0.00 | 0.39 | 0.66** | -0.03 | 0.27 |
| 1982-2002 | 0.54* | 0.04 | -0.01 | 0.38 | 0.66** | 0.02 | 0.27 |
| 1982-2003 | 0.53* | 0.06 | 0.04 | 0.39 | 0.68** | 0.03 | 0.25 |
| 1982-2004 | 0.53** | 0.05 | 0.06 | 0.41 | 0.68** | 0.10 | 0.25 |
| 1982-2005 | 0.53** | 0.05 | 0.06 | 0.43* | 0.70** | 0.16 | 0.19 |
| 1982-2006 | 0.52** | 0.05 | 0.06 | 0.44* | 0.70** | 0.15 | 0.19 |
| 1982-2007 | 0.50** | 0.06 | 0.06 | 0.44* | 0.71** | 0.14 | 0.19 |
| 1982-2008 | 0.49** | 0.08 | 0.07 | 0.43* | 0.66** | 0.16 | 0.17 |
| 1982-2009 | 0.55** | 0.06 | 0.08 | 0.42* | 0.64** | 0.19 | 0.16 |
| 1982-2010 | 0.55** | 0.07 | 0.09 | 0.42* | 0.57** | 0.13 | 0.11 |
| 1982-2011 | 0.54** | 0.07 | 0.07 | 0.38* | 0.59** | 0.12 | 0.11 |
| 1982-2012 | 0.54** | 0.02 | 0.10 | 0.44* | 0.58** | 0.13 | 0.11 |
3.2.2 像元尺度
(1)气温
除8月外,4-10月14个时段的NDVI与气温正相关区域面积均大于50%,呈显著正相关的区域面积远大于显著负相关区域,显著负相关的面积除8月外绝大部分时段均不超过2%(表6,见第208页)。4-6月,显著正相关的区域主要分布在中东部,7-8月则较为分散,9-10月主要分布在腹地部分地区;显著负相关的区域主要分布在西藏南部(图3,见第209页)。NDVI与气温呈正相关区域随时段延长的变化模式为:4月和5月随时段延长显著减少(R2 = 0.34, R2 = 0.68, n = 14),9-10月呈极显著增加趋势(R2 = 0.65, R2 = 0.64, n = 14),其他月份变化趋势不显著。NDVI与气温显著正相关方面,除5月随时段延长极显著减少(R2 = 0.75, n = 14)、8月不显著增加外,其他各月均极显著增加(4月: R2 = 0.82, 6月: R2 = 0.91, 7月: R2=0.97, 8月R2=0.93,9月:R2=0.97,n=14)。NDVI与气温显著负相关方面,5-6月和9-10月随时段延长变化不显著,4月、7-8月均显著增加(4月: R2=0.85, 7月: R2=0.42, 8月: R2=0.49,n=14)。
图3 青藏高原部分月份NDVI与气候因子的相关性
Fig. 3 Correlations between monthly NDVI and climate factors in the Qinghai-Tibet Plateau
表6 月NDVI与气温正相关、显著负相关和显著正相关的区域面积比例
Tab. 6 Area proportions of different correlations between monthly NDVI and temperature (%)
| 时段 | 4月 | 5月 | 6月 | 7月 | ||||||||
|---|---|---|---|---|---|---|---|---|---|---|---|---|
| 增加 P | 显著减少 SN | 显著增加SP | 增加 P | 显著减少SN | 显著增加SP | 增加 P | 显著减少SN | 显著增加SP | 增加 P | 显著减少SN | 显著增加SP | |
| 1982-1999 | 81.57 | 0.21 | 16.93 | 80.63 | 0.21 | 15.47 | 70.80 | 1.01 | 9.21 | 63.03 | 0.87 | 3.49 |
| 1982-2000 | 82.51 | 0.28 | 17.02 | 79.84 | 0.24 | 16.14 | 76.06 | 0.57 | 10.57 | 67.37 | 0.85 | 6.15 |
| 1982-2001 | 82.63 | 0.23 | 16.93 | 78.92 | 0.19 | 14.53 | 75.56 | 0.51 | 11.14 | 66.50 | 0.87 | 4.55 |
| 1982-2002 | 80.85 | 0.22 | 15.78 | 73.31 | 0.57 | 11.09 | 77.20 | 0.54 | 13.12 | 65.86 | 0.87 | 4.63 |
| 1982-2003 | 79.83 | 0.22 | 15.55 | 72.92 | 0.66 | 11.55 | 78.30 | 0.30 | 14.44 | 66.36 | 0.83 | 4.61 |
| 1982-2004 | 80.59 | 0.27 | 17.22 | 74.01 | 0.52 | 11.75 | 78.35 | 0.30 | 15.74 | 68.10 | 0.65 | 5.30 |
| 1982-2005 | 79.68 | 0.33 | 16.72 | 74.14 | 0.52 | 11.95 | 78.08 | 0.31 | 16.59 | 61.77 | 1.06 | 3.97 |
| 1982-2006 | 80.07 | 0.30 | 16.82 | 74.08 | 0.53 | 12.03 | 78.68 | 0.35 | 16.59 | 64.82 | 0.53 | 4.58 |
| 1982-2007 | 77.13 | 0.40 | 17.10 | 75.77 | 0.44 | 11.92 | 78.63 | 0.34 | 16.90 | 62.89 | 0.63 | 4.50 |
| 1982-2008 | 75.19 | 0.47 | 17.24 | 73.77 | 0.65 | 11.19 | 78.82 | 0.37 | 17.22 | 63.04 | 0.68 | 4.56 |
| 1982-2009 | 79.92 | 0.48 | 22.42 | 74.39 | 0.39 | 10.94 | 78.16 | 0.50 | 17.64 | 62.65 | 1.10 | 5.47 |
| 1982-2010 | 79.18 | 0.64 | 23.80 | 71.96 | 0.42 | 10.67 | 75.42 | 0.74 | 17.27 | 64.41 | 2.14 | 9.08 |
| 1982-2011 | 79.61 | 0.65 | 24.34 | 69.55 | 0.42 | 9.62 | 76.04 | 0.63 | 17.90 | 65.29 | 1.81 | 9.12 |
| 1982-2012 | 80.01 | 0.64 | 24.33 | 65.61 | 0.73 | 8.49 | 73.34 | 1.22 | 17.04 | 62.34 | 2.09 | 8.05 |
| 时段 | 8月 | 9月 | 10月 | |||||||||
| 增加 P | 显著减少SN | 显著增加SP | 增加 P | 显著减少SN | 显著增加SP | 增加 P | 显著减少SN | 显著增加SP | ||||
| 1982-1999 | 52.11 | 1.83 | 2.05 | 68.81 | 1.50 | 4.59 | 68.24 | 1.39 | 12.28 | |||
| 1982-2000 | 47.84 | 3.03 | 1.84 | 67.84 | 1.44 | 4.72 | 69.08 | 1.36 | 13.16 | |||
| 1982-2001 | 48.96 | 2.65 | 1.92 | 67.13 | 1.63 | 5.63 | 73.23 | 1.20 | 14.48 | |||
| 1982-2002 | 49.20 | 3.03 | 1.92 | 67.76 | 1.34 | 5.73 | 73.22 | 1.35 | 14.64 | |||
| 1982-2003 | 41.42 | 4.59 | 1.28 | 66.07 | 1.43 | 5.61 | 72.33 | 1.51 | 14.84 | |||
| 1982-2004 | 39.64 | 5.11 | 1.32 | 66.96 | 1.50 | 6.92 | 72.87 | 1.55 | 15.27 | |||
| 1982-2005 | 35.71 | 6.48 | 1.18 | 71.94 | 1.49 | 10.93 | 72.85 | 1.64 | 15.13 | |||
| 1982-2006 | 35.46 | 7.11 | 1.32 | 70.49 | 1.61 | 10.28 | 73.45 | 1.63 | 15.65 | |||
| 1982-2007 | 32.91 | 8.70 | 1.27 | 70.45 | 1.75 | 11.10 | 73.09 | 1.26 | 15.18 | |||
| 1982-2008 | 34.86 | 7.76 | 1.29 | 68.57 | 1.85 | 9.60 | 73.28 | 1.49 | 14.92 | |||
| 1982-2009 | 37.41 | 6.71 | 1.45 | 70.62 | 1.76 | 11.36 | 72.71 | 1.50 | 14.86 | |||
| 1982-2010 | 48.72 | 5.66 | 2.87 | 75.79 | 1.42 | 14.93 | 75.29 | 1.40 | 16.19 | |||
| 1982-2011 | 50.40 | 4.53 | 3.30 | 77.59 | 1.22 | 17.60 | 75.55 | 1.43 | 16.29 | |||
| 1982-2012 | 52.01 | 3.85 | 4.10 | 78.04 | 1.28 | 18.05 | 74.66 | 1.40 | 14.39 | |||
(2)降水量
NDVI与降水量的相关性以负相关为主,所有月份正相关的区域比例均不足50%,除个别月份少数时段外,显著负相关的区域面积也多大于显著正相关(表7,见第210页)。除5月显著正相关的区域主要集中分布在东部、6月分布在东部和西南外,其他月份显著正相关占比均较少,而显著负相关的区域主要集中在研究区域腹部和南部(图3)。7-9月NDVI与降水量正相关区域随时段延长而极显著减少(R2=0.86, R2=0.60, R2=0.50, n=14),其他月份变化不显著。除10月NDVI与降水量显著负相关的区域随时段增加而快速减少(R2=0.32,n=14)外,其他月份均显著增加(4月: R2=0.41, 5月: R2=0.78, 6月: R2=0.74,7月: R2=0.47,8月: R2=0.89,9月: R2=0.61, n=14)。显著正相关方面,4月和6月显著增加(R2=0.46, R2=0.84, n=14)、7月和10月显著减少(R2 = 0.90, R2 = 0.66, n = 14),其他月份变化不显著。
表7 月NDVI与降水量正相关、显著负相关和显著正相关的区域面积比例
Tab.7 Area proportions of different correlations between monthly NDVI and precipitation (%)
| 时段 | 4月 | 5月 | 6月 | 7月 | ||||||||
|---|---|---|---|---|---|---|---|---|---|---|---|---|
| 增加 P | 显著减少SN | 显著增加SP | 增加 P | 显著减少SN | 显著增加SP | 增加 P | 显著减少SN | 显著增加SP | 增加 P | 显著减少SN | 显著增加SP | |
| 1982-1999 | 24.19 | 11.74 | 0.54 | 39.58 | 5.33 | 3.58 | 40.81 | 2.74 | 1.21 | 34.30 | 6.83 | 1.03 |
| 1982-2000 | 21.64 | 13.88 | 0.43 | 42.68 | 5.22 | 4.98 | 49.20 | 1.78 | 2.35 | 32.90 | 7.06 | 1.06 |
| 1982-2001 | 23.02 | 12.87 | 0.43 | 46.21 | 4.68 | 5.91 | 50.29 | 1.83 | 3.34 | 34.21 | 5.97 | 1.08 |
| 1982-2002 | 22.88 | 11.75 | 0.52 | 46.07 | 4.75 | 5.67 | 50.84 | 1.76 | 3.44 | 34.08 | 6.03 | 1.03 |
| 1982-2003 | 23.57 | 11.86 | 0.54 | 46.52 | 4.96 | 5.97 | 48.79 | 2.44 | 3.46 | 33.74 | 6.37 | 1.04 |
| 1982-2004 | 22.92 | 11.13 | 0.42 | 46.62 | 5.29 | 5.86 | 47.90 | 3.00 | 3.38 | 32.99 | 6.56 | 0.92 |
| 1982-2005 | 22.02 | 11.96 | 0.44 | 46.30 | 5.54 | 5.96 | 47.42 | 3.47 | 3.60 | 32.99 | 6.42 | 0.92 |
| 1982-2006 | 21.76 | 13.75 | 0.46 | 45.70 | 6.35 | 6.29 | 47.73 | 3.11 | 3.47 | 31.52 | 6.89 | 0.82 |
| 1982-2007 | 24.93 | 12.18 | 0.71 | 46.28 | 6.19 | 5.78 | 46.95 | 3.48 | 3.46 | 30.33 | 7.18 | 0.69 |
| 1982-2008 | 26.36 | 11.86 | 0.86 | 45.61 | 7.89 | 5.99 | 47.52 | 3.45 | 4.71 | 29.96 | 7.59 | 0.62 |
| 1982-2009 | 23.24 | 13.38 | 0.65 | 40.08 | 11.24 | 5.37 | 46.92 | 3.66 | 4.39 | 30.60 | 7.44 | 0.59 |
| 1982-2010 | 21.50 | 15.63 | 0.71 | 39.56 | 11.36 | 5.49 | 47.82 | 3.44 | 5.57 | 28.63 | 7.36 | 0.47 |
| 1982-2011 | 21.46 | 15.62 | 0.72 | 37.91 | 11.75 | 5.39 | 49.62 | 3.55 | 5.03 | 29.88 | 7.19 | 0.56 |
| 1982-2012 | 20.34 | 15.65 | 0.61 | 38.30 | 11.02 | 4.93 | 48.51 | 4.32 | 5.54 | 27.05 | 10.02 | 0.54 |
| 时段 | 8月 | 9月 | 10月 | |||||||||
| 增加 P | 显著减少SN | 显著增加SP | 增加 P | 显著减少SN | 显著增加SP | 增加 P | 显著减少SN | 显著增加SP | ||||
| 1982-1999 | 32.93 | 10.85 | 1.42 | 33.87 | 4.47 | 0.65 | 24.01 | 18.48 | 0.64 | |||
| 1982-2000 | 33.50 | 10.91 | 1.49 | 34.50 | 4.50 | 0.75 | 23.44 | 19.20 | 0.59 | |||
| 1982-2001 | 32.97 | 11.03 | 1.39 | 33.75 | 5.14 | 0.77 | 22.47 | 19.76 | 0.49 | |||
| 1982-2002 | 33.42 | 10.45 | 1.53 | 32.32 | 5.51 | 0.72 | 22.06 | 19.60 | 0.47 | |||
| 1982-2003 | 27.59 | 11.72 | 1.09 | 31.81 | 5.78 | 0.69 | 21.87 | 20.08 | 0.40 | |||
| 1982-2004 | 27.29 | 11.72 | 1.16 | 30.38 | 6.43 | 0.61 | 22.42 | 20.37 | 0.39 | |||
| 1982-2005 | 26.91 | 12.60 | 1.21 | 29.07 | 7.51 | 0.67 | 23.85 | 18.99 | 0.42 | |||
| 1982-2006 | 27.39 | 13.22 | 1.26 | 29.85 | 7.45 | 0.73 | 23.97 | 18.08 | 0.41 | |||
| 1982-2007 | 26.13 | 13.84 | 1.26 | 30.46 | 7.26 | 0.77 | 22.69 | 18.65 | 0.44 | |||
| 1982-2008 | 25.04 | 15.61 | 1.23 | 29.12 | 6.64 | 0.56 | 25.50 | 18.11 | 0.47 | |||
| 1982-2009 | 27.45 | 14.78 | 1.36 | 26.32 | 9.18 | 0.53 | 23.75 | 18.18 | 0.43 | |||
| 1982-2010 | 28.80 | 14.46 | 1.33 | 29.58 | 7.06 | 0.74 | 23.59 | 17.79 | 0.37 | |||
| 1982-2011 | 26.48 | 15.81 | 1.04 | 32.98 | 6.71 | 0.82 | 22.45 | 17.88 | 0.34 | |||
| 1982-2012 | 25.87 | 16.18 | 1.06 | 27.83 | 7.30 | 0.55 | 19.92 | 18.97 | 0.19 | |||
(3)日照时数
NDVI与日照时数以正相关为主,各月份所有时段正相关的面积均大于60%,显著正相关的区域面积也远大于显著负相关区域,显著负相关的面积绝大部分时段均不超过2%(表8,见第211页)。6-8月显著正相关主要集中在东南,显著负相关集中在西南,4月、10月正相关集中在研究区域腹地,其他月份显著相关的区域相对较为分散(图3)。
表8 月NDVI与日照时数正相关、显著负相关和显著正相关的区域面积比例
Tab. 8 Area proportions of different correlations between monthly NDVI and sunshine hours (%)
| 时段 | 4月 | 5月 | 6月 | 7月 | ||||||||
|---|---|---|---|---|---|---|---|---|---|---|---|---|
| 增加 P | 显著减少SN | 显著增加SP | 增加 P | 显著减少SN | 显著增加SP | 增加 P | 显著减少SN | 显著增加SP | 增加 P | 显著减少SN | 显著增加SP | |
| 1982-1999 | 82.39 | 0.11 | 11.84 | 72.23 | 0.84 | 7.16 | 66.96 | 0.71 | 9.05 | 69.98 | 0.89 | 7.86 |
| 1982-2000 | 83.05 | 0.12 | 13.31 | 70.58 | 0.84 | 6.59 | 62.97 | 0.79 | 7.71 | 67.55 | 1.70 | 8.05 |
| 1982-2001 | 79.67 | 0.18 | 12.25 | 68.07 | 1.26 | 6.61 | 62.87 | 1.12 | 8.34 | 65.86 | 1.72 | 7.22 |
| 1982-2002 | 81.12 | 0.22 | 13.46 | 67.44 | 1.13 | 6.33 | 62.70 | 1.19 | 8.91 | 66.08 | 1.75 | 7.23 |
| 1982-2003 | 81.73 | 0.20 | 14.29 | 66.67 | 1.20 | 6.34 | 64.12 | 1.24 | 10.22 | 66.34 | 1.82 | 7.53 |
| 1982-2004 | 82.90 | 0.18 | 14.58 | 67.50 | 1.15 | 6.64 | 64.63 | 1.45 | 11.68 | 66.71 | 1.53 | 7.56 |
| 1982-2005 | 83.09 | 0.18 | 15.61 | 67.74 | 1.17 | 6.97 | 64.34 | 1.49 | 11.96 | 67.67 | 1.38 | 7.66 |
| 1982-2006 | 83.27 | 0.17 | 15.80 | 68.67 | 1.20 | 6.68 | 64.13 | 1.41 | 11.65 | 68.91 | 1.34 | 8.52 |
| 1982-2007 | 81.88 | 0.22 | 14.93 | 68.13 | 1.10 | 6.68 | 64.51 | 1.46 | 12.14 | 69.74 | 1.26 | 9.03 |
| 1982-2008 | 81.41 | 0.24 | 15.12 | 67.83 | 1.03 | 7.50 | 65.57 | 2.12 | 12.19 | 69.78 | 1.36 | 9.62 |
| 1982-2009 | 85.49 | 0.18 | 18.29 | 73.51 | 0.84 | 10.55 | 65.22 | 2.23 | 11.95 | 68.68 | 1.49 | 10.02 |
| 1982-2010 | 85.46 | 0.19 | 19.69 | 73.79 | 0.83 | 10.80 | 64.94 | 2.53 | 12.14 | 70.93 | 1.15 | 10.57 |
| 1982-2011 | 85.99 | 0.18 | 19.77 | 74.30 | 0.68 | 10.67 | 64.51 | 2.59 | 12.49 | 69.28 | 1.26 | 10.13 |
| 1982-2012 | 87.14 | 0.16 | 21.09 | 72.31 | 0.71 | 9.49 | 65.18 | 2.78 | 14.37 | 71.44 | 1.14 | 12.32 |
| 8月 | 9月 | 10月 | ||||||||||
| 增加 P | 显著减少SN | 显著增加SP | 增加 P | 显著减少SN | 显著增加SP | 增加 P | 显著减少SN | 显著增加SP | ||||
| 1982-1999 | 67.69 | 1.45 | 11.45 | 69.02 | 0.34 | 5.25 | 85.97 | 0.45 | 19.93 | |||
| 1982-2000 | 66.81 | 3.07 | 12.67 | 68.50 | 0.39 | 5.81 | 86.35 | 0.45 | 20.63 | |||
| 1982-2001 | 66.79 | 3.15 | 12.62 | 68.41 | 0.41 | 5.87 | 87.71 | 0.38 | 21.39 | |||
| 1982-2002 | 66.06 | 3.11 | 12.55 | 71.35 | 0.36 | 7.09 | 87.75 | 0.36 | 21.95 | |||
| 1982-2003 | 70.06 | 2.84 | 14.28 | 72.31 | 0.33 | 7.70 | 87.78 | 0.33 | 22.19 | |||
| 1982-2004 | 71.06 | 2.91 | 14.80 | 73.52 | 0.30 | 7.86 | 88.58 | 0.32 | 23.08 | |||
| 1982-2005 | 71.83 | 3.00 | 16.14 | 75.24 | 0.30 | 9.56 | 87.34 | 0.27 | 21.08 | |||
| 1982-2006 | 71.87 | 3.02 | 17.31 | 74.89 | 0.32 | 9.44 | 87.62 | 0.27 | 22.17 | |||
| 1982-2007 | 73.17 | 2.87 | 18.17 | 74.91 | 0.33 | 10.07 | 87.88 | 0.25 | 23.52 | |||
| 1982-2008 | 74.99 | 2.37 | 20.52 | 76.38 | 0.30 | 10.26 | 87.30 | 0.26 | 23.87 | |||
| 1982-2009 | 74.05 | 2.19 | 19.36 | 77.74 | 0.29 | 12.13 | 88.13 | 0.23 | 24.39 | |||
| 1982-2010 | 74.16 | 1.93 | 19.41 | 75.44 | 0.30 | 10.99 | 87.34 | 0.26 | 23.09 | |||
| 1982-2011 | 75.82 | 1.34 | 20.41 | 74.67 | 0.31 | 11.70 | 87.59 | 0.25 | 23.11 | |||
| 1982-2012 | 74.83 | 1.33 | 20.62 | 78.10 | 0.24 | 12.62 | 88.57 | 0.18 | 23.47 | |||
除5月和6月外,其他月份NDVI与日照时数正相关的区域随时段延长而显著增加(4月: R2 = 0.56, 7月: R2 = 0.43, 8月: R2 = 0.89, 9月: R2 = 0.82, 10月: R2 = 0.30, n = 14);显著负相关的面积除6月极显著增加(R2 = 0.93, n = 14)、4月不显著增加外,其他月份均减少,其中9月和10月减少显著(R2 = 0.62, R2 = 0.88, n = 14);而显著正相关面积则均极显著增加(4月: R2 = 0.88, 5月: R2 = 0.60, 6月: R2 = 0.83, 7月: R2 = 0.77, 8月: R2 = 0.94, 9月: R2 = 0.96, 10月: R2 = 0.67, n = 14)。
月NDVI的变化趋势总体上与已有研究各月份所属季节的变化趋势一致[4,5,9,13,17,43-44],但部分月份存在较大差异。尽管在季节尺度上,NDVI变化均为增加趋势[4,5,9,13,17,43-44],但是在月尺度上,8月则多为减少趋势。空间分布上月份与季度之间的结果既有相似性[4,5,11,16,20,43-44],也多存在一定差异。这种差异的原因可能是一定时间跨度的NDVI合成方法,掩盖了该时段内部分时点的NDVI变化趋势。因此,开展更精细时段植被变化趋势的研究是十分必要的,尤其是对于指导生态保护与恢复工作的时点安排。
区域尺度与像元尺度所反映的植被变化趋势也存在明显差异。在区域尺度青藏高原绝大多数月份的NDVI呈增加趋势,且随时段延长变化量变小,NDVI趋于稳定,但在像元尺度,显著增加和显著减少的面积多呈增加趋势,NDVI变化存在“两极化”趋势。生长季各月NDVI显著减少范围的明显增加,需要引起足够的关注和进一步的深入研究探讨,尤其是5月,随时段延长显著减少范围的快速增加。
青藏高原植被活动主要受到热量因子调节,尤其是气温的影响显著,但不同月份之间存在一定差异。4月和7月主要是受气温和日照时数共同作用,表明热量和光照制约着青藏高原植被的生长; 6月和9月则主要是气温,8月份因为阴雨天气较多,日照较少,日照时数成为主要限制因子,而植被与降水量呈负相关。5月和10月NDVI与3个气候因子的关系则较为复杂,没有哪种气候因子起主导作用,可能是受到3个气候因子综合作用的影响。水分丰富、日照时数相对不足的东南部植被NDVI则主要受日照时数限制,而与降水量显著负相关;青藏高原西南部和东北部夏季NDVI则主要受到水分条件的限制。
嵌套时间序列趋势分析的方法可能面临着统计学上的“可塑性时间单元问题”(the Modifiable Temporal Unit Problem,MTUP)[45,46,47],即该方法可能对月植被NDVI增加量随时段延长而减小有所贡献。本文的研究结果显示,4月和6-10月均存在NDVI显著增加和或显著减少的区域随时段延长不但不符合MTUP的减少趋势,反而呈极显著增加趋势,表明MTUP对该方法的影响较小。况且,已有研究证明,嵌套时间序列方法在应用到NDVI变化趋势时,MTUP效应可以忽略不计[45,46,47]。同时,该方法在反映NDVI动态变化过程、变化趋势的持续性与稳定性等方面具有突出能力,因此,该方法仍不失为研究植被时空变化趋势的重要方法之一。
植被变化趋势的非线性、影响因素复杂及其对气候变化可能存在的滞后效应,加上气候变化的不确定性,导致植被变化趋势的预测成为相关研究的难点之一。深入理解植被活动的长期变化趋势及其成因是合理预测未来动态、减少预测不确定性的基础[4,20,43]。跨越整个时段的线性趋势分析计算简单、结果可读性高,但有可能掩盖短时间的变化特征,且缺乏对变化过程的描述[4,6,12]。基于多个嵌套时段的NDVI长时间序列分析,有助于深入理解植被NDVI变化过程和变化趋势的持续性,能够在一定程度上反映植被系统的弹性和对外界干扰的抵抗力,据此开展植被活动的趋势外推更为合理。况且,这种方法或许能够提供植被覆盖变化近期的未来轨迹。由此可以推测,青藏高原多数月份植被活动显著增加和显著降低的区域范围将继续扩大,但显著降低区域的扩大速率明显高于显著增加区域;这一现象反映在区域整体上,即多数月份的NDVI增长将逐渐趋于平稳。
本文基于1982-2012年的GIMMS NDVI3g长时间序列数据集和气候数据,综合运用嵌套时间序列趋势分析技术和相关分析方法,研究了青藏高原近30年来月尺度地表植被活动的变化趋势及变化过程,分析了生长季各月、不同地区影响区域植被生长的主要气候因素,探讨了嵌套时间序列趋势分析技术的适用性,主要结论如下:
(1)在区域尺度上,青藏高原月NDVI变化多为增加趋势,其中4月和9月增加趋势显著,1982-2012年NDVI变化率分别为4.78×10⁻⁴/yr和6.41×10-4/yr;随着时段的延长,多数月份NDVI增加幅度趋窄,增长的趋势趋于平缓;但在像元尺度上,NDVI显著变化的区域,尤其是显著降低的区域在增加,需要引起足够的重视。由此可见,区域平均NDVI的变化趋势,掩盖了像元尺度的变化特征。
(2)青藏高原各月植被活动总体上受热量因子变化调控,但不同月份、不同地区影响植被的主导气候因子存在差异;4月和7月NDVI变化主要受植被气温、日照时数和降水量影响,其中前两个因子主要表现为正面影响,而降水量为负面影响;6月和9月主要受气温的控制;8月则主要受到日照时数的促进和降水量的制约作用影响;东南部NDVI主要受日照时数和降水量影响,而东北部和西南部则主要受水分条件的限制。
(3)嵌套时间序列趋势分析方法能够有效地反映长时间序列植被变化的过程和变化趋势的稳健性,便于开展不同时段计算结果之间的对比分析,并为未来趋势分析提供支撑。据此预测,青藏高原月NDVI未来增加趋势总体上趋于缓和,但在像元尺度显著变化的区域倾向于增加。
The authors have declared that no competing interests exist.
| [1] |
Urbanization alters spatiotemporal patterns of ecosystem primary production: A case study of the Phoenix metropolitan region, USA [J].https://doi.org/10.1016/j.jaridenv.2008.12.015 URL [本文引用: 2] 摘要
Previous studies have found that urbanization often decreases net primary production (NPP), an important integrative measure of ecosystem functioning. In arid environments, however, urbanization may boost productivity by introducing highly productive plant communities and weakening the coupling of plant growth to naturally occurring cycles of water and nutrients. We tested these ideas by comparing NPP estimated for natural and anthropogenic land covers in the Phoenix metropolitan region of USA using MODIS NDVI data and a simplified parametric NPP model. Most anthropogenic land covers exhibited higher production than the natural desert. Consequently, the combined urban and agricultural areas contributed more to the regional primary production than the natural desert did in normal and dry years, whereas this pattern was reversed in wet years. Primary production of this urban landscape was only weakly correlated with rainfall, but strongly with socio-economic variables. Our productivity estimates agreed well with NPP predicted by a process-based ecosystem model for the area. Significant uncertainties, however, remain due to extremely high heterogeneity of urban vegetation. Nevertheless, our results clearly show that urbanization may not only increase regional NPP and disrupt the coupling between vegetation and precipitation, but also increase spatial heterogeneity of NPP in this arid region.
|
| [2] |
Tracking the effect of climate change on ecosystem functioning using protected areas: Africa as a case study [J].https://doi.org/10.1016/j.ecolind.2012.02.014 URL [本文引用: 2] 摘要
Protected areas represent important core 榰nits for in situ conservation. However, the current static system is at risk from the effects of global environmental change. This is especially true in Africa, a biodiversity-rich continent expected to be hit hard by climate change. Focusing on African protected areas that experience limited human impact (International Union for Conservation of Nature (IUCN) categories I and II), we tested three hypotheses regarding the impact of climate change on the dynamics of net primary productivity (NPP). We expected a lower annual NPP and higher seasonality in NPP in Eastern and Southern Africa; changes in NPP dynamics to coincide with changes in precipitation; no correlation between changes in NPP dynamics and human development. To test these expectations, we used the Normalised Difference Vegetation Index (NDVI) as an index of NPP. Results show that, between 1982 and 2008, an increased vegetation greenness was observed in 27% of the protected areas monitored (mostly in Western Africa), and an increased seasonality in 9% of them (mostly in Eastern and Southern Africa). Our results lend support to current expectations regarding the impacts of climate change, and demonstrate how protected areas of IUCN categories I and II could be used to track the effect of climate change on ecosystem functioning in Africa, and possibly elsewhere. The study highlights the need for a dynamic approach to conservation, where the relevance and efficiency of management actions need to be regularly evaluated. It also demonstrates that satellite-based approaches offer a cheap, verifiable way to quickly identify protected areas of concern at a global scale, supporting managers in their effort to design and apply adaptive management strategies.
|
| [3] |
Remotely sensed interannual variations and trends in terrestrial net primary poductivity 1981-2000 [J].https://doi.org/10.1007/s10021-003-0189-x URL [本文引用: 1] 摘要
Spatial and temporal variations in net primary production (NPP) are of great importance to ecological studies, natural resource management, and terrestrial carbon sink estimates. However, most of the existing estimates of interannual variation in NPP at regional and global scales were made at coarse resolutions with climate-driven process models. In this study, we quantified global NPP variation at an 8 km and 10-day resolution from 1981 to 2000 based on satellite observations. The high resolution was achieved using the GLObal Production Efficiency Model (GLO-PEM), which was driven with variables derived almost entirely from satellite remote sensing. The results show that there was an increasing trend toward enhanced terrestrial NPP that was superimposed on high seasonal and interannual variations associated with climate variability and that the increase was occurring in both northern and tropical latitudes. NPP generally decreased in El Ni o season and increased in La Ni a seasons, but the magnitude and spatial pattern of the response varied widely between individual events. Our estimates also indicate that the increases in NPP during the period were caused mainly by increases in atmospheric carbon dioxide and precipitation. The enhancement of NPP by warming was limited to northern high latitudes (above 50掳N); in other regions, the interannual variations in NPP were correlated negatively with temperature and positively with precipitation.
|
| [4] |
Changes in satellite-derived vegetation growth trend in temperate and boreal Eurasia from 1982 to 2006 [J].https://doi.org/10.1111/j.1365-2486.2011.02419.x URL [本文引用: 8] 摘要
Monitoring changes in vegetation growth has been the subject of considerable research during the past several decades, because of the important role of vegetation in regulating the terrestrial carbon cycle and the climate system. In this study, we combined datasets of satellite-derived Normalized Difference Vegetation Index (NDVI) and climatic factors to analyze spatio-temporal patterns of changes in vegetation growth and their linkage with changes in temperature and precipitation in temperate and boreal regions of Eurasia (> 23.5°N) from 1982 to 2006. At the continental scale, although a statistically significant positive trend of average growing season NDVI is observed (0.5 × 10613 year611, P = 0.03) during the entire study period, there are two distinct periods with opposite trends in growing season NDVI. Growing season NDVI has first significantly increased from 1982 to 1997 (1.8 × 10613 year611, P < 0.001), and then decreased from 1997 to 2006 (611.3 × 10613 year611, P = 0.055). This reversal in the growing season NDVI trends over Eurasia are largely contributed by spring and summer NDVI changes. Both spring and summer NDVI significantly increased from 1982 to 1997 (2.1 × 10613 year611, P = 0.01; 1.6 × 10613 year611P < 0.001, respectively), but then decreased from 1997 to 2006, particularly summer NDVI which may be related to the remarkable decrease in summer precipitation (612.7 mm yr611, P = 0.009). Further spatial analyses supports the idea that the vegetation greening trend in spring and summer that occurred during the earlier study period 1982–1997 was either stalled or reversed during the following study period 1997–2006. But the turning point of vegetation NDVI is found to vary across different regions.
|
| [5] |
Trend analysis of vegetation dynamics in Qinghai-Tibet Plateau using Hurst Exponent [J].https://doi.org/10.1016/j.ecolind.2011.08.011 URL [本文引用: 4] 摘要
As one of the most sensitive areas responding to global environmental change, especially global climate change, Qinghai-Tibet Plateau has been recognized as a hotspot for coupled studies on global terrestrial ecosystem change and global climate change. As an important component of terrestrial ecosystems, vegetation dynamic has become one of the key issues in global environmental change, and numerous case studies have been conducted on vegetation dynamic trend in different study periods. However, few are focused on the quantitative analysis of the consistency of vegetation dynamic trends after the study periods. In the study, taking Qinghai-Tibet Plateau as a case, vegetation dynamic trend during 1982-2003 were analyzed, with the application of the method of linear regression analysis. The results showed that, vegetation dynamics in Qinghai-Tibet Plateau experienced a significant increasing as a whole, with nearly 50% forest degradation in the study period. And among the 7 kinds of vegetation types, the change of forest was the most fluctuant with desert the least one. Furthermore, the consistency of vegetation dynamic trends after the study period, was quantified using Hurst Exponent and the method of R/S analysis. The results showed high consistency of future vegetation dynamic trends for the whole plateau, and inconsistent areas were mainly meadow and steppe distributed in the middle or east of the plateau. It was also convinced that, vegetation dynamic trends in the study area were significantly influenced by topography, especially the elevation.
|
| [6] |
Quantitative mapping of global land degradation using Earth observations [J].https://doi.org/10.1080/01431161.2010.512946 URL [本文引用: 2] 摘要
Land degradation is a global issue on par with climate change and loss of biodiversity, but its extent and severity are only roughly known and there is little detail on the immediate processes let alone the drivers. Earth-observation methods enable monitoring of land degradation in a consistent, physical way and on a global scale by making use of vegetation productivity and/or loss as proxies. Most recent studies indicate a general greening trend, but improved data sets and analysis also show a combination of greening and browning trends. Statistically based linear trends average out these effects. Improved understanding may be expected from data-driven and process-modelling approaches: new models, model integration, enhanced statistical analysis and modern sensor imagery at medium spatial resolution should substantially improve the assessment of global land degradation.
|
| [7] |
闽三角城市群地质灾害敏感性评价 [J].
生态安全是地区社会经济可持续的根本保障,然而地质灾害会对地区的生态安全造成严重威胁,对闽三角城市群进行地质灾害敏感性分析具有重要意义。本文分别选取坡度、高程、土壤类型、NDVI、岩性、多年平均降水量、距主要公路距离和5 km格网内的地质灾害点数目这8个指标,基于SPCA、全局Moran's 和局部Moran's ,对闽三角城市群的地质灾害敏感性进行综合评价。结果表明:闽三角城市群整体处于中度敏感,不同敏感性的面积大小顺序为:中度敏感>高度敏感>轻度敏感>极敏感>不敏感,占比分别为26.96%、25.67%、23.89%、11.75%和11.72%;地质灾害敏感性由东南沿海向西北内陆呈现出由不敏感向极敏感逐渐过渡的整体趋势,并存在着明显的地带性特征;不同县(市、区)间及其内部的地质灾害敏感性均存在较大的空间异质性;地质灾害敏感性存在显著的空间自相关性,且为显著正相关,并呈现出显著的空间集聚性特征,在德化县、永春县、安溪县和南靖县为高高聚集,在惠安县、丰泽区、鲤城区、晋江市和石狮市为低低聚集;不同土地利用类型下的地质灾害敏感性综合指数大小顺序为:林地>草地>未利用地>耕地>水域>建设用地,林地和草地整体处于中度敏感,水域、耕地、建设用地和未利用地整体处于轻度敏感;多年平均降水量、坡度、距主要公路距离、地质灾害点数目、岩性和土壤类型是研究区地质灾害的主要驱动因子。
Sensitivity assessment of geological hazards in unban agglomeration of Fujian Delta Region [J].
生态安全是地区社会经济可持续的根本保障,然而地质灾害会对地区的生态安全造成严重威胁,对闽三角城市群进行地质灾害敏感性分析具有重要意义。本文分别选取坡度、高程、土壤类型、NDVI、岩性、多年平均降水量、距主要公路距离和5 km格网内的地质灾害点数目这8个指标,基于SPCA、全局Moran's 和局部Moran's ,对闽三角城市群的地质灾害敏感性进行综合评价。结果表明:闽三角城市群整体处于中度敏感,不同敏感性的面积大小顺序为:中度敏感>高度敏感>轻度敏感>极敏感>不敏感,占比分别为26.96%、25.67%、23.89%、11.75%和11.72%;地质灾害敏感性由东南沿海向西北内陆呈现出由不敏感向极敏感逐渐过渡的整体趋势,并存在着明显的地带性特征;不同县(市、区)间及其内部的地质灾害敏感性均存在较大的空间异质性;地质灾害敏感性存在显著的空间自相关性,且为显著正相关,并呈现出显著的空间集聚性特征,在德化县、永春县、安溪县和南靖县为高高聚集,在惠安县、丰泽区、鲤城区、晋江市和石狮市为低低聚集;不同土地利用类型下的地质灾害敏感性综合指数大小顺序为:林地>草地>未利用地>耕地>水域>建设用地,林地和草地整体处于中度敏感,水域、耕地、建设用地和未利用地整体处于轻度敏感;多年平均降水量、坡度、距主要公路距离、地质灾害点数目、岩性和土壤类型是研究区地质灾害的主要驱动因子。
|
| [8] |
基于“DEM-NDVI-土地覆盖分类”的天山博格达自然遗产地植被垂直带提取与变化分析 [J].
本文基于Landsat影像数据获取天山博格达自然遗产地土地覆盖分类,结合归一化植被指数(NDVI)和数字高程模型(DEM)构建"DEM-NDVI-土地覆盖分类"散点图分析研究区植被受海拔和坡向的水热空间变化影响的分布特征,通过概率统计分析提取博格达遗产地山地垂直带,并结合研究区的气温、降水数据和NDVI变化特征分析垂直带变化的原因。研究结果表明:(1)本文利用"DEM-NDVI-土地覆盖分类"散点图,揭示了研究区1989年和2016年的NDVI值和分类类别随着海拔上升的变化特征,其中NDVI值随着海拔上升呈现"倒U形"变化,而不同分类类别在一定的海拔区间内呈现出聚集效应,且不同分类类别有明显的高程界限。(2) 1989年和2016年博格达遗产地山地垂直带分带上限分别为:1278 m和1185 m(温带荒漠草原带)、1784 m和1759 m(山地草原带)、2706 m和2730 m(山地针叶林带)、3272 m和3293 m(高山草甸带)、3636 m和3690 m(高山垫状植被带)。(3)博格达遗产地1989年和2016年山地垂直带受区域气温升高和降雨增加的影响有较为明显的改变,其中温带荒漠草原带最为敏感,其上限变化最大,向下收缩93 m;山地针叶林带的分布范围则向两侧扩张49 m;山地草甸带带宽基本保持不变,但整体上移了约20 m;冰雪带则受到全球气候变暖的影响向上退缩54 m。
Identification and change analysis of mountain altitudinal zone based on DEM-NDVI- Land cover classification in Tianshan Bogda Natural Heritage site [J].
本文基于Landsat影像数据获取天山博格达自然遗产地土地覆盖分类,结合归一化植被指数(NDVI)和数字高程模型(DEM)构建"DEM-NDVI-土地覆盖分类"散点图分析研究区植被受海拔和坡向的水热空间变化影响的分布特征,通过概率统计分析提取博格达遗产地山地垂直带,并结合研究区的气温、降水数据和NDVI变化特征分析垂直带变化的原因。研究结果表明:(1)本文利用"DEM-NDVI-土地覆盖分类"散点图,揭示了研究区1989年和2016年的NDVI值和分类类别随着海拔上升的变化特征,其中NDVI值随着海拔上升呈现"倒U形"变化,而不同分类类别在一定的海拔区间内呈现出聚集效应,且不同分类类别有明显的高程界限。(2) 1989年和2016年博格达遗产地山地垂直带分带上限分别为:1278 m和1185 m(温带荒漠草原带)、1784 m和1759 m(山地草原带)、2706 m和2730 m(山地针叶林带)、3272 m和3293 m(高山草甸带)、3636 m和3690 m(高山垫状植被带)。(3)博格达遗产地1989年和2016年山地垂直带受区域气温升高和降雨增加的影响有较为明显的改变,其中温带荒漠草原带最为敏感,其上限变化最大,向下收缩93 m;山地针叶林带的分布范围则向两侧扩张49 m;山地草甸带带宽基本保持不变,但整体上移了约20 m;冰雪带则受到全球气候变暖的影响向上退缩54 m。
|
| [9] |
Detection and mapping of long-term land degradation using local net production scaling: Application to Zimbabwe [J].https://doi.org/10.1016/j.rse.2009.01.016 URL [本文引用: 3] 摘要
Degradation of vegetation and soils in drylands, sometimes called desertification, is thought to be a serious threat to the sustainability of human habitation, but maps of the extent and severity of degradation at country and global scales do not exist. Degraded land, by definition, has suffered a change relative to its previous condition set by its climate, soil properties, topography and expectations of land managers. The local net production scaling (LNS) method, tested here in Zimbabwe, estimates potential production in homogeneous land capability classes and models the actual productivity using remotely-sensed observations. The difference between the potential and actual productivities provides a map of the location and severity of degradation. Six years of 250 m resolution MODIS data were used to estimate actual net production in Zimbabwe and calculate the LNS using three land capability classifications. The LNS maps agreed with known areas of degradation and with an independent degradation map. The principal source of error arose because of inhomogeneity of some land capability classes caused by, for example, the inclusion of local hot-spots of high production and differences in precipitation caused by local topography. Agriculture and other management can affect the degradation estimates and careful inspection of the LNS maps is essential to verify and identify the local causes of degradation. The Zimbabwe study found that approximately 16% of the country was at its potential production and the total loss in productivity due to degradation was estimated to be 17.6 Tg Cyr 1, that is 13% of the entire national potential. Since the locations of degraded land were unrelated to natural environmental factors such as rainfall and soils, it is clear that the degradation has been caused by human land use, concentrated in the heavily-utilized, communal areas.
|
| [10] |
Can human-induced land degradation be distinguished from the effects of rainfall variability? A case study in South Africa [J].https://doi.org/10.1016/j.jaridenv.2006.05.015 URL 摘要
Advanced Very High Resolution Radiometer (AVHRR), Normalized Difference Vegetation Index data (NDVI, 1 km 2, 1985–2003) and modeled net primary production (NPP, 8 km 2, 1981–2000) data were used to estimate vegetation production in South Africa (SA). The linear relationships of Log eRainfall with NPP and ΣNDVI were calculated for every pixel. Vegetation production generally had a strong relationship with rainfall over most of SA. Therefore, human-induced land degradation can only be detected if its impacts on vegetation production can be distinguished from the effects of rainfall. Two methods were tested (i) Rain-Use Efficiency (RUE=NPP/Rainfall or ΣNDVI/Rainfall) and (ii) Residual Trends (RESTREND), i.e. negative trends in the differences between the observed ΣNDVI and the ΣNDVI predicted by the rainfall. Degraded areas mapped by the National Land Cover in north-eastern SA had reduced RUE; however, annual RUE had a very strong negative correlation with rainfall and varied greatly between years. Therefore, RUE was not a reliable indicator of degradation. The RESTREND method showed promising results at a national scale and in the Limpopo Province, where negative trends were often associated with degraded areas in communal lands. Both positive and negative residual trends can, however, result from natural ecological processes, e.g. the carryover effects of rainfall in previous years. Thus, the RESTREND method can only identify potential problem areas at a regional scale, while the cause of negative trends has to be determined by local investigations.
|
| [11] |
Greenness in semi-arid areas across the globe 1981-2007: An earth observing satellite based analysis of trends an drivers [J].https://doi.org/10.1016/j.rse.2012.01.017 URL [本文引用: 2] 摘要
78 Trends in dryland vegetation greenness (NDVI) based on AVHRR data are analyzed. 78 Climatic constraints to plant growth are anlysed to study causes of NDVI changes. 78 Global drylands on average experience an increase in NDVI from 1981 to 2007. 78 Trends have regional specific explanations and generalizations are not supported.
|
| [12] |
Influence of temperature and precipitation before the growing season on spring phenolgoy in grasslands of the central and eastern Qinghai-Tibetan Plateau [J].https://doi.org/10.1016/j.agrformet.2011.07.003 URL [本文引用: 3] 摘要
Spatial variations in phenological responses to temperature have not been reported for grasslands of the Qinghai-Tibetan Plateau. Using satellite-derived normalized difference vegetation index and meteorological records from 1982 to 2006, we characterized the spatial patterns of grassland green-up onset in relation to air temperature and precipitation before the growing season (“preseason” henceforth) in the central and eastern plateau by combining linear programming with correlation analysis. Green-up onset near half of the meteorological stations was significantly correlated (p<0.10) with precipitation and thermal spring onset (TSO) date based on the cumulative temperature less than 6 weeks before the onset. The green-up onset paralleled the advance in TSO in the southwestern, southeastern, eastern, and northeastern parts of the plateau. The TSO and preseason precipitation (PPT) explained part of the inter-annual phenological variations, with r2 varying between 0.05 and 0.55 and averaging 0.28, and did not explain delay of green-up onset in some areas. Increasing preseason temperature tended to advance green-up onset in relatively moist areas. PPT exerted a stronger influence on green-up onset in drier areas. These results indicate spatial differences in the key environmental influences on spring phenology. To improve the ability to predict onset, ground-based community-level phenological studies and spatial scaling-up of the phenology–climate relationship will be necessary.
|
| [13] |
Recent Land Degradation and Improvement in China. AMBIO [J].https://doi.org/10.1579/0044-7447-38.3.150 URL PMID: 19580032 [本文引用: 3] 摘要
Land degradation is a global development and environment issue that afflicts China more than most countries in terms of the extent, economic impact, and number of people affected. Up-to-date, quantitative information is needed to support policy and action for food and water security, economic development, and environmental integrity. Data for a defined, recent period enable us to distinguish the legacy of historical land degradation from what is happening now. We define land degradation as long-term decline in ecosystem function and productivity and measure it by remote sensing of the normalized difference vegetation index (NDVI), the greenness index. NDVI may be translated to net primary productivity (NPP). Deviation from the norm serves as a proxy assessment of land degradation and improvement-if other factors that may be responsible are taken into account. These other factors include climate, which may be assessed by rain-use efficiency and energy-use efficiency. Analysis of the 23-year Global Inventory Modeling and Mapping Studies (GIMMS) NDVI data reveals that, in China over the period 1981-2003, NPP increased overall, but areas of declining climate-adjusted NPP comprise 23% of the country, mainly in south China. About 35% of China's population (457 million out of 1 317 million) depend on the degrading land. Degrading areas suffered a loss of NPP of 12 kgC ha鈦宦 y鈦宦, amounting to almost 60 million tC not fixed from the atmosphere; loss of soil organic carbon from these areas is likely to be orders of magnitude greater. There is no correlation between land degradation and dry lands; it is more of an issue in cropland and forest: 21% of degrading land is cropland and 40% is forest, 24% of the arable and 44% of the forest, respectively. There is no simple statistical relationship between land degradation and rural population density or poverty. Most identified land degradation is in the south and east, driven by unprecedented land-use change.
|
| [14] |
Analysis of trend in the Sahelian 'rain-use efficiency' using GIMMS NDVI, RFE and GPCP rainfall data [J].https://doi.org/10.1016/j.rse.2010.09.014 URL [本文引用: 1] 摘要
Rain-use efficiency (RUE; the ratio of vegetation productivity to annual precipitation) has been suggested as a measure for assessing land degradation in arid/semi-arid areas. In the absence of anthropogenic influence, RUE has been reported to be constant over time, and any observed change may therefore be attributed to non-rainfall impacts. This study presents an analysis of the decadal time-scale changes in the relationship between a proxy for vegetation productivity (ΣNDVI) and annual rainfall in the Sahel-Sudanian zone of Africa. The aim is to test the quality of data input and the usefulness of both the RUE approach and an alternative method for separating the effects on vegetation productivity of rainfall change and human impact. The analyses are based on earth observation of both rainfall (GPCP (Global Precipitation Climatology Project), 1982–2007 and RFE (Rainfall Estimate) (1996–2007)) and ΣNDVI (AVHRR GIMMS NDVI dataset, 1982–2007). It is shown that the increase in ΣNDVI has been substantial in the Sahel-Sudanian zone over the 1982–2007 period, whereas for the period 1996–2007 the pattern of ΣNDVI trends is more complex. Also, trend analysis of annual rainfall from GPCP data (2.5° resolution) and RFE data (0.1° resolution) suggests that rainfall has increased over both periods. Further it is shown that RUE values are highly correlated to rainfall, undermining the use of earth observation (EO)-based RUE (using ΣNDVI) as a means of separating rainfall impacts from other factors. An alternative method identify temporal trends in residuals of ΣNDVI, after regressing it against annual rainfall, is tested, yet is shown to be useful only where a high correlation between ΣNDVI and annual rainfall exists. For the areas in the Sahel-Sudanian zone for which this condition is fulfilled, trend analyses suggest very limited anthropogenic land degradation in the Sahel-Sudanian zone.
|
| [15] |
秦巴山区植被覆盖与土壤湿度时空变化特征及其相互关系 [J].Spatio- temporal variation and interrelationship of vegetation cover and soil moisture in Qinling-Daba Mountains [J]. |
| [16] |
Multi-sensor NDVI data continuity: Uncertainties and implications for vegetation monitoring applications [J].https://doi.org/10.1016/j.rse.2005.10.002 URL [本文引用: 2] 摘要
Consistent NDVI time series are paramount in monitoring ecological resources that are being altered by climate and human impacts. An increasing number of natural resource managers use web-based geospatial decision support tools that integrate time series of both historical and current NDVI data derived from multiple sensors to make better informed planning and management decisions. Representative canopy reflectance and NDVI data were simulated for historical, current and future AVHRR, MODIS and VIIRS land surface monitoring satellites to quantify the differences due to sensor-specific characteristics. Cross-sensor NDVI translation equations were developed for surface conditions. The effect of a range of atmospheric conditions (Rayleigh scattering, ozone, aerosol optical thickness, and water vapor content) on the sensor-specific reflectance and NDVI values were evaluated to quantify the uncertainty in the apparent NDVI for each sensor. MODIS and VIIRS NDVI data are minimally affected by the atmospheric water vapor, while AVHRR NDVI data are substantially reduced by water vapor. Although multi-sensor NDVI continuity can be obtained by using the developed cross-sensor translation equations, the interactions between the spectral characteristics of surface vegetation and soil components, sensor-specific spectral band characteristics and atmospheric scattering and absorption windows will introduce uncertainty due to insufficient knowledge about the atmospheric conditions that affect the signal of the Earth's pixels at the time of data acquisitions. Processing strategies and algorithm preferences among data streams are also hindering cross-sensor NDVI continuity.
|
| [17] |
Increasing altitudinal gradient of spring vegetation phenology during the last decade on the Qinghai-Tibetan Plateau [J].https://doi.org/10.1016/j.agrformet.2014.01.003 URL [本文引用: 3] 摘要
Spring vegetation phenology in temperate and cold regions is widely expected to advance with increasing temperature, and is often used to indicate regional climatic change. The Qinghai–Tibetan Plateau (QTP) has recently experienced intensive warming, but strongly contradictory evidence exists regarding changes in satellite retrievals of spring vegetation phenology. We investigated spatio-temporal variations in green-up date on the QTP from 2000 to 2011, as determined by five methods employing vegetation indices from each of the four sources: three Normalized Difference Vegetation Index (NDVI) from the Advanced Very High Resolution Radiometer (AVHRR), Système Pour l’Observation de la Terre (SPOT), MODerate resolution Imaging Spectroradiometer (MODIS), and the Enhanced Vegetation Index (EVI) from MODIS. Results indicate that, at the regional scale, all vegetation indices and processing methods consistently found no significant temporal trend (all P>0.05). This insignificance resulted from substantial spatial heterogeneity of trends in green-up date, with a notably delay in the southwest region, and widespread advancing trend in the other areas, despite a region-wide temperature increase. These changes doubled the altitudinal gradient of green-up date, from 0.63 days 100m611 in the early 2000s to 1.30 days 100m611 in the early 2010s. The delays in the southwest region and at high altitudes were likely caused by the decline in spring precipitation, rather than the increasing spring temperature, suggesting that spring precipitation may be an important regulator of spring phenological response to climatic warming over a considerable area of the QTP. Consequently, a delay in spring vegetation phenology in the QTP may not necessarily indicate spring cooling. Furthermore, the phenological changes retrieved from the widely used AVHRR NDVI differed from those retrieved from SPOT and MODIS NDVIs and MODIS EVI, necessitating the use of multiple datasets when monitoring vegetation dynamics from space.
|
| [18] |
Spatiotemporal variation in alpine grassland phenology in the Qinghai-Tibetan Plateau from 1999 to 2009 [J].https://doi.org/10.1007/s11434-012-5407-5 URL [本文引用: 1] 摘要
Plant phenology is the most salient and sensitive indicator of terrestrial ecosystem response to climate change.Studying its change is significantly important in understanding and predicting impressively changes in terrestrial ecosystem.Based on NDVI from SPOT VGT,this paper analyzed the spatiotemporal changes in alpine grassland phenology in Qinghai-Tibetan Plateau from 1999 to 2009.The results are enumerated as follows:(1) The spatial distribution of the average alpine grassland phenology from 1999 to 2009 is closely related to water and heat conditions.Accompanying the deterioration in heat and water conditions from southeast to northwest,the start of growth season(SOG) was delayed gradually,the end of growth season(EOG) advanced slowly,and the length of growth season(LOG) shortened gradually.Elevation played an important role in the regional differentiation of phenology,but a dividing line of approximately 3500 m existed.Below this line,the phenology fluctuated irregularly with altitude change,whereas above the line,the phenology is closely related to altitude change.(2) From 1999 to 2009,SOG of the alpine grassland came earlier by six days per decade(R2=0.281,P=0.093),EOG was late by two days per decade(R2=0.031,P=0.605),and LOG lengthened by eight days per decade(R2=0.479,P=0.018).The early SOG,the late EOG,and the extended LOG mainly occurred at the center and east of the Plateau.SOG in most of the Plateau advanced significantly,especially in the eastern Plateau.(3) The inter-annual phenology changes of the alpine grassland in the Qinghai-Tibetan Plateau exhibited significant differentiation at different elevation and natural zones.The inter-annual changes at high altitude were more complicated than that at low altitude.The most significant phenology changes were found in the eastern Qinghai-Qilian montane steppe zone,and non-significant changes occurred in the Southern Tibet montane shrub-steppe zone.
|
| [19] |
青藏高原NDVI变化趋势及其对气候的响应 [J].
高原脆弱生态区对全球变化具有放大镜效应,利用长时序遥感数据及气象观测资料探索青藏高原对全球气候变化的响应具有重要意义。以1982—2012年GIMMS NDVI数据及同时期气象观测数据为数据源,借助于最大值合成、相关性分析和线性回归等数据分析技术,分析了青藏高原4 000m高海拔区域的NDVI的变化趋势以及气候响应。结果表明:(1)近31年来,青藏高原对全球变化响应明显,年降水量、温度均呈显著增长趋势(p0.05),NDVI年变化率为正值、植被覆盖度呈增长趋势,均表明近年来青藏高原植被长势渐变良好。(2)青藏高原NDVI与降水、温度弱相关,温度对高海拔地区NDVI的影响超过降水,且降水对青藏高原NDVI的影响具有滞后性。(3)从青藏高原不同区域海拔高度和NDVI等值线的分布来看,地势对NDVI具有显著影响,海拔高度较高的区域NDVI值普遍较小。
Variation trend of NDVI and response to climate change in Tibetan Plateau [J].
高原脆弱生态区对全球变化具有放大镜效应,利用长时序遥感数据及气象观测资料探索青藏高原对全球气候变化的响应具有重要意义。以1982—2012年GIMMS NDVI数据及同时期气象观测数据为数据源,借助于最大值合成、相关性分析和线性回归等数据分析技术,分析了青藏高原4 000m高海拔区域的NDVI的变化趋势以及气候响应。结果表明:(1)近31年来,青藏高原对全球变化响应明显,年降水量、温度均呈显著增长趋势(p0.05),NDVI年变化率为正值、植被覆盖度呈增长趋势,均表明近年来青藏高原植被长势渐变良好。(2)青藏高原NDVI与降水、温度弱相关,温度对高海拔地区NDVI的影响超过降水,且降水对青藏高原NDVI的影响具有滞后性。(3)从青藏高原不同区域海拔高度和NDVI等值线的分布来看,地势对NDVI具有显著影响,海拔高度较高的区域NDVI值普遍较小。
|
| [20] |
Altitude and temperature dependence of change in the spring vegetation green-up date from 1982 to 2006 in the Qinghai-Xizang Plateau [J].https://doi.org/10.1016/j.agrformet.2011.06.016 URL [本文引用: 5] 摘要
Research in phenology change has been one heated topic of current ecological and climate change study. In this study, we use satellite derived NDVI (Normalized Difference Vegetation Index) data to explore the spatio-temporal changes in the timing of spring vegetation green-up in the Qinghai-Xizang (Tibetan) Plateau from 1982 to 2006 and to characterize their relationship with elevation and temperature using concurrent satellite and climate data sets. At the regional scale, no statistically significant trend of the vegetation green-up date is observed during the whole study period (R2=0.00, P=0.95). Two distinct periods of green-up changes are identified. From 1982 to 1999, the vegetation green-up significantly advanced by 0.88daysyear 1 (R2=0.56, P<0.001). In contrast, from 1999 to 2006, a marginal delaying trend is evidenced (R2=0.44, P=0.07), suggesting that the persistent trend towards earlier vegetation green-up in spring between 1980s and 1990s was stalled during the first decade of this century. This shift in the tendency of the vegetation green-up seems to be related to differing temperature trends between these two periods. Statistical analysis shows that the average onset of vegetation green-up over the Qinghai-Xizang Plateau would advance by about 4.1 days in response to 1 C increase of spring temperature. In addition, results from our analysis indicate that the spatial patterns of the vegetation green-up date and its change since 1982 are altitude dependent. The magnitude of the vegetation green-up advancement during 1982 1999, and of its postponement from 1999 to 2006 significantly increases along an increasing elevation gradient.
|
| [21] |
Green-up dates in the Tibetan Plateau have continuously advanced from 1982 to 2011 [J].https://doi.org/10.1073/pnas.1210423110 URL [本文引用: 2] |
| [22] |
Interannual variability of the normalized difference vegetation index on the tiebetan plateau and its relationship with climate change [J].https://doi.org/10.1007/s00376-007-0474-2 URL [本文引用: 1] 摘要
he Qinghai-Xizang Plateau, or Tibetan Plateau, is a sensitive region for climate change, where the manifestation of global warming is particularly noticeable. The wide climate variability in this region significantly affects the local land ecosystem and could consequently lead to notable vegetation changes. In this paper, the interannual variations of the plateau vegetation are investigated using a 21-year normalized difference vegetation index (NDVI) dataset to quantify the consequences of climate warming for the regional ecosystem and its interactions. The results show that vegetation coverage is best in the eastern and southern plateau regions and deteriorates toward the west and north. On the whole, vegetation activity demonstrates a gradual enhancement in an oscillatory manner during 1982-2002. The temporal variation also exhibits striking regional differences: an increasing trend is most apparent in the west, south, north and southeast, whereas a decreasing trend is present along the southern plateau boundary and in the central-east region. Covariance analysis between the NDVI and surface temperature/precipitation suggests that vegetation change is closely related to climate change. However, the controlling physical processes vary geographically. In the west and east, vegetation variability is found to be driven predominantly by temperature, with the impact of precipitation being of secondary importance. In the central plateau, however, temperature and precipitation factors are equally important in modulating the interannual vegetation variability.
|
| [23] |
Monitoring vegetation greenness variations in Qinghai-Tebet Plateau with MODIS vegetation index [J].https://doi.org/10.1109/IGARSS.2011.6049241 URL [本文引用: 1] 摘要
The Qinghai-Tibet Plateau is one of the most sensitive and fragile regions to climate changes, which has been found experiencing distinct warming trend in recent decades. We detected the vegetation greenness trends with the MODIS data in the Qinghai-Tibet Plateau during 2000-2009. The annual average normalized difference vegetation index (NDVI) increased 0.036 yr-1 in this region. Statistically significant increasing trend appeared in about 20% of the vegetated area, primarily in the northeastern Plateau. Only 4% of the study region, mostly in the southern Plateau, showed significant decreasing NDVI trend.
|
| [24] |
Response of hydrological cycle to recent climate changes in the Tibetan Plateau [J].https://doi.org/10.1007/s10584-011-0099-4 URL [本文引用: 1] 摘要
AbstractThe Tibetan Plateau (TP) surfaces have been experiencing an overall rapid warming and wetting while wind speed and solar radiation have been declining in the last three decades. This study investigated how climate changes influenced the hydrological cycle on the TP during 1984鈭2006. To facilitate the analysis, a land surface model was used to simulate surface water budget at all CMA (China Meteorological Administration) stations on the TP. The simulated results were first validated against observed ground temperature and observation-derived heat flux on the western TP and observed discharge trends on the eastern TP. The response of evaporation and runoff to the climate changes was then analyzed. Major finding are as follows. (1) Surface water balance has been changed in recent decades. Observed precipitation shows insignificant increasing trends in central TP and decreasing trends along the TP periphery while evaporation shows overall increasing trends, leading to decreased discharge at major TP water resource areas (semi-humid and humid zones in the eastern and southern TP). (2) At the annual scale, evaporation is water-limited in dry areas and energy-limited (radiation and air temperature) in wet areas; these constraints can be interpreted by the Budyko-curve. Evaporation in autumns and winters was strongly controlled by soil water storage in summers, weakening the dependence of evaporation on precipitation at seasonal scales. (3) There is a complementary effect between the simulated actual evaporation and potential evaporation, but this complementary relationship may deviate from Bouchet hypothesis when vapor pressure deficit (or air temperature) is too low, which suppresses the power of vapor transfer.
|
| [25] |
The altitudinal dependence of recent rapid warming over the Tibetan Plateau [J].https://doi.org/10.1007/s10584-009-9733-9 URL [本文引用: 1] |
| [26] |
Accelerated changes of environmental conditions on the Tibetan Plateau caused by climate change [J].https://doi.org/10.1175/JCLI-D-10-05000.1 URL [本文引用: 1] |
| [27] |
Changing inland lakes responding to climate warming in Northeastern Tibetan Plateau [J]https://doi.org/10.1007/s10584-011-0032-x URL [本文引用: 1] 摘要
The main portion of Tibetan Plateau has experienced statistically significant warming over the past 5002years, especially in cold seasons. This paper aims to identify and characterize the dynamics of inland lakes that located in the hinterland of Tibetan Plateau responding to climate change. We compared satellite imageries in late 1970s and early 1990s with recent to inventory and track changes in lakes after three decades of rising temperatures in the region. It showed warm and dry trend in climate with significant accelerated increasing annual mean temperature over the last 3002years, however, decreasing periodically annual precipitation and no obvious trend in potential evapotranspiration during the same period. Our analysis indicated widespread declines in inland lake’s abundance and area in the whole origin of the Yellow River and southeastern origin of the Yangtze River. In contrast, the western and northern origin of the Yangtze River revealed completely reverse change. The regional lake surface area decreased by 11,49902ha or 1.72% from the late 1970s to the early 1990s, and increased by 6,86602ha or 1.04% from the early 1990s to 2004. Shrinking inland lakes may become a common feature in the discontinuous permafrost regions as a consequence of warming climate and thawing permafrost. Furthermore, obvious expanding were found in continuous permafrost regions due to climate warming and glacier retreating. The results may provide information for the scientific recognition of the responding events to the climate change recorded by the inland lakes.
|
| [28] |
Delayed spring phenology on the Tibetan Plateau may also be attributable to other factors than winter and spring warming [J].https://doi.org/10.1073/pnas.1100091108 URL PMID: 21482815 [本文引用: 1] 摘要
In their recent paper “Winter and spring warming result in delayed spring phenology on the Tibetan Plateau,” Yu et al. (1) reported an interesting but unexpected result that spring phenology initiated retreating in the mid-1990s, despite continued warming for grasslands (both steppe and meadow) on the Tibetan Plateau, and shortening the length of the growing season of the steppe together with an advancing end. Although we have not observed the same phenomenon in our own many years of field studies on the eastern edge of the Tibetan Plateau, we believed that there were indeed some complicated yet poorly understood dynamics...
|
| [29] |
Trend analysis of vegetation dynamics in Qinghai-Tibet Plateau using Hurst Exponent [J].https://doi.org/10.1016/j.ecolind.2011.08.011 URL [本文引用: 1] 摘要
As one of the most sensitive areas responding to global environmental change, especially global climate change, Qinghai-Tibet Plateau has been recognized as a hotspot for coupled studies on global terrestrial ecosystem change and global climate change. As an important component of terrestrial ecosystems, vegetation dynamic has become one of the key issues in global environmental change, and numerous case studies have been conducted on vegetation dynamic trend in different study periods. However, few are focused on the quantitative analysis of the consistency of vegetation dynamic trends after the study periods. In the study, taking Qinghai-Tibet Plateau as a case, vegetation dynamic trend during 1982-2003 were analyzed, with the application of the method of linear regression analysis. The results showed that, vegetation dynamics in Qinghai-Tibet Plateau experienced a significant increasing as a whole, with nearly 50% forest degradation in the study period. And among the 7 kinds of vegetation types, the change of forest was the most fluctuant with desert the least one. Furthermore, the consistency of vegetation dynamic trends after the study period, was quantified using Hurst Exponent and the method of R/S analysis. The results showed high consistency of future vegetation dynamic trends for the whole plateau, and inconsistent areas were mainly meadow and steppe distributed in the middle or east of the plateau. It was also convinced that, vegetation dynamic trends in the study area were significantly influenced by topography, especially the elevation.
|
| [30] |
1982-2009年青藏高原草地覆盖度时空变化特征 [J].https://doi.org/10.11849/zrzyxb.2010.12.012 URL Magsci 摘要
利用GIMMS和SPOT VGT两种归一化植被指数(NDVI)数据对青藏高原地区1982—2009年期间草地覆盖的时空变化进行研究,结果如下:①青藏高原草地植被覆盖的年际变化存在着显著的空间差异。趋于升高的区域主要分布在西藏的北部和新疆的南部;趋于下降的地区主要分布在青海的柴达木盆地、祁连山、共和盆地、江河源地区及川西地区。②青藏高原草地覆盖度年际变化趋势分析表明,在90%的显著性检验水平上,降低和增加面积的比率为0.31,草地植被覆盖水平总体趋于升高态势。③以10 a为步长的分析表明:草地盖度呈现持续增加的区域主要分布在西藏北部;阿里地区草地盖度表现为先减少后增加;雅鲁藏布江流域草地盖度呈现先增加而后减少;而持续减少的区域主要分布在青海省以及川西地区,其中青海省分布最广;统计结果显示,高原大部分地区草地盖度具有升高的态势。
Temporal and spatial distribution of grassland coverage change in Tibetan Plateau since 1982 [J].https://doi.org/10.11849/zrzyxb.2010.12.012 URL Magsci 摘要
利用GIMMS和SPOT VGT两种归一化植被指数(NDVI)数据对青藏高原地区1982—2009年期间草地覆盖的时空变化进行研究,结果如下:①青藏高原草地植被覆盖的年际变化存在着显著的空间差异。趋于升高的区域主要分布在西藏的北部和新疆的南部;趋于下降的地区主要分布在青海的柴达木盆地、祁连山、共和盆地、江河源地区及川西地区。②青藏高原草地覆盖度年际变化趋势分析表明,在90%的显著性检验水平上,降低和增加面积的比率为0.31,草地植被覆盖水平总体趋于升高态势。③以10 a为步长的分析表明:草地盖度呈现持续增加的区域主要分布在西藏北部;阿里地区草地盖度表现为先减少后增加;雅鲁藏布江流域草地盖度呈现先增加而后减少;而持续减少的区域主要分布在青海省以及川西地区,其中青海省分布最广;统计结果显示,高原大部分地区草地盖度具有升高的态势。
|
| [31] |
基于生态地理分区的青藏高原植被覆被变化及其对气候变化的响应 [J].https://doi.org/10.11821/yj2010110009 URL 摘要
基于1982~2006年GIMMS NDVI数据集和地面气象台站观测数据,分析了青藏高原整个区域及各生态地理分区年均NDVI的变化趋势,并通过偏相关分析研究不同生态地理分区植被覆被变化对气温和降水响应的空间分异特征。研究表明:(1)近25年来,高原植被覆盖变化整体上趋于改善;高原东北部、东中部以及西南部湿润半湿润及部分半干旱地区植被趋于改善,植被覆盖较差的北部、西部半干旱和干旱地区呈现退化趋势;(2)高原植被变化与气温变化的相关性明显高于与降水变化的相关性,说明高原植被年际变化对温度变化更为敏感;(3)高原植被年际变化与气温和降水的相关性具有明显的区域差异,植被覆盖中等区域全年月NDVI与气温和降水的相关性最强,相关性由草甸向草原、针叶林逐步减弱,荒漠区相关性最弱。生长季植被覆盖变化与气温的相关性和全年相关性较一致,降水则不同,生长季期间高原大部分地区植被变化与降水相关性不显著。
Vegetation change and its responses to climatic variation based on eco-geographical regions of Tibetan Plateau [J].https://doi.org/10.11821/yj2010110009 URL 摘要
基于1982~2006年GIMMS NDVI数据集和地面气象台站观测数据,分析了青藏高原整个区域及各生态地理分区年均NDVI的变化趋势,并通过偏相关分析研究不同生态地理分区植被覆被变化对气温和降水响应的空间分异特征。研究表明:(1)近25年来,高原植被覆盖变化整体上趋于改善;高原东北部、东中部以及西南部湿润半湿润及部分半干旱地区植被趋于改善,植被覆盖较差的北部、西部半干旱和干旱地区呈现退化趋势;(2)高原植被变化与气温变化的相关性明显高于与降水变化的相关性,说明高原植被年际变化对温度变化更为敏感;(3)高原植被年际变化与气温和降水的相关性具有明显的区域差异,植被覆盖中等区域全年月NDVI与气温和降水的相关性最强,相关性由草甸向草原、针叶林逐步减弱,荒漠区相关性最弱。生长季植被覆盖变化与气温的相关性和全年相关性较一致,降水则不同,生长季期间高原大部分地区植被变化与降水相关性不显著。
|
| [32] |
青藏高原草地植被覆盖变化及其与气候因子的关系 [J].https://doi.org/10.17521/cjpe.2006.0001 URL Magsci 摘要
为揭示气候变化对青藏高原草地生态系统的影响及其生态适应机制,利用1982~1999年间的NOAA/AVHRR <EM>NDVI</EM> 数据和对应的气候资料,研究了近20年来青藏高原草地植被 覆盖 变化及其与气候因子的关系。结果表明,18年来研究区生长季<EM>NDVI</EM>显著增加(<EM>p</EM>=0.015) ,其增加率和增加量分别为0.41% a<SUP>-1</SUP>和0.001 0 a<SUP>-1</SUP>。生长季提前和生长季生长加速是青藏高 原草地植被生长季<EM>NDVI</EM>增加的主要原因。春季为<EM>NDVI</EM>增加率和增加量最大的季节, 其增加率 和增加量分别为0.92% a<SUP>-1</SUP>和0.001 4 a<SUP>-1</SUP>;夏季<EM>NDVI</EM>的增加对生长季<EM>NDVI</EM>增加的贡献相对较小,其增加率和增加量分别为0.37% a<SUP>-1</SUP>和0.001 0 a<SUP>-1</SUP>。3种草地(高寒草甸、高寒草原、温性草原)春季<EM>NDVI</EM>均显著增加(<EM>p</EM><0.01;<EM> p</EM>=0.001;<EM> p</EM>=0.002); 高寒草甸夏季<EM>NDVI</EM>显著增 加(<EM>p</EM>=0.027),而高寒草原和温性草原夏季<EM>NDVI</EM>呈增加趋势,但都不显著(<EM>p</EM>=0. 106; <EM>p</EM>=0 .087);3种草地秋季<EM>NDVI</EM>则没有明显的变化趋势(<EM>p</EM>=0.585; <EM>p</EM>=0.461; <EM>p</EM>=0 .143)。3种草地春季<EM>NDVI</EM>的增加是由春季温度上升所致。高寒草地(高寒草甸和高寒草原)夏季 <EM>NDVI</EM>的增加是夏季温度和春季降水共同作用的结果。温性草原夏季<EM>NDVI</EM>变化与气候因子并没有表现出显著的相关关系。高寒草地植被生长对气候变化的响应存在滞后效应。
Variations in grassland vegetation cover in relation to climatic factors on the Tibetan Plateau [J].https://doi.org/10.17521/cjpe.2006.0001 URL Magsci 摘要
为揭示气候变化对青藏高原草地生态系统的影响及其生态适应机制,利用1982~1999年间的NOAA/AVHRR <EM>NDVI</EM> 数据和对应的气候资料,研究了近20年来青藏高原草地植被 覆盖 变化及其与气候因子的关系。结果表明,18年来研究区生长季<EM>NDVI</EM>显著增加(<EM>p</EM>=0.015) ,其增加率和增加量分别为0.41% a<SUP>-1</SUP>和0.001 0 a<SUP>-1</SUP>。生长季提前和生长季生长加速是青藏高 原草地植被生长季<EM>NDVI</EM>增加的主要原因。春季为<EM>NDVI</EM>增加率和增加量最大的季节, 其增加率 和增加量分别为0.92% a<SUP>-1</SUP>和0.001 4 a<SUP>-1</SUP>;夏季<EM>NDVI</EM>的增加对生长季<EM>NDVI</EM>增加的贡献相对较小,其增加率和增加量分别为0.37% a<SUP>-1</SUP>和0.001 0 a<SUP>-1</SUP>。3种草地(高寒草甸、高寒草原、温性草原)春季<EM>NDVI</EM>均显著增加(<EM>p</EM><0.01;<EM> p</EM>=0.001;<EM> p</EM>=0.002); 高寒草甸夏季<EM>NDVI</EM>显著增 加(<EM>p</EM>=0.027),而高寒草原和温性草原夏季<EM>NDVI</EM>呈增加趋势,但都不显著(<EM>p</EM>=0. 106; <EM>p</EM>=0 .087);3种草地秋季<EM>NDVI</EM>则没有明显的变化趋势(<EM>p</EM>=0.585; <EM>p</EM>=0.461; <EM>p</EM>=0 .143)。3种草地春季<EM>NDVI</EM>的增加是由春季温度上升所致。高寒草地(高寒草甸和高寒草原)夏季 <EM>NDVI</EM>的增加是夏季温度和春季降水共同作用的结果。温性草原夏季<EM>NDVI</EM>变化与气候因子并没有表现出显著的相关关系。高寒草地植被生长对气候变化的响应存在滞后效应。
|
| [33] |
Winter and spring warming result in delayed spring phenology on the Tibetan Plateau [J].https://doi.org/10.1073/pnas.1012490107 URL PMID: 21115833 摘要
Climate change has caused advances in spring phases of many plant species. Theoretically, however, strong warming in winter could slow the fulfillment of chilling requirements, which may delay spring phenology. This phenomenon should be particularly pronounced in regions that are experiencing rapid temperature increases and are characterized by highly temperature-responsive vegetation. To test this hypothesis, we used the Normalized Difference Vegetation Index ratio method to determine the beginning, end, and length of the growing season of meadow and steppe vegetation of the Tibetan Plateau in Western China between 1982 and 2006. We then correlated observed phenological dates with monthly temperatures for the entire period on record. For both vegetation types, spring phenology initially advanced, but started retreating in the mid-1990s in spite of continued warming. Together with an advancing end of the growing season for steppe vegetation, this led to a shortening of the growing period. Partial least-squares regression indicated that temperatures in both winter and spring had strong effects on spring phenology. Although warm springs led to an advance of the growing season, warm conditions in winter caused a delay of the spring phases. This delay appeared to be related to later fulfillment of chilling requirements. Because most plants from temperate and cold climates experience a period of dormancy in winter, it seems likely that similar effects occur in other environments. Continued warming may strengthen this effect and attenuate or even reverse the advancing trend in spring phenology that has dominated climate-change responses of plants thus far.
|
| [34] |
Seasonal response of grasslands to climate change on the Tibetan Plateau [J].https://doi.org/10.1371/journal.pone.0049230 URL PMID: 3500274 [本文引用: 1] 摘要
Monitoring vegetation dynamics and their responses to climate change has been the subject of considerable research. This paper aims to detect change trends in grassland activity on the Tibetan Plateau between 1982 and 2006 and relate these to changes in climate. Grassland activity was analyzed by evaluating remotely sensed Normalized Difference Vegetation Index (NDVI) data collected at 15-day intervals between 1982 and 2006. The timings of vegetation stages (start of green-up, beginning of the growing season, plant maturity, start of senescence and end of the growing season) were assessed using the NDVI ratio method. Mean NDVI values were determined for major vegetation stages (green-up, fast growth, maturity and senescence). All vegetation variables were linked with datasets of monthly temperature and precipitation, and correlations between variables were established using Partial Least Squares regression. Most parts of the Tibetan Plateau showed significantly increasing temperatures, as well as clear advances in late season phenological stages by several weeks. Rainfall trends and significant long-term changes in early season phenology occurred on small parts of the plateau. Vegetation activity increased significantly for all vegetation stages. Most of these changes were related to increasing temperatures during the growing season and in some cases during the previous winter. Precipitation effects appeared less pronounced. Warming thus appears to have shortened the growing season, while increasing vegetation activity. Shortening of the growing season despite a longer thermally favorable period implies that vegetation on the Tibetan Plateau is unable to exploit additional thermal resources availed by climate change. Ecosystem composition may no longer be well attuned to the local temperature regime, which has changed rapidly over the past three decades. This apparent lag of the vegetation assemblage behind changes in climate should be taken into account when projecting the impacts of climate change on ecosystem processes.
|
| [35] |
青藏高原国家生态安全屏障保护与建设 [J].https://doi.org/10.11821/xb201201001 URL [本文引用: 1] 摘要
The shelter function of Tibetan Plateau has an important effect on the ecological security in China, even in Asia. Under the joint influence of global change and human activities, ecosystem destabilizing and resources and environment pressure increasing emerge on the Tibetan Plateau, which have caused some problems, including significant glacier retreat, serious land degradation, aggravated soil erosion and water loss, increased threats to biodiversity along with decreased rare and specious biological resources, and natural disasters increasing. These problems have a great influence on regional ecological security shelter function on the plateau. Based on the relevant research and practical experience in ecological construction, some suggestions are proposed to strengthen ecological protection and construction of the national ecological security shelter zone on the Tibetan Plateau at present, namely, strengthening basic research on the Tibetan Plateau ecological shelter impacts and regional ecological security enhancement and climate change mitigation; developing the key technology of protection and construction of the national ecological security shelter zone on the plateau and demonstration; striving to set up a monitoring system of ecological shelter function, intensifying evaluation of protection and construction efficiency of ecological security shelter zone, perfecting evaluation systems and standards, and summarizing experience, so as to enhance the overall function of national ecological security shelter and to further take the initiative in dealing with global change.
Protection and construction of the national ecological security shelter zone on Tibetan Plateau [J].https://doi.org/10.11821/xb201201001 URL [本文引用: 1] 摘要
The shelter function of Tibetan Plateau has an important effect on the ecological security in China, even in Asia. Under the joint influence of global change and human activities, ecosystem destabilizing and resources and environment pressure increasing emerge on the Tibetan Plateau, which have caused some problems, including significant glacier retreat, serious land degradation, aggravated soil erosion and water loss, increased threats to biodiversity along with decreased rare and specious biological resources, and natural disasters increasing. These problems have a great influence on regional ecological security shelter function on the plateau. Based on the relevant research and practical experience in ecological construction, some suggestions are proposed to strengthen ecological protection and construction of the national ecological security shelter zone on the Tibetan Plateau at present, namely, strengthening basic research on the Tibetan Plateau ecological shelter impacts and regional ecological security enhancement and climate change mitigation; developing the key technology of protection and construction of the national ecological security shelter zone on the plateau and demonstration; striving to set up a monitoring system of ecological shelter function, intensifying evaluation of protection and construction efficiency of ecological security shelter zone, perfecting evaluation systems and standards, and summarizing experience, so as to enhance the overall function of national ecological security shelter and to further take the initiative in dealing with global change.
|
| [36] |
A Non-Stationary 1981-2012 AVHRR NDVI3g time Series [J].https://doi.org/10.3390/rs6086929 URL [本文引用: 1] 摘要
The NDVI3g time series is an improved 8-km normalized difference vegetation index (NDVI) data set produced from Advanced Very High Resolution Radiometer (AVHRR) instruments that extends from 1981 to the present. The AVHRR instruments have flown or are flying on fourteen polar-orbiting meteorological satellites operated by the National Oceanic and Atmospheric Administration (NOAA) and are currently flying on two European Organization for the Exploitation of Meteorological Satellites (EUMETSAT) polar-orbiting meteorological satellites, MetOp-A and MetOp-B. This long AVHRR record is comprised of data from two different sensors: the AVHRR/2 instrument that spans July 1981 to November 2000 and the AVHRR/3 instrument that continues these measurements from November 2000 to the present. The main difficulty in processing AVHRR NDVI data is to properly deal with limitations of the AVHRR instruments. Complicating among-instrument AVHRR inter-calibration of channels one and two is the dual gain introduced in late 2000 on the AVHRR/3 instruments for both these channels. We have processed NDVI data derived from the Sea-Viewing Wide Field-of-view Sensor (SeaWiFS) from 1997 to 2010 to overcome among-instrument AVHRR calibration difficulties. We use Bayesian methods with high quality well-calibrated SeaWiFS NDVI data for deriving AVHRR NDVI calibration parameters. Evaluation of the uncertainties of our resulting NDVI values gives an error of 卤 0.005 NDVI units for our 1981 to present data set that is independent of time within our AVHRR NDVI continuum and has resulted in a non-stationary climate data set.
|
| [37] |
|
| [38] |
Comparison of gross primary productivity derived from GIMMS NDVI3g, GIMMS, and MODIS in southeast asia [J].https://doi.org/10.3390/rs6032108 URL [本文引用: 1] |
| [39] |
Evaluating and quantifying the climate-driven interannual variability in global inventory modeling and mapping studies (GIMMS) normalized difference vegetation index (NDVI3g) at global scales [J].https://doi.org/10.3390/rs5083918 URL [本文引用: 1] |
| [40] |
|
| [41] |
Changing climate affects vegetation growth in the arid region of the northwest China [J].https://doi.org/10.1016/j.jaridenv.2011.05.007 URL [本文引用: 1] 摘要
The northwestern China is a typical dry-land region of Inner Asia, where significant climate change has been observed over the past several decades. How the regional vegetation, particularly the grassland-oasis-desert complex, responds to such climatic change is poorly understood. To address this question, we investigated spatio-temporal changes in vegetation growth and their responses to a changing climate by biome and bioregion, using satellite-sensed Normalized Difference Vegetation Index (NDVI) data from 1982 to 2003, along with corresponding climate data. Over the past 22 years, about 30% of the total vegetated area showed an annual increase of 0.7% in growing season NDVI. This trend occurred in all biomes and all bioregions except Sawuer, a subregion of the study area with no significant climate change. Further analyses indicated that NDVI change was highly correlated with the current precipitation and evapotranspiration in growing season but was not associated with temperature. We also found that NDVI was positively correlated with the preceding winter precipitation. These findings suggest that precipitation may be the key cause of vegetation growth in this area, even for mountain forests and grasslands, whose growth are often regarded to be limited by low temperate in winter and early spring.Highlights? We proposed that significant climate change may lead to changes in vegetation growth in arid northwestern China. ? NDVI-indicated vegetation growth shows an overall increase in the whole area, all biomes and most bioregions. ? Precipitation may be the key cause of vegetation growth in this area, even for mountain forests and grasslands.
|
| [42] |
Drought and spring cooling induced recent decrease in vegetation growth in Inner Asia [J].https://doi.org/10.1016/j.agrformet.2012.09.014 URL [本文引用: 1] 摘要
The response of vegetation growth to current climate change in Inner Asia (35–55°N, 45–120°E) was investigated by analyzing time series of the Normalized Difference Vegetation Index (NDVI) data from the Advanced Very High Resolution Radiometer (AVHRR) from 1982 to 2009. We found that at the regional scale, the greening trend observed during the 1980s was stalled in the 1990s. Different seasons, however, show different changes and mechanisms. Among the three seasons (spring, summer and autumn), summer has the earliest turning point (from greening to non-greening) in the early 1990s, as a result of summertime droughts, as indicated by Palmer Drought Severity Index (PDSI). Consistent with the change in summer NDVI, summer PDSI and precipitation significantly increased in the 1980s, but strongly decreased since the early 1990s at the regional scale. The negative effect of summer drought is particularly significant over dry regions such as eastern Kazakhstan, Mongolia and Inner Mongolia. However, in high altitude or high latitude regions (>50°N), summer vegetation growth is more strongly correlated with summer temperature rather than with summer PDSI. In spring, changes in vegetation growth are closely linked with temperature changes rather than droughts. Both spring temperature and spring NDVI, for instance, increased until the late 1990s and then decreased. Statistical analyses also show that spring NDVI is significantly correlated with spring temperature at the regional scale (P<0.05), implying that temperature is the dominant limiting factor for spring vegetation growth in most regions of Inner Asia except Turkmenistan and Uzbekistan, where spring PDSI shows significant positive correlation with spring NDVI. Further analyses of the response of vegetation to extreme high spring temperature in 1997 and extreme summer drought in 2001 exhibit a highly heterogeneous pattern.
|
| [43] |
Autumn NDVI contributes more and more to vegetation improvement in the growing season across the Tibetan Plateau [J].https://doi.org/10.1080/17538947.2016.1264490 URL [本文引用: 4] 摘要
Digital Earth has seen great progress during the last 19 years. When it entered into the era of big data, Digital Earth developed into a new stage, namely one characterized by 090004Big Earth Data090005, confronting new challenges and opportunities. In this paper we give an overview of the development of Digital Earth by summarizing research achievements and marking the milestones of Digital Earth090005s development. Then, the opportunities and challenges that Big Earth Data faces are discussed. As a data-intensive scientific research approach, Big Earth Data provides a new vision and methodology to Earth sciences, and the paper identifies the advantages of Big Earth Data to scientific research, especially in knowledge discovery and global change research. We believe that Big Earth Data will advance and promote the development of Digital Earth.
|
| [44] |
Spatiotemporal changes of vegetation on the Tibetan Plateau and relationship to climatic variables during multiyear periods from 1982-2012 [J],https://doi.org/10.1007/s12665-015-4873-x URL [本文引用: 3] 摘要
Water conservation is critical under the current state of climate change and population growth; however, water-conservation programs and research in China have generally focused on technological...
|
| [45] |
Linear trends in seasonal vegetation time series and the modifiable temporal unit problem [J].https://doi.org/10.5194/bg-9-71-2012 URL [本文引用: 2] |
| [46] |
Modifiable temporal unit problem (MTUP) and its effect on space-time cluster detection [J].https://doi.org/10.1371/journal.pone.0100465 URL PMID: 24971885 [本文引用: 2] 摘要
When analytical techniques are used to understand and analyse geographical events, adjustments to the datasets (e.g. aggregation, zoning, segmentation etc.) in both the spatial and temporal dimensions are often carried out for various reasons. The 'Modifiable Areal Unit Problem' (MAUP), which is a consequence of adjustments in the spatial dimension, has been widely researched. However, its temporal counterpart is generally ignored, especially in space-time analysis.In analogy to MAUP, the Modifiable Temporal Unit Problem (MTUP) is defined as consisting of three temporal effects (aggregation, segmentation and boundary). The effects of MTUP on the detection of space-time clusters of crime datasets of Central London are examined using Space-Time Scan Statistics (STSS).The case study reveals that MTUP has significant effects on the space-time clusters detected. The attributes of the clusters, i.e. temporal duration, spatial extent (size) and significance value (p-value), vary as the aggregation, segmentation and boundaries of the datasets change. Aggregation could be used to find the significant clusters much more quickly than at lower scales; segmentation could be used to understand the cyclic patterns of crime types. The consistencies of the clusters appearing at different temporal scales could help in identifying strong or 'true' clusters.
|
| [47] |
Analysis on spatio-temporal trends and drivers in vegetation growth during recent decades in Xinjiang, China [J].https://doi.org/10.1016/j.jag.2015.01.006 URL [本文引用: 2] 摘要
Vegetation plays an important role in regulating the terrestrial carbon balance and the climate system, and also overwhelmingly dominates the provisioning of ecosystem services. In this study, a non-stationary 1982 2012 AVHRR NDVI3g time series, the newest dataset, were used to evaluate spatio-temporal patterns of seasonal vegetation changes in Xinjiang province of China at regional, biome and pixel scales over progressively longer periods from 18 to 31 years, starting in 1982, and their linkages to climatic factors and human activities were analyzed. At regional scale, the increases were statistically significant for autumn NDVI during fourteen periods, for growing season and summer NDVI during the most periods, and for spring only during the first four periods. The rates of NDVI increase in growing season and all seasons significantly decreased over fourteen periods. At pixel scale, areas with significant browning rapidly increased over fourteen periods for growing season and all seasons, and these areas were mainly concentrated in northern desert of Xinjiang. Vegetation growth in Xinjiang was regulated by both moisture and thermal conditions: the response of NDVI in spring and autumn was more sensitive to thermal factors, such as temperature and potential evapotranspiration, and correlations between NDVI and precipitation and between NDVI and humidity index were stronger in summer and growing season. Extensive use of fertilizers and expanded farmland irrigated area increased vegetation growth for cropland. However, the rapid increase in the proportion of cotton cultivation and use of drip irrigation may reduce spring NDVI in the part of farmlands. Trend analysis during the multiple nested time series may contribute to a better and deep understanding of NDVI dynamic and foreseeing changes in the future. Accordingly, NDVI in Xinjiang will continuously increase at regional scale and the areas showing significant browning will also furthermore grow.
|

/
| 〈 |
|
〉 |
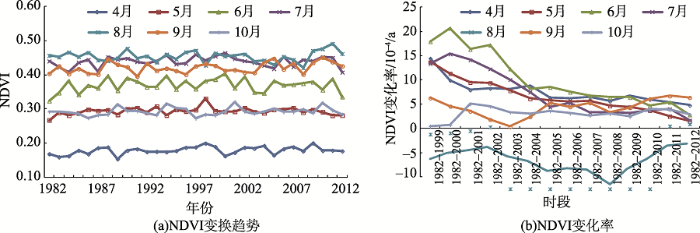
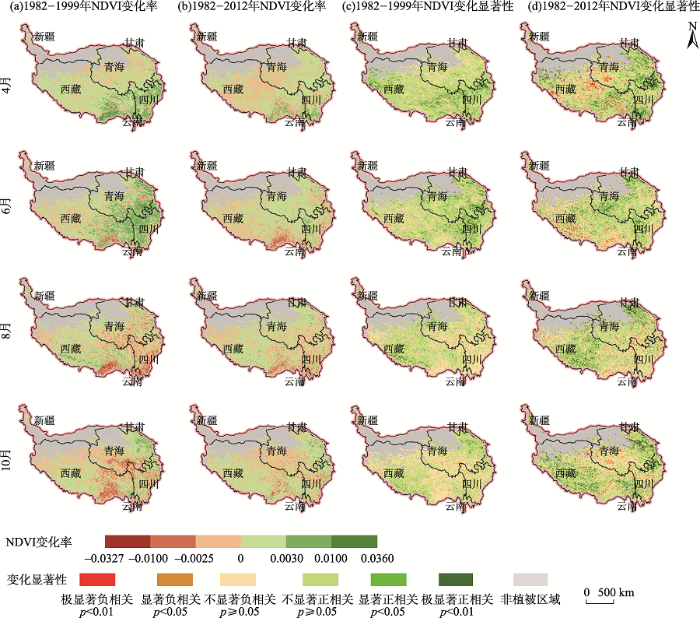
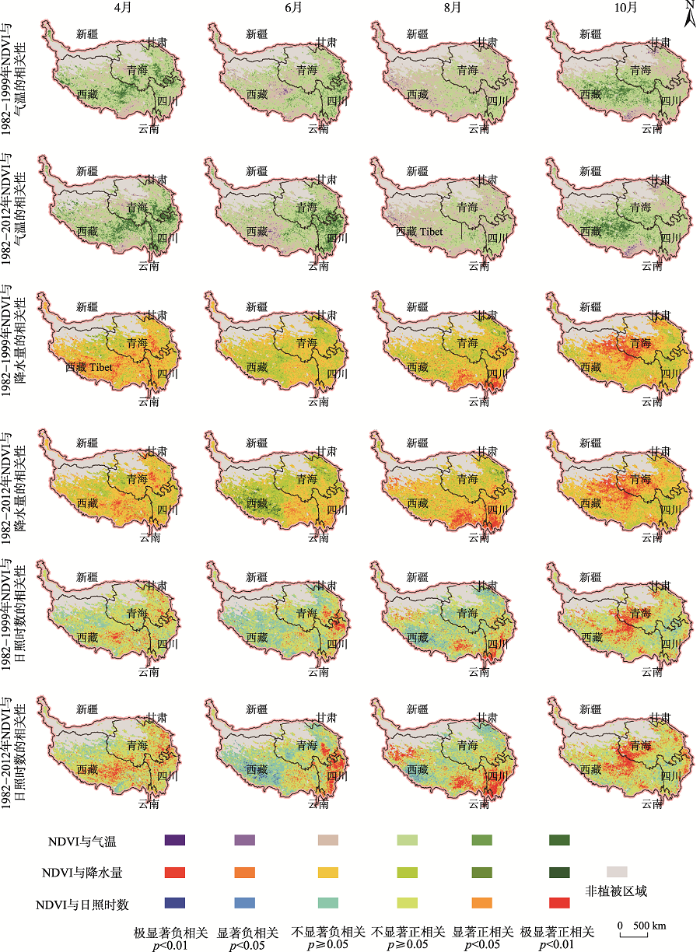