
Close×

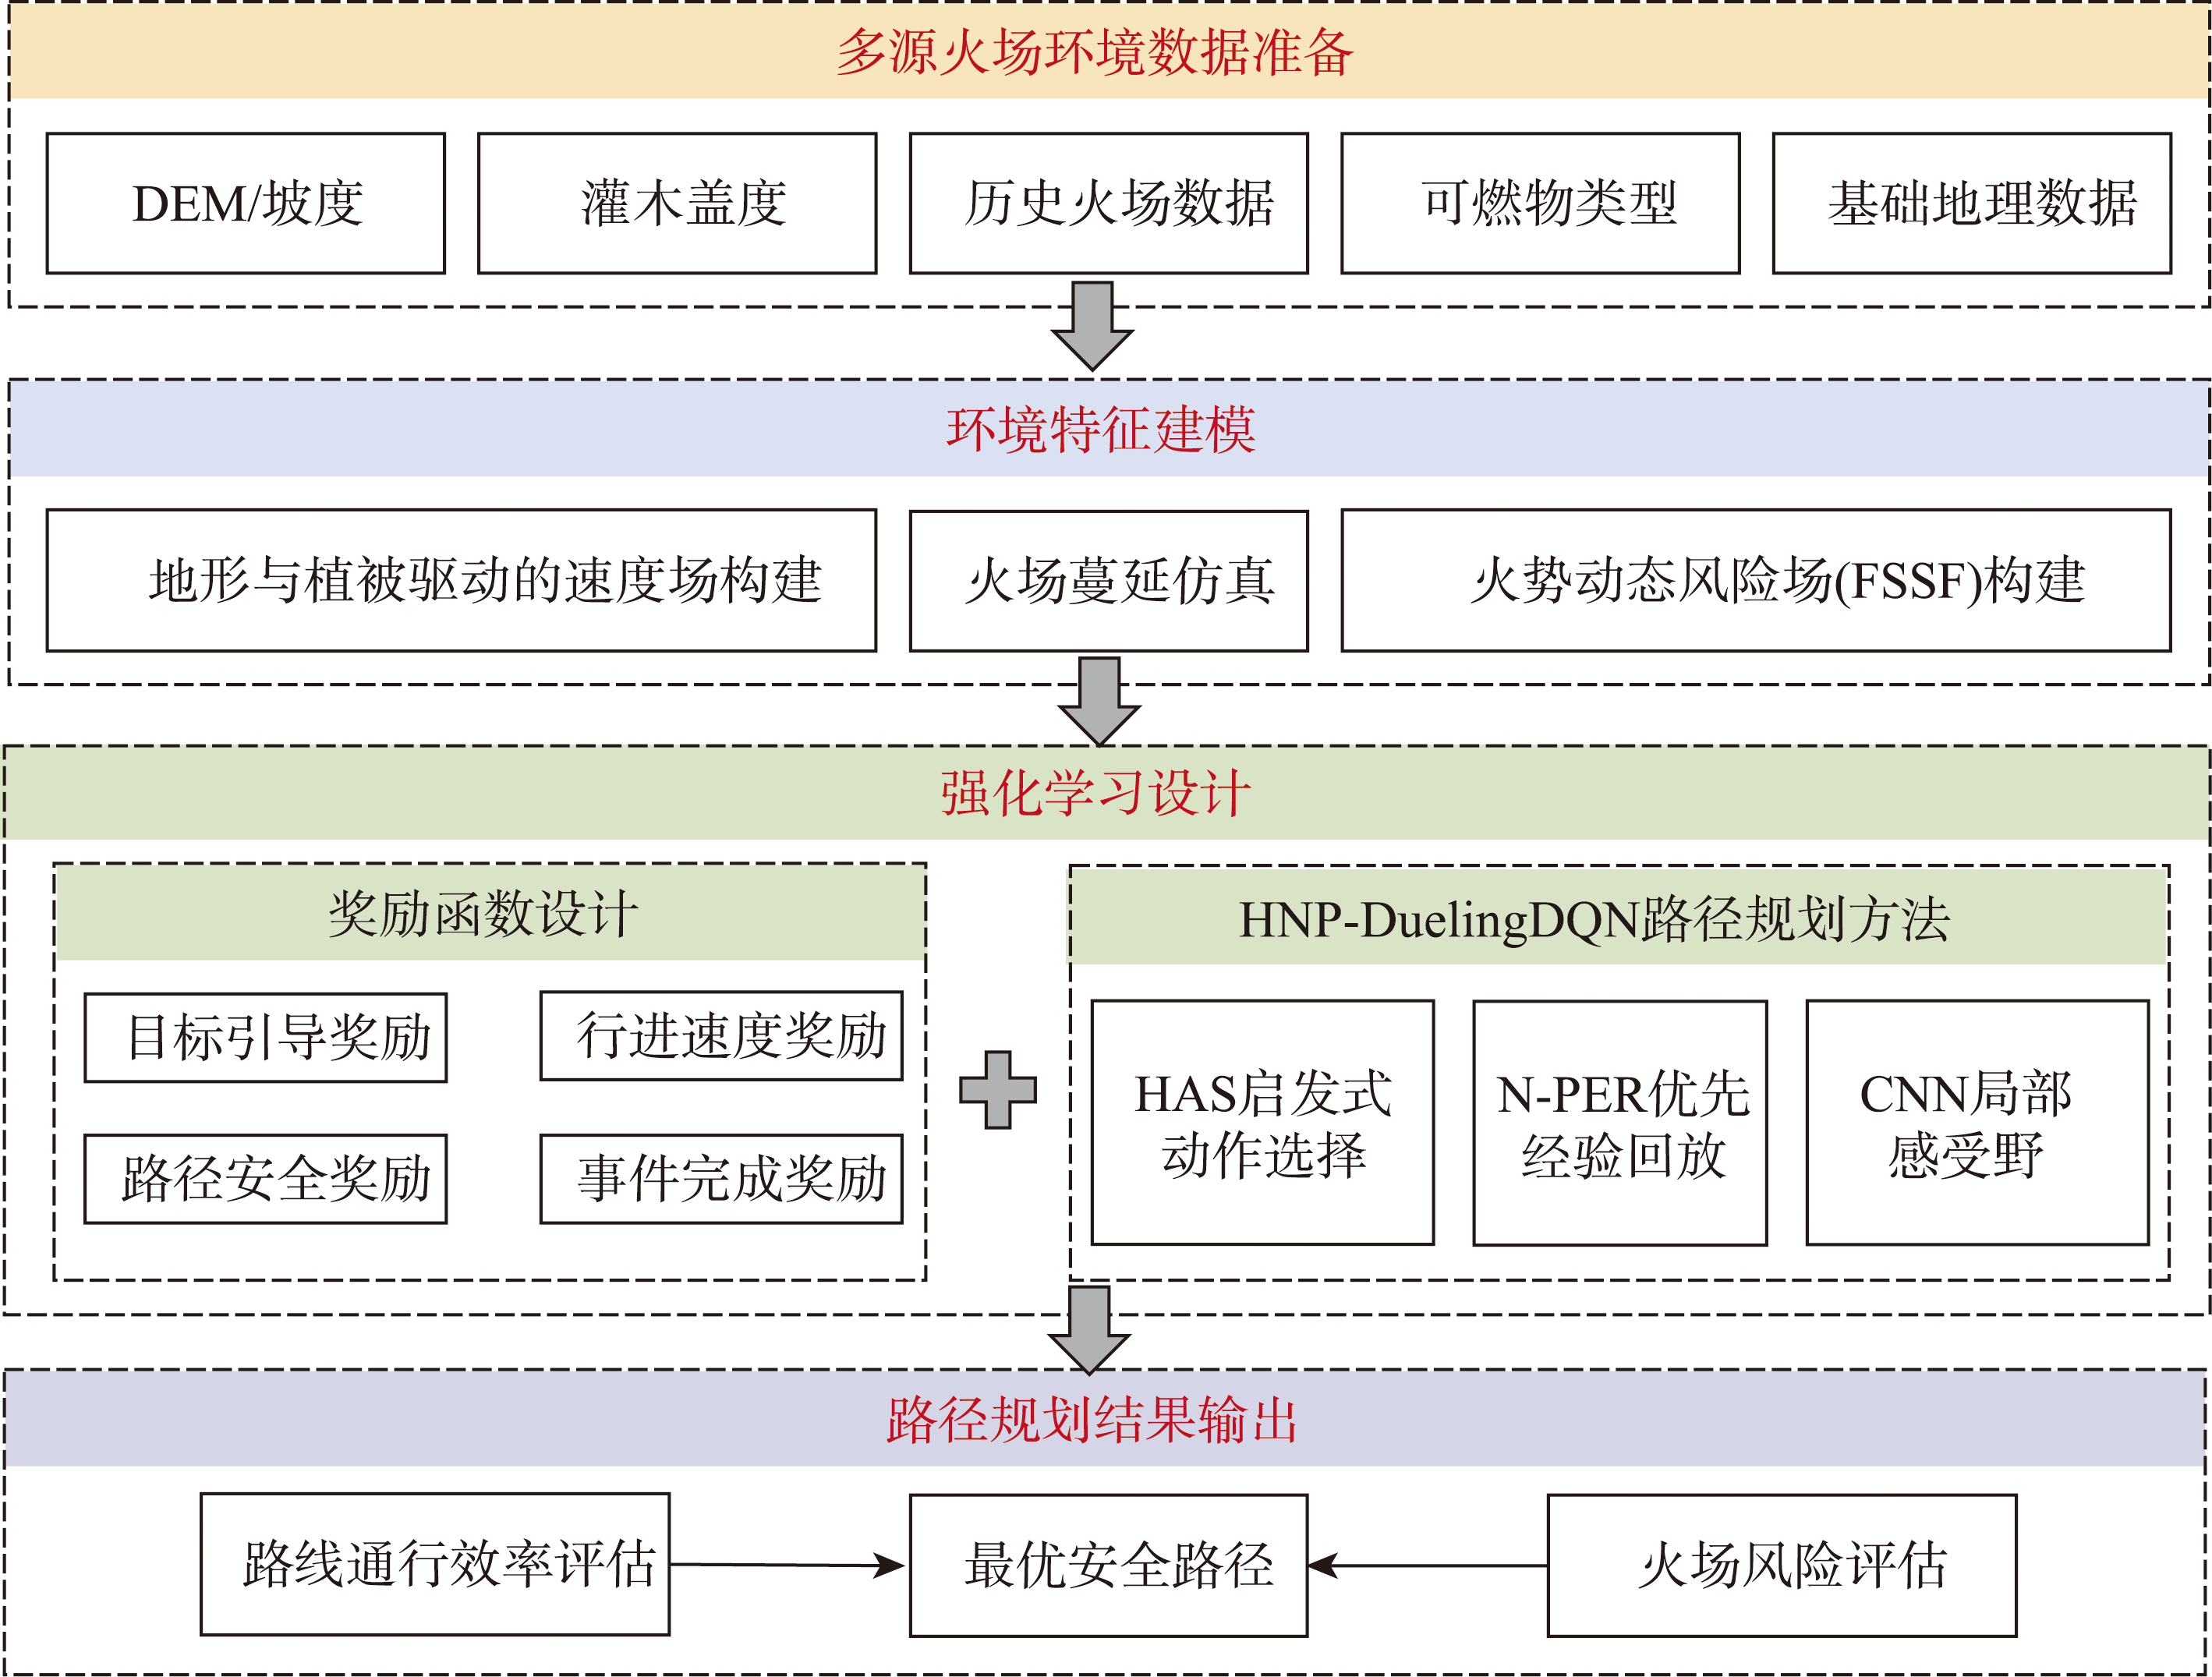
[Objectives] Forest fires are characterized by strong dynamics and multi-factor coupling. Complex terrain, vegetation resistance, and fire spread processes jointly affect personnel mobility, making traditional path planning methods based on static cost grids unable to simultaneously balance safety and efficiency. In mountainous wildfire scenarios, a path that is spatially feasible may still become unsafe when the fire perimeter evolves over time, which highlights the necessity of incorporating both traversability and fire-induced risk into a unified decision framework. Therefore, this study aims to develop a safety-aware and efficiency-oriented path planning method that can explicitly represent the coupled effects of terrain-vegetation constraints on human movement and the dynamic fire spread threat, and provide a practical decision-making basis for emergency rescue operations. [Methods] To address this challenge, this study develops a multi-source environmental modeling framework that integrates terrain slope, vegetation density, firefighter velocity fields, and fire spread risk, and proposes a safety-aware path planning method driven by environmental velocity fields for dynamic forest fire scenarios, termed HNP-DuelingDQN.A composite reward mechanism composed of goal guidance, traversal speed, safety factor, and task completion terms is designed to reduce sparse feedback and guide policy learning toward both efficient movement and risk avoidance. In addition, Heuristic Action Selection (HAS) and an N-PER experience replay structure are incorporated into the reinforcement learning framework to improve learning stability and efficiency. The overall design emphasizes that mobility is governed by the environmental velocity field, while safety is constrained by fire spread risk, enabling the agent to learn a balanced path planning policy under dynamic wildfire conditions. [Results] Simulation experiments based on real terrain data from Fujian Province and two representative forest fire cases within the past five years show that the proposed method exhibits stable advantages in both static and dynamic fire environments. Compared with HNP-DQN, A*, and ACO algorithms, the proposed method significantly improves overall path safety, reducing fire spread risk levels by approximately 17.4%~57.8% on average, increasing average traversal speed by 13.4%~28.3%, and reducing average path slope by 11.0%~29.9%. These results suggest that the learned policy consistently steers paths away from high-risk areas while preserving favorable traversability, and maintains reliable performance under time-varying fire conditions, which is essential for emergency scenarios requiring the simultaneous consideration of route feasibility and safety margins. [Conclusions] The results demonstrate that the proposed method achieves coordinated optimization of path safety and traversal efficiency, providing a more real-time, interpreter and quantitatively supported technical solution for emergency rescue path decision-making in mountainous forest fire scenarios. Overall, the proposed framework offers an operationally meaningful approach to wildfire-related path planning by coupling multi-source environmental traversability and fire-induced risk within a reinforcement learning decision process, and it can serve as a practical reference for safety-aware route selection under dynamic wildfire threats.
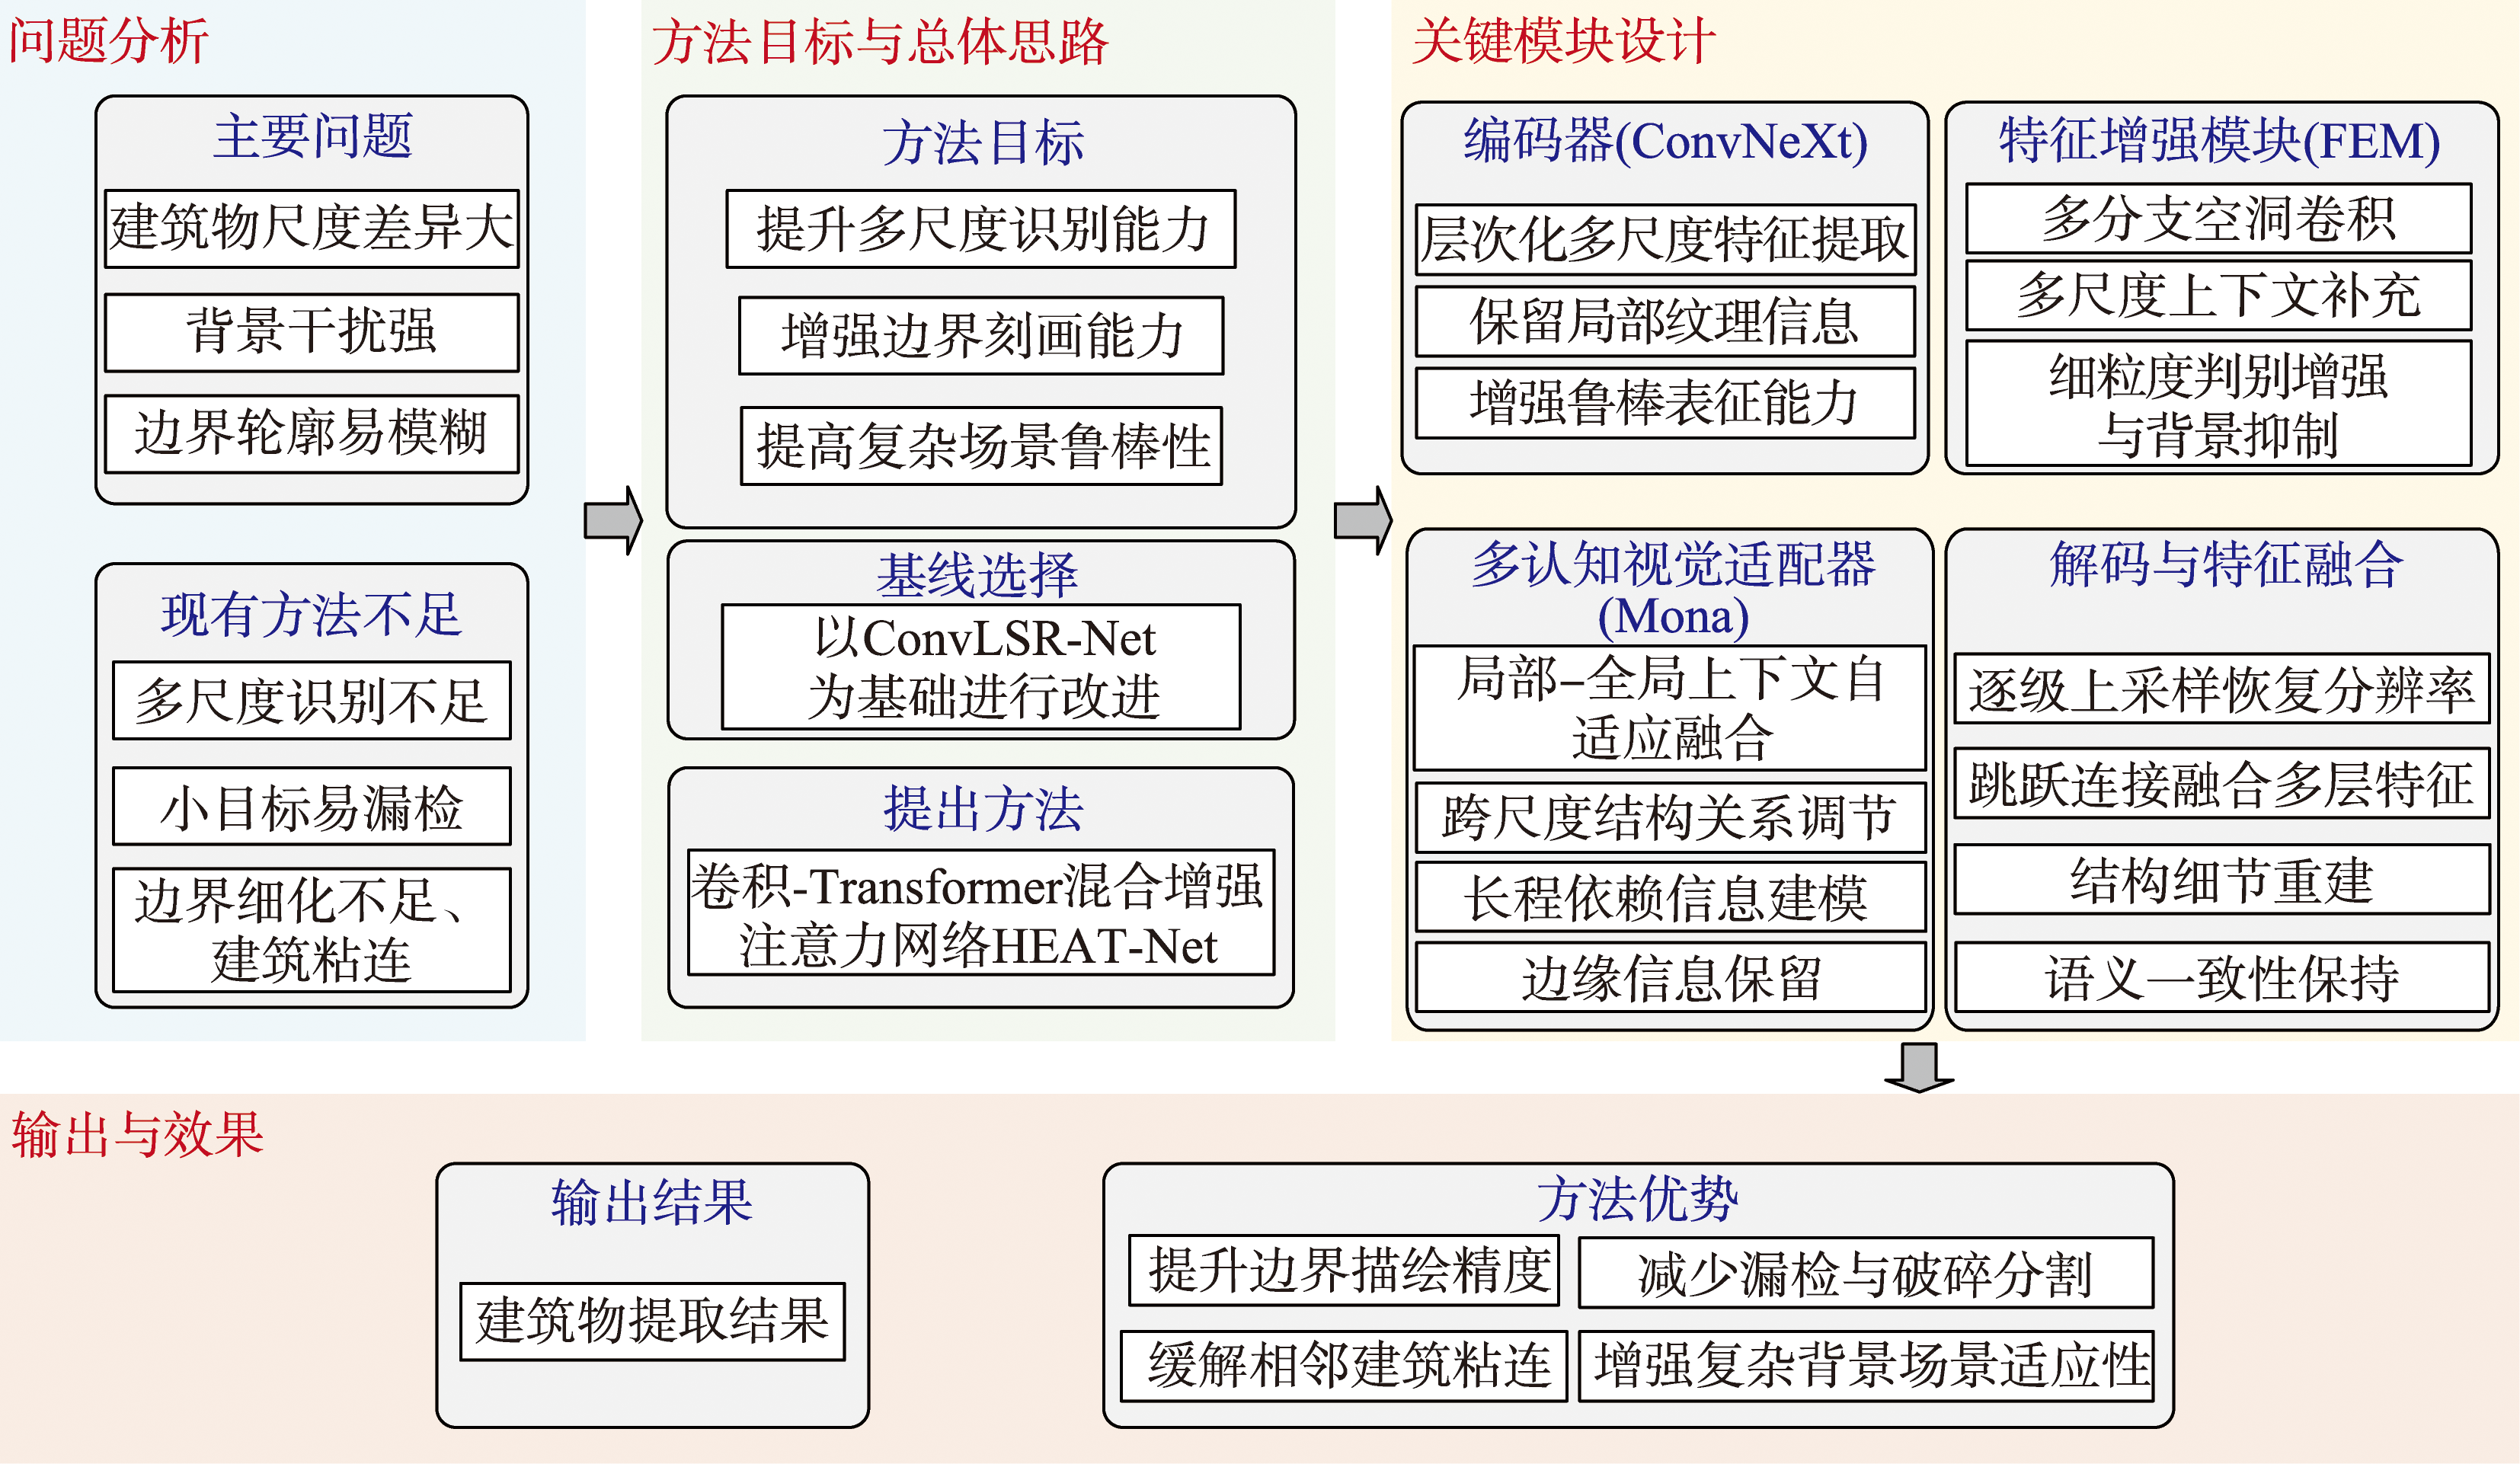
[Objectives] Due to the considerable variation in building sizes and shapes in urban environments, buildings within a single high-resolution remote sensing image often occur at diverse scales. This multi-scale distribution, together with background clutter and weak boundary contrast, frequently causes missed detections, fragmented masks, and inaccurate contours, which ultimately reduces extraction accuracy. To address the limitations of insufficient multi-scale target recognition and suboptimal boundary refinement in existing approaches, this study proposes HEAT-Net (Hybrid Enhanced Attention Transformer Network), a hybrid enhanced attention network that integrates convolution operations with a Transformer mechanism, aiming to simultaneously improve regional consistency and boundary delineation for more accurate building extraction. [Methods] Based on the ConvLSR-Net framework, the proposed model adopts ConvNeXt as the encoder to extract hierarchical multi-scale features, leveraging strong locality modeling and robust representation learning. The decoder progressively restores spatial resolution through upsampling and skip connections to recover structural details and preserve semantic consistency across stages. In addition, a feature enhancement module is designed to strengthen discriminative cues and suppress confusing background responses, alleviating the loss of fine-grained building details during the sampling process. Simultaneously, a multi-cognitive visual adapter module is introduced to adaptively fuse complementary local-global context, enabling the network to better capture long-range dependencies while retaining precise edge information. [Results] Comprehensive comparison experiments and ablation studies were conducted on both a self-constructed Xianyang dataset and the publicly available WHU dataset. Performance was evaluated using mIoU to measure region-level overlap and BIoU to specifically quantify contour quality, thereby jointly reflecting segmentation accuracy and boundary refinement capability. Our method achieves an mIoU of 0.951 2 and a BIoU of 0.632 2 on the WHU dataset, improving upon TransUNet by 1.14% and 9.23%, respectively. On the Xianyang dataset, it attains an mIoU of 0.913 1 and a BIoU of 0.795 0, outperforming TransUNet by 3.48% and 12.58%, respectively. Ablation results demonstrate that each proposed module contributes to performance gains, and the improvement is particularly evident in boundary-related metrics, indicating more accurate contour recovery and reduced edge ambiguity. Visual inspection further suggests that the proposed network can better preserve building outlines and reduce adhesion between adjacent buildings, especially for small-scale targets and complex urban textures. [Conclusions] Experimental results demonstrate that the proposed hybrid enhanced-attention network achieves consistent performance gains on both the WHU and Xianyang datasets, with more pronounced improvements observed on the Xianyang dataset. This indicates that the method exhibits superior boundary preservation and multi-scale target recognition capabilities in complex backgrounds and scenarios featuring numerous small buildings, providing a practical and effective solution for high-resolution remote sensing building extraction.
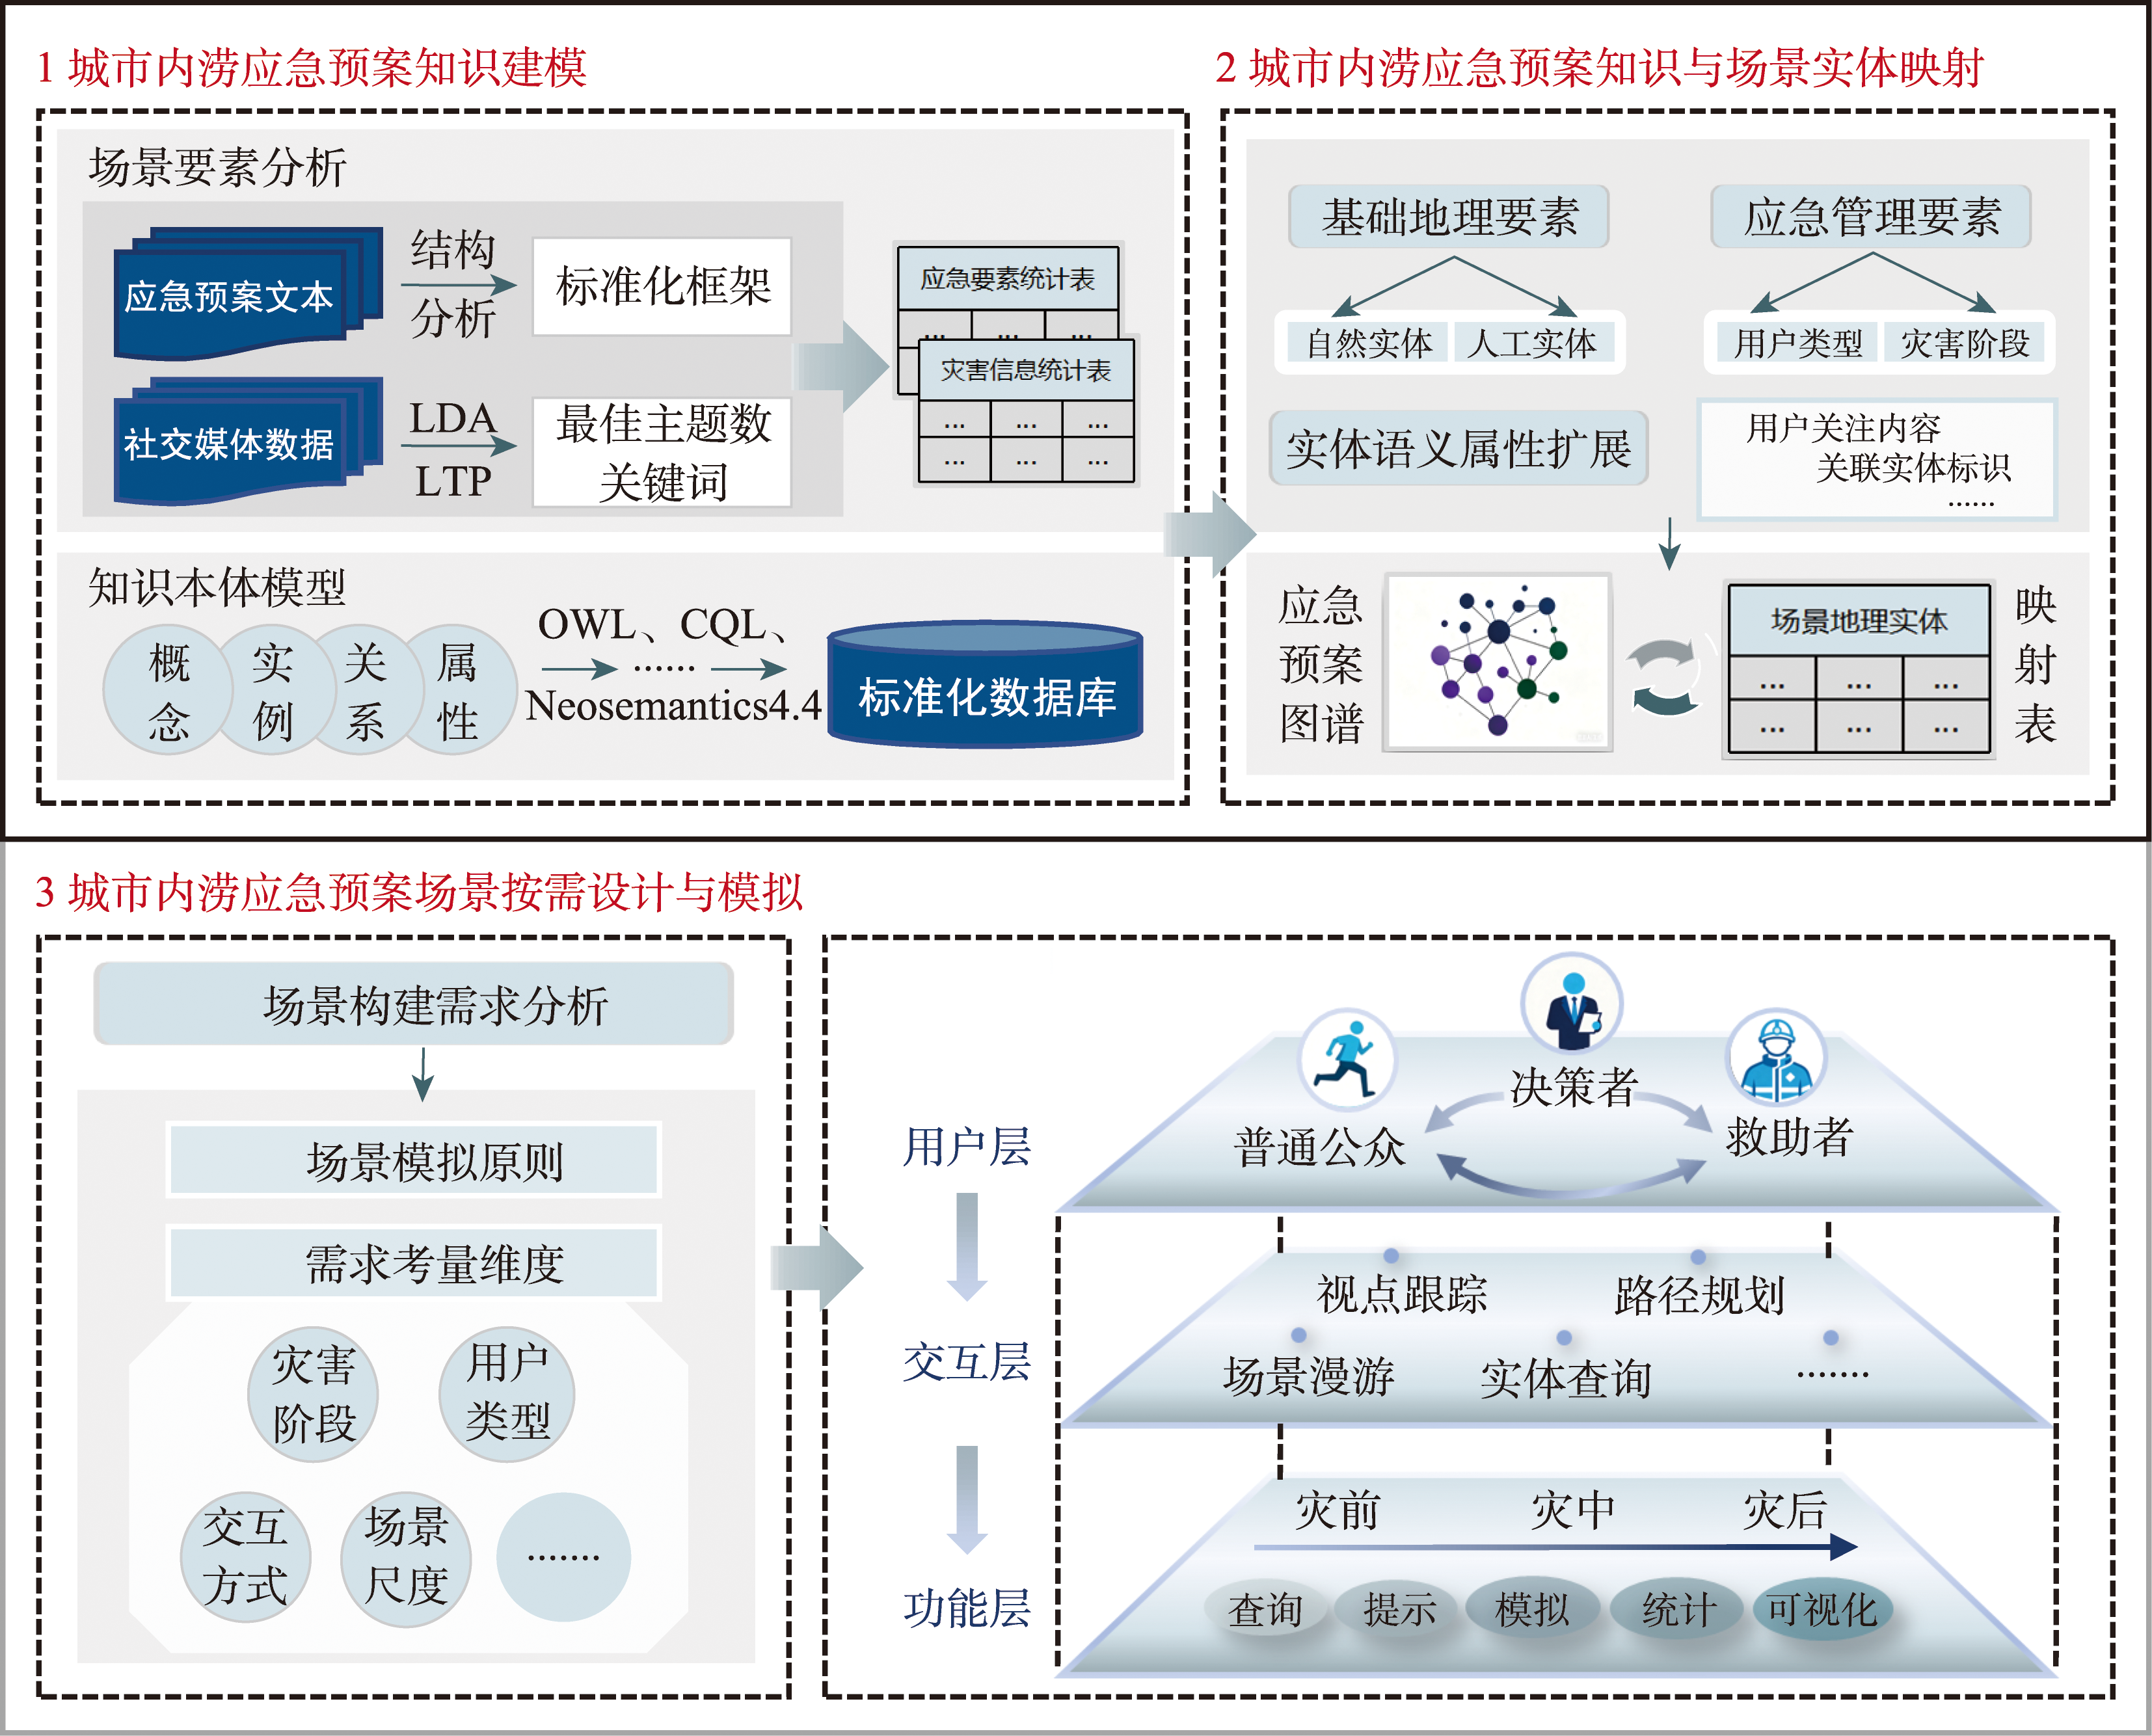
[Objectives] With the rapid development of information technology and artificial intelligence, research on the expression of emergency plan knowledge based on knowledge graphs and computer scenario simulation is gaining momentum. Addressing the issues that current urban waterlogging emergency plans cannot dynamically match full-cycle scenario simulations and fail to meet the dynamic emergency needs of diverse users, [Methods] this paper proposes a scenario simulation method for urban waterlogging emergencies based on plan knowledge mapping. By constructing a knowledge graph of urban waterlogging emergency plans covering all disaster stages, the interactive mapping method between emergency knowledge and scenario elements is explored. On this basis, the on-demand design and simulation of urban waterlogging emergency scenarios for multiple types of users are carried out. [Results] Taking the “23·7” extreme rainstorm waterlogging incident in Fengtai District, Beijing as a case study, the LDA model was utilized to mine 6 categories of high-frequency public opinion topics from over 160 000 social media data entries, and a knowledge-element mapping table containing 12 types of fundamental geographic scenarios and 39 types of emergency management scenarios was constructed. Based on this method, a prototype system was developed and quantitatively validated through 115 valid questionnaires. The results show that the average scores of the system in the three dimensions of interaction convenience, operational efficiency, and functional completeness are 4.06, 4.09, and 4.07 (out of 5), all reaching a satisfactory level. [Conclusions] This study completes the full-process experimental verification, ranging from knowledge modeling and evaluation of emergency plans, scenario element analysis and entity mapping, to the on-demand simulation of full-cycle waterlogging scenarios for multiple types of users. The quantitative evaluation demonstrates that this method can effectively satisfy the dynamic emergency decision-making requirements of multiple types of users throughout the full cycle of urban waterlogging.
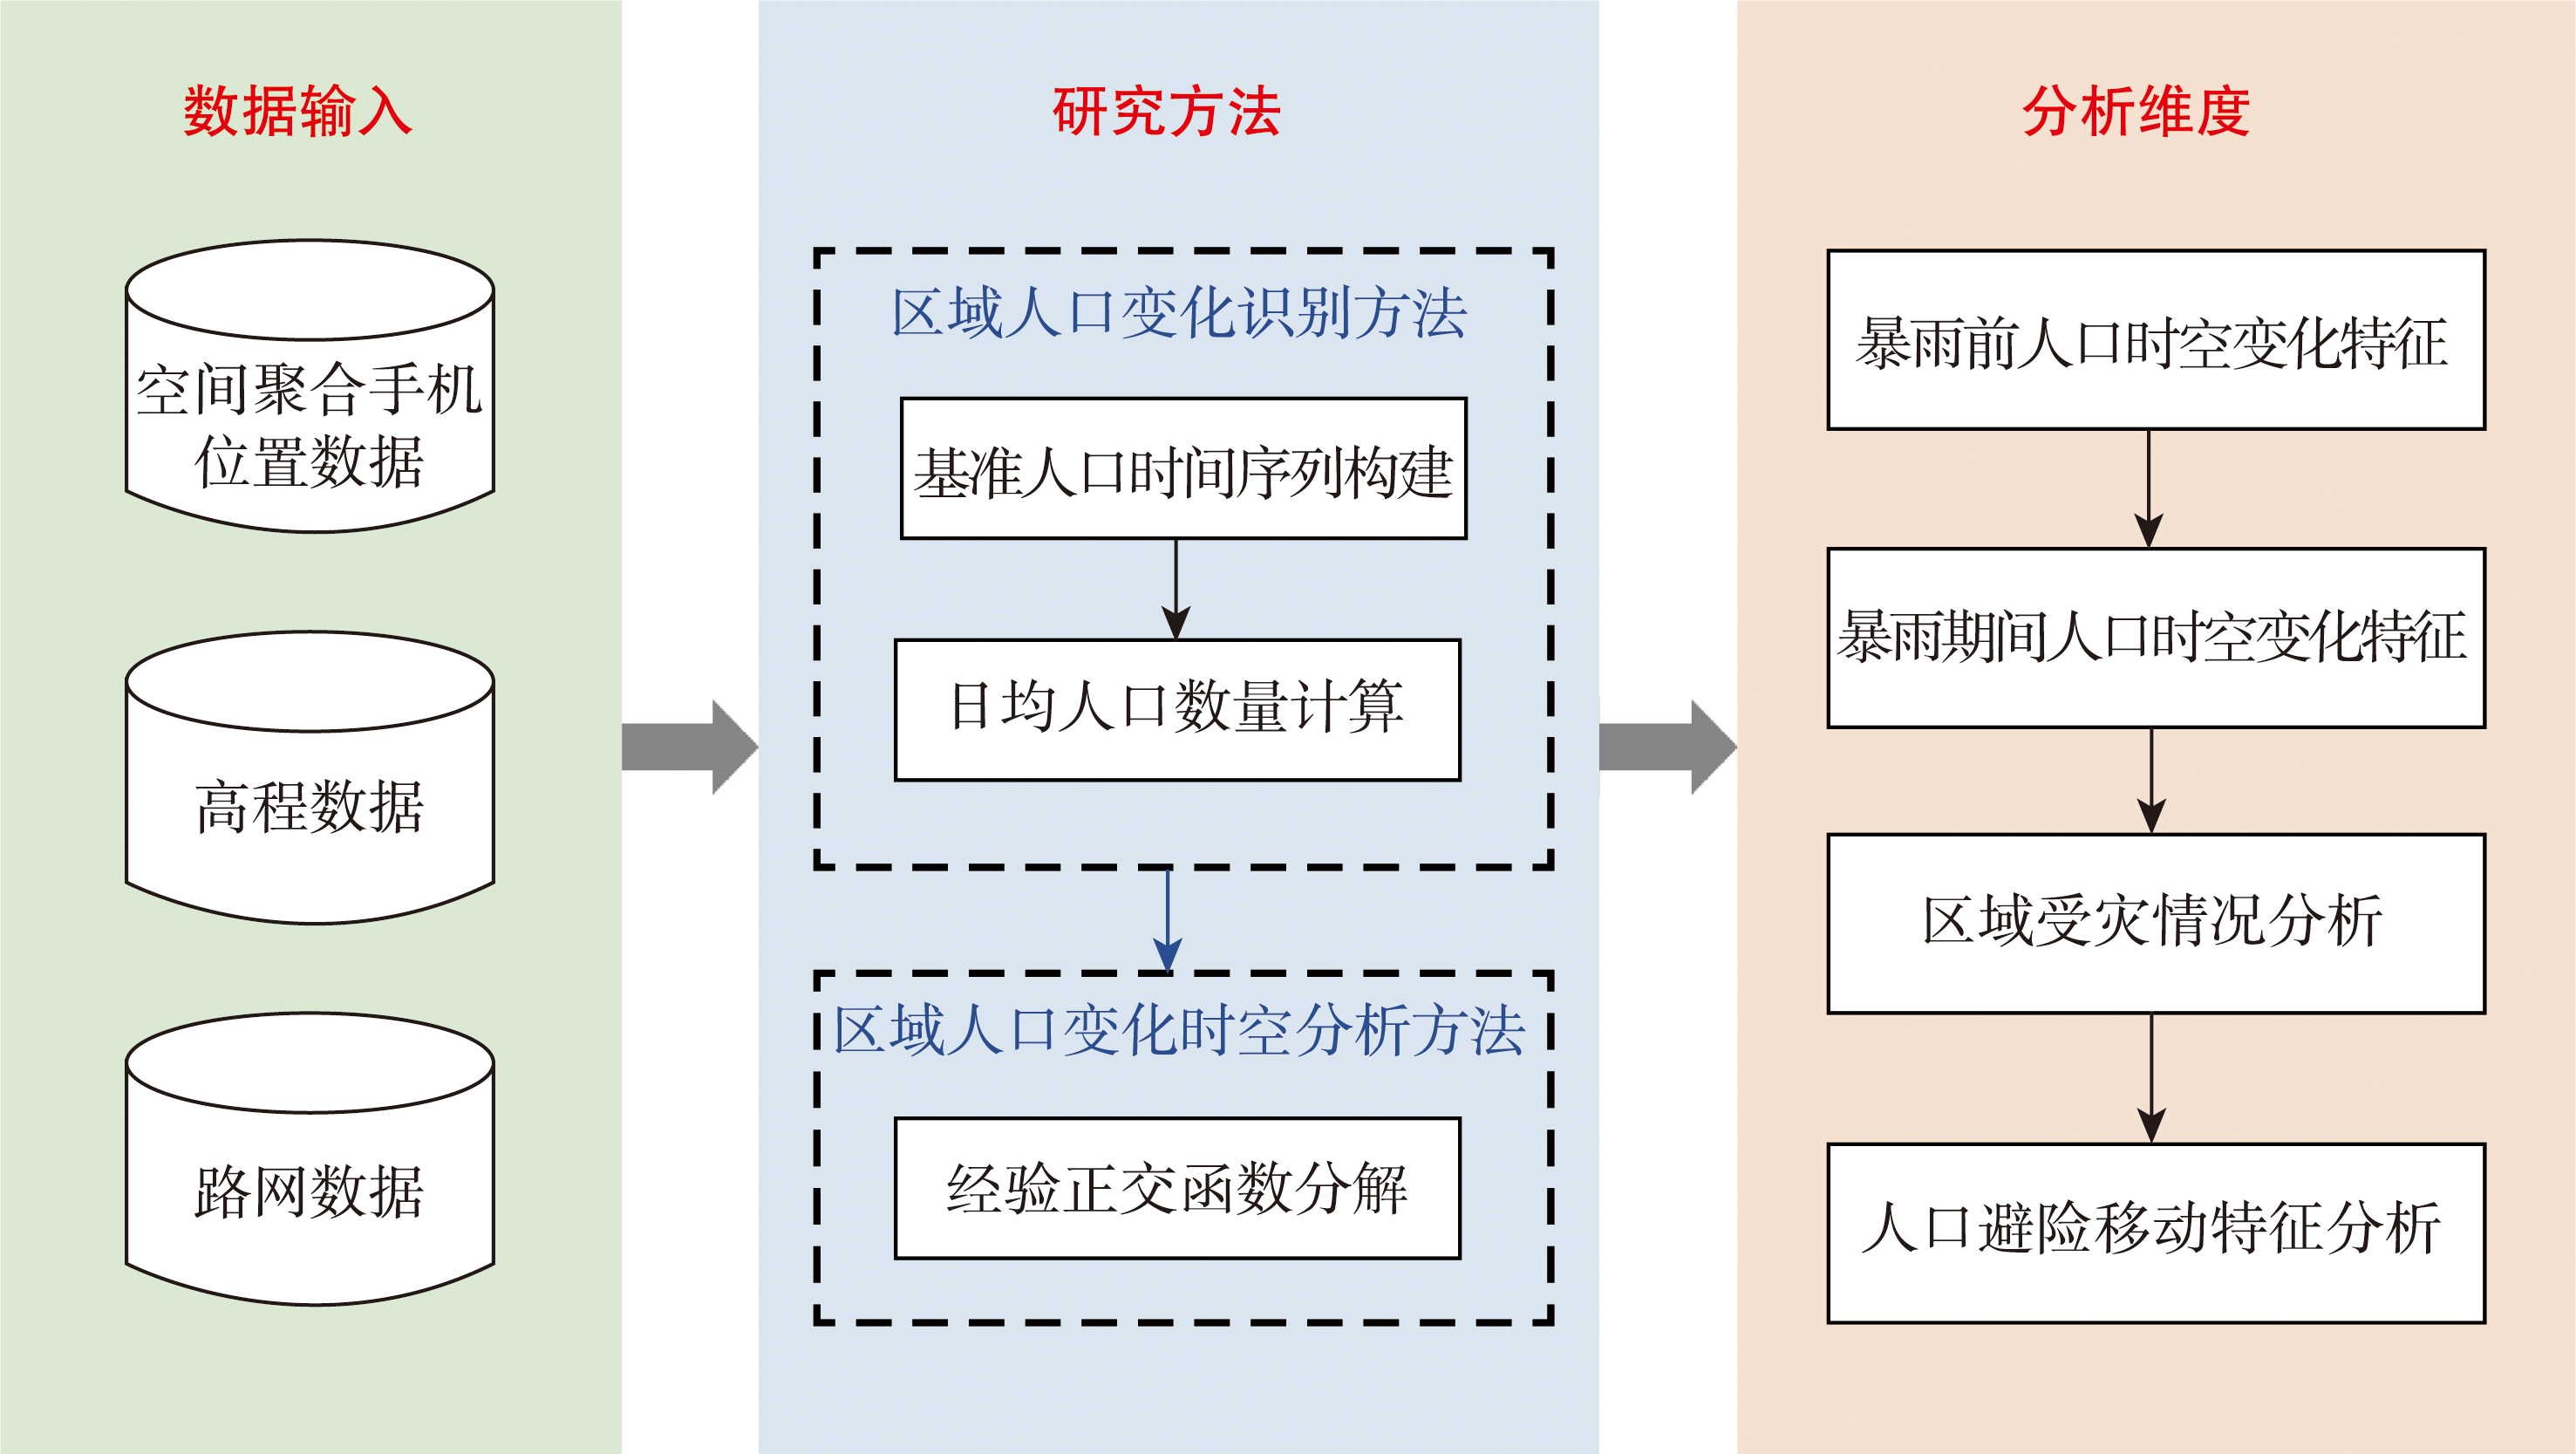
[Objectives] Individual-level mobile phone location data can effectively assess the mobility patterns of affected populations and disaster-induced losses, thus holding significant value in disaster research. However, constrained by domestic privacy protection policies, most current studies can only access spatially aggregated mobile phone location data, specifically, hourly counts of mobile phone signals at the grid scale (with a spatial resolution of 1 km × 1 km). How to utilize such data-which lacks individual mobility information-to reveal the movement characteristics of affected populations and assess disaster losses has become an urgent need to fully exploit mobile signaling data in disaster evaluation. [Methods] Our study applies the Empirical Orthogonal Function (EOF) decomposition method to grid-scale spatially aggregated mobile phone location data, taking the Mentougou District in Beijing during the 2023 Beijing-Tianjin-Hebei rainstorm as a case study to conduct a disaster population response analysis. Our method overcomes the unavailability of individual trajectory information, effectively extracting the dominant anomalous mobility patterns of the affected population under extreme disaster scenarios from complex spatio-temporal aggregated data. Furthermore, it attempts to objectively evaluate infrastructure damage based on the duration of data interruptions. [Results] The findings fully demonstrate the advantages of the EOF method in disaster loss assessment and population dynamic analysis. First, the EOF approach can accurately characterize the evolution of population aggregation and evacuation within the region across different disaster stages. Its first mode captures the anomalous fluctuation trends of the overall regional population during the disaster, while the second mode extracts the internal spatial differentiation of population changes, intuitively revealing the shelter-seeking mobility patterns of affected groups transferring from low-elevation risk areas to higher mountainous terrains. Additionally, by capturing prolonged "zero-population" anomalies in the spatially aggregated data, our method relatively precisely pinpoints the blind spots where communication and power infrastructures suffered severe damage. [Conclusions] Overall, our study validates the immense application potential of spatially aggregated mobile phone location data in disaster emergency response and loss assessment under privacy protection constraints. The proposed analytical method can, to a certain extent, compensate for the data limitations caused by the lack of individual trajectories, providing a reference for population dynamic monitoring in extreme disaster scenarios.
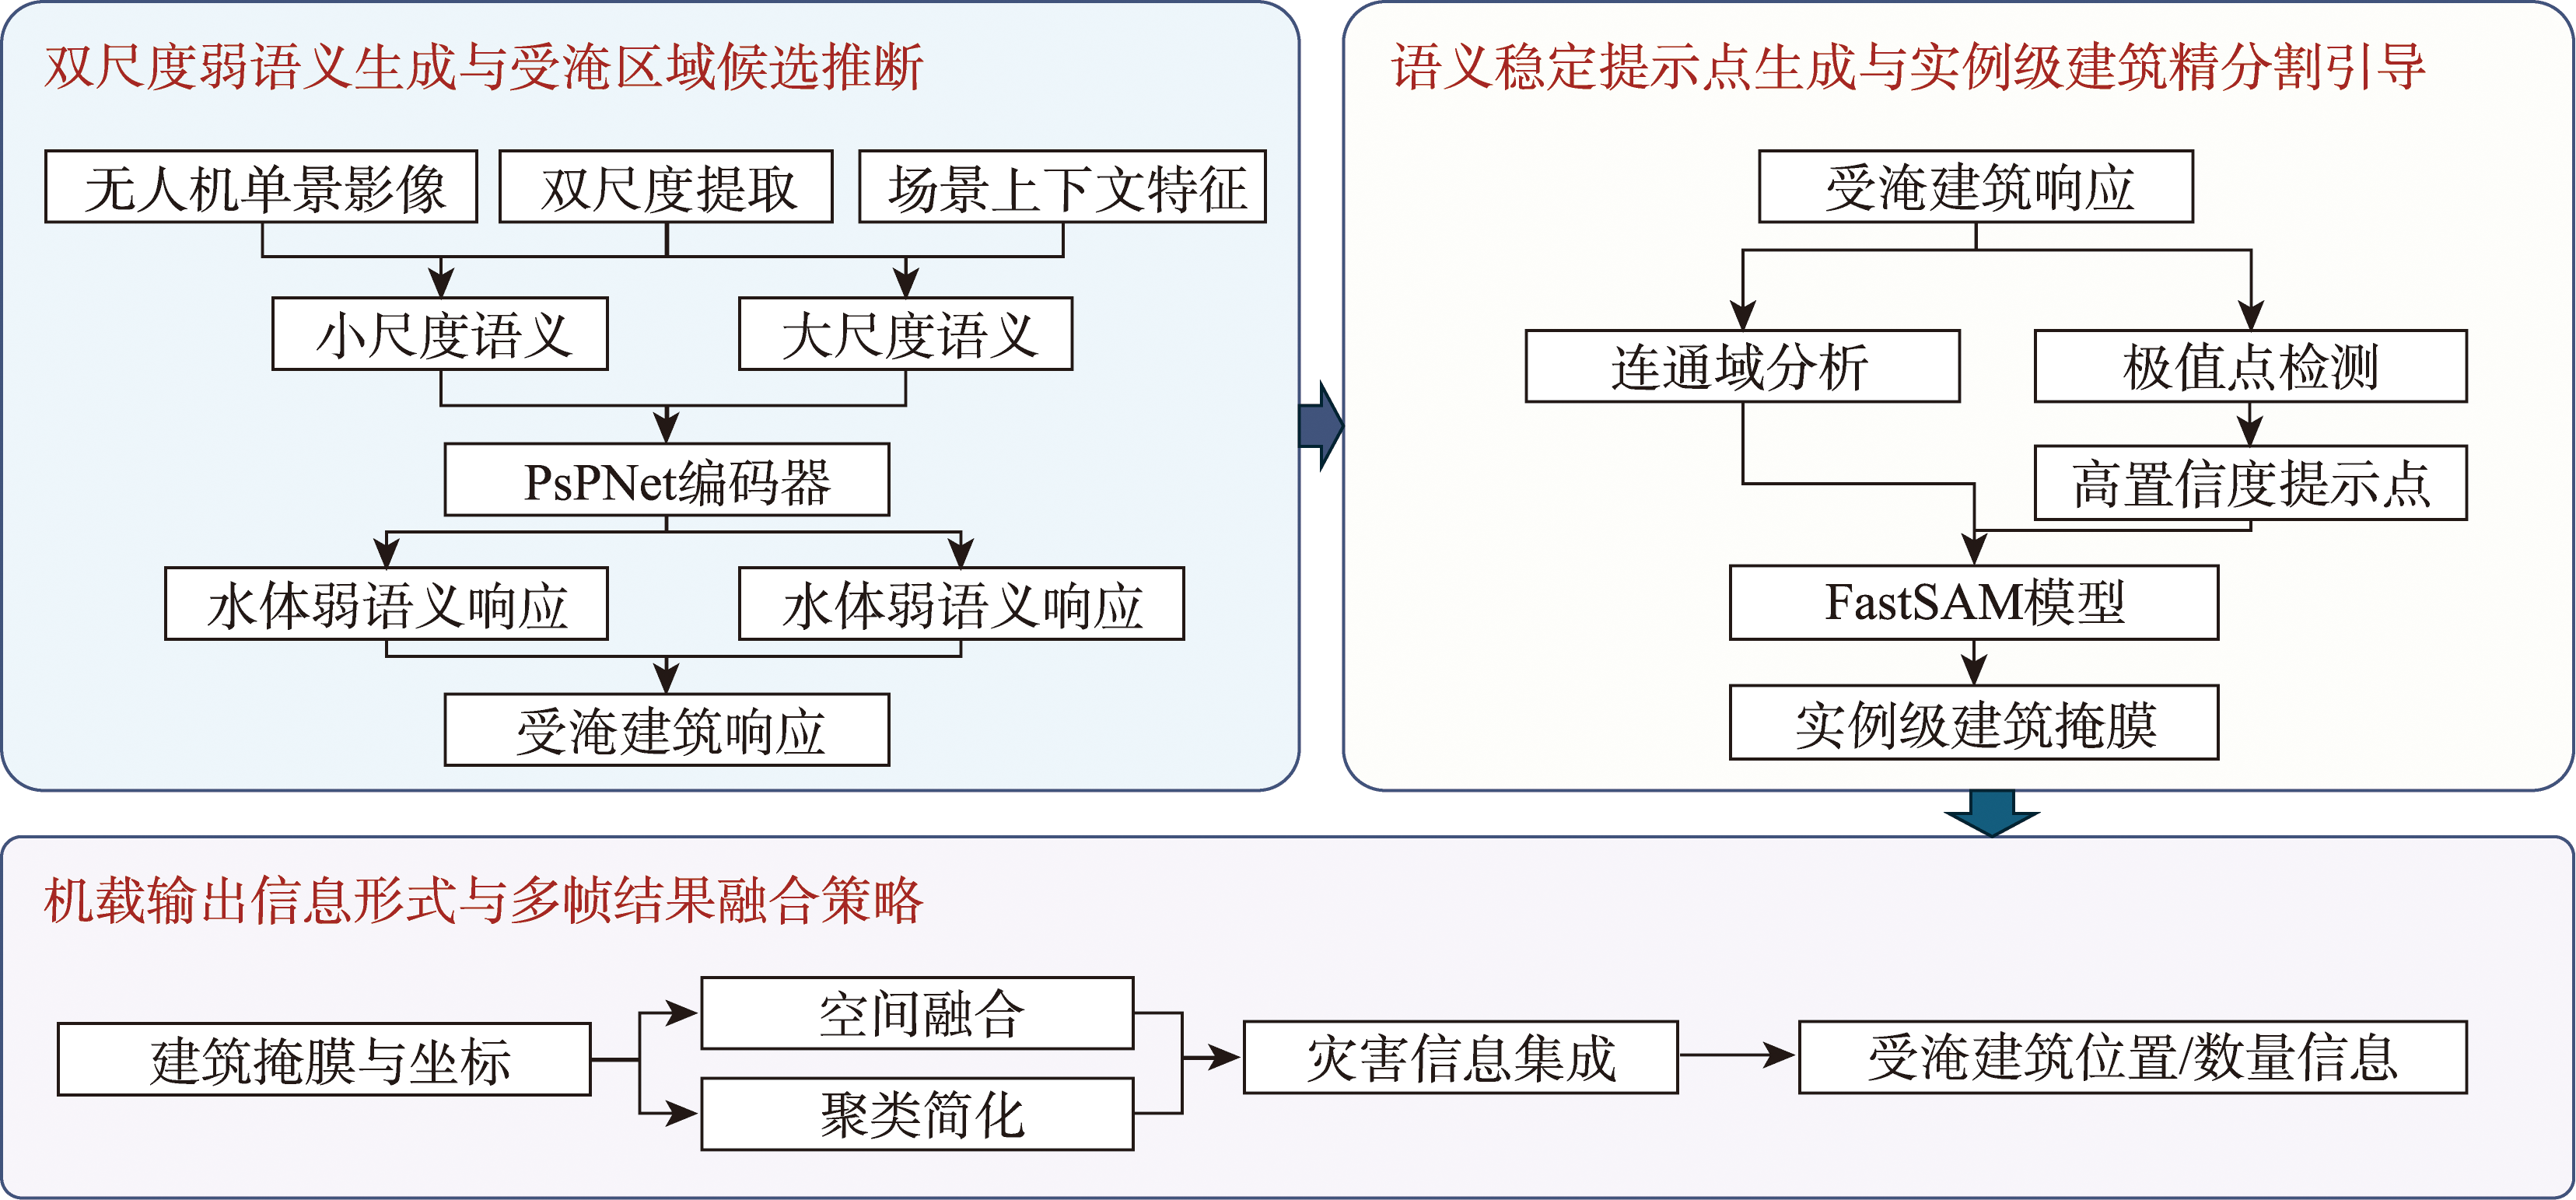
[Objectives] Low-altitude remote sensing using unmanned aerial vehicles (UAVs), characterized by high mobility, rapid response, and high spatial resolution, has become an important means for acquiring on-site information during flood and other emergency disasters. Buildings directly accommodate population and infrastructure, and their inundation status can intuitively reflect the spatial extent and severity of disasters, providing critical support for damage assessment and rescue decision-making. However, existing flooded-building detection methods typically rely on high-precision segmentation and spatial overlay analysis performed off-board, which requires image transmission and is sensitive to segmentation stability, making them unsuitable for time-critical emergency response. In addition, complex flood backgrounds—such as water reflections, shadows, and domain shifts—often lead to fragmented boundaries and missing structures in lightweight onboard segmentation results, limiting the feasibility of direct inundation assessment from single images. To address these challenges, this study proposes FloodSAM-Duo (Dual-scale Prompt-guided SAM for Flooded Building Extraction) for lightweight object-level detection of flooded buildings on UAV platforms. [Methods] The proposed method employs a Pyramid Scene Parsing Network (PSPNet) to extract weak semantic responses of buildings and water at dual scales to infer flooded building candidates. Semantic-stable prompt points are then automatically generated within candidate regions to guide a lightweight instance segmentation model, FastSAM, to perform local fine segmentation, producing structurally complete and boundary-consistent building masks. This forms a collaborative inference mechanism that integrates weak semantic reasoning with prompt-guided fine segmentation. Furthermore, segmentation outputs are converted into structured disaster information that can be transmitted and aggregated, thereby reducing the reliance on continuous high-resolution image transmission. This design enables the system to directly generate object-level inundation results from single UAV images while maintaining a lightweight computational structure suitable for onboard deployment. [Results] Experiments conducted on UAV flood imagery from Suizhou and Xinxiang, China, collected over the past two years, demonstrate that the proposed method significantly outperforms comparative approaches in building contour completeness and inundation detection reliability. Specifically, compared with representative lightweight models such as ENet, YOLOv8n-seg and RT-DETR Tiny, FloodSAM-Duo improves the F1-score by approximately 18% and the mIoU by about 17%, while achieving higher boundary consistency measured by the BF1 metric. Moreover, it achieves a single-frame inference latency of 15~20 ms on a Jetson Xavier NX platform, meeting the requirements for near-real-time onboard disaster information acquisition. [Conclusions FloodSAM-Duo enables direct generation of object-level flooded-building information from single UAV images while reducing dependence on high-precision segmentation and off-board processing. The method provides a lightweight and efficient solution for rapid building damage assessment in flood emergency monitoring. By integrating weak semantic reasoning with prompt-guided instance segmentation, the proposed framework offers a practical strategy for improving the timeliness and reliability of UAV-based disaster monitoring systems.
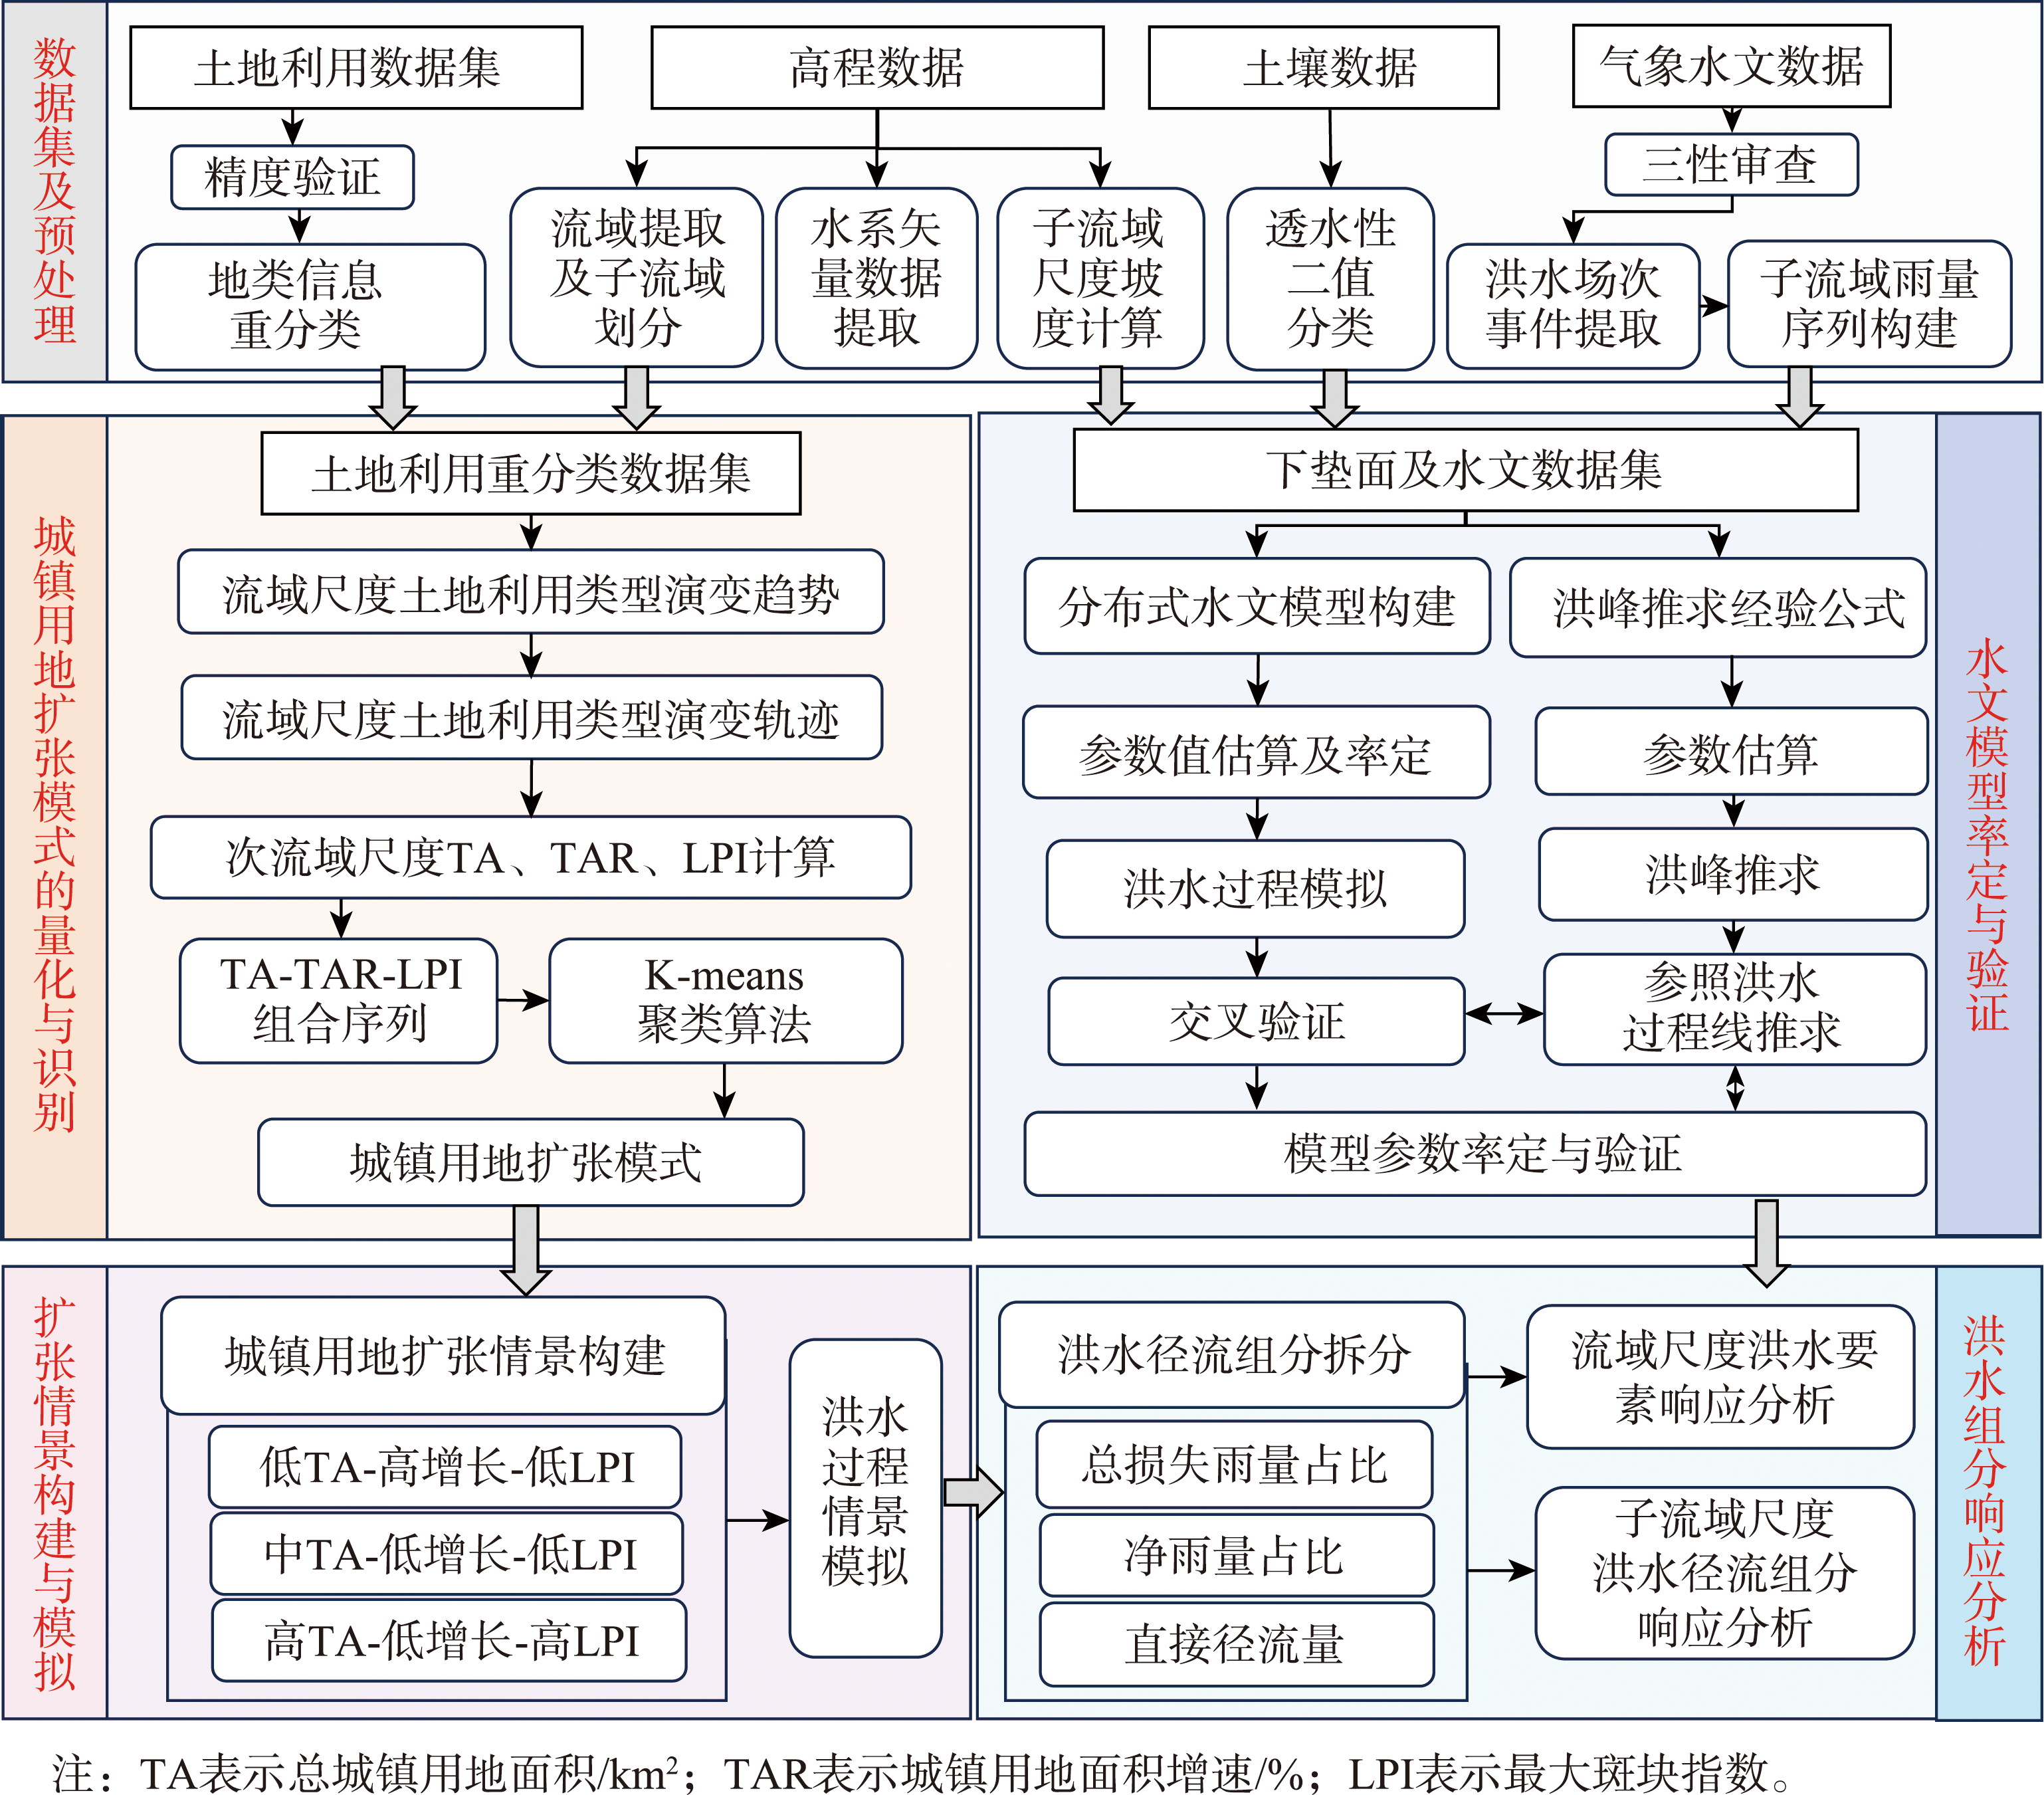
[Objectives] Climate change and the urbanization process are exacerbating the frequency and intensity of extreme hydrological events, thereby intensifying the pressure of flood control and drainage infrastructure, especially in small and medium-sized river basins. In this context, a clear understanding of how distinct urban land expansion patterns influence flood mechanisms is critical for developing resilient water management strategies. However, existing research often lacks a systematic, quantifiable approach to analyzing the response relationship between urban expansion patterns and hydrological processes. To address this gap, [Methods] this study proposed an innovative flood component response analysis method based on landscape pattern indices clustering and process-based flood mechanism modeling. The approach begins by compiling and preprocessing multi-source spatiotemporal data, including land use, terrain, soil, and hydrometeorological datasets. Through landscape pattern indices clustering applied at the sub-basin scale, the method identifies and classifies urban expansion into distinct typologies. Subsequently, a distributed hydrological model is calibrated and validated using a cross-validation framework. Based on the identified expansion patterns, multiple urban development scenarios are constructed to simulate flood processes under varying land use configurations. The simulated flood events are then disaggregated into key runoff components—such as loss volume, excess rainfall and direct runoff—enabling a detailed multi-scale analysis. This allows for the quantitative assessment of flood characteristics at the basin level and the contribution of different runoff components at the sub-basin level. [Results] Application of the method to the Huangtianfan Basin demonstrates its effectiveness in differentiating the hydrological impacts of diverse urban expansion patterns. Results indicate that urban land increased from 8% to 14% between 2006 and 2021, primarily due to the conversion of cultivated land. The expansion patterns were successfully characterized using a combination of landscape indices (TA, TAR, and LPI). It was found that higher urbanization levels, particularly those following a high-proportion, low-growth, and clustered expansion pattern, are associated with significantly increased direct runoff volumes. Moreover, under heavy rainfall conditions, the clustered expansion of urban land amplifies runoff generation more markedly than other patterns, highlighting the interaction between spatial configuration and rainfall intensity. These findings underscore the utility of the proposed framework in capturing nuanced, pattern-specific flood responses. [Conclusions] The integrated analytical framework developed in this study systematically quantifies the effects of urban land expansion patterns on flood runoff components. By combining landscape ecology with hydrological modeling, it provides a replicable methodology for assessing flood risks in rapidly urbanizing basins. The approach not only advances the theoretical understanding of landscape-hydrology interactions but also offers practical insights for flood-sensitive land use planning, infrastructure design, and adaptive water governance in small and medium-sized basins under changing environmental conditions.
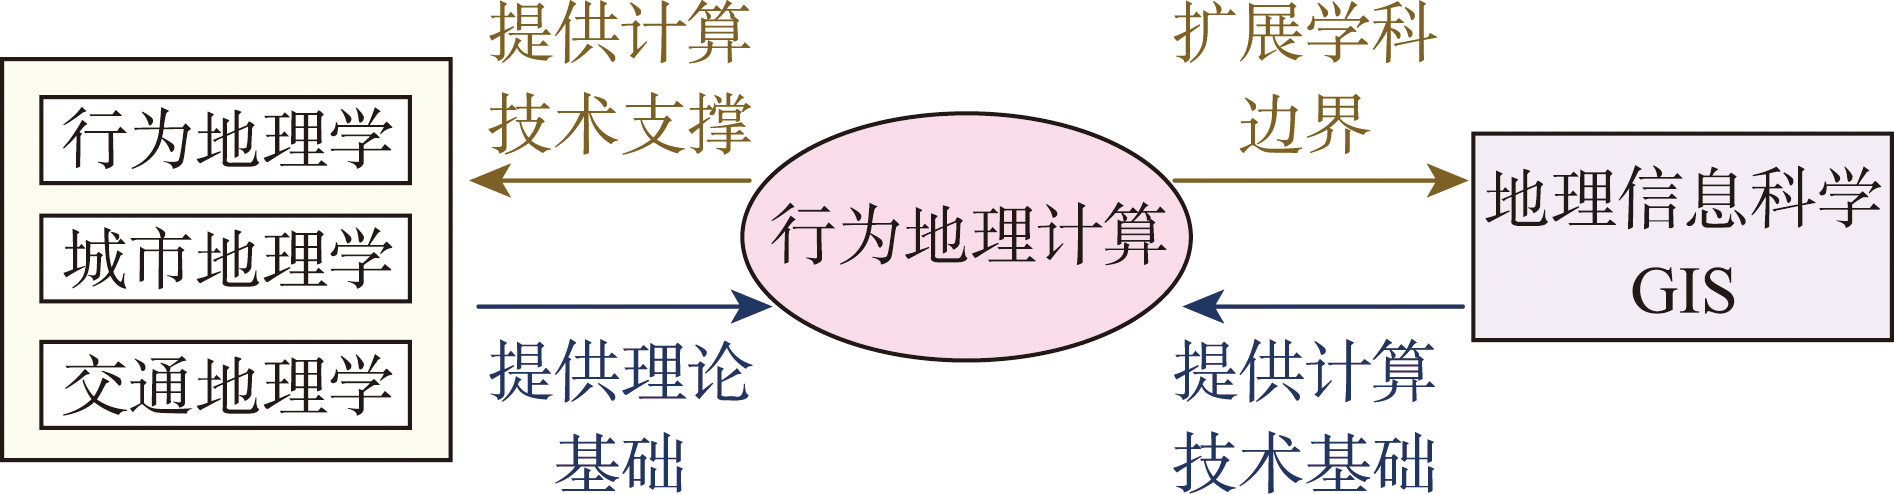
[Objectives] The national strategy of "people-oriented new urbanization" places urgent demands on precisely understanding urban residents' space-time behavior patterns, driving a paradigm shift in Geographical Information Science (GIS) from a static, "place-centric" analytical framework towards a dynamic, "people-centric" one. This paper aims to address this strategic demand by establishing a theoretical and methodological framework, named "Behavioral Geocomputation". [Analysis] It first defines the core research object as continuous and proactive human spatiotemporal behavior with multi-dimensional semantic features in physical-virtual hybrid spaces. Building upon this, the paper establishes a comprehensive theoretical framework. Furthermore, by synthesizing the author's research practices, it reviews frontier advancements in key areas including spatiotemporal data modeling, behavioral object processing and mining, space-time behavior simulation, and people-centered urban system evaluation and optimization. These advancements of behavioral geocomputation thereby validates the feasibility and academic value of the proposed research domain. [Prospect] Finally, the paper envisions the broad prospects of behavioral geocomputation in integrating GeoAI, empowering related disciplines, and serving people-centered urban planning and management.
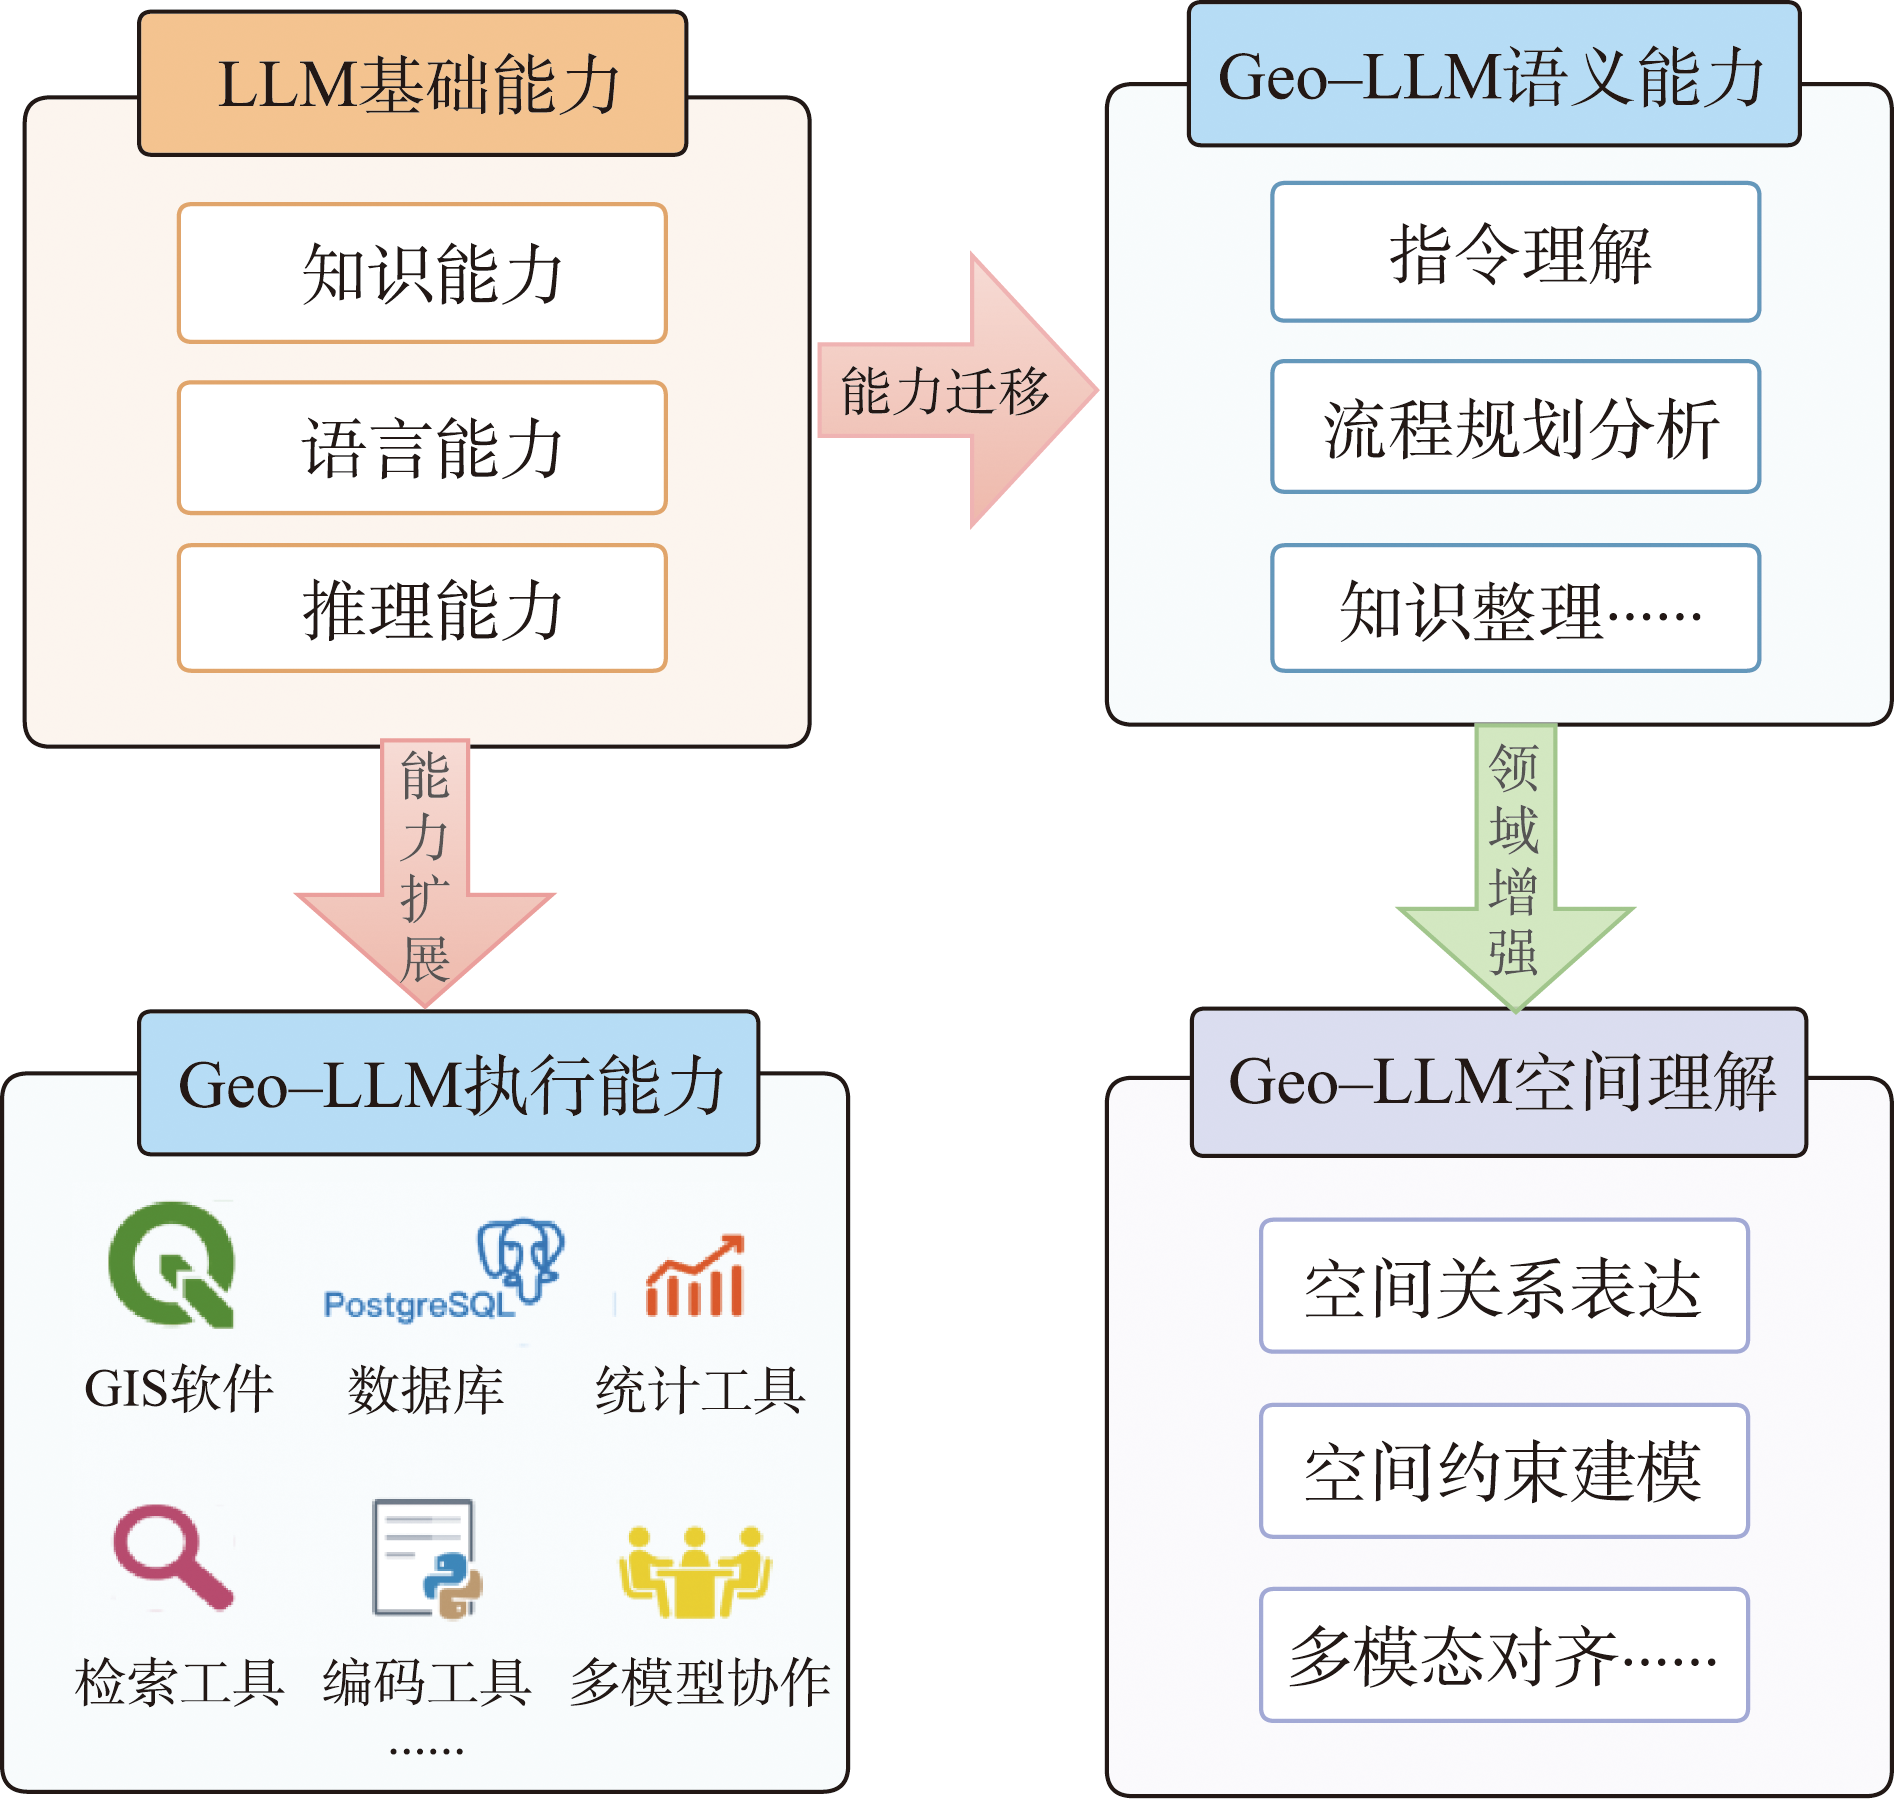
[Significance] In recent years, the emergence of Large Language Models (LLMs) has provided a new technological foundation for reconfiguring human-machine interaction centered on language. Traditional interaction models mainly rely on graphical interfaces and rule-based operations. In contrast, LLMs demonstrate strong capabilities in semantic understanding, task abstraction, and reasoning. This enables language to function as a sophisticated interface for organizing complex analytical processes. The integration of LLMs with spatial information technology is still at an experimental stage. However, related studies have begun to show their potential in the understanding, reasoning, and analysis of geospatial tasks. These studies suggest that LLMs may offer new opportunities for organizing domain knowledge. They also indicate potential for coordinating multi-step geospatial tasks. Together, these advances open up new directions for the intelligent development of geographic information systems. [Progress] To systematically explore the applicability of LLMs to complex geospatial tasks and the key challenges they face, this paper reviews academic literature related to geospatial language model (Geo-LLM) published since 2023. The reviewed studies represent recent attempts to integrate LLMs into different types of geospatial analysis scenarios. Specifically, this paper conducts the following work. First, it collects research cases of LLMs in geospatial tasks. Secondly, it elaborates on the capabilities and system functions of Geo-LLM. Then, it summarizes the key technologies for the collaboration between LLMs and domain knowledge, spatial data, and analysis tools. This also reflects the common strategies of Geo-LLM in integrating various resources in the workflow. These technologies include: enhancing the domain cognition ability of the model through the infusion of geographical knowledge; strengthening the data processing capability of the model by integrating spatial data and tools; and optimizing the reasoning and decision-making capabilities of the model in complex spatial analysis tasks through the design of reasoning chains and task planning mechanisms. [Prospects] Based on these findings, this paper further discusses the challenges and future prospects of deeply integrating LLMs with spatial technologies. This discussion is conducted from several perspectives, including multi-source data organization, agent workflow management, language model spatial cognition and reasoning, evaluation system, and geo-foundation model construction. This work focuses on the construction of geographically intelligent systems that are applicable, interpretable, and controllable. The aim is to enhance the deep integration between generative artificial intelligence and geographical tasks, with the expectation of further promoting the development of geospatial artificial intelligence.
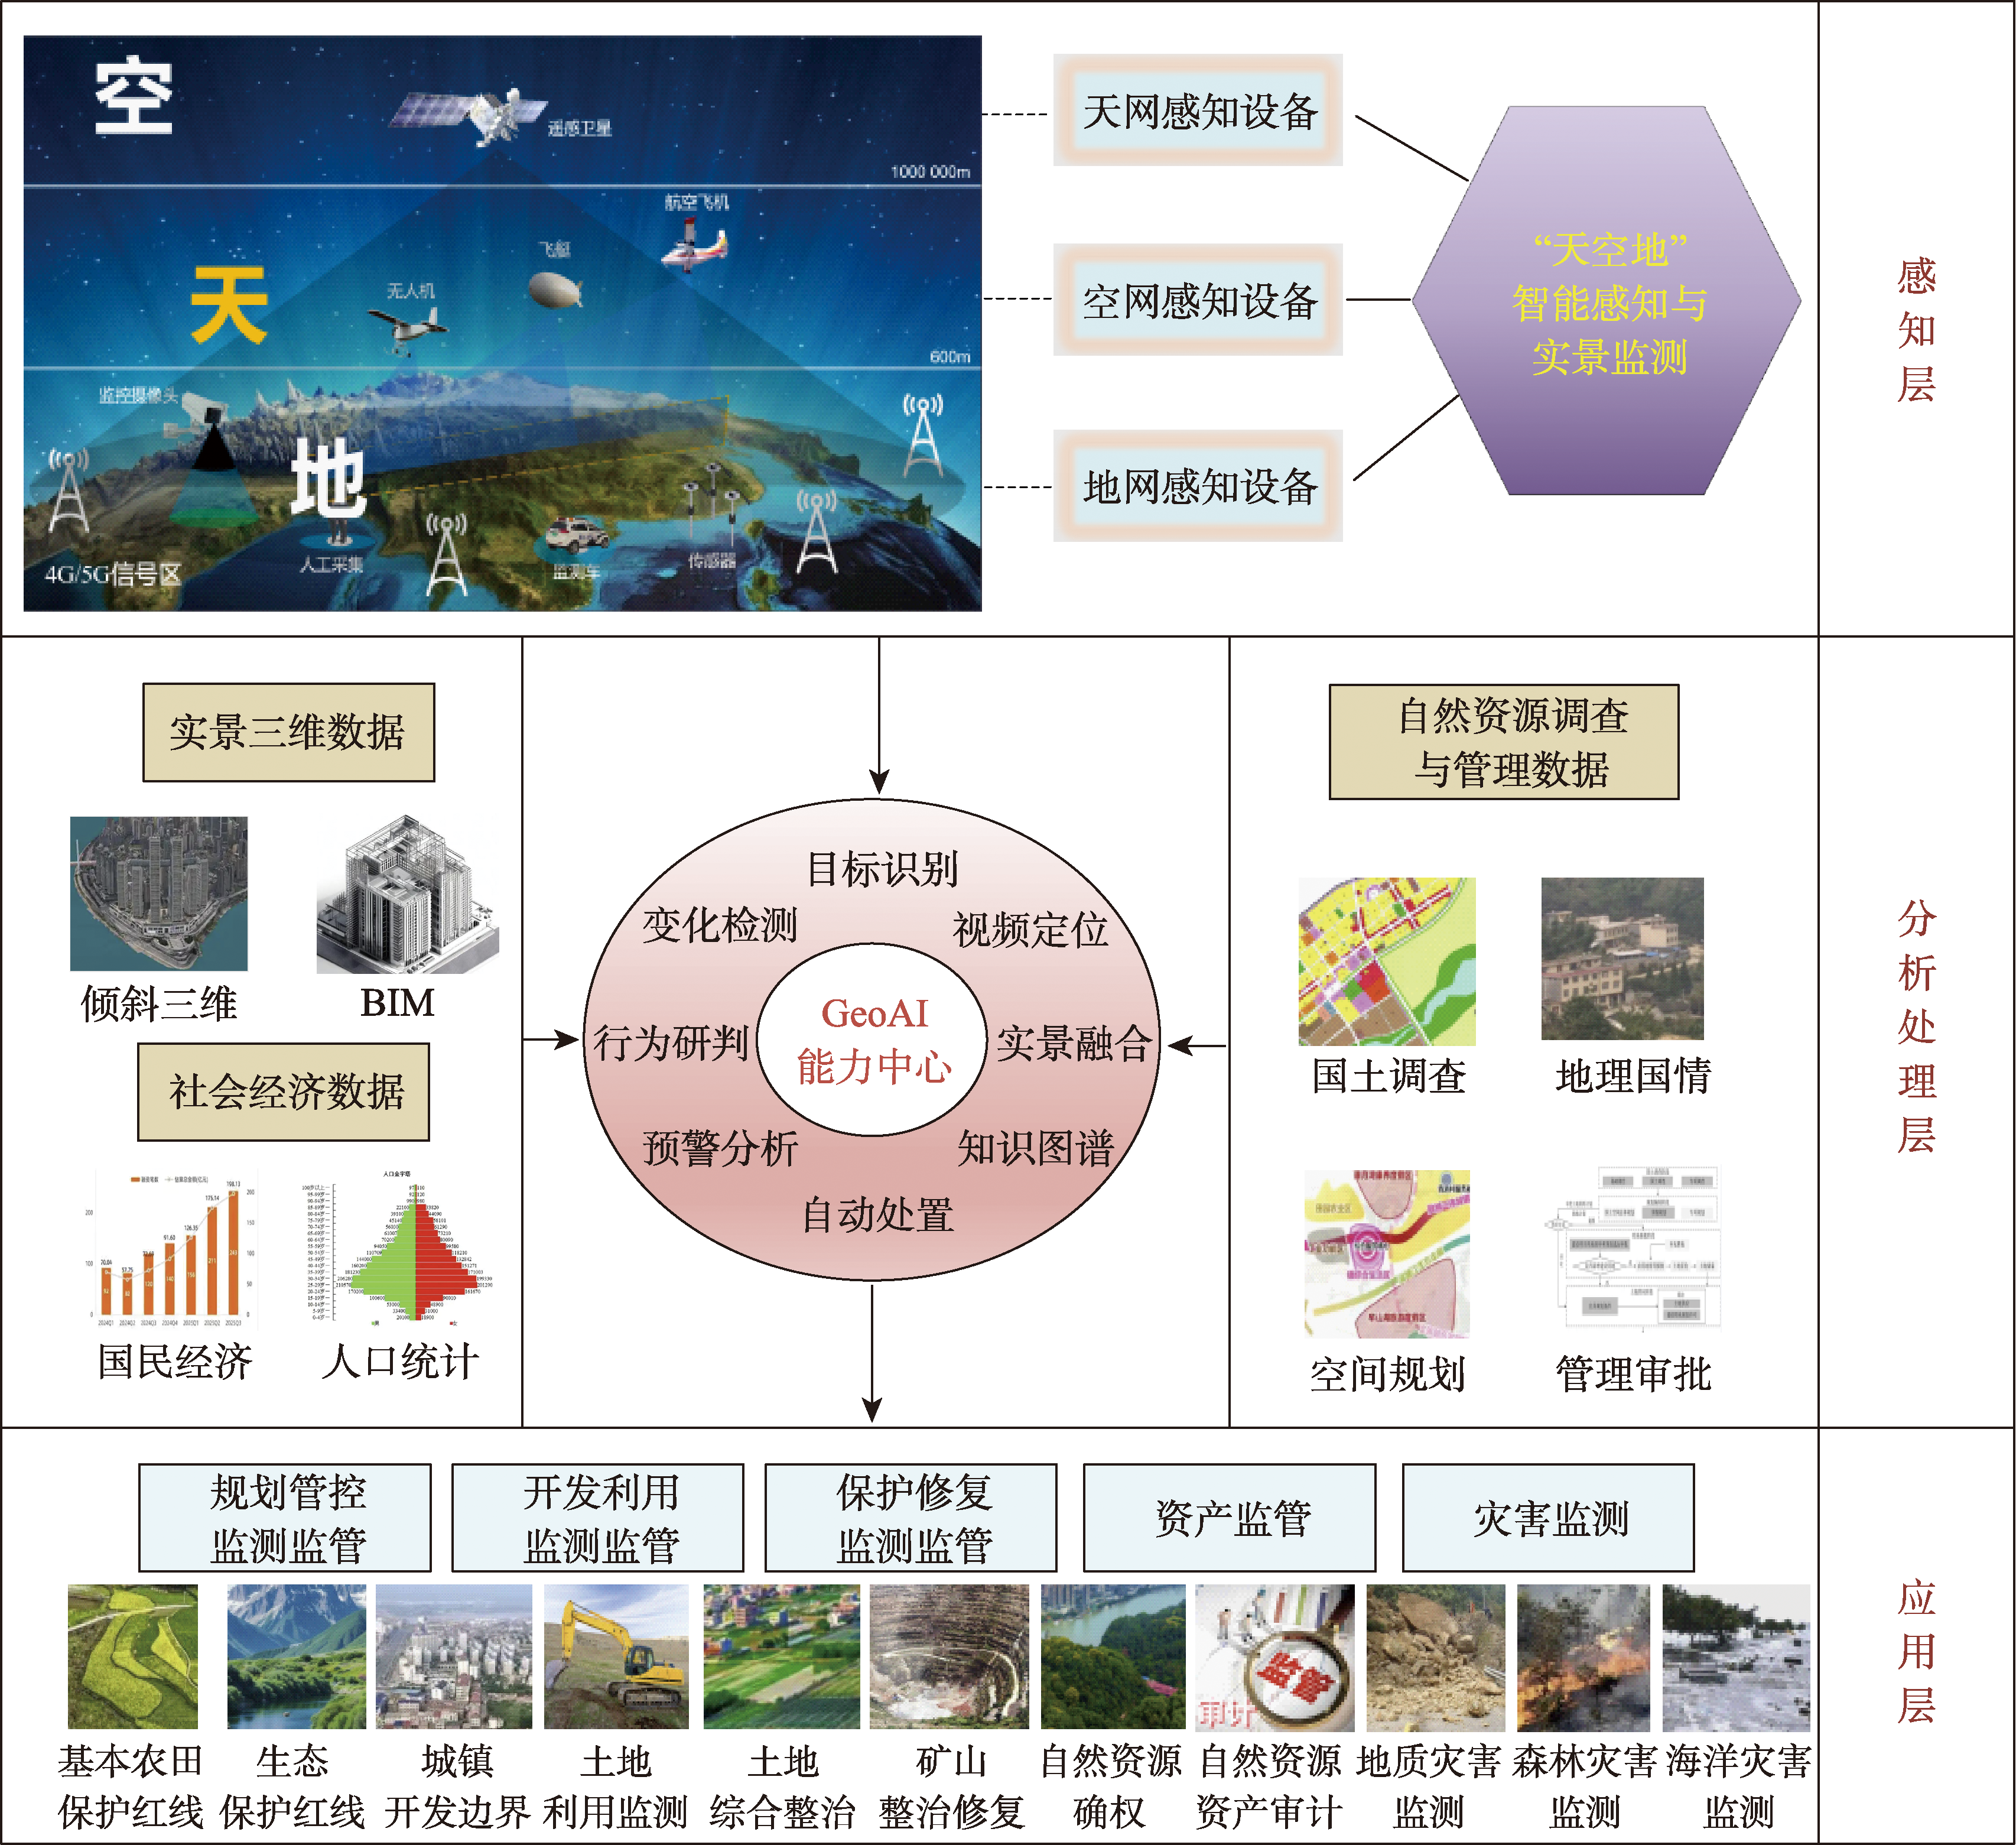
[Significance] Natural resource monitoring primarily involves detecting and supervising changes in natural resources themselves and those caused by human activities, providing a basis for natural resource management and scientific decision. The coordination among various current monitoring methods needs to be further strengthened. There are issues such as an emphasis on macro-level monitoring, insufficient precision in monitoring local or key areas, and the inability to establish a unified spatial reference for real-scene monitoring and 3D modeling. [Progress] This article introduces the main components of the sky and earth intelligent perception and real-scene monitoring system for natural resources. Intelligent perception and real-scene monitoring of natural resources primarily rely on integrating multi-level and multi-scale monitoring methods such as satellite remote sensing, drone monitoring, ground-based perception monitoring and GeoAI to achieve real-time monitoring and precise analysis of natural resources and their changes. And also, it is discussed that several key technologies and applications, including remote sensing image multiple elements of natural resources change detection based on the improved spatiotemporal dual self-attention feature model Res2Net, drone inspection and monitoring mode combined with improved genetic method for flight path planning, tower-based video target detection and localization, as well as point deployment optimization, and real-time video and 3D geographic scene fusion and parameter calculation based on the view cone. [Prospect] In the future, with the further removal of barriers in natural resource business, the maturity of technologies such as weakly supervised/unsupervised remote sensing deep learning, multi-modal fusion and collaboration, and intelligent agents, it is expected to establish a unified monitoring system and intelligent perception platform for various elements of "mountains, rivers, forests, fields, lakes, grasslands, and sands".
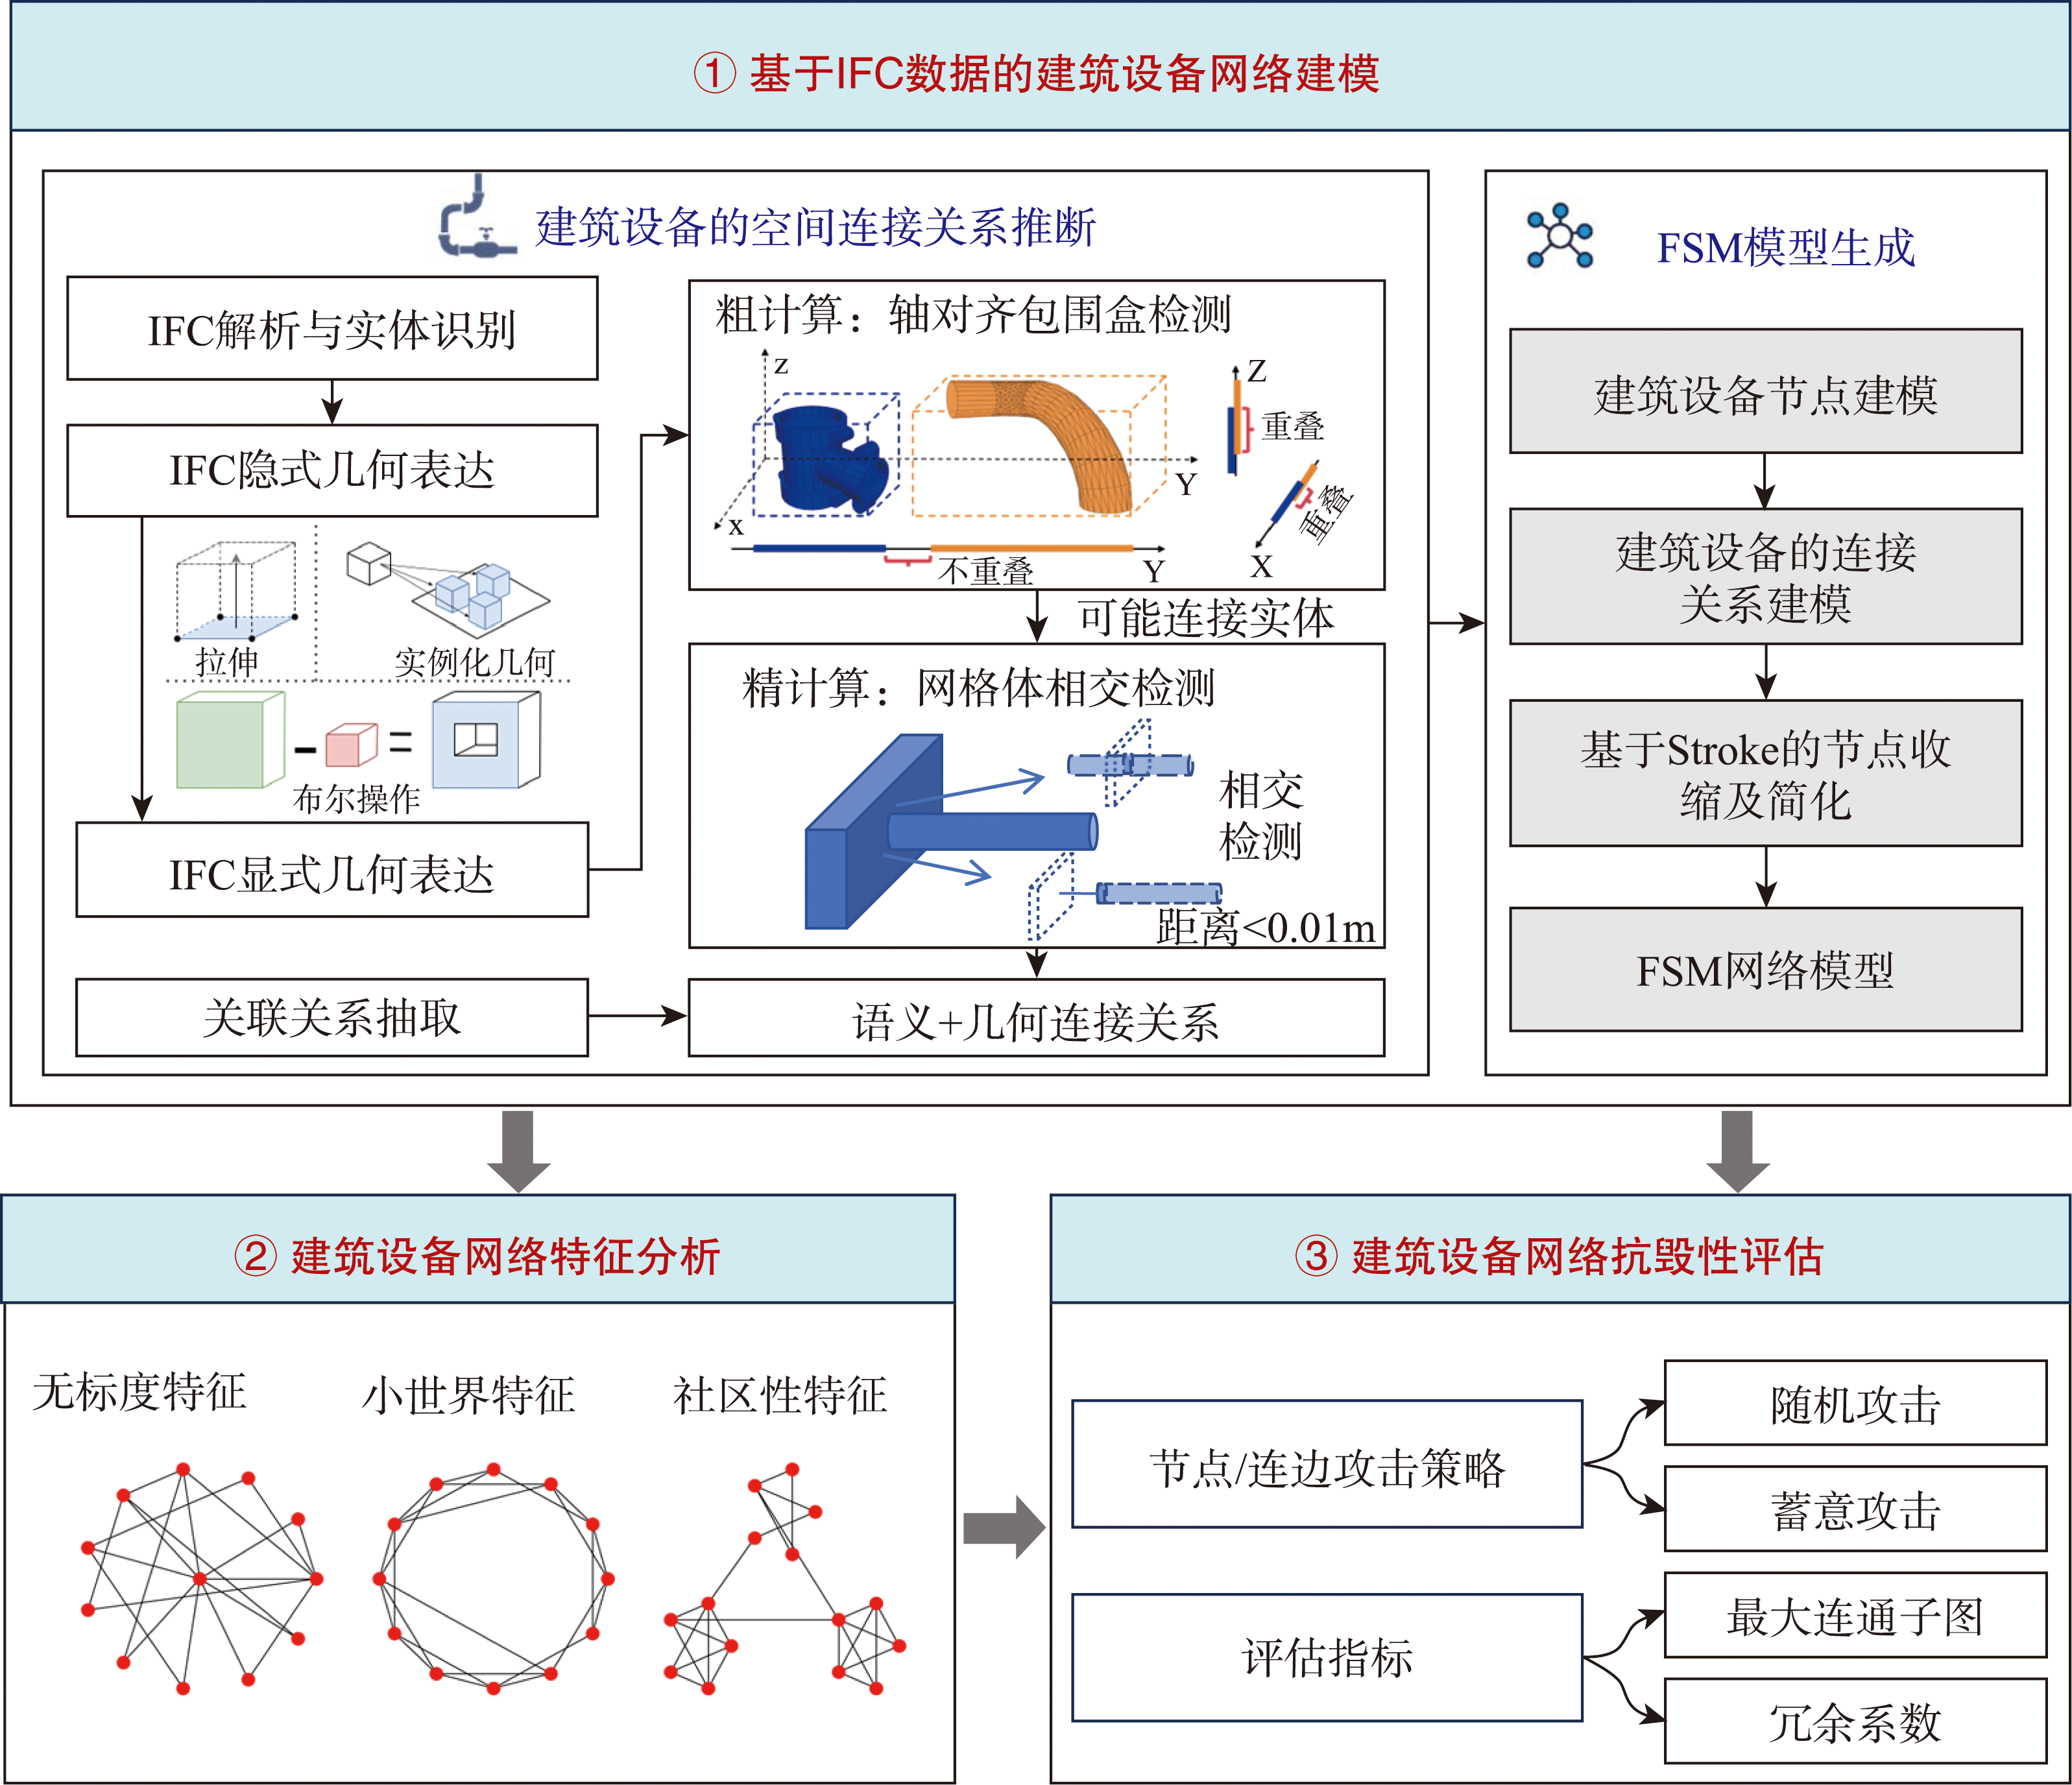
[Objectives] Localized component or connection failures within MEP (Mechanical, Electrical, and Plumbing) can diffuse via network coupling mechanisms, leading to the impairment or interruption of essential services-such as drainage, gas supply, and ventilation-thereby compromising the safety and stability of the building system. However, existing research has not yet fully elucidated the inherent structural complexity of indoor networks as spatial systems, particularly regarding their topological organization, hierarchical structure, and vulnerability evolution an integrated perspective spanning pipe segments, pipe runs, and pipe networks. A more comprehensive understanding of their networked behavior is therefore urgently needed, particularly for safety assessment and intelligent operation and maintenance in complex building environments. [Methods] To address this gap, this paper proposes a complex network-based modeling and vulnerability evaluation framework for building service systems. By integrating the topological information of electromechanical equipment with the geometric connectivity of 3D models, physical data-including pipe segments, and fittings-were transformed into a geometrically continuous and semantically consistent FSM (Flow-Segments Stroke Model).The study systematically mines characteristics such as scale-free distributions, small-world properties, and community structures. Furthermore, failure simulations and quantitative analyses are conducted according to topological features at different hierarchical levels, enabling a multi-level examination of network vulnerability, robustness, and structural response under disturbance. [Results] The complex-network-based evaluation framework effectively captures the asymmetric evolutionary patterns of system anti-destruction performance under different disturbance scenarios. Under random failures, the service network shows relatively strong robustness. When the redundancy coefficient exceeds 0.1, the proportion of the largest connected component can recover to more than 95%, suggesting that a moderate level of redundancy can substantially enhance system resilience against accidental disruptions. By contrast, the network is extremely vulnerable to intentional attacks targeting critical nodes or key regions. Removing only the top 0.5% of nodes is sufficient to reduce overall network connectivity by 50%, revealing a pronounced dependence on structurally important components. Even when the redundancy coefficient is increased to 1.0, the network connectivity can recover only to approximately 50%, indicating that redundancy alone cannot fully compensate for the severe impact of targeted disruption. In addition, the anti-destruction performance varies among building service systems with different physical morphologies. Rectangular network structures exhibit the best anti-destruction performance, whereas tree-like structures perform the worst, reflecting significant morphology-dependent differences in resilience and vulnerability. [Conclusions] From a global topological perspective, this study quantitatively reveals the intrinsic complexity of building service systems and provides new insight into their structural organization, vulnerability patterns, and resilience mechanisms. The findings highlight the importance of considering both topology and geometry in modelling and evaluating building service networks, and they offer a scientific basis for safety assessment, resilience-oriented design, and intelligent management during the operation and maintenance stage of buildings.
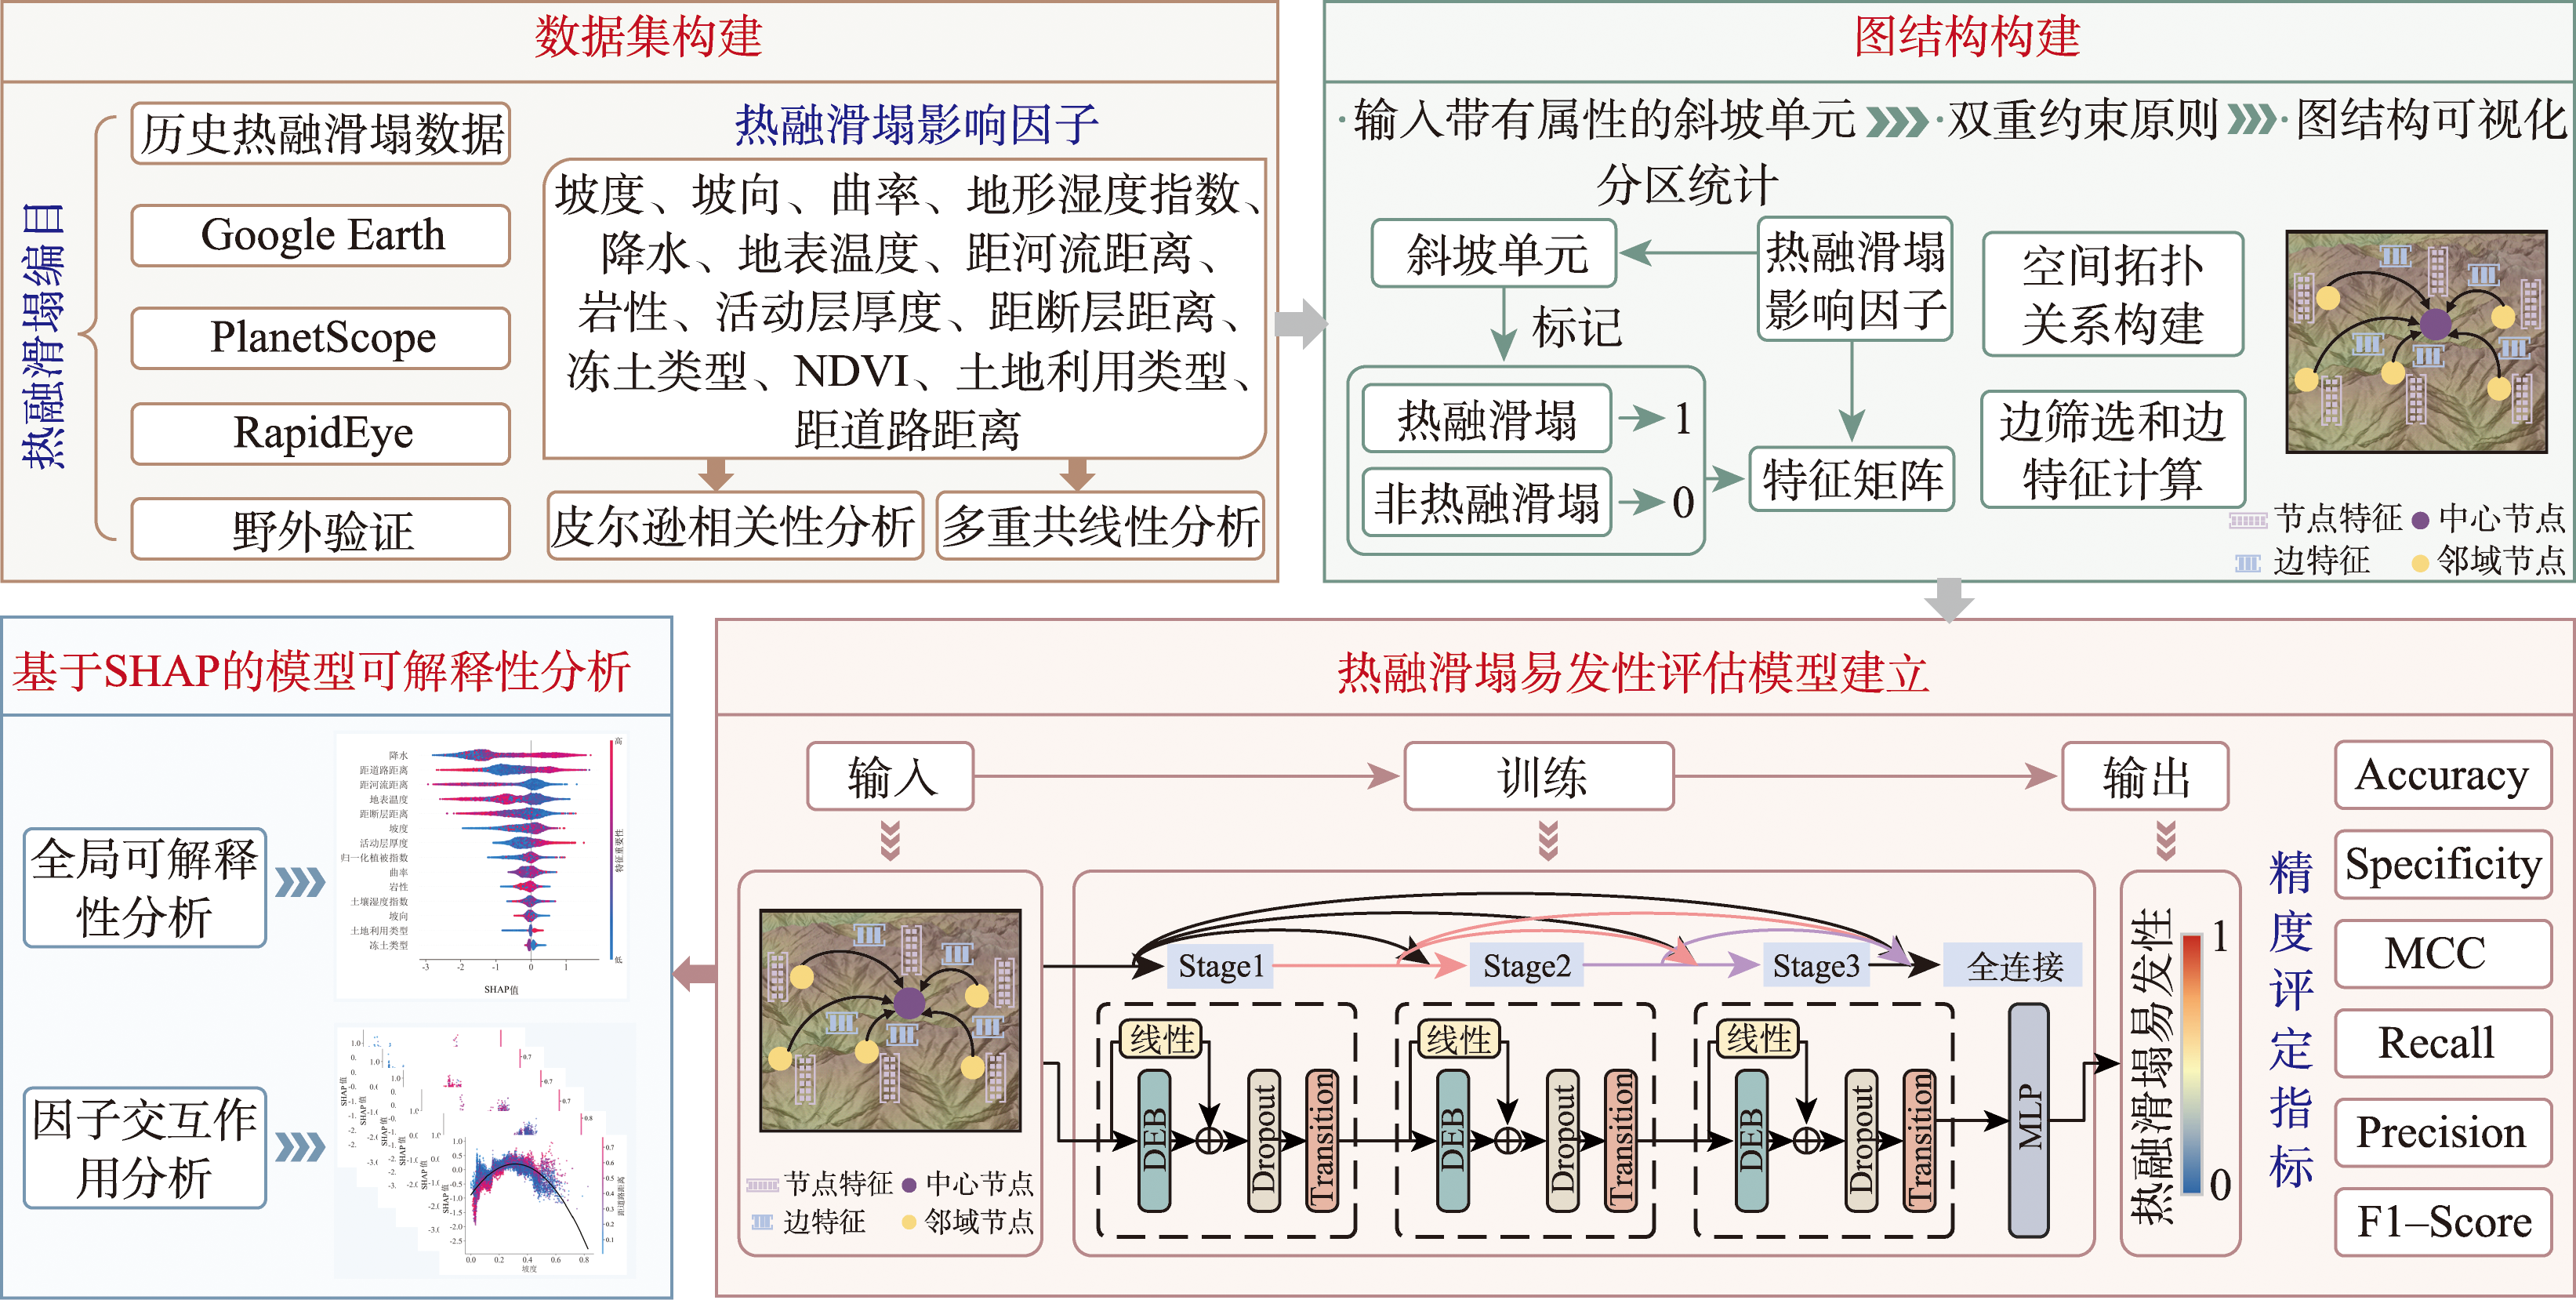
[Objectives] Thaw slumps constitute a widespread and destructive form of thermal erosion hazards prevalent in permafrost regions. Accurate assessment of thaw slump susceptibility is widely recognized as a crucial prerequisite for ensuring the safety of engineering infrastructure and maintaining long-term ecological stability in cold environments. As a vital ecological security barrier in Northwest China, the Qilian Mountains have undergone severe permafrost degradation in recent years due to rising temperatures and extreme precipitation events, leading to frequent thaw slump disasters. Consequently, developing advanced methods to identify risk zones in this specific region is urgent. [Methods] To address these challenges, this paper selects the Qilian Mountains as the experimental scene and proposes a Residual Dense Connected Graph Neural Network (RDCGNN) method for thaw slump susceptibility assessment. The methodological approach begins by constructing geographic maps that utilize slope units rather than grid units, ensuring the effective preservation of topographic integrity and natural geomorphological boundaries. Within the proposed RDCGNN architecture, an edge-aware dynamic convolution operator is incorporated to explicitly model edge attributes, which facilitates anisotropic information aggregation tailored to theterrain. Furthermore, the model integrates sophisticated residual and dense connection mechanisms to seamlessly fuse multi-scale features, a design choice that effectively mitigates the over-smoothing issues commonly encountered in deep graph neural networks. [Results] Comprehensive experimental results demonstrate that the proposed RDCGNN method exhibits superior performance compared to various baseline models (RF, SVM, GCN, GAT, GraphSAGE), achieving an AUC of 94.05% and an F1 score of 94.59%. Furthermore, the model shows remarkable robustness by effectively suppressing background noise, thus enabling the most precise delineation of high-risk areas. SHAP interpretability analysis indicates that the 14 selected thaw slump influencing factors effectively support the RDCGNN model's in-depth explanation of the complex causes of thaw slumps. Specifically, the analysis reveals that precipitation and distance from roads act as the primary controlling factors driving thaw slump in the Qilian Mountains. [Conclusions] In summary, this study significantly enhances the accuracy and reliability of thaw slump susceptibility assessment in the Qilian Mountains. By successfully constructing the residual dense connection graph neural network model, enabling the precise identification of high susceptibility zones for thaw slumps in the region.
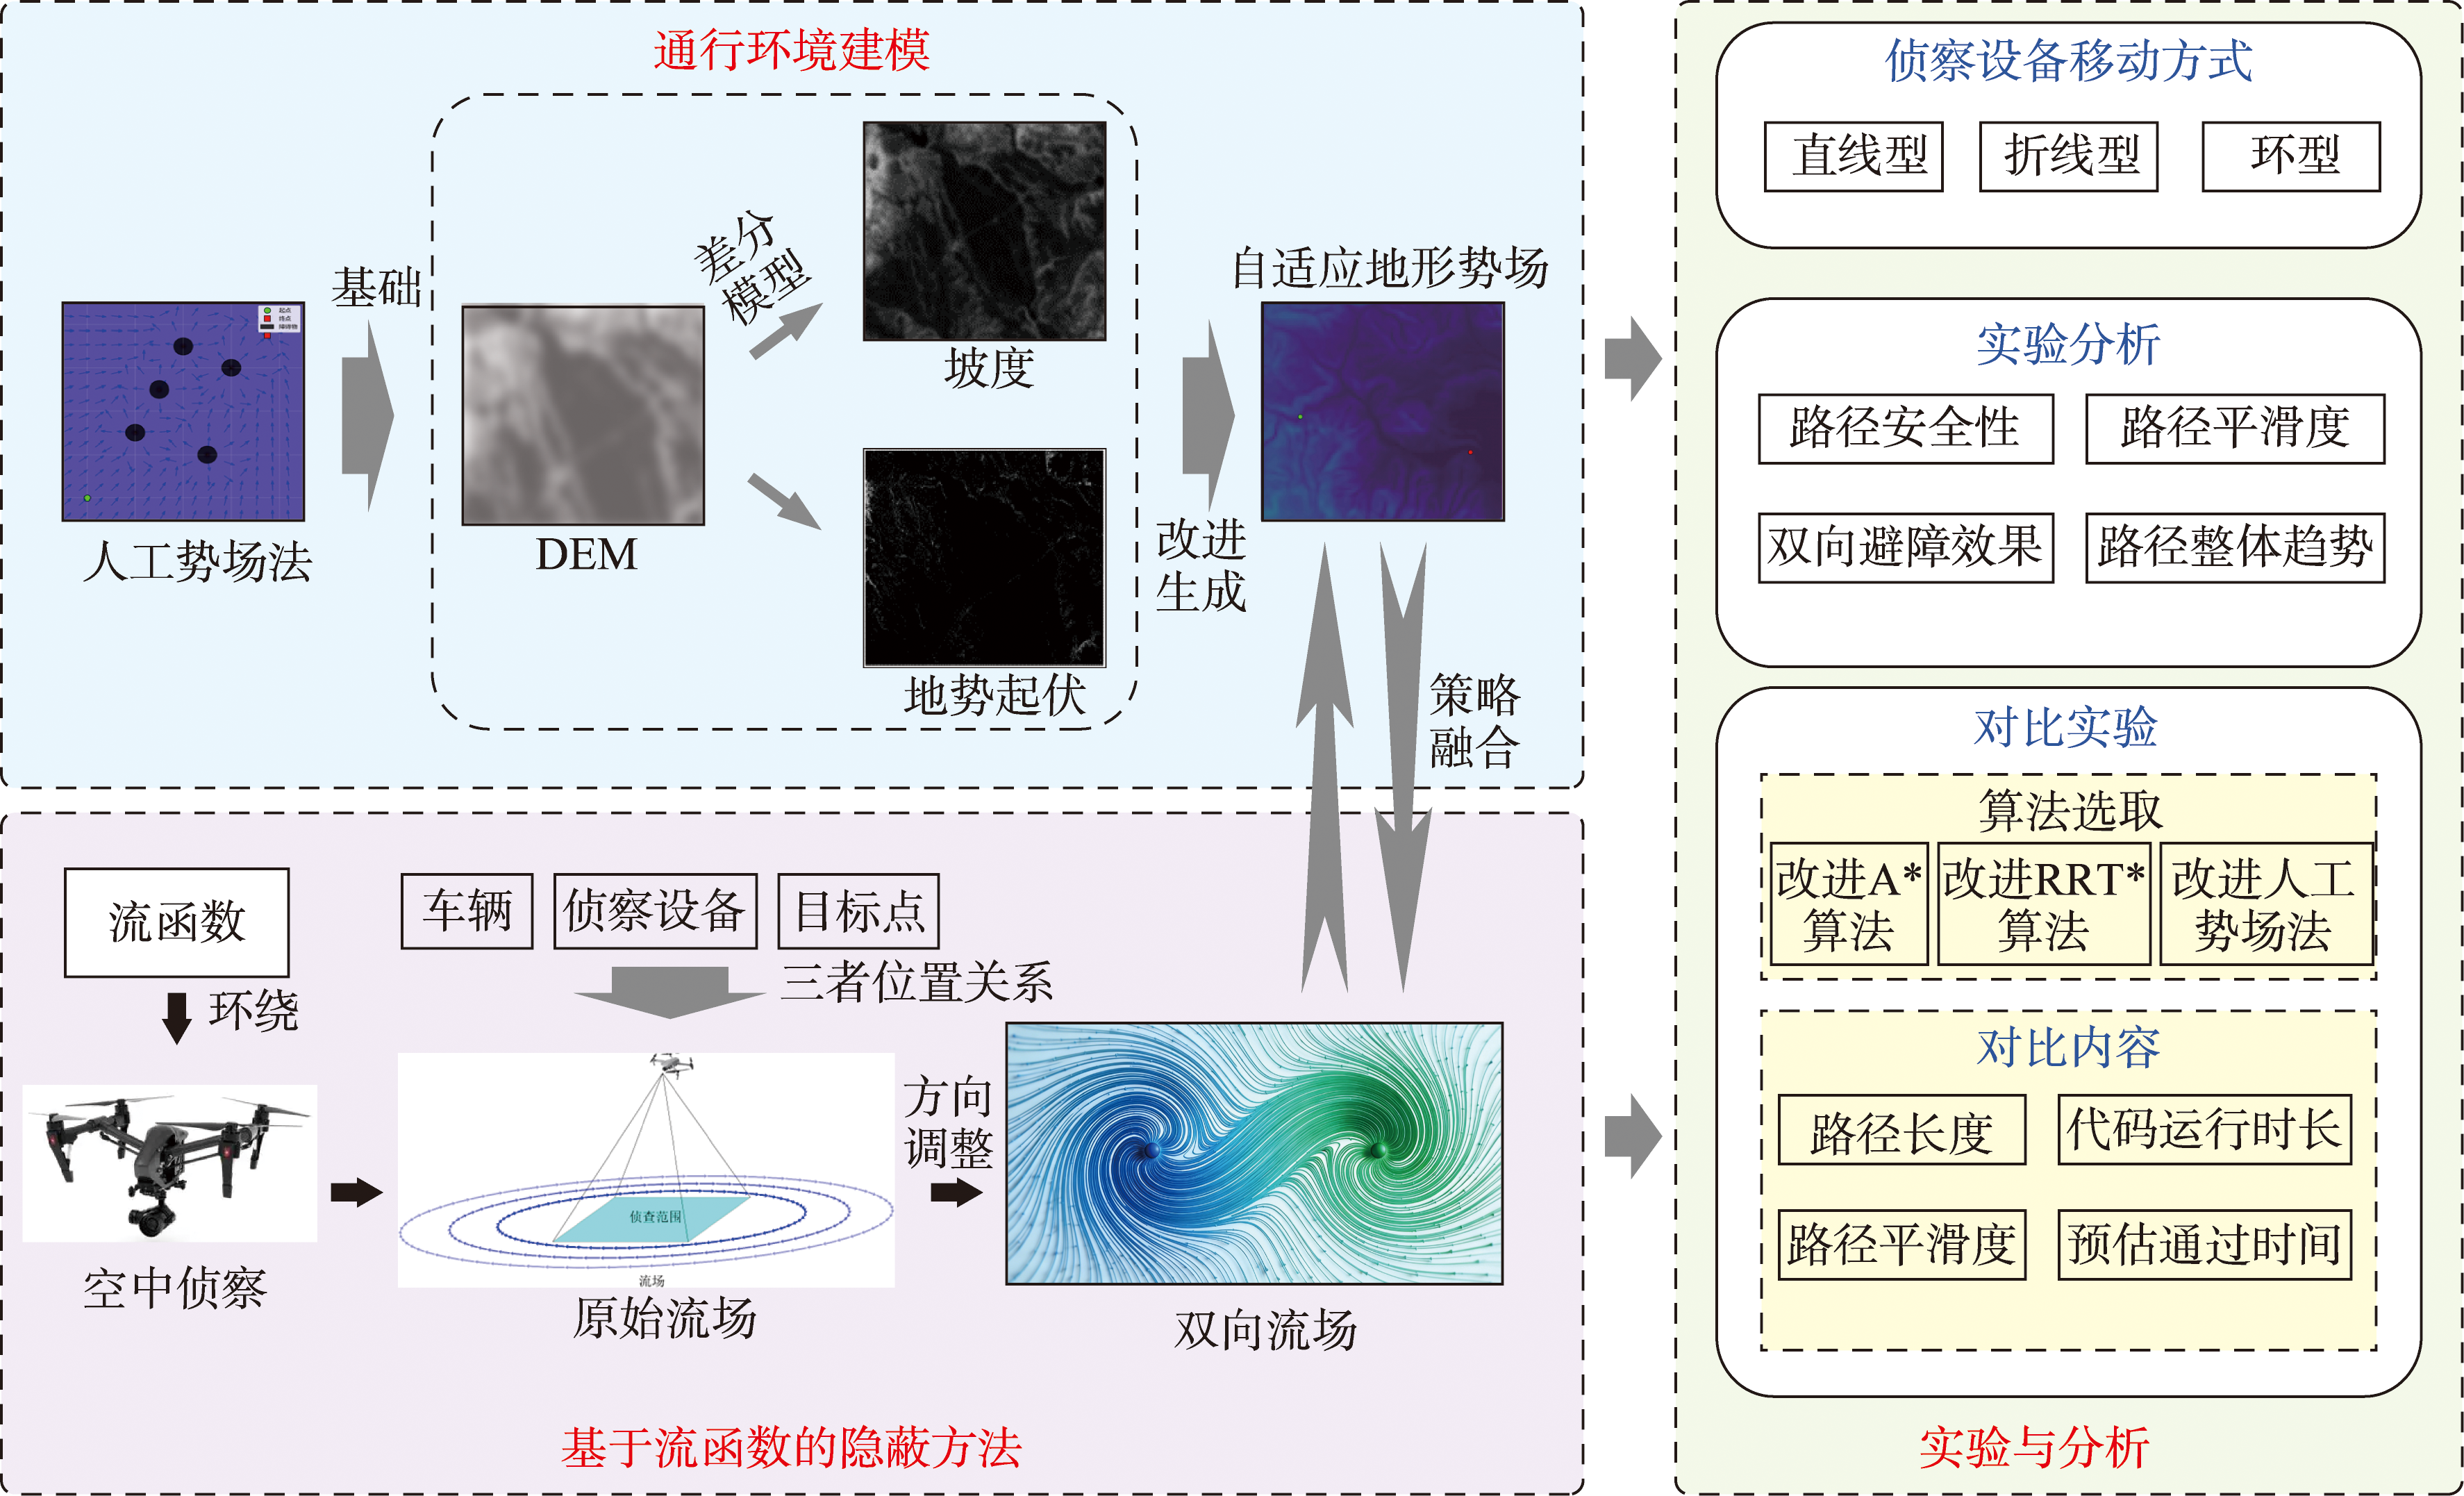
[Objectives] In contemporary military and security operations, ground vehicles navigating off-road environments are increasingly vulnerable to persistent aerial surveillance from assets such as unmanned aerial vehicles. Traditional path planning algorithms primarily focus on static obstacle avoidance and optimizing geometric metrics like shortest distance, often overlooking the critical need for concealment against intelligent, mobile reconnaissance threats. This paper tackles this gap by proposing a novel, integrated path planning framework designed to generate routes that are not only traversable and efficient but also maximize stealth under dynamic surveillance conditions. [Methods] Our methodology consists of two core components. First, a detailed terrain trafficability model is constructed based on Digital Elevation Model data and slope analysis. We employ an enhanced Artificial Potential Field method to generate an adaptive terrain potential field. This field quantifies the cost of movement based on elevation and slope, with its influence intelligently decaying as the vehicle approaches its final destination, thus prioritizing both safety and goal-directed progress. Second, to actively evade UAV detection, we model surveillance zones using a stream function to create a dynamic flow field around them. The key innovation is a bidirectional flow field mechanism. Unlike conventional unidirectional flow, this mechanism dynamically selects the optimal circumvention direction in real-time. The decision is based on an instantaneous geometric analysis of the relative positions among the vehicle, the target point, and the moving UAV, allowing for more natural and concealed detours. The vehicle's trajectory is then planned within this composite field, which combines the terrain potential and the dynamic flow. Comprehensive simulations were conducted in a complex mountainous region of Dengfeng City, Henan Province, featuring UAVs executing linear, circular, and polygonal patrol patterns to validate the algorithm's robustness. [Results] Experimental results demonstrate the superior performance of the proposed algorithm. It successfully maintained complete concealment across all test scenarios with different UAV behaviors. In comparative analyses against benchmark algorithms—including terrain-aware improved A, improved RRT, and a standard improved APF method—our approach generated paths with markedly higher smoothness, significantly reducing abrupt directional changes and oscillatory jitter. This enhancement directly improves practical drivability and lowers exposure risk associated with erratic maneuvers. While maintaining competitive scores in raw path length and computational runtime, the algorithm's principal strength lies in its holistic optimization, seamlessly balancing terrain adaptability, path smoothness, and proactive threat avoidance. [Conclusions] This study validates an effective and advanced method for covert off-road path planning under dynamic aerial reconnaissance. The introduction of the bidirectional flow field mechanism provides a crucial capability for intelligent, context-aware evasion of moving threats, addressing a significant limitation in existing fluid-inspired planners. The framework demonstrates strong potential for deployment in real-world complex and adversarial environments.
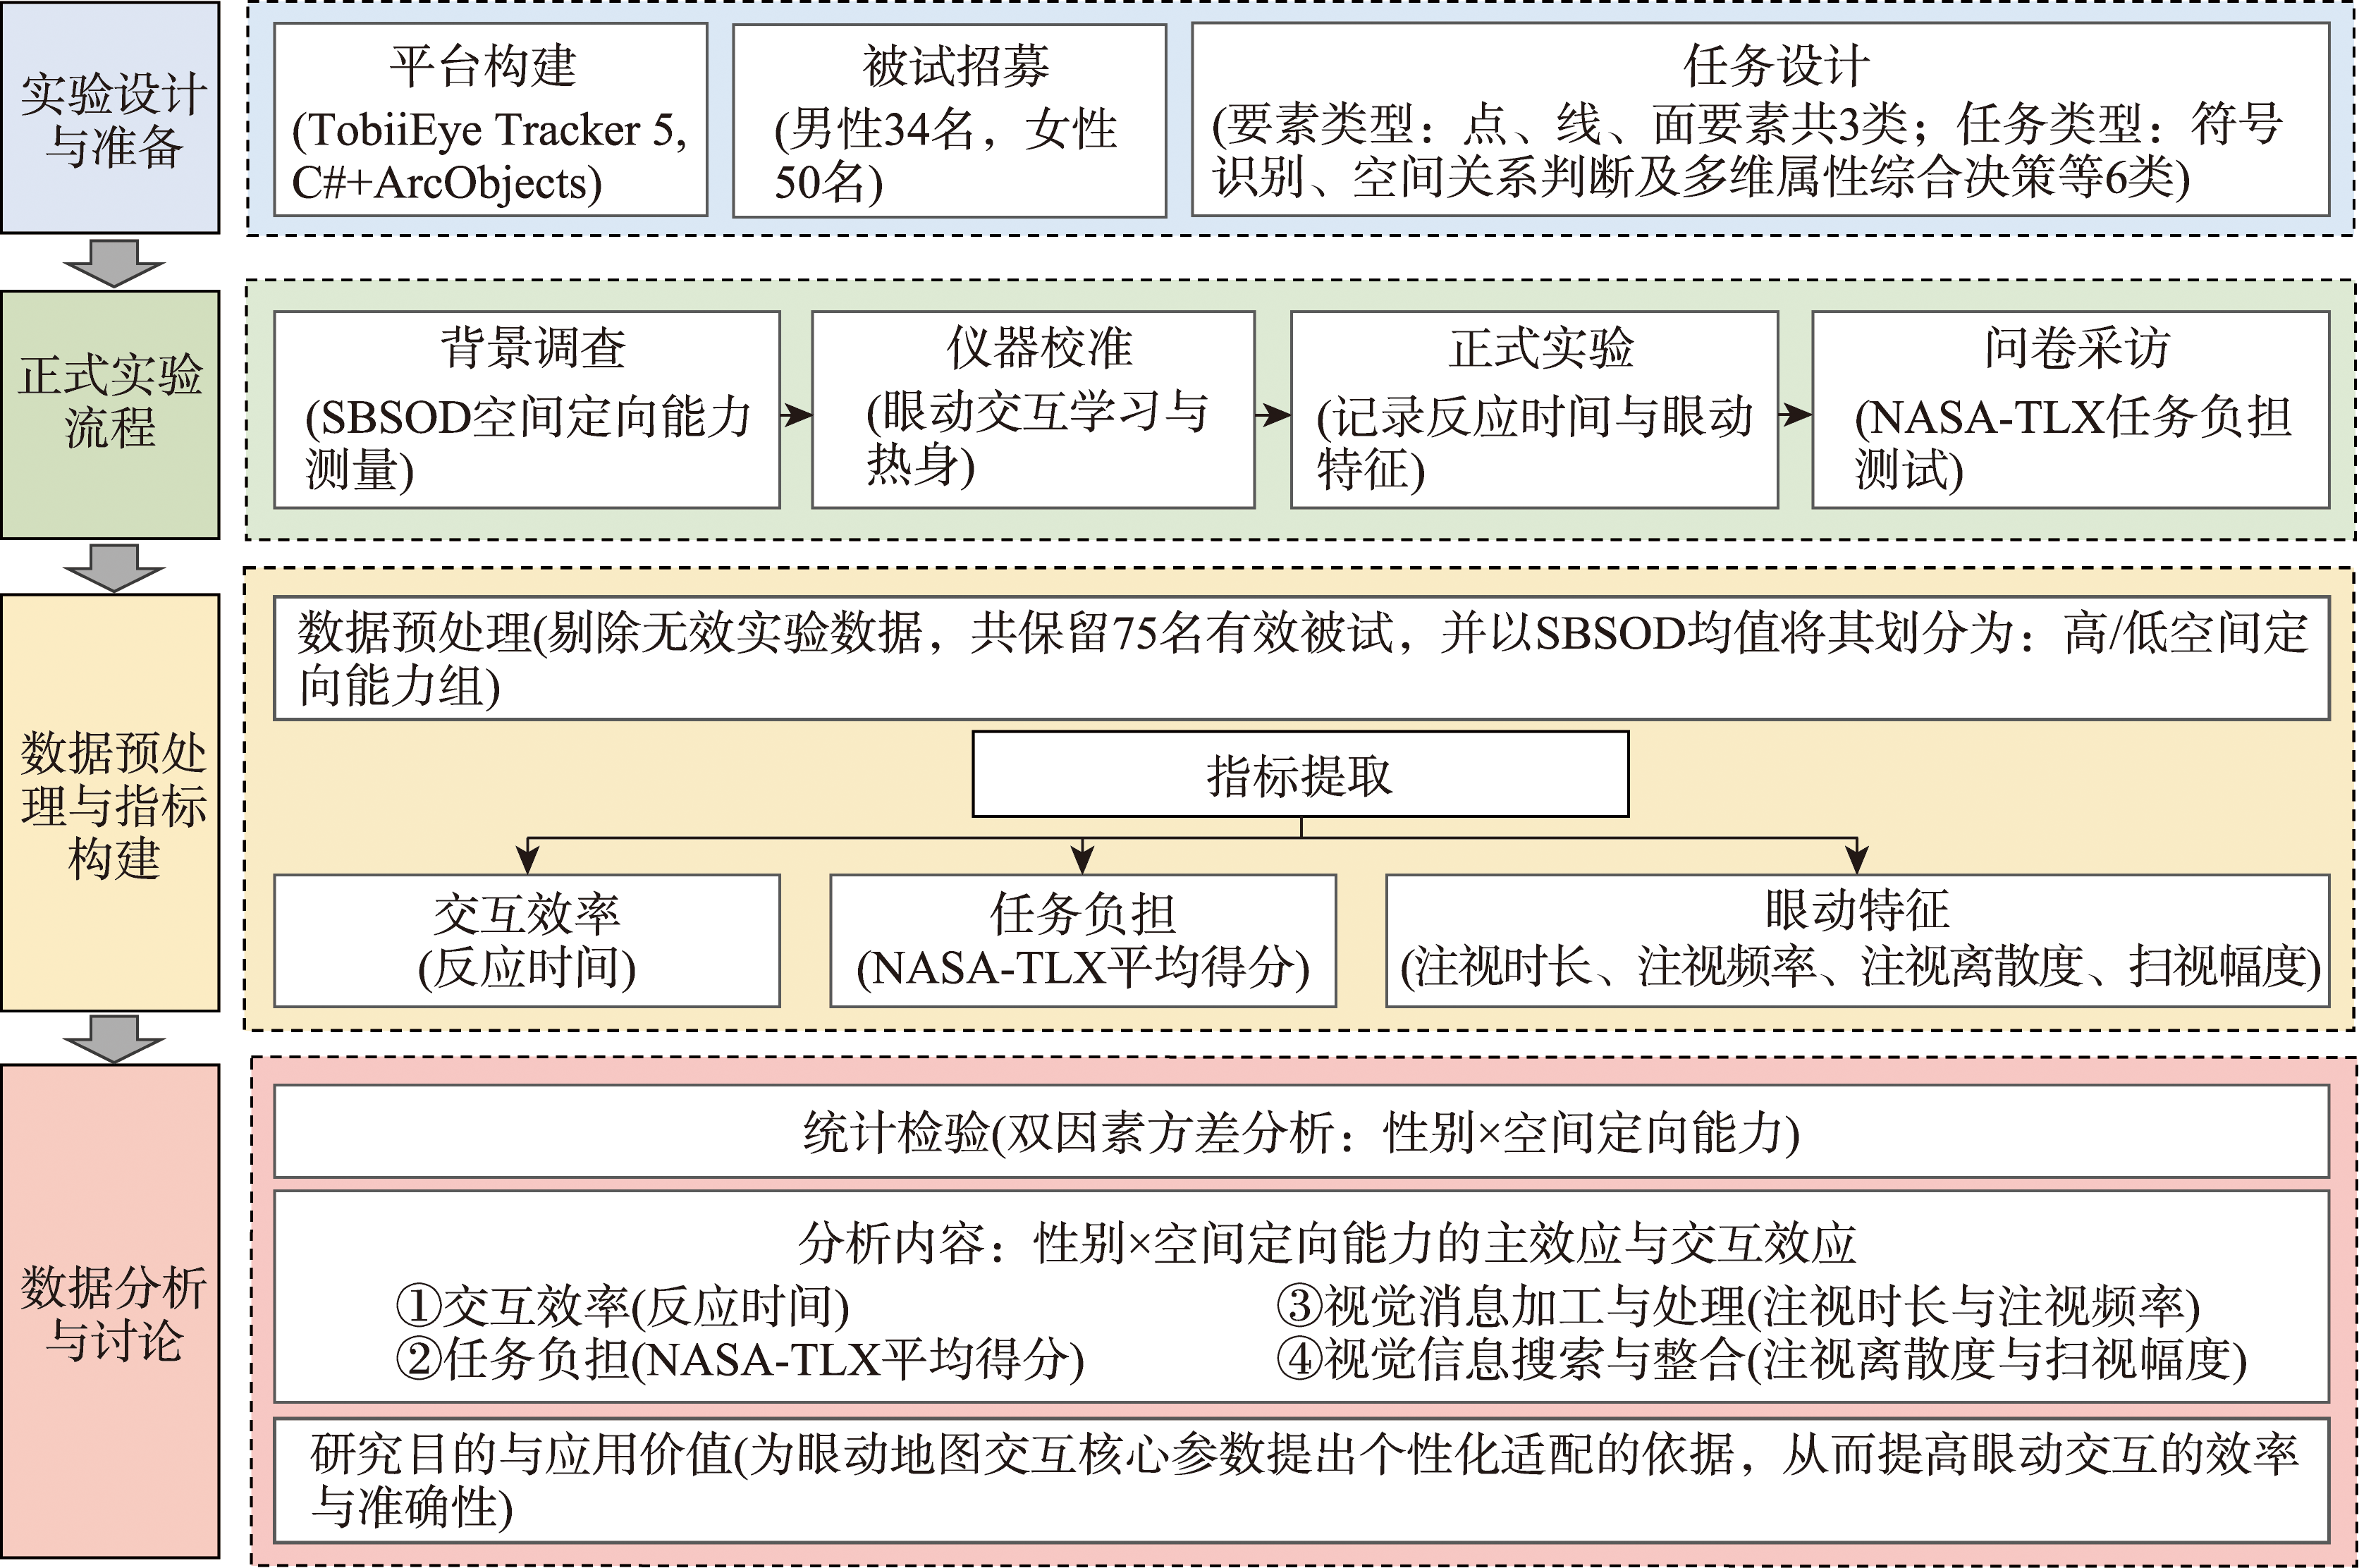
[Objectives] With the increasing adoption of gaze-based interfaces in map-based applications, individual differences among users may directly affect interaction efficiency and the accuracy of feature selection, making it necessary to systematically account for such differences in interaction design. This study investigates how gender and Spatial Orientation Ability (SOA) jointly influence map feature selection using gaze-based interaction, with a focus on interaction efficiency, task workload, and eye movement behavior. [Methods] A gaze-based map interaction platform was developed using a consumer-grade Tobii Eye Tracker 5, implementing feature selection via a 600 ms dwell-time threshold and spatial buffer zones. In a controlled user experiment, valid data from 75 participants (30 males, 45 females) were collected and analyzed. They were asked to complete 90 feature selection tasks under gaze-based interaction. These tasks covered three feature types (point, line, and polygon) and six task types with increasing cognitive demands, ranging from single visual-cue identification to selections requiring spatial relationship judgments and multi-attribute reasoning. During the task, response time was recorded as an efficiency measure, perceived workload was assessed using NASA-TLX, and eye movement metrics (including fixation duration, fixation dispersion, saccade amplitude, and fixation frequency) were extracted. SOA was assessed using the Santa Barbara Sense of Direction Scale (SBSOD). Importantly, SOA grouping was performed without stratifying by gender: participants were divided into high-SOA and low-SOA groups using the overall sample mean of SBSOD scores. A two-way ANOVA was then conducted to examine the main and interaction effects of gender and SOA. [Results] (1) Neither gender nor SOA had a significant effect on interaction efficiency (response time) or perceived task workload (NASA-TLX). (2) In terms of gaze movements: ① During final selection fixations, males exhibited significantly shorter fixation durations than females. ② In non-selection fixations, males demonstrated significantly greater fixation dispersion, while participants with high SOA showed significantly longer durations than those with low SOA. ③ High SOA was associated with lower fixation frequency, especially among male participants. [Conclusions] The findings suggest that gaze-based map interaction behaviors are shaped by gender-specific cognitive strategies. Males tend to employ a more global overview scanning strategy and reach commitment decisions more quickly, whereas females rely more on local-feature scanning and cautious verification during final decision execution. High-SOA participants appear to adopt a deeper and more systematic processing mode, investing more time in integrating spatial structure and thematic attributes during cognitive processing, while showing reduced fixation frequency; low-SOA participants tend to adopt a relatively shallower and more fragmented processing approach. These insights offer empirical support for adaptive map interface design, such as customizing dwell-time thresholds or buffer sizes to accommodate individual differences.
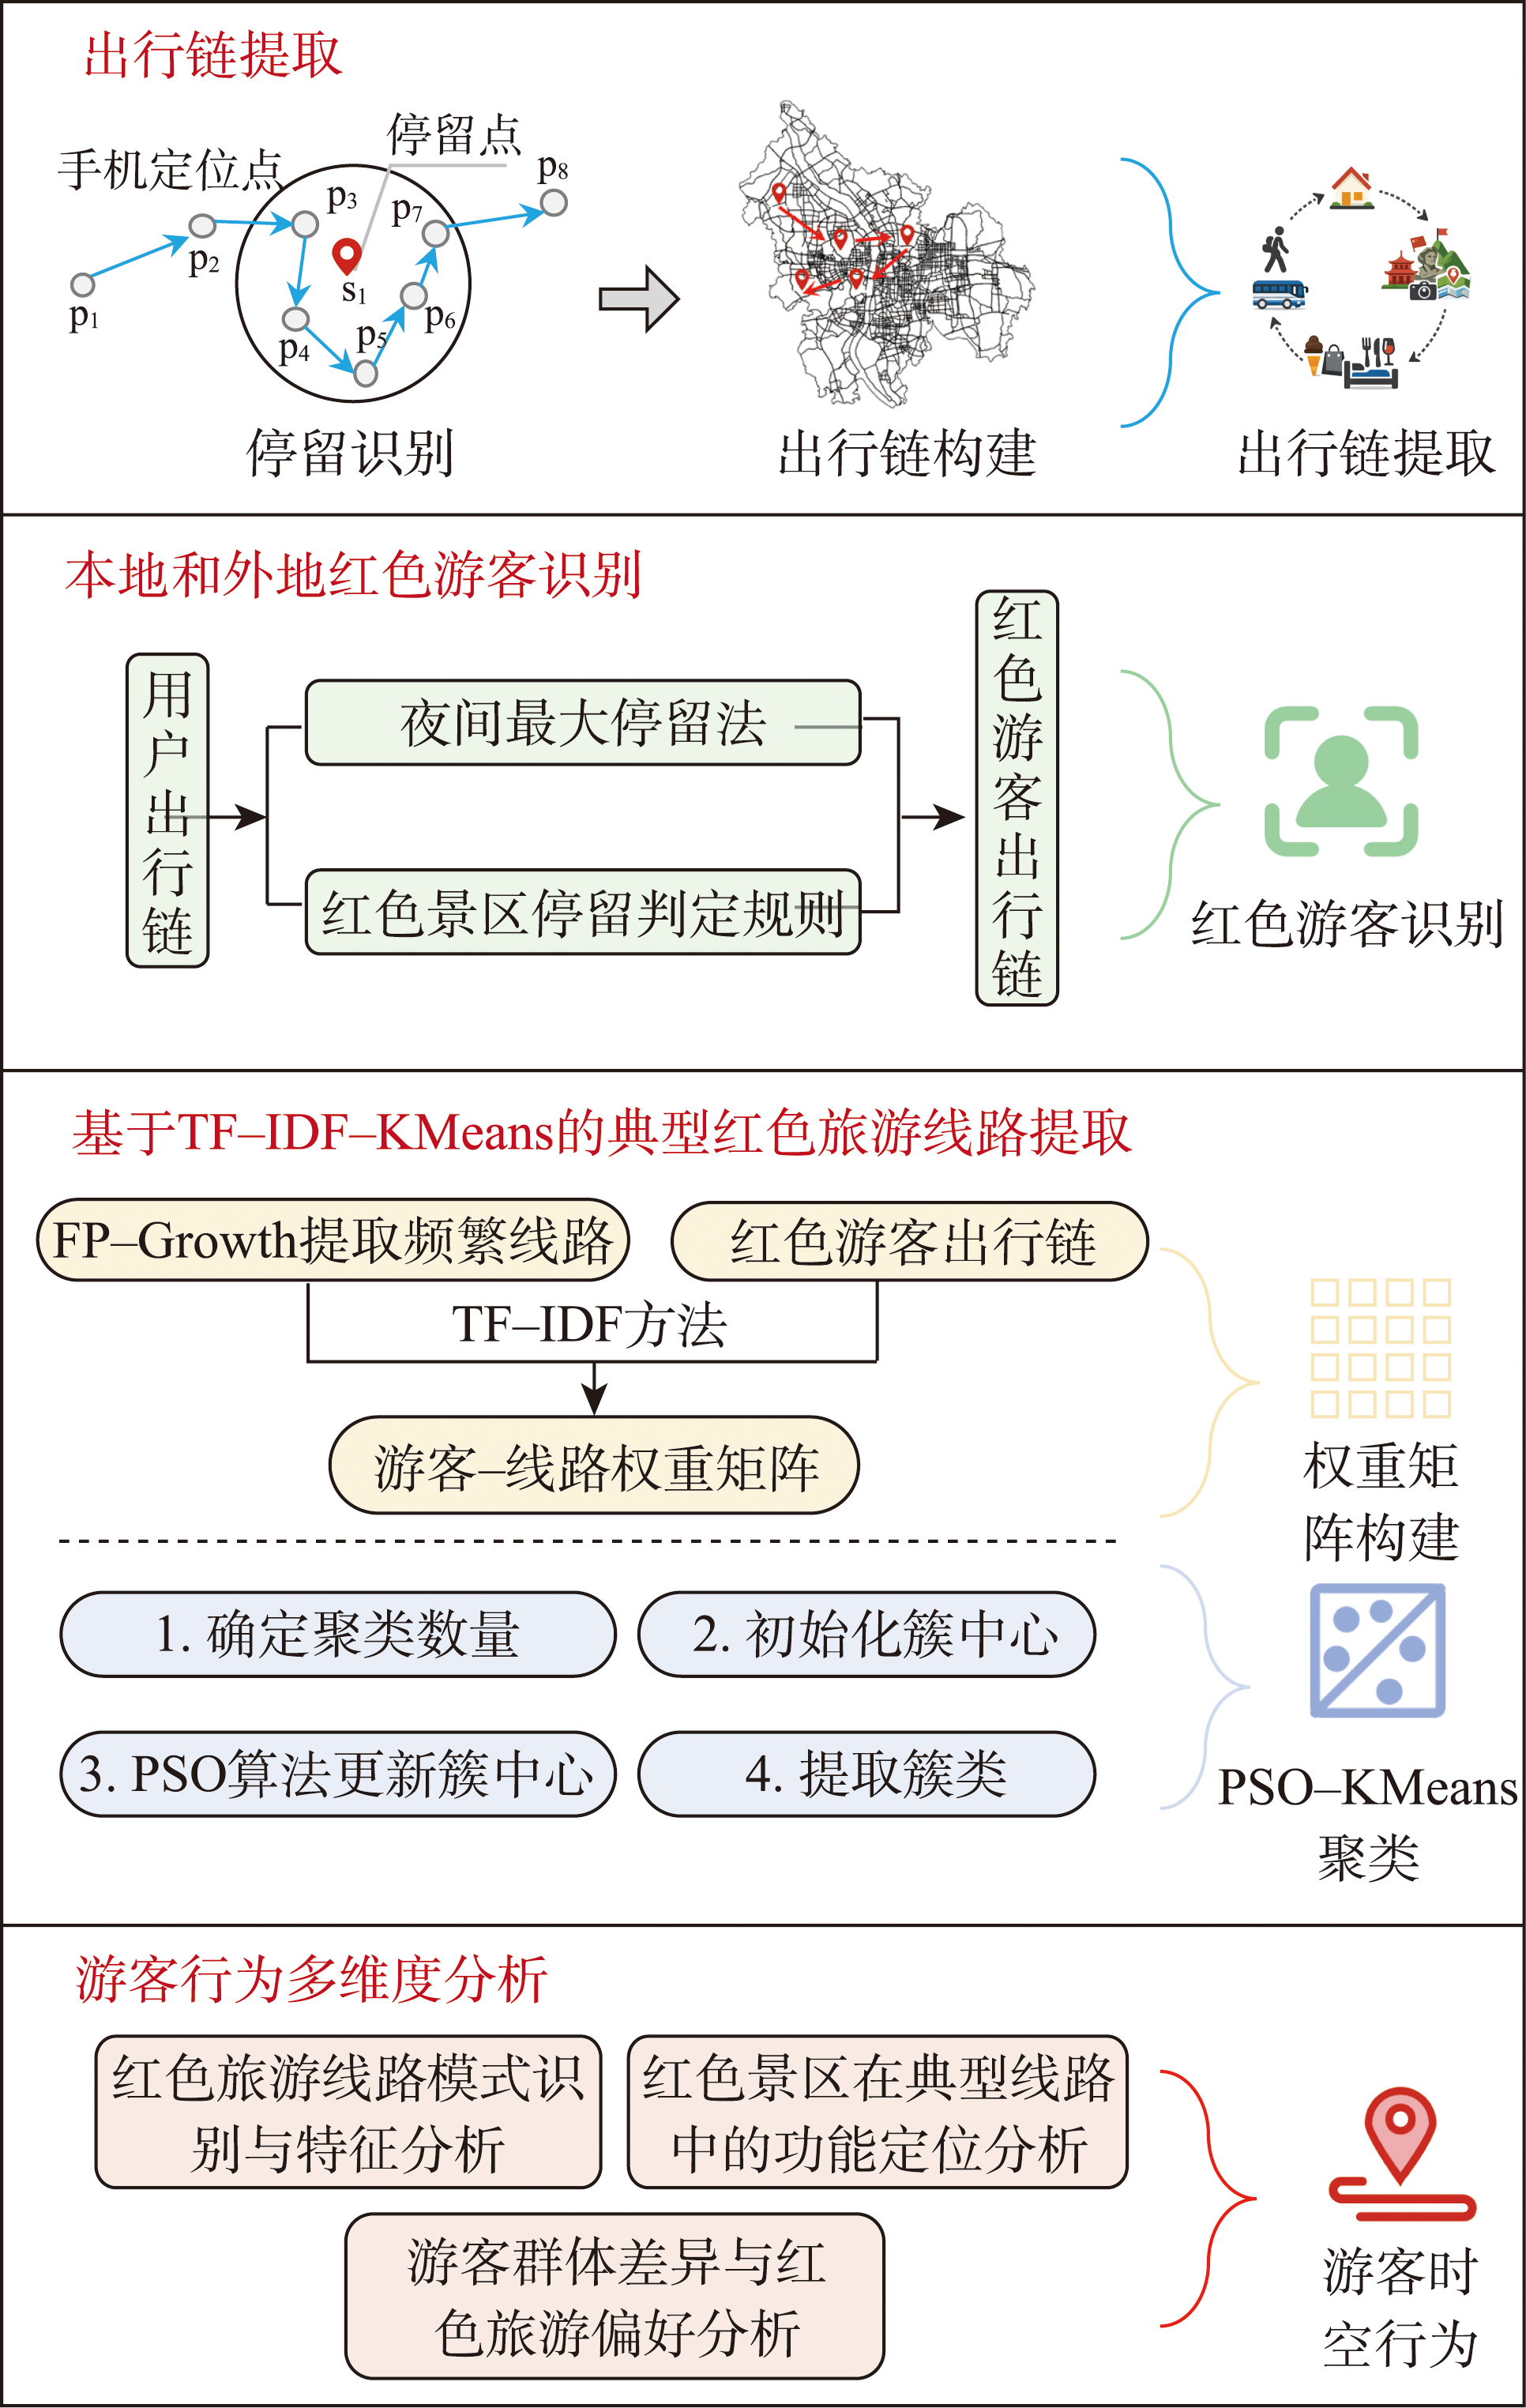
[Objectives] Red tourism plays an important role in inheriting revolutionary culture, promoting patriotic education, and facilitating regional tourism development, and has become an important part of China's tourism system. Existing research primarily focuses on dimensions such as resource conservation, value interpretation, and tourist sentiment analysis. Moreover, the exploration of tourist behavior patterns mainly relies on traditional methods such as path clustering and feature statistics, lacking a systematic framework for identifying typical red tourism routes and comprehensively analyzing tourist behavior patterns. [Methods] This article takes Changsha City as an example, using large-scale mobile location data to construct a TF-IDF-KMeans model that identifies 17 typical red tourism routes, and analyzes them from three dimensions: the temporal and spatial characteristics of tourists on these routes, the functional positioning of red scenic spots, and tourist preferences. [Results] The results show that: (1) The red tourism routes in Changsha can be summarized into six patterns, which significantly differ in spatial distribution, activity intensity, and depth of visits. Among them, the 'red education' pattern has the largest activity radius, demonstrating strong inter-regional mobility; 'red + cultural relics', 'red + leisure and entertainment', and 'red + natural scenery' present a compact and efficient 'special forces' style of travel. (2) There is significant functional differentiation among red scenic spots within the typical routes: Orange Island often serves as a starting point, Yuelu Mountain frequently serves as a hub, and the outer red scenic spots play a supplementary role in the peripheral routes, forming a layered pattern that extends from the core area outward. (3) Tourists exhibit significant group differences in their choices of scenic spots: males prefer political and cultural types, while females tend toward composite leisure types; youth focus on travel efficiency, while middle-aged and older travelers emphasize education and experience; out-of-town tourists prefer panoramic experiences, while local tourists favor short trips with lower time costs. [Conclusions] By introducing the TF-IDF text mining method to systematically identify red tourism routes, this paper expands the research system of tourist spatiotemporal behavior patterns in tourism geography. Simultaneously, it provides theoretical and empirical support for the integration of red tourism resources, route optimization, and the differentiated development of attractions.
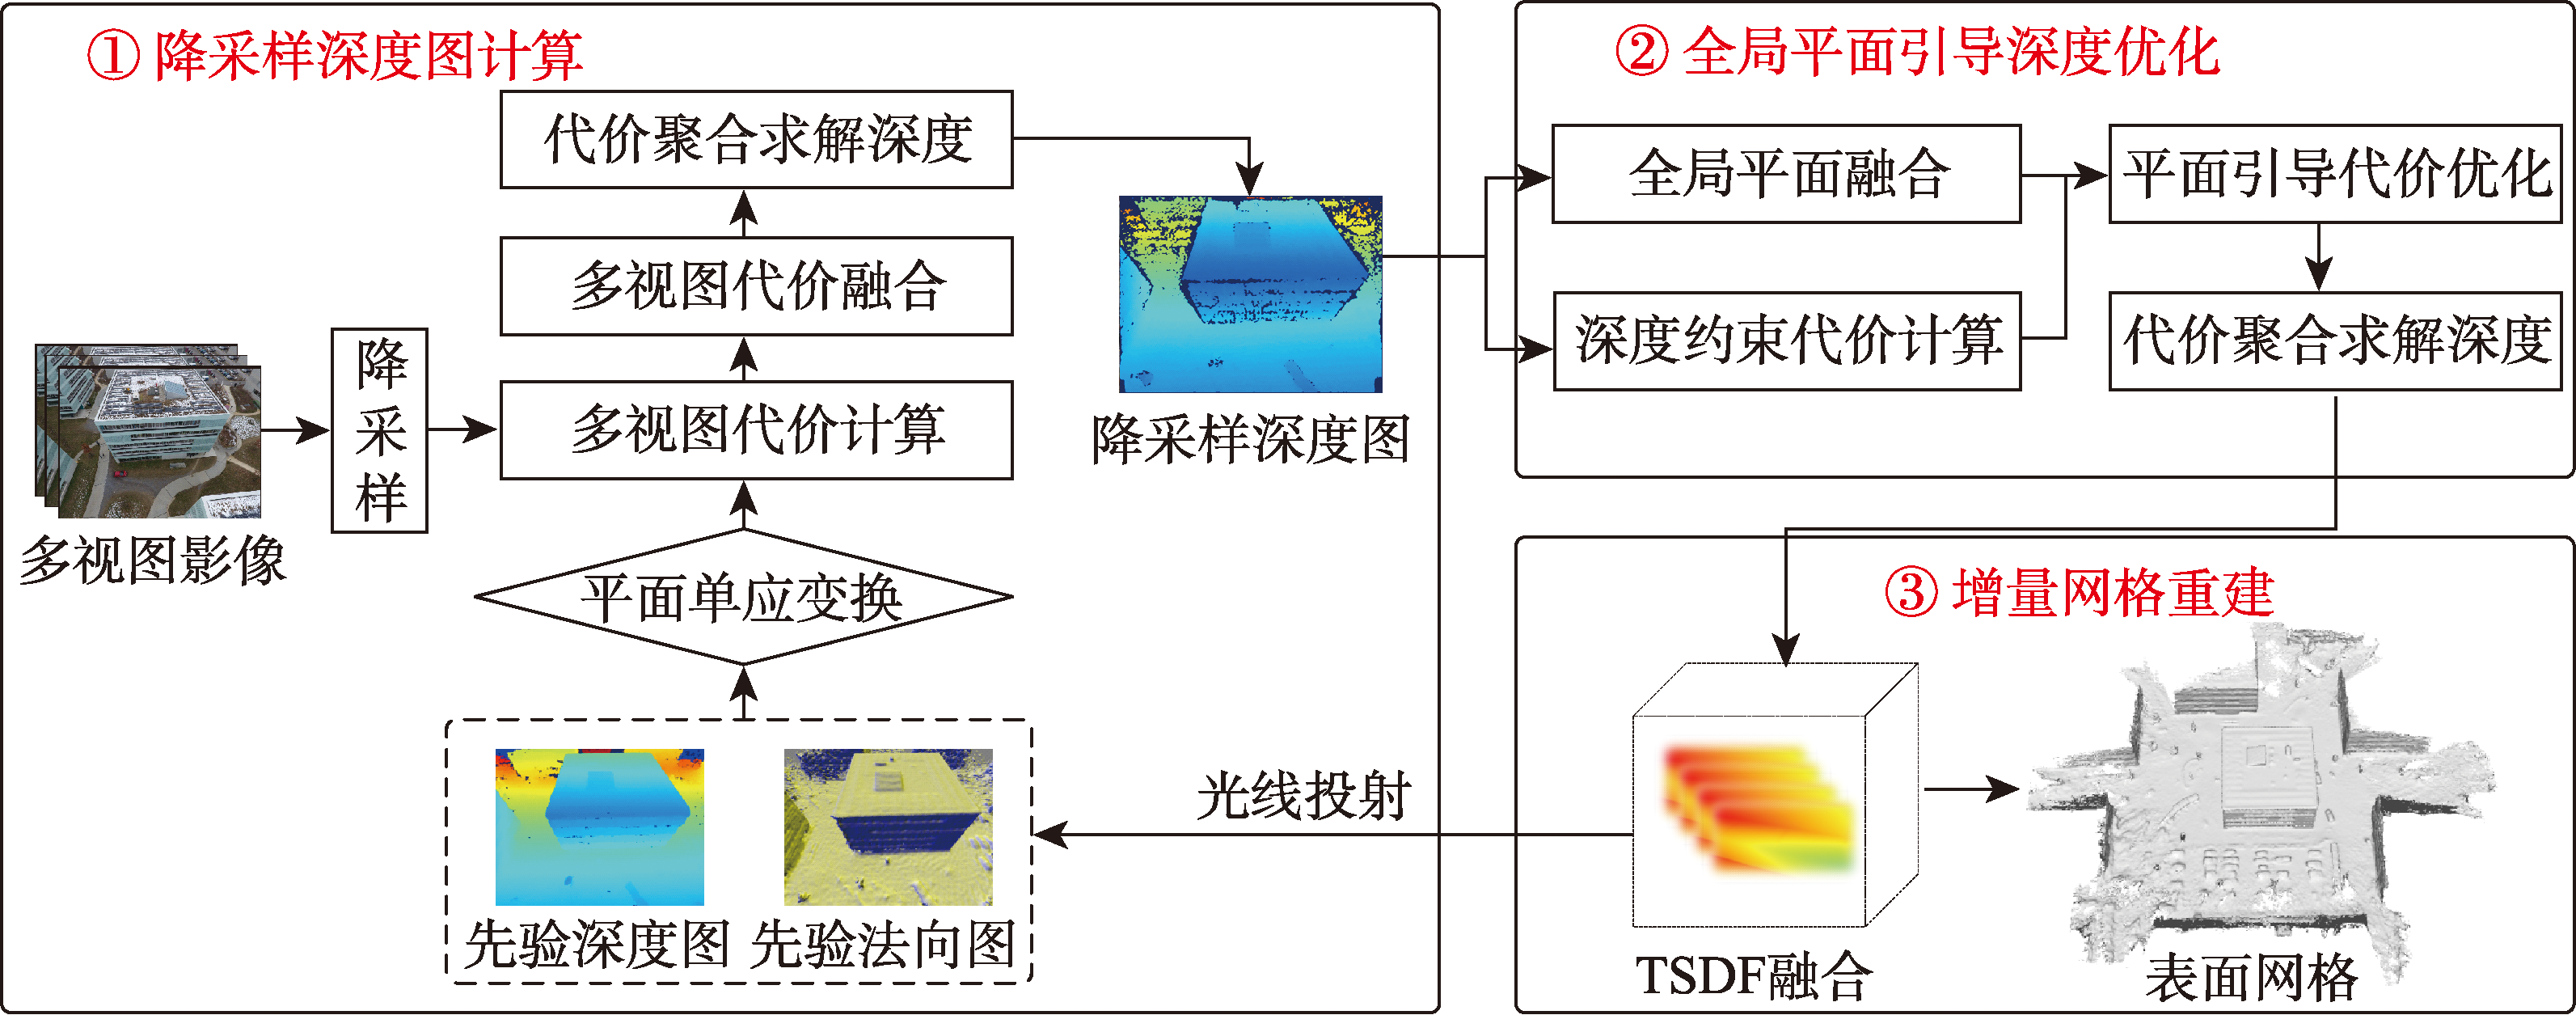
[Objectives] To solve the problem of large time consumption and low quality of traditional depth estimation and mesh reconstruction for UAV imagery, this paper proposes an online depth estimation and mesh reconstruction method for UAV imagery that integrates the truncated signed distance function (TSDF) with global planar prior. [Methods] First, the downsampled prior depth and normal map of the current frame are raycast from the TSDF fused from historical frames, which are then used to compute planar homography transformation to generate multi-view matching cost, thus effectively improving the matching cost accuracy in regions with large disparity variations. In the cost fusion stage, the strategy with cost ratio is adopted to eliminate the mismatched cost in occluded regions, thereby effectively improving the accuracy of the fused matching cost. Finally, the semi-global cost aggregation algorithm is used to obtain the initial downsampled depth map. Second, to obtain a high-resolution depth map, this paper incrementally fuses global planar prior with the initial downsampled depth map, and utilizes the global planar prior to optimize the matching cost of original-resolution images, effectively improving the depth accuracy in low-texture and repetitive-texture regions. Meanwhile, the initial depth is employed to constrain the depth search range, thus reducing the time consumption of cost calculation and aggregation. Finally, the optimized depth map is incrementally fused into the TSDF field to extract the surface mesh. [Results] The qualitative and quantitative experiments with four typical regions of UAV imagery are conducted to demonstrate the effectiveness of the proposed method in this paper. The experimental results show that the proposed method can generate accurate and complete depth map and surface mesh. The mean absolute error (MAE) of the depth map and surface mesh generated by the proposed method is less than 0.232 m and 0.196 m, respectively. Compared with the most accurate method in the comparison, Mobile3DRecon, the accuracy of the proposed method is improved by 19.2% and 19.3%, respectively. In addition, the average single-frame reconstruction time consumption of the proposed method is reduced by 39.9% and 32.1% compared with PatchmatchNet and Mobile3DRecon, respectively, achieving an online reconstruction rate of better than 1 second per frame. [Conclusions] The proposed method effectively improves the accuracy and completeness of depth estimation and mesh reconstruction in regions with low-texture, repetitive-texture, and large disparity variations. It can meet the requirements of online reconstruction of UAV imagery and has potential application value for scenes that need rapid acquisition of depth and mesh such as natural disaster emergency response.
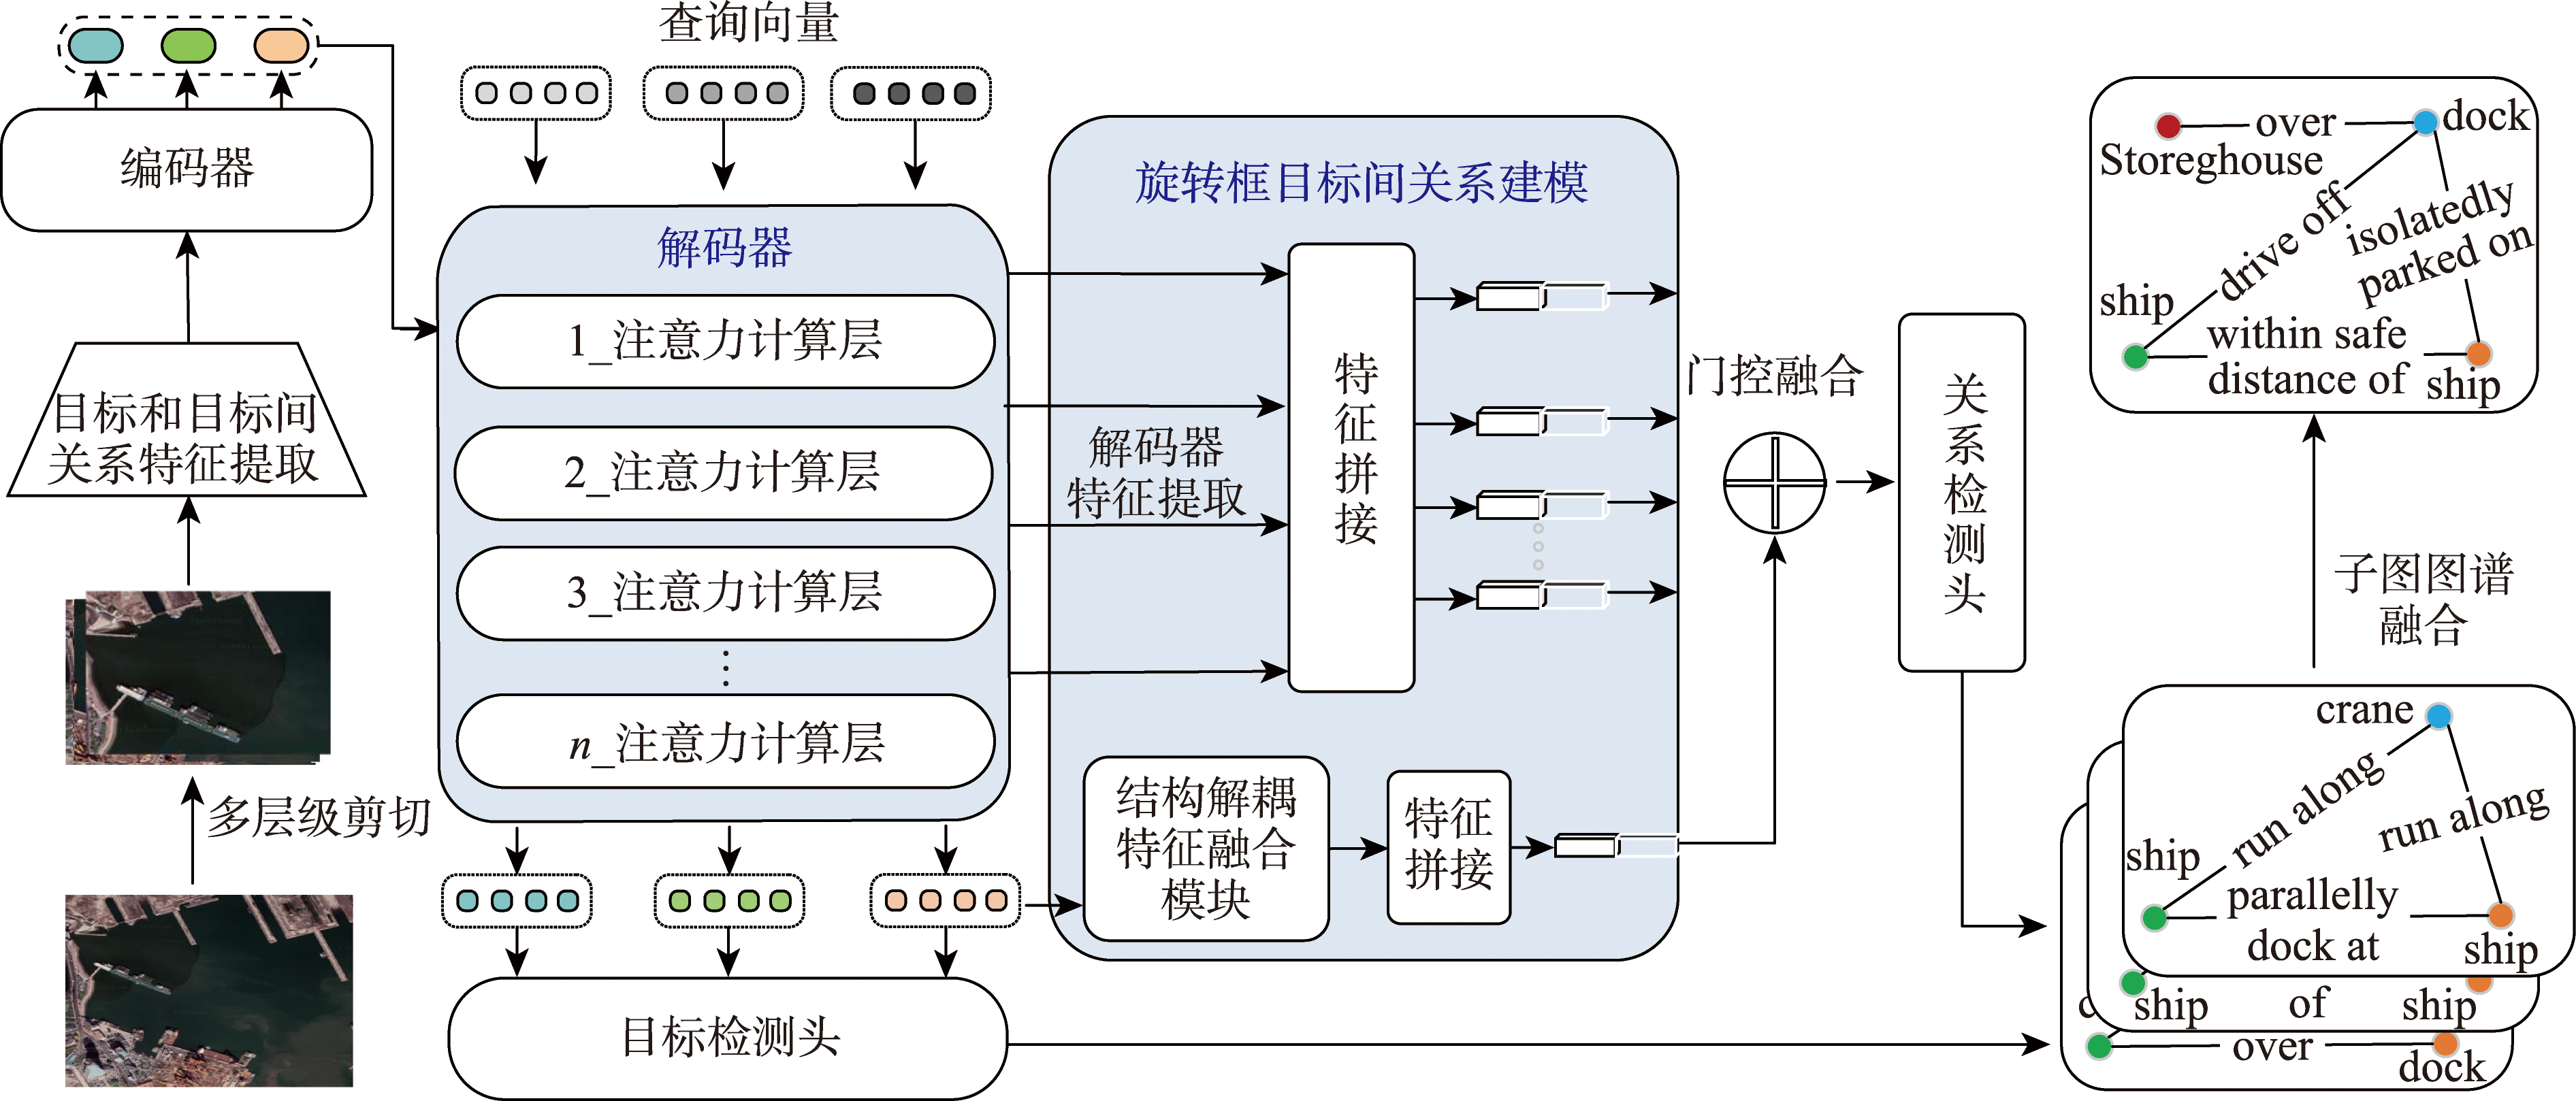
[Objectives] Scene Graph Generation (SGG) aims to construct a structured graph that describes target entities and their interactive relationships, which is a key technology for realizing high-level semantic understanding of remote sensing images. However, existing methods face severe challenges when facing scenes with dense targets in rotated bounding boxes (such as parking lots and aprons). Single-stage methods have poor model robustness when the number of relationships explodes due to their reliance on explicit triplet queries, and generally lack support for rotated bounding boxes. Two-stage methods, due to their cascaded architecture of first detecting targets and then discriminating relationships, lead to error propagation and a large number of parameters, making them difficult to be practically applied.[Method] To break through the above bottlenecks, this paper proposes RotatedSGG, the first single-stage framework for rotated bounding box targets. This architecture first integrates an adaptive large kernel selection mechanism (LskNet), which effectively addresses the challenge of large target scale differences in remote sensing images and enhances the ability to perceive multi-scale targets and complex contexts. Secondly, it abandons explicit queries and adapts the implicit global relationship modeling mechanism to the single-stage rotated bounding box target detector, enabling efficient and robust modeling of complex relationships between dense rotated targets. At the same time, it innovatively fuses multiple features output by the decoder to construct a center-point-guided relationship representation, which collaboratively integrates the global position and local contour information of the target, significantly improving the relationship discrimination ability. Finally, to solve the problem of incompatibility with large-format images, a post-processing strategy of block training and seamless fusion of panoramic relationship graphs is designed, which avoids the fragmentation problem caused by local reasoning and realizes high-precision and spatially consistent panoramic relationship reconstruction. [Results] On STAR, the first large-scale dataset of large satellite images for scene graph generation, for the scene graph detection task SGDet, RotatedSGG improves the recall rate R@k (k=20/50/100) by 0.49%/0.9%/1.25% compared with the mainstream single-stage method EGTR. Furthermore, it only requires about 1/10 of the parameters of the cascaded two-stage method, with the mean multi-label recall mMR@k (k=1 500/2 000) reaching 13.99%/14.47% and the harmonic multi-label recall HMR@k (k=1 500/2 000) reaching 18.57%/19.10%. Compared with the current optimal two-stage method RPCM, it leads by 2.46%/2.40% in mMR@k(k=1 500/2 000) and 2.37%/2.14% in HMR@k(k=1 500/2 000). [Conclusions] RotatedSGG, designed for scenes with dense rotated bounding box targets, with its lightweight design and stable performance, effectively addresses the challenges of scene graph generation under such conditions and provides a feasible solution for the structured understanding of remote sensing images.
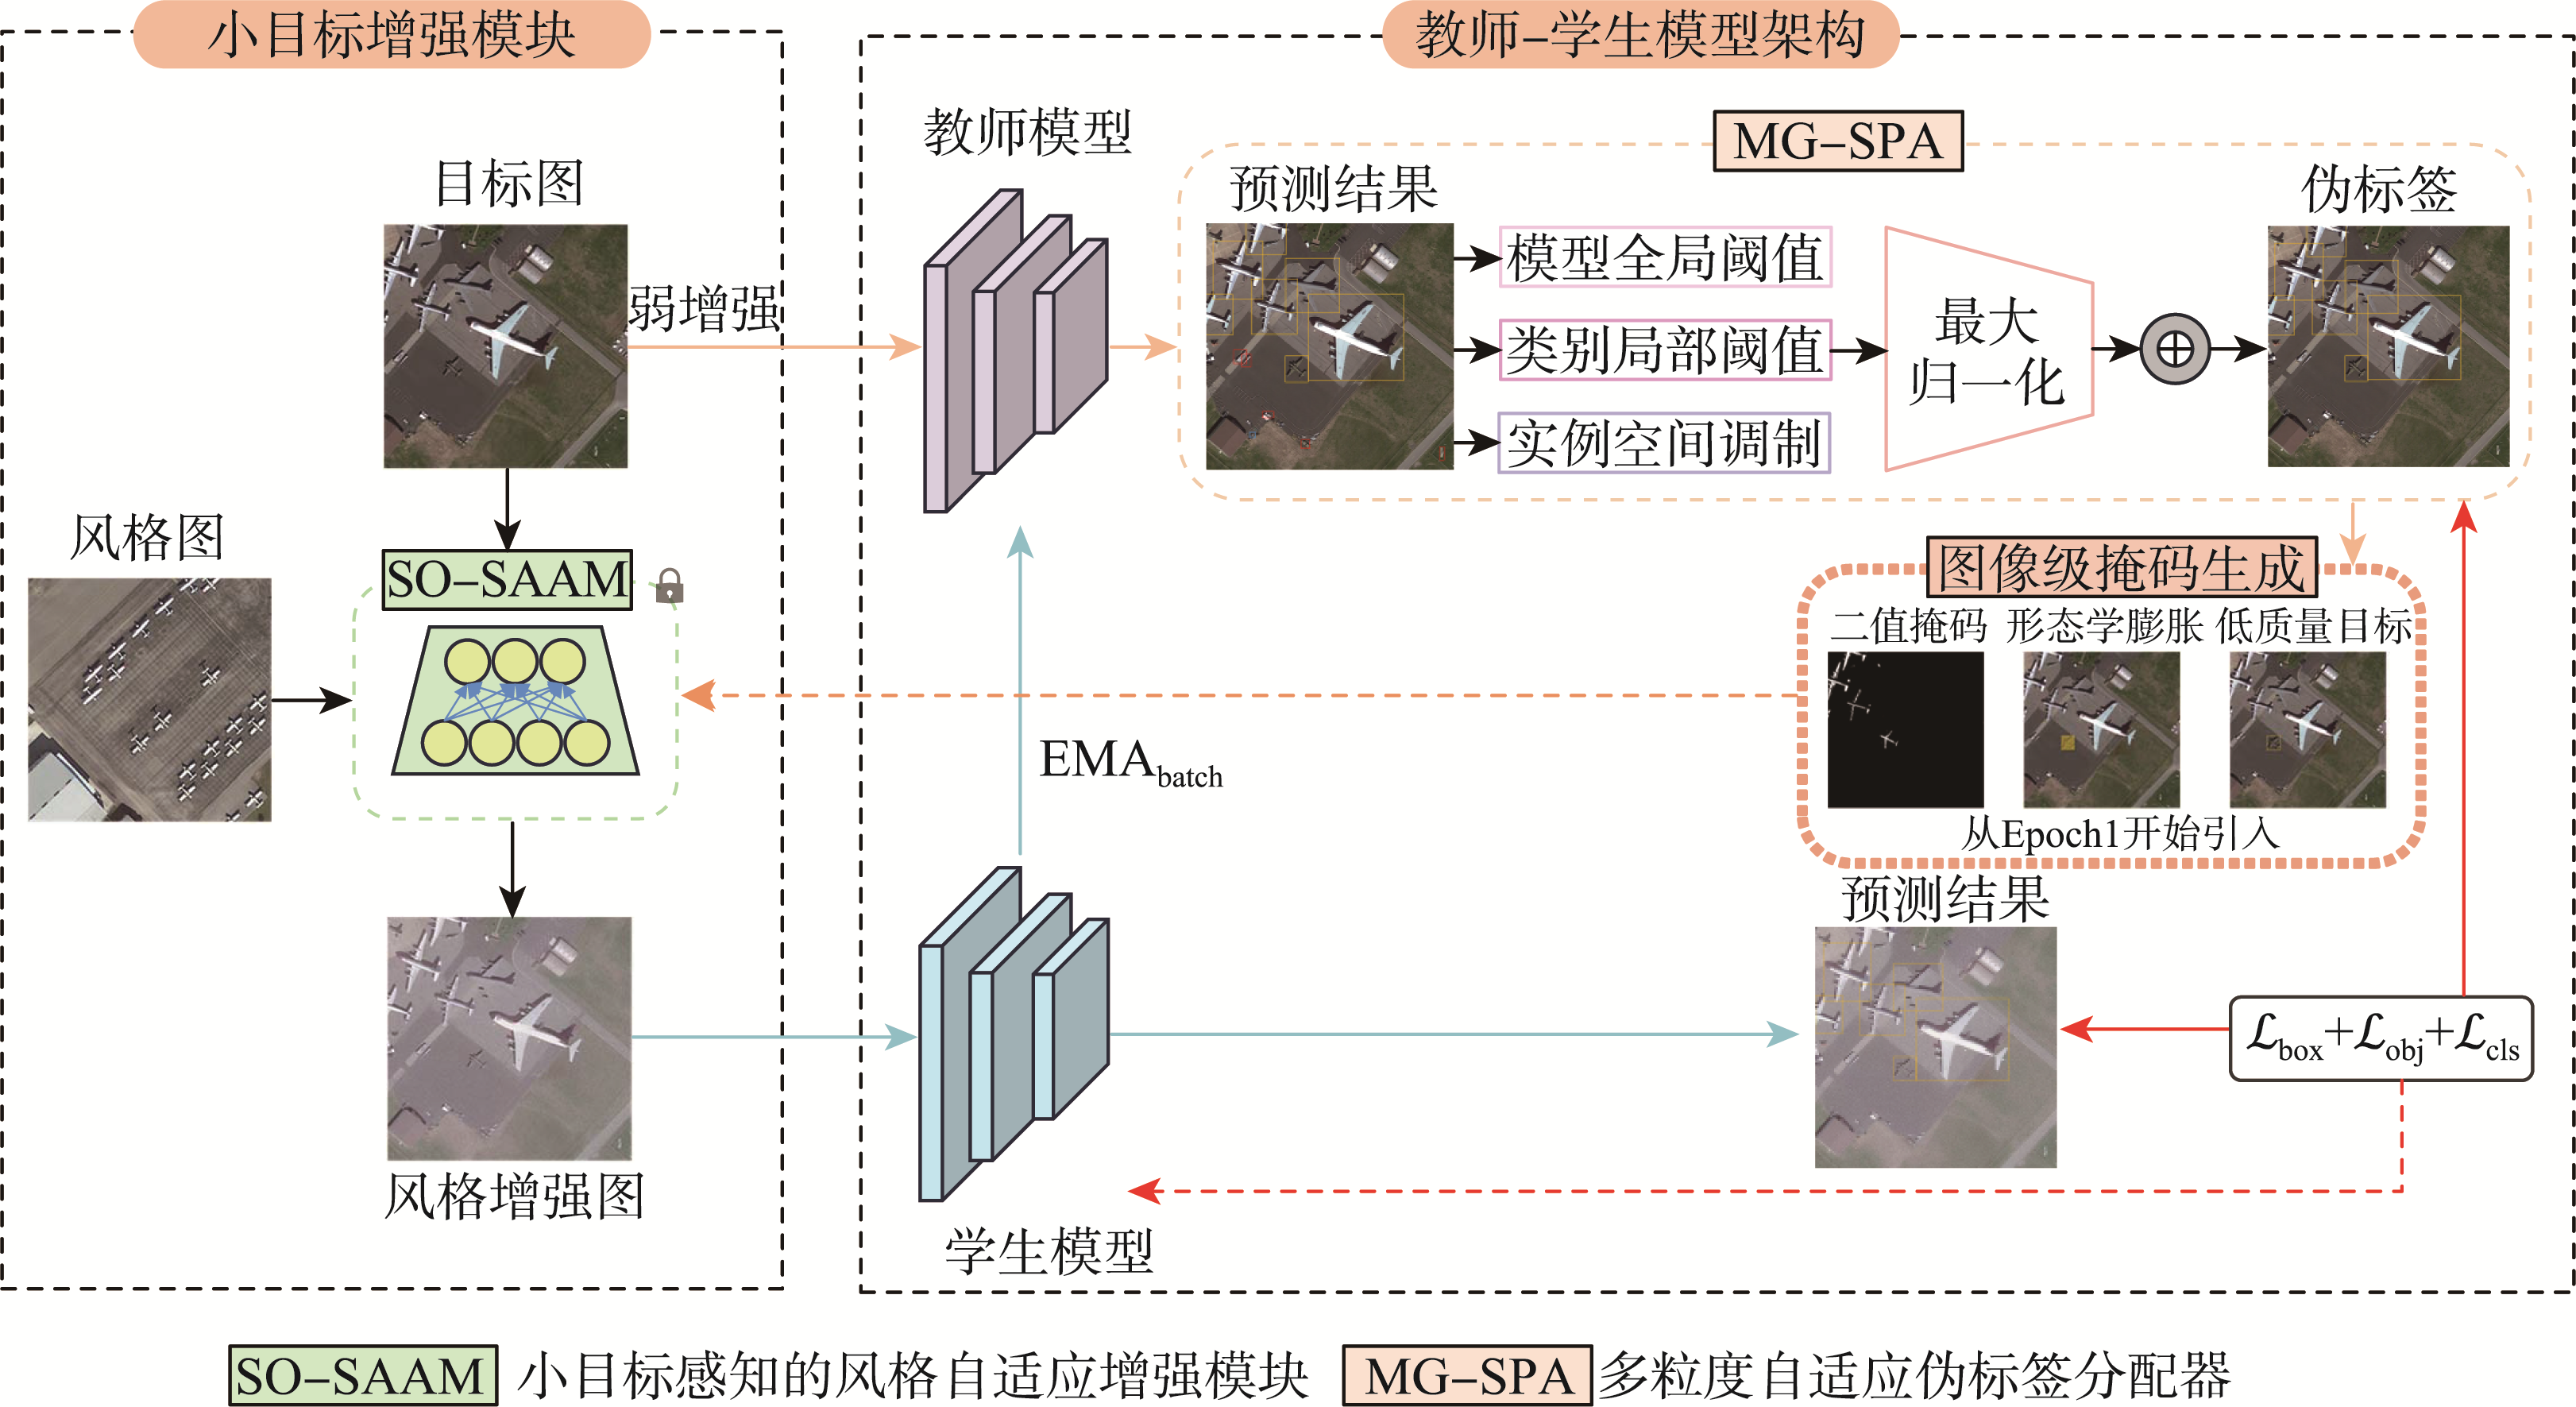
[Objectives] Remote sensing images often exhibit significant domain discrepancies due to variations in imaging sensors, climatic conditions, and geographical environments, leading to a degradation in the generalization performance of object detection models in real-world applications. This issue is particularly pronounced for small objects, which are characterized by sparse features and high sensitivity to style variations. [Methods] To address these challenges, this paper proposes a domain-adaptive detection method for small remote sensing targets based on FFCA-YOLO, termed DA-FFCA.Built upon the mean teacher framework, the model introduces two core innovations: 1) Small-Object-Aware Style Adaptive Augmentation Module (SO-SAAM),which integrates a Constrained Adaptive Instance Normalization (C-AdaIN) strategy with a Feature-level Small ObjectMask Protection (F-SOMP) mechanism. C-AdaIN employs a lightweight network to fuse the mean and variance of features from source and target domains, while imposing statistical constraints to prevent distortion of small object features. F-SOMP leverages pseudo-labels generated by the teacher model to construct masks that preserve the original features of small object regions during style transfer, thereby enhancing stylistic diversity without compromising structural information. 2) Multi-Granularity Self-adaptive Pseudo-label Assigner (MG-SPA),which dynamically adjusts pseudo-label filtering thresholds at three granularities: model-level, category-level, and instance-level. At the model level, a truncated mean combined with exponential moving average (EMA) updates a global threshold to resist outlier interference. At the category level, a weighted quantile center captures the confidence distribution of each category, and thresholds are independently updated to mitigate long-tail distribution issues. At the instance level, a spatial modulation factor based on bounding box area enables scale-adaptive threshold adjustment. The synergy of these three levels effectively filters low-quality pseudo-labels and enhances training stability. [Results] Extensive experiments are conducted on three challenging cross-domain scenarios: cross-satellite, UAV-to-satellite, and virtual-to-real. The proposed DA-FFCA achieves mAP scores of 63.8%, 67.3%, and 72.2% on the target domains, respectively. These results not only significantly outperform the baseline model trained solely on the source domain (with improvements ranging from 12% to 14.4%), but also surpass various mainstream domain adaptation methods such as SFA, EPM, SFYOLO, PM-DETR, and MRT. Ablation studies confirm that the SO-SAAM and MG-SPA modules contribute 5.7% and 3.5% accuracy gains, respectively, validating their effectiveness. Furthermore, the model maintains a compact size of only 7.1M parameters and achieves an inference speed of 107 FPS, demonstrating an excellent balance between accuracy and efficiency. [Conclusions] The DA-FFCA method exhibits stable domain adaptation capabilities across diverse imaging conditions, platform origins, and virtual-real scenarios, confirming its effectiveness and robustness in real-world cross-domain applications. This approach offers a viable solution for training high-performance detection models using low-cost synthetic data, holding great promise for advancing remote sensing object detection.
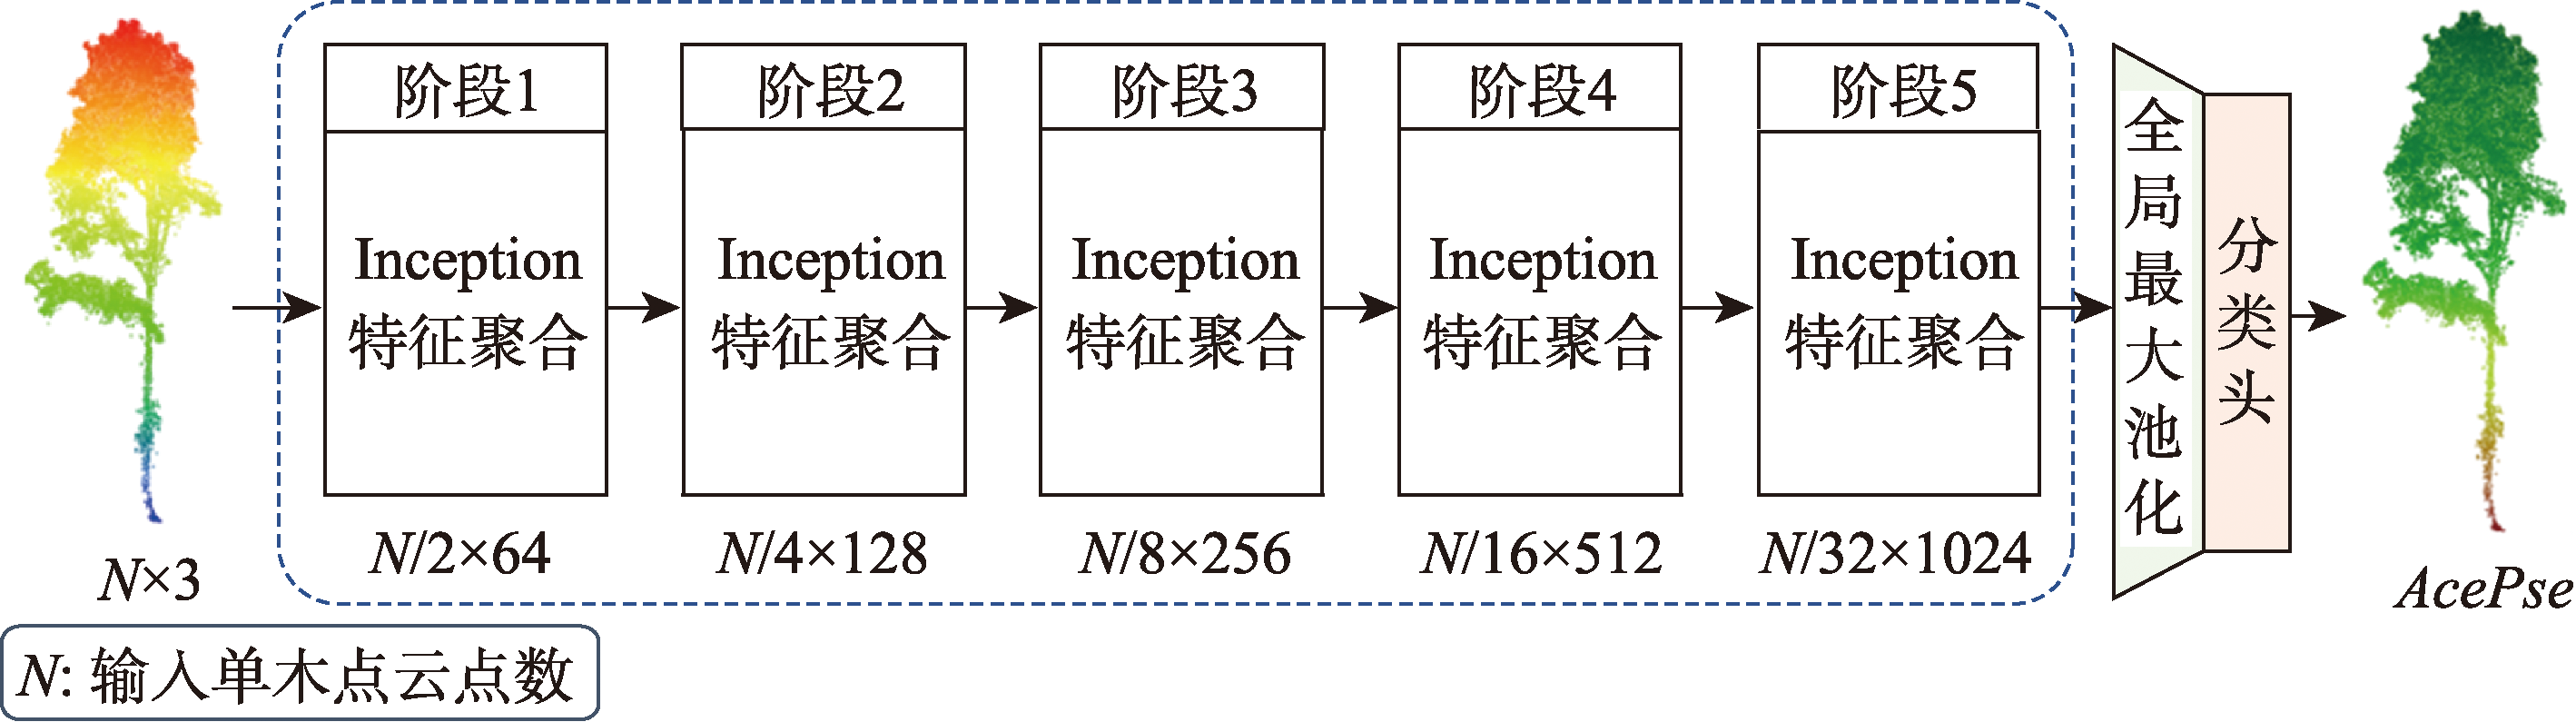
[Objectives] Individual-tree species classification is fundamental to fine-scale forest inventory, biodiversity assessment, and the monitoring of rare or protected species. For UAV laser scanning (ULS), however, individual-tree point clouds commonly exhibit strong vertical density heterogeneity: canopy regions are densely sampled while stems and lower crowns are sparsely sampled. When conventional sampling strategies (e.g., farthest point sampling, FPS) are repeatedly applied during progressive down-sampling, the representation bias toward high-density canopy points may be amplified across network stages, thereby weakening structurally critical but low-density regions (e.g., stems) that are essential for distinguishing species with similar crown appearances. [Methods] To address this issue, we propose TreeConT, a Transformer-style network designed to preserve vertical structural cues in ULS individual-tree point clouds. TreeConT incorporates two complementary components. First, we introduce Tree-FPS, a vertical-structure-aware progressive sampling strategy used inside the network’s multi-stage down-sampling. Tree-FPS performs height-wise stratification and allocates per-stratum sampling quotas using an inverse-density principle, followed by local FPS within each stratum, so that sparse stem and mid-lower canopy regions remain sufficiently represented throughout feature abstraction. Second, we enhance the input representation by fusing xyz coordinates with LiDAR intensity and three geometric descriptors (DA1-DA3) that capture complementary shape cues. We evaluate TreeConT on the SYSSIFOSS ULS dataset collected over twelve 1-hm2 forest plots in Germany across multiple phenological phases (Aug-Sep 2019; Dec 2020; Mar-Apr 2021), with an overall point density of approximately 797~1 554 pts/m². After denoising, ground filtering, and individual-tree segmentation, we construct an 11-class dataset (TreeNetXplorer) containing 18,749 trees and perform stratified random splitting into training/validation/test sets (11 175/3, 637/3 937; 60%/20%/20%). During training, each tree is sampled to 4 096 points, and data augmentation includes Z-axis rotation and scaling. [Results] Experiments implemented in a PyTorch environment demonstrate that TreeConT achieves OA = 93.12%, Macro-F1 = 91.66%, and Kappa = 0.920 7, outperforming representative baselines including PointNet++, DGCNN, PointTransformer, PointNeXt, PointMLP, Mamba3D, and the strong baseline PointConT (OA = 91.31%, Kappa = 0.900 0). Controlled comparisons further show that replacing only the in-network progressive down-sampling strategy (FPS → Tree-FPS) reduces confusion for several hard classes; for example, recall of CarBet (Carpinus betulus) increases from 53.82% to 66.18%. Feature ablations indicate that both intensity and geometric descriptors provide consistent improvements, and the full combination (xyz + DA1-DA3 + intensity) yields the best performance, improving OA by 14.27 percentage points over xyz-only (78.85% → 93.12%). [Conclusions] By explicitly mitigating vertical sampling bias via Tree-FPS and strengthening representation through geometry-intensity fusion, TreeConT better preserves stem-canopy structural cues and improves individual-tree species classification in mixed forests using ULS point clouds. The proposed strategy is especially beneficial when vertical density imbalance is pronounced and provides a practical direction for robust individual-tree recognition in structurally complex forest stands.
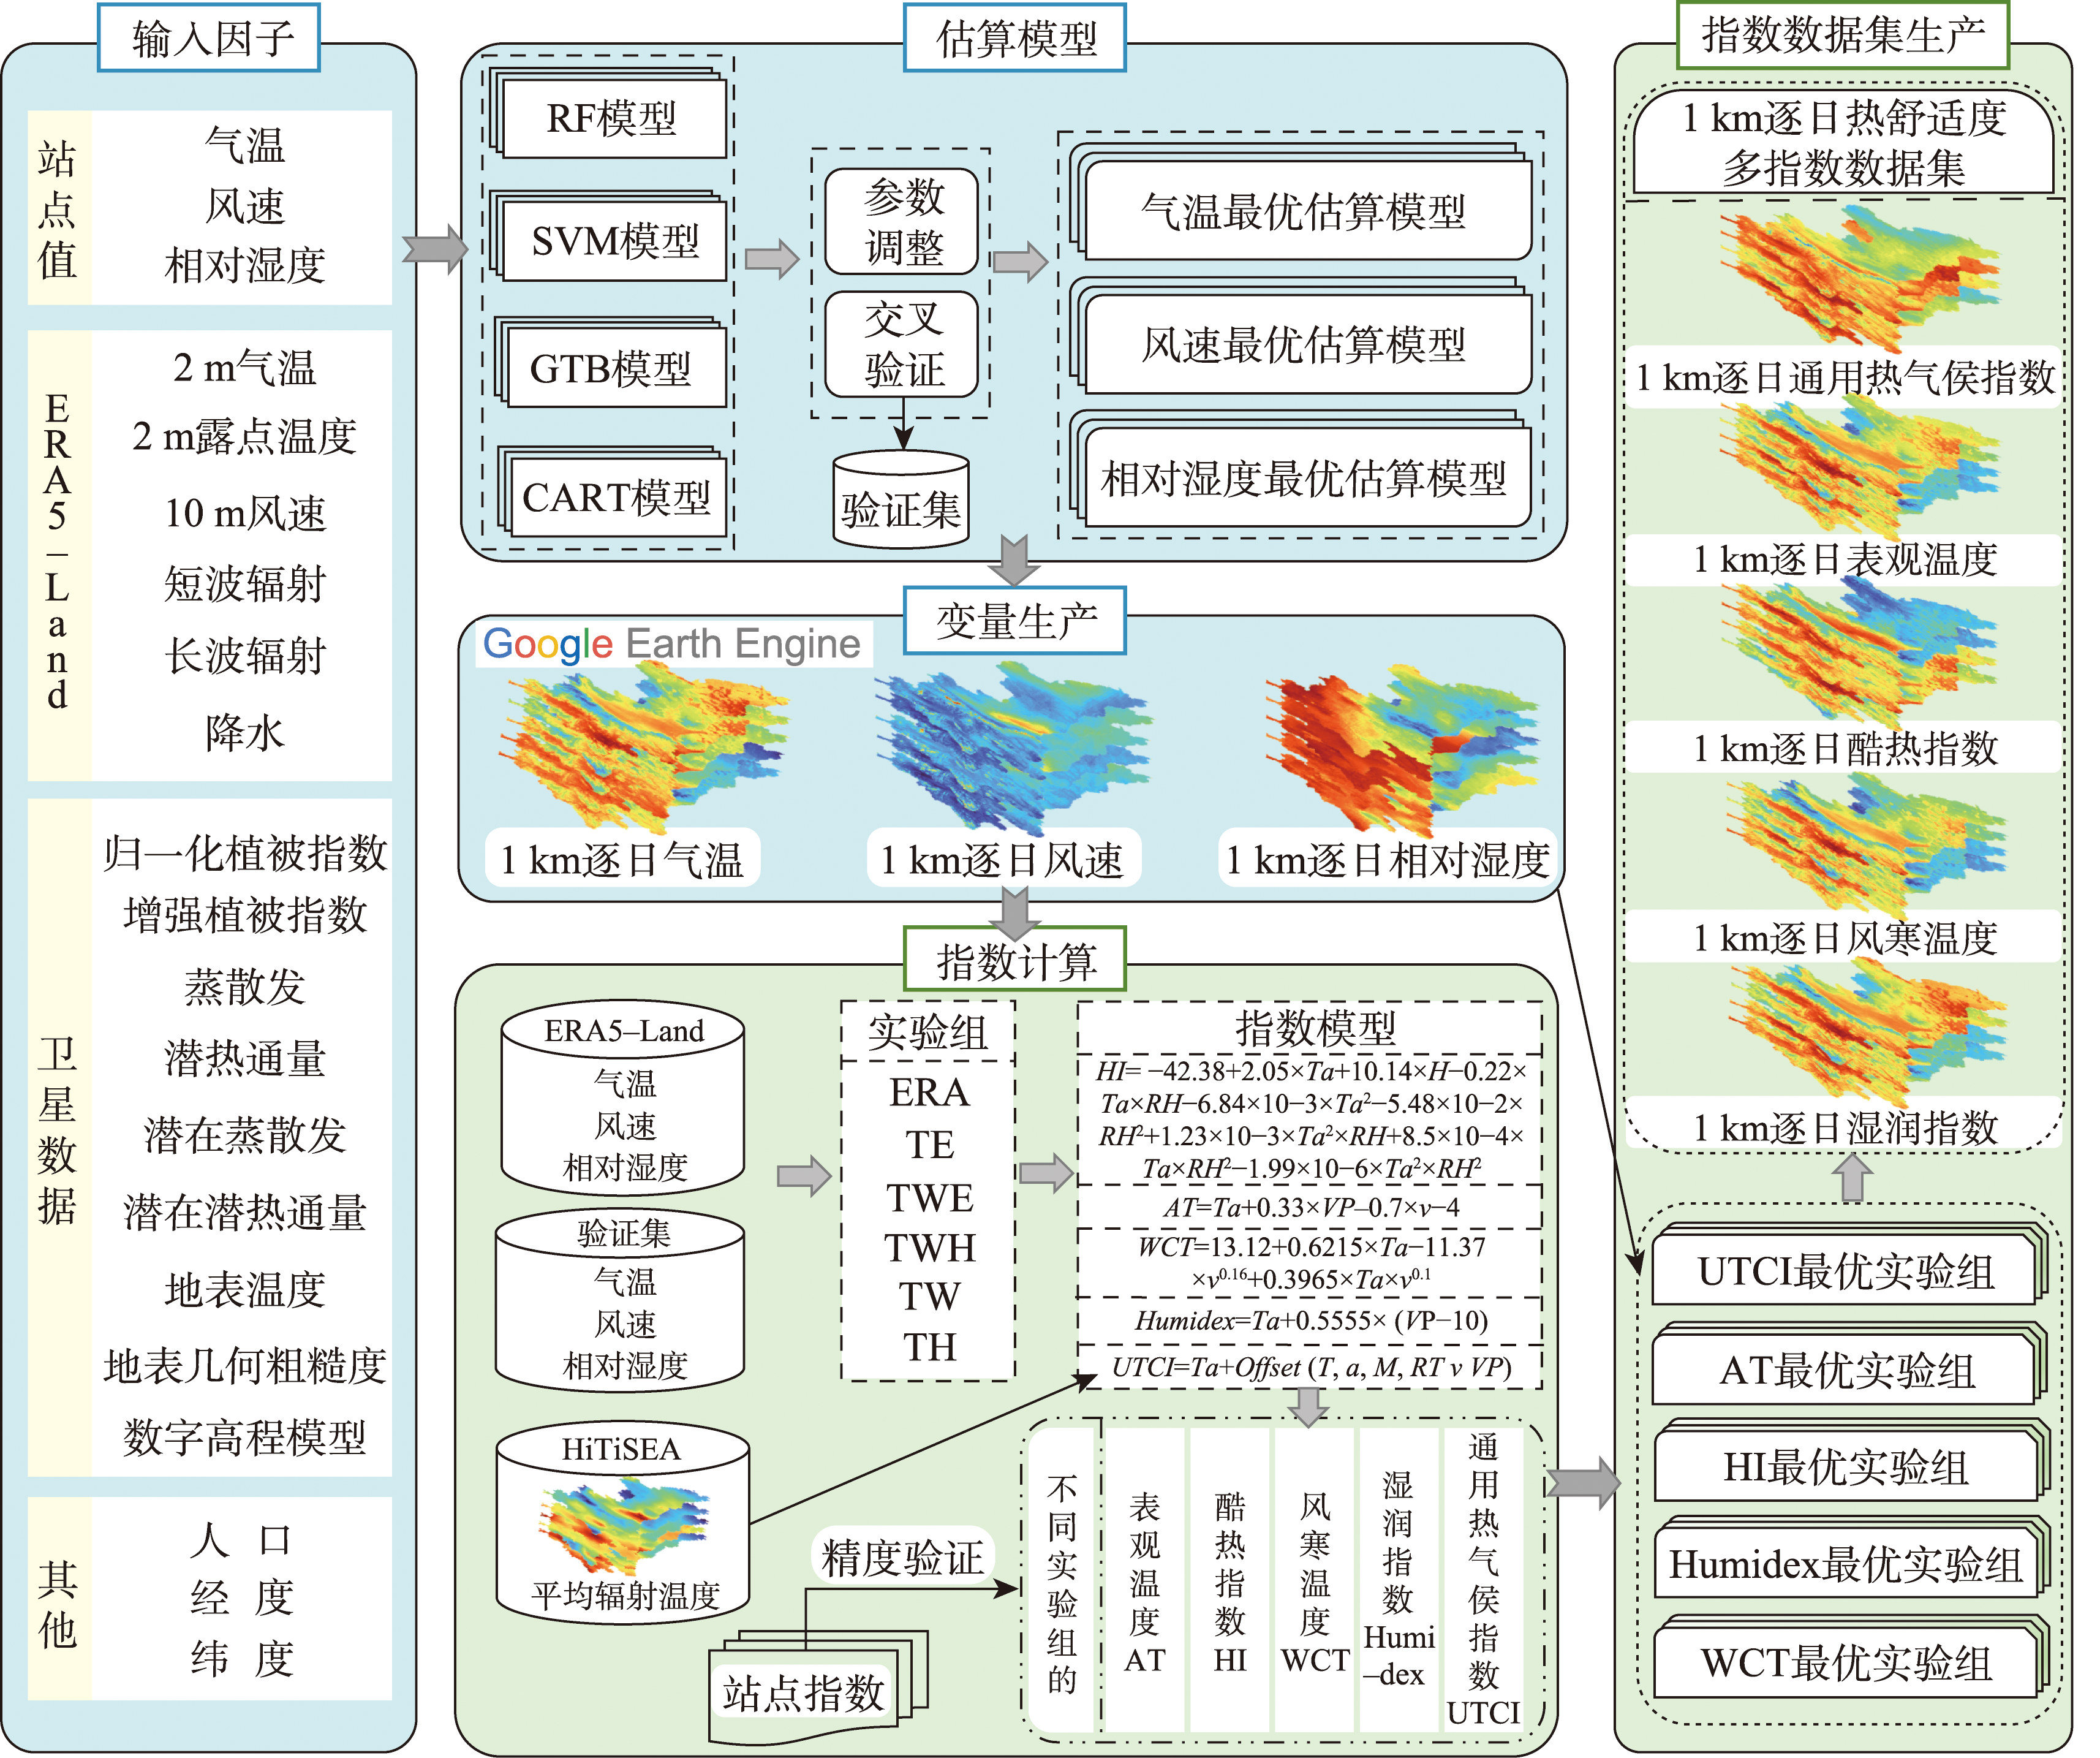
[Objectives] In the context of global warming, climate change has led to an increasing frequency and intensity of extreme weather events, posing serious threats to the stability of global environment and human public health. Thermal comfort indices, which quantify the degree of human physiological comfort under varying climatic conditions, are essential scientific tools in climate-related health assessments and urban climate research. However, existing publicly available datasets often suffer from limitations in temporal or spatial resolution, failing to meet the rigorous requirements for fine-grained regional climate analysis. [Methods] To address this issue, this study proposes and develops a high-resolution production framework for a multi-index thermal comfort dataset by integrating multi-source spatiotemporal data on the Google Earth Engine (GEE) platform. First, variable-specific input driver sets were constructed according to the characteristics of air temperature, wind speed, and relative humidity. Leveraging the powerful cloud computing capabilities of GEE, the estimation accuracy of key meteorological variables (air temperature, wind speed, and relative humidity ) was then evaluated using different machine learning algorithms. The optimal model was then selected to generate 1 km high-resolution meteorological variables. Subsequently, Mean Radiant Temperature (MRT) together with the estimated 1 km meteorological variables was incorporated into the standard calculation models of each thermal comfort index to derive the final dataset. [Results] A daily 1 km multi-index thermal comfort dataset for Shaanxi Province in 2019 was constructed, including the Universal Thermal Climate Index (UTCI), Apparent Temperature (AT), Heat Index (HI), Humidex, and Wind Chill Temperature (WCT). The empirical results show that: (1) among the models supported by GEE, the Random Forest algorithm performed best in estimating air temperature, wind speed, and relative humidity, demonstrating superior robustness with R² values of 0.982, 0.667, and 0.870, respectively; (2) the generated air temperature and relative humidity estimates exhibited high spatial and temporal agreement with station observations, while wind speed showed relatively lower accuracy in areas with complex terrain due to the influence of local topography; (3) based on the 5-fold cross-validation results using 2019 station observation data in Shaanxi Province, the use of high-resolution meteorological inputs significantly enhanced the spatial detail and estimation accuracy of the thermal comfort indices, all of which achieved R² values above 0.968 and RMSE values ranging from 1.362 °C to 2.441 °C. Furthermore, comparisons with existing thermal comfort datasets and station observations suggest that the proposed dataset provides higher spatiotemporal resolution, enhanced spatial detail, and more reliable estimation accuracy, effectively capturing the spatial heterogeneity of the thermal environment. [Conclusions] The proposed production framework demonstrates strong technical feasibility and universal applicability. It provides high-resolution thermal comfort data to support regional-scale thermal environment analysis, urban planning, and assessments of human heat exposure risk under the challenges of future extreme climatic conditions.
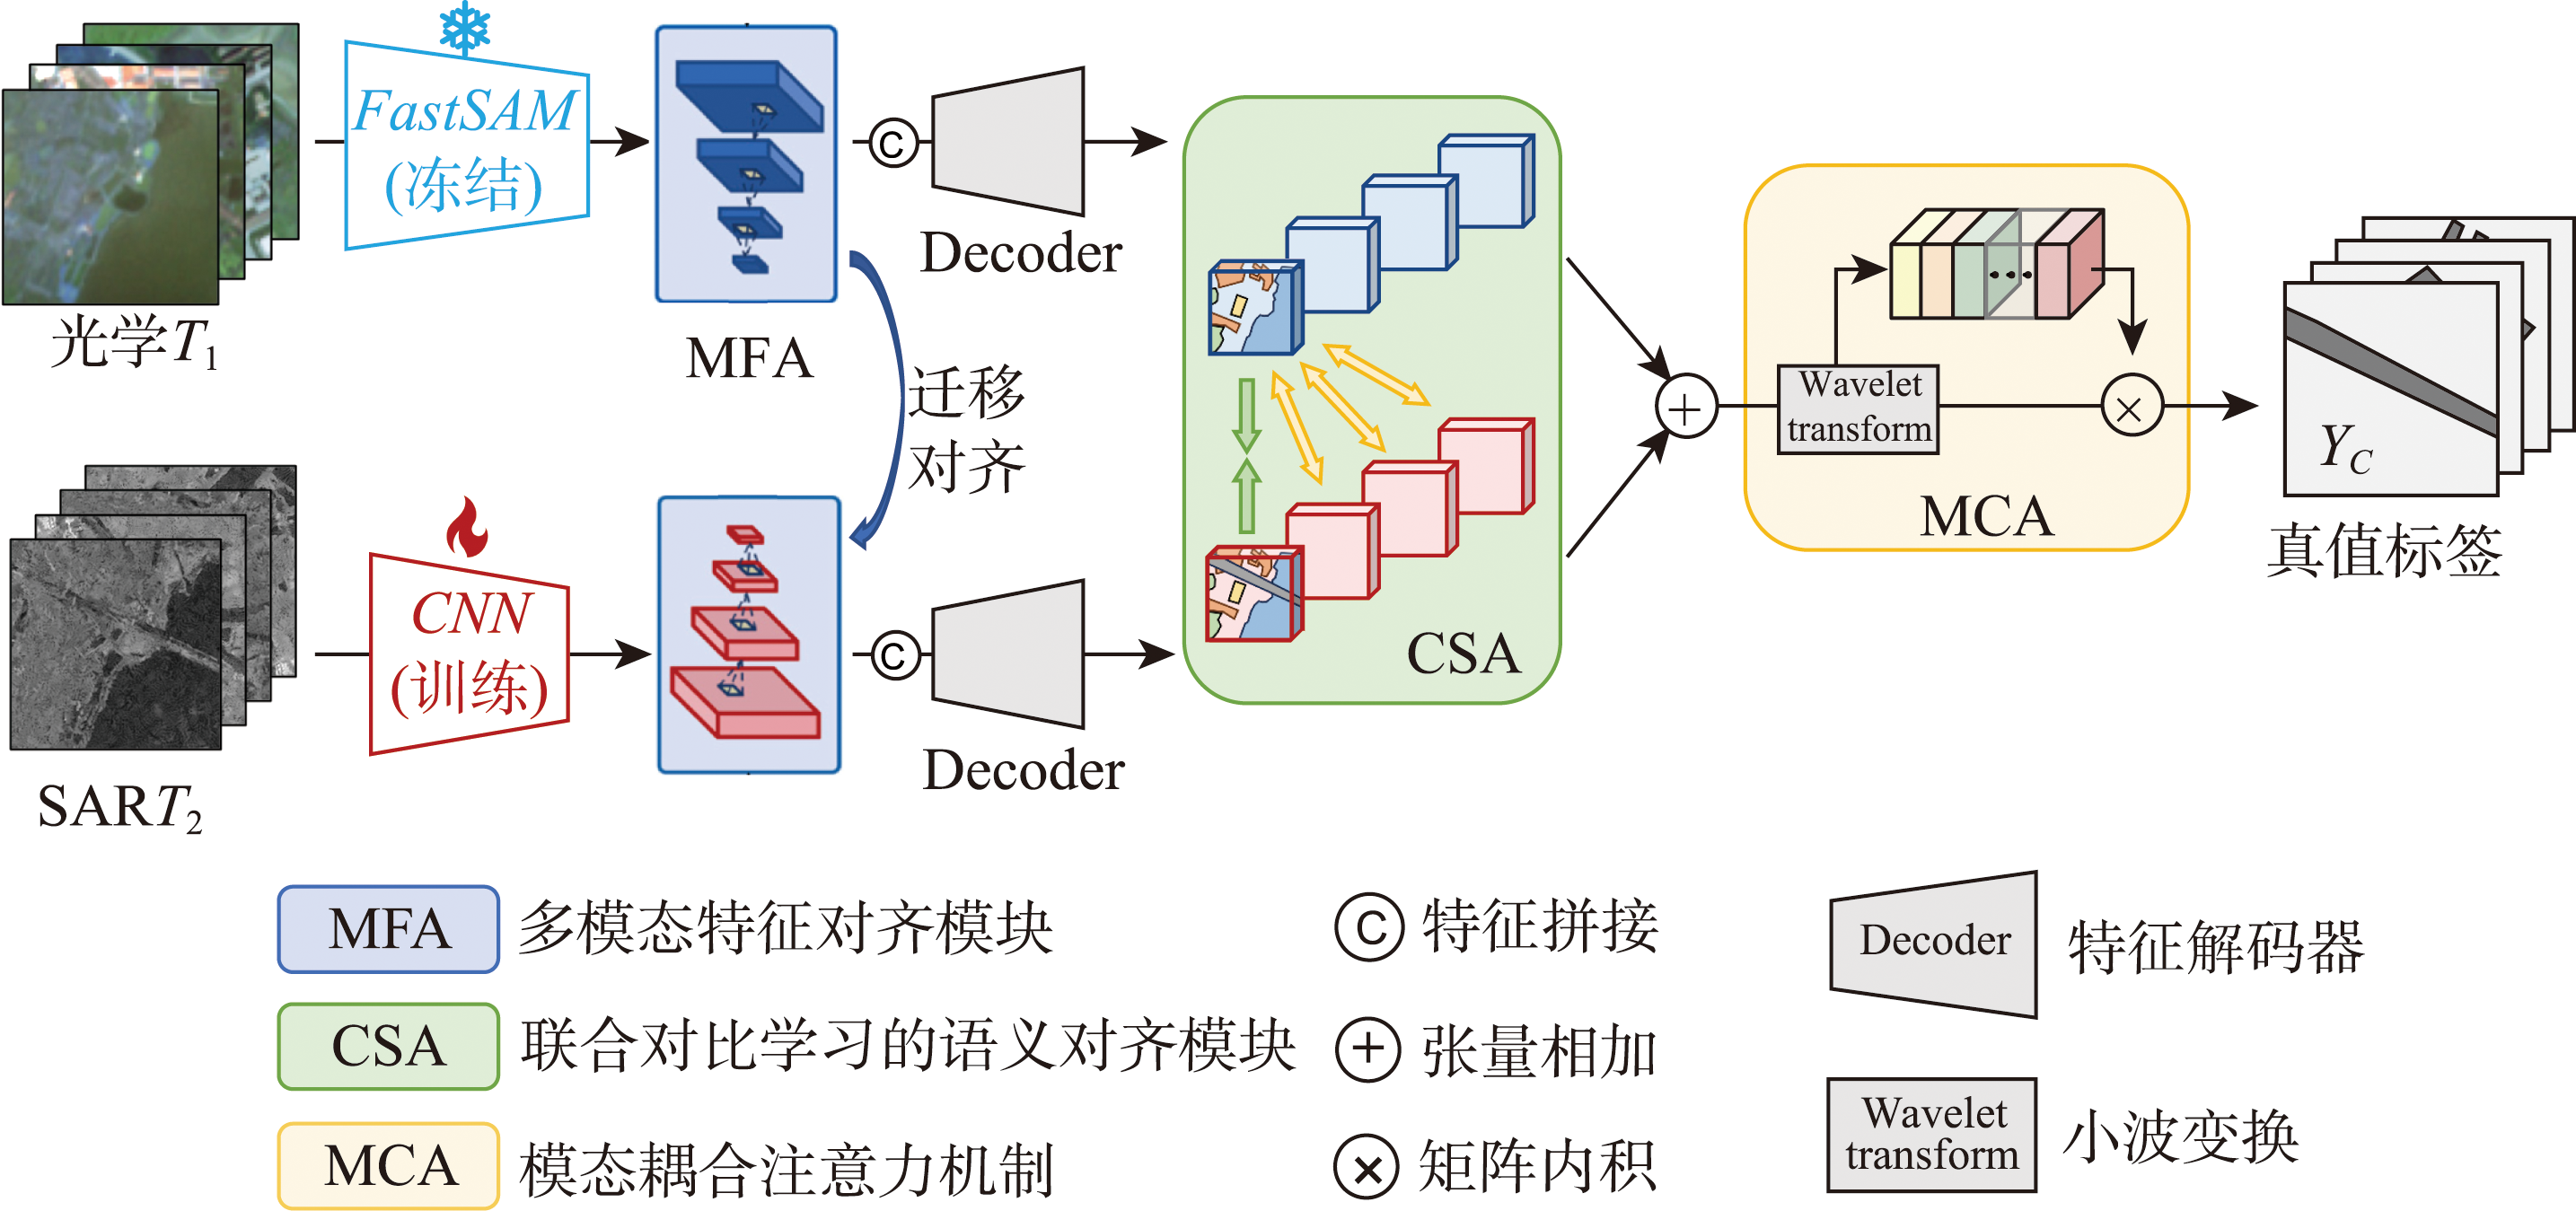
[Objectives] Multimodal Change Detection (MMCD) based on heterogeneous Remote Sensing Images (RSIs) is a critical technological paradigm for monitoring terrestrial surface dynamic changes, supporting core scenarios including urban expansion tracking, disaster damage assessment, ecological evolution analysis and land cover mapping. Optical-Synthetic Aperture Radar (SAR) image pairs are the most practical heterogeneous remote sensing data combination, as optical images capture fine spectral and texture details while SAR images enable all-day, all-weather observation with cloud and fog penetration, forming strong complementary advantages. However, MMCD faces significant methodological challenges rooted in inherent modality discrepancies from distinct imaging mechanisms, spectral response ranges and spatial expression patterns of multi-source sensors. These discrepancies trigger huge feature distribution gaps and cross-modal semantic misalignment, which directly restrict accurate identification and precise localization of geospatial changes. Existing methods mostly focus on the optimization of single-modal feature optimization or shallow multi-modal feature fusion, lacking in-depth exploration of high-level cross-modal semantic alignment. Consequently, they fail to fundamentally bridge the modality heterogeneity gap, leading to limited detection accuracy, weak generalization ability and poor performance in complex scenarios. [Methods] To address the aforementioned issues, this paper proposes a Multi-granularity Alignment and Frequency Adaptive Fusion Network (MAFFNet) systematically designed to process heterogeneous RSIs. The proposed architecture bridges the heterogeneity gap through multi-level semantic alignment and modality-coupled feature fusion. First, at the feature-level alignment, we employ a pre-trained Vision Foundational Model (VFM) to facilitate hierarchical visual knowledge transfer from optical modalities to heterogeneous imaging domains (e.g., SAR). Second, at the image-level alignment, we integrate loss-constrained deep structural representation learning with contrastive alignment mechanisms to enforce high-level semantic consistency across modalities. Finally, to retrieve spatial details in multimodal RSIs, we introduce a Modal Coupled Attention (MCA) mechanism. It leverages frequency-weighted attentions to dynamically fuse modality-specific complementary details. [Results] Experiments were conducted on two benchmark multimodal CD datasets (Wuhan and BRIGHT) in this paper, and the experimental results show that on the Wuhan dataset, MAFFNet outperforms the suboptimal model HeteCD by 1.21% in F1-score and 0.68% in mIoU, respectively, compared with methods such as DTCDN, HGINet, and HeteCD. These gains expand to 8.2% (F1) and 4.39% (mIoU) on the more challenging Bright dataset, compared against the sub-optimal model Sigma. This cross dataset performance consistency validates both its effectiveness and robustness in complex scenarios. [Conclusions] The proposed MAFFNet effectively solves the core problem of cross-modal semantic misalignment in heterogenous RSIs, significantly improves the accuracy of multimodal change detection, and breaks the performance bottleneck caused by inherent modality differences. This method can provide reliable technical support and critical decision-making information for practical applications such as disaster emergency response, environmental monitoring, urban planning and land resource management.
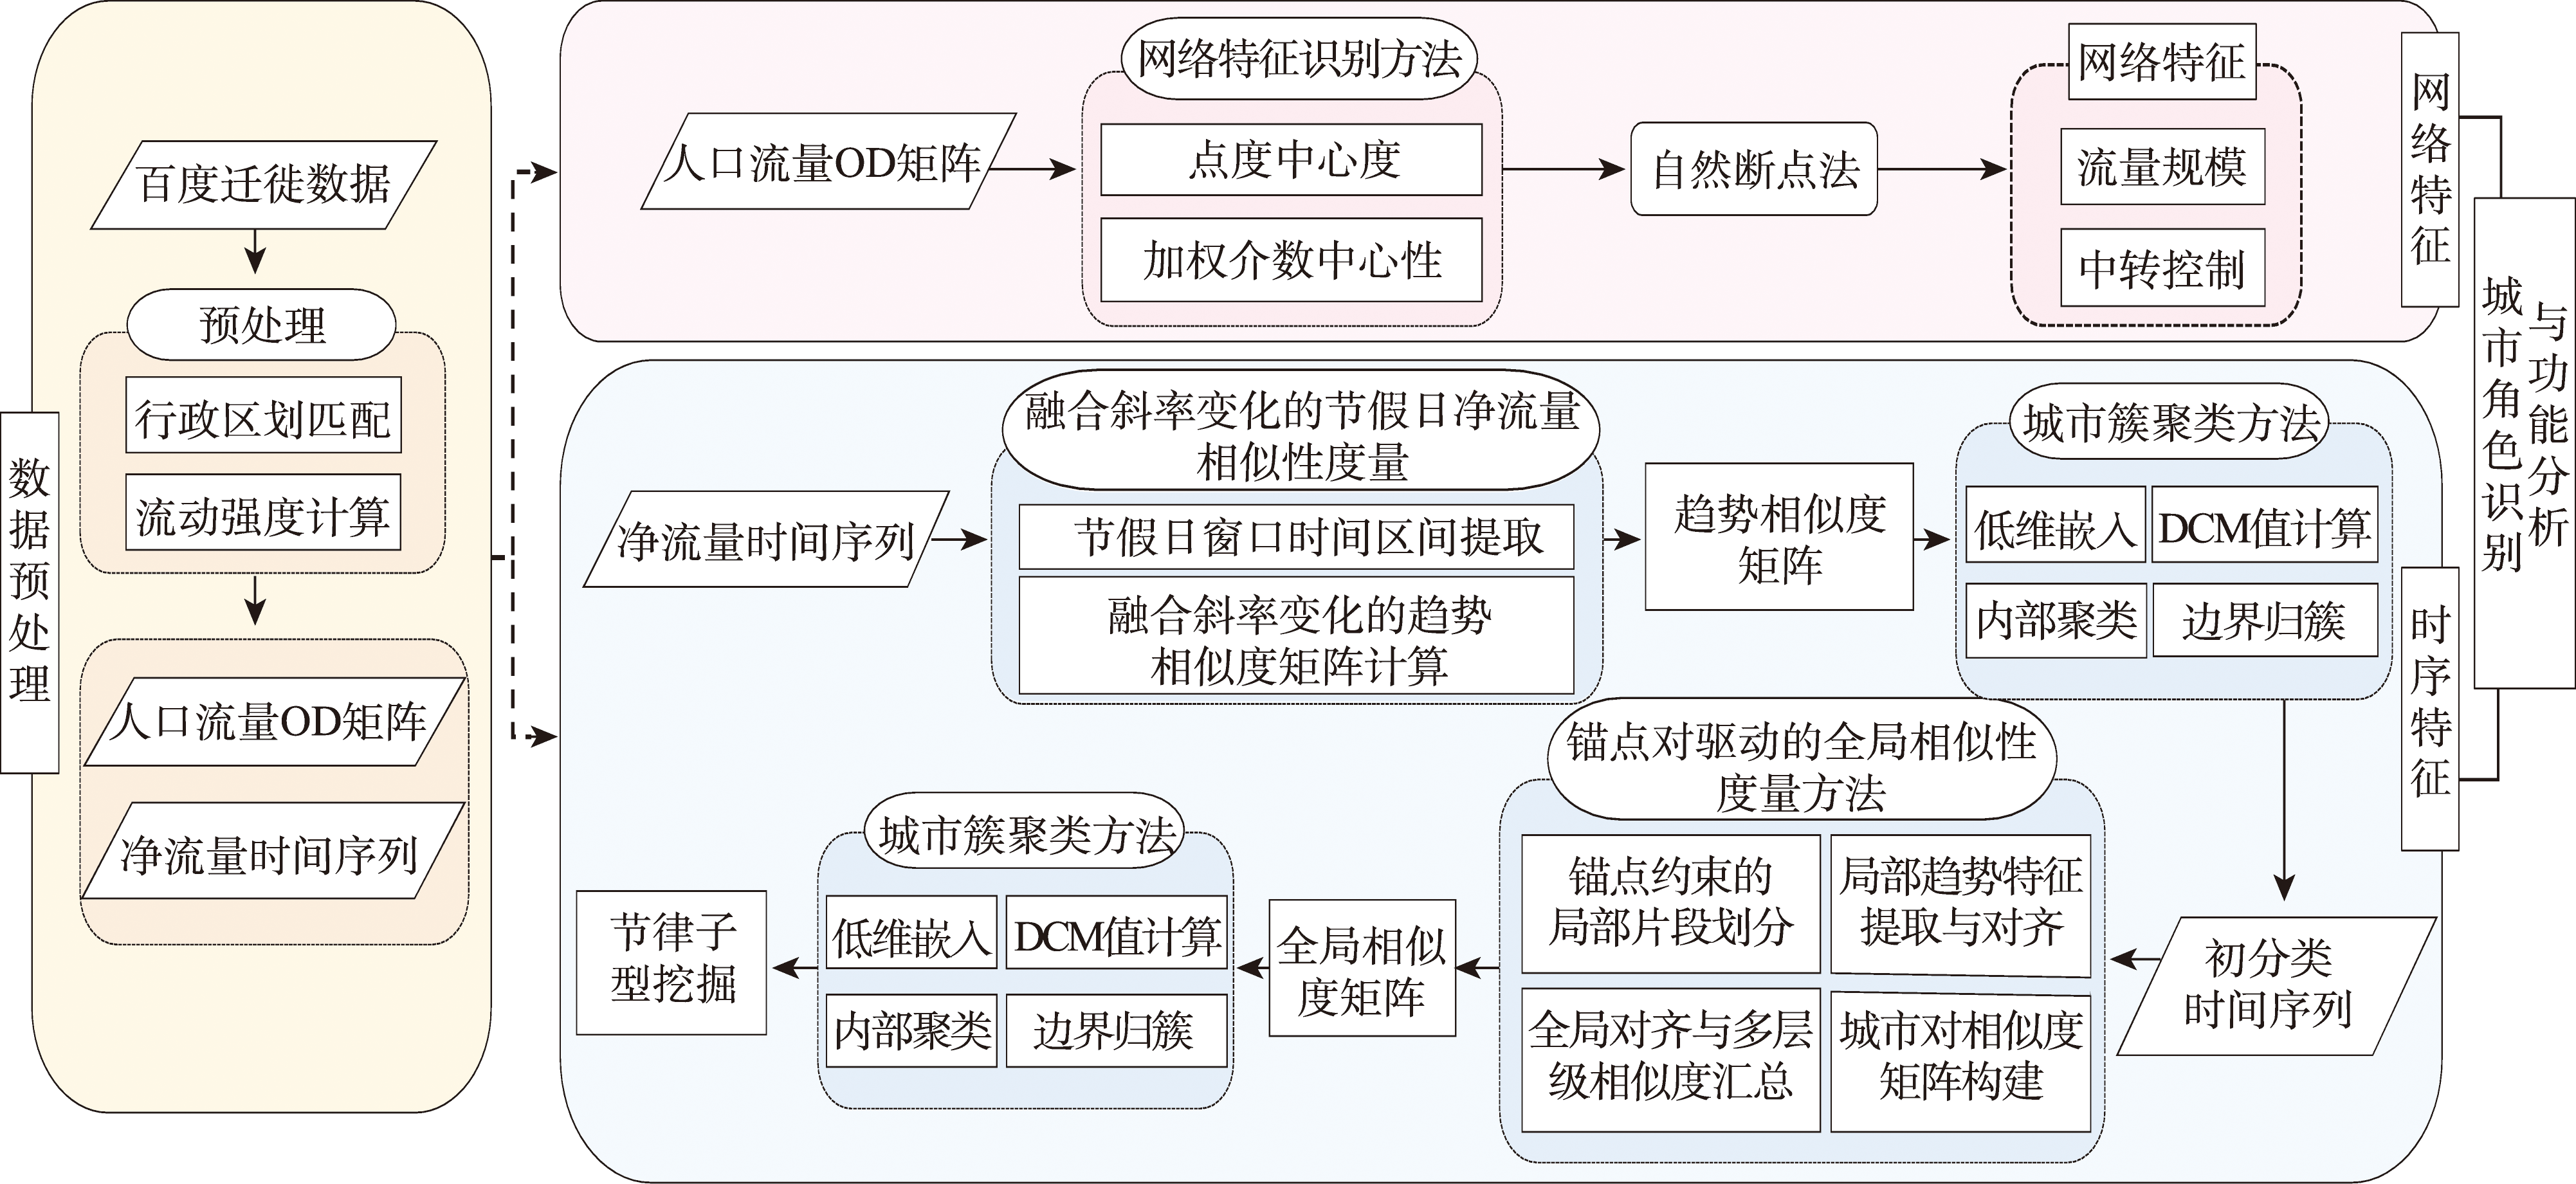
[Objectives] Temporal rhythms describe the dynamic processes of population mobility and contain more direct information on urban functions. However, existing studies have largely focused on network structural characteristics, paying limited attention to the functional information embedded in temporal patterns of mobility time series. As a result, a systematic analytical framework linking temporal features to urban functional types remains lacking. [Methods] This study proposes an integrated analytical framework that links temporal characteristics, network structure, and functional roles to comprehensively identify cities’ functions within the national population mobility network. At the temporal level, daily net population inflow-outflow time series for 366 Chinese cities from 20 December 2022 to 20 December 2023 were analyzed. Cities were first classified into two major clusters, namely“outflow-first then inflow”(Type I, 87 cities) and“inflow-first then outflow”(Type II, 279 cities), and were further subdivided into finer rhythmic subtypes with distinct spatial patterns. At the network level, degree centrality was used to measure the scale of population flows, while weighted betweenness centrality was employed to characterize cities' intermediary and transfer capacities in interregional mobility, thereby capturing structural centrality and connectivity within the population mobility network. Finally, temporal rhythms, network characteristics, and spatial patterns were jointly interpreted to achieve an integrated identification of urban functional roles. [Results] The national population mobility network exhibits a pronounced core-periphery structure, with population flows highly concentrated in the Yangtze River Delta, Pearl River Delta, Beijing-Tianjin-Hebei, and Chengdu-Chongqing urban agglomerations. Beijing demonstrates a particularly strong national-level transit control capacity. From a temporal perspective, the 366 cities can be classified into two macro-level mobility patterns and further divided into five rhythmic subtypes. Among them, 50high-frequency, high-amplitude cities display holiday-related peak-trough differences reaching the million-person scale. The remaining subtypes, including medium-frequency low-amplitude (37 cities), high-frequency medium-amplitude (106 cities), medium-frequency medium-amplitude (108 cities), and medium-frequency high-amplitude (65 cities), exhibit continuous gradient differentiation in fluctuation frequency and magnitude.By integrating network structure and temporal rhythm characteristics, seven types of urban population mobility functional roles were identified. These include comprehensive central cities that organize and regulate population flows at national or regional scales, transport hub cities that play key intermediary and corridor-control roles in interregional mobility, and tourism destination cities characterized by strong holiday-driven pulse flows. The integrated results further indicate that high-frequency, high-amplitude cities are mainly concentrated among comprehensive central and transport hub roles. Among them, 39 cities correspond to national or regional central-city designations, and 37 cities align with national or international transport hub planning. Meanwhile, ten cities, including Zhuhai, Jiaxing, and Wenzhou, which are not formally incorporated into national-level center or hub systems, exhibit population mobility characteristics that indicate the potential to evolve toward national central city or transport hub functions. [Conclusions] The proposed integrated framework enables precise identification of urban functional roles and reveals both the core-periphery structure and the multi-level functional differentiation of China's population mobility network. The findings validate the scientific basis of the national urban system planning and identify a group of cities with potentially important functional roles, thereby providing a dynamic, data-driven perspective to support urban governance, regional planning, and population policy formulation.
 Astrophysics Data System(ADS)