
Close×

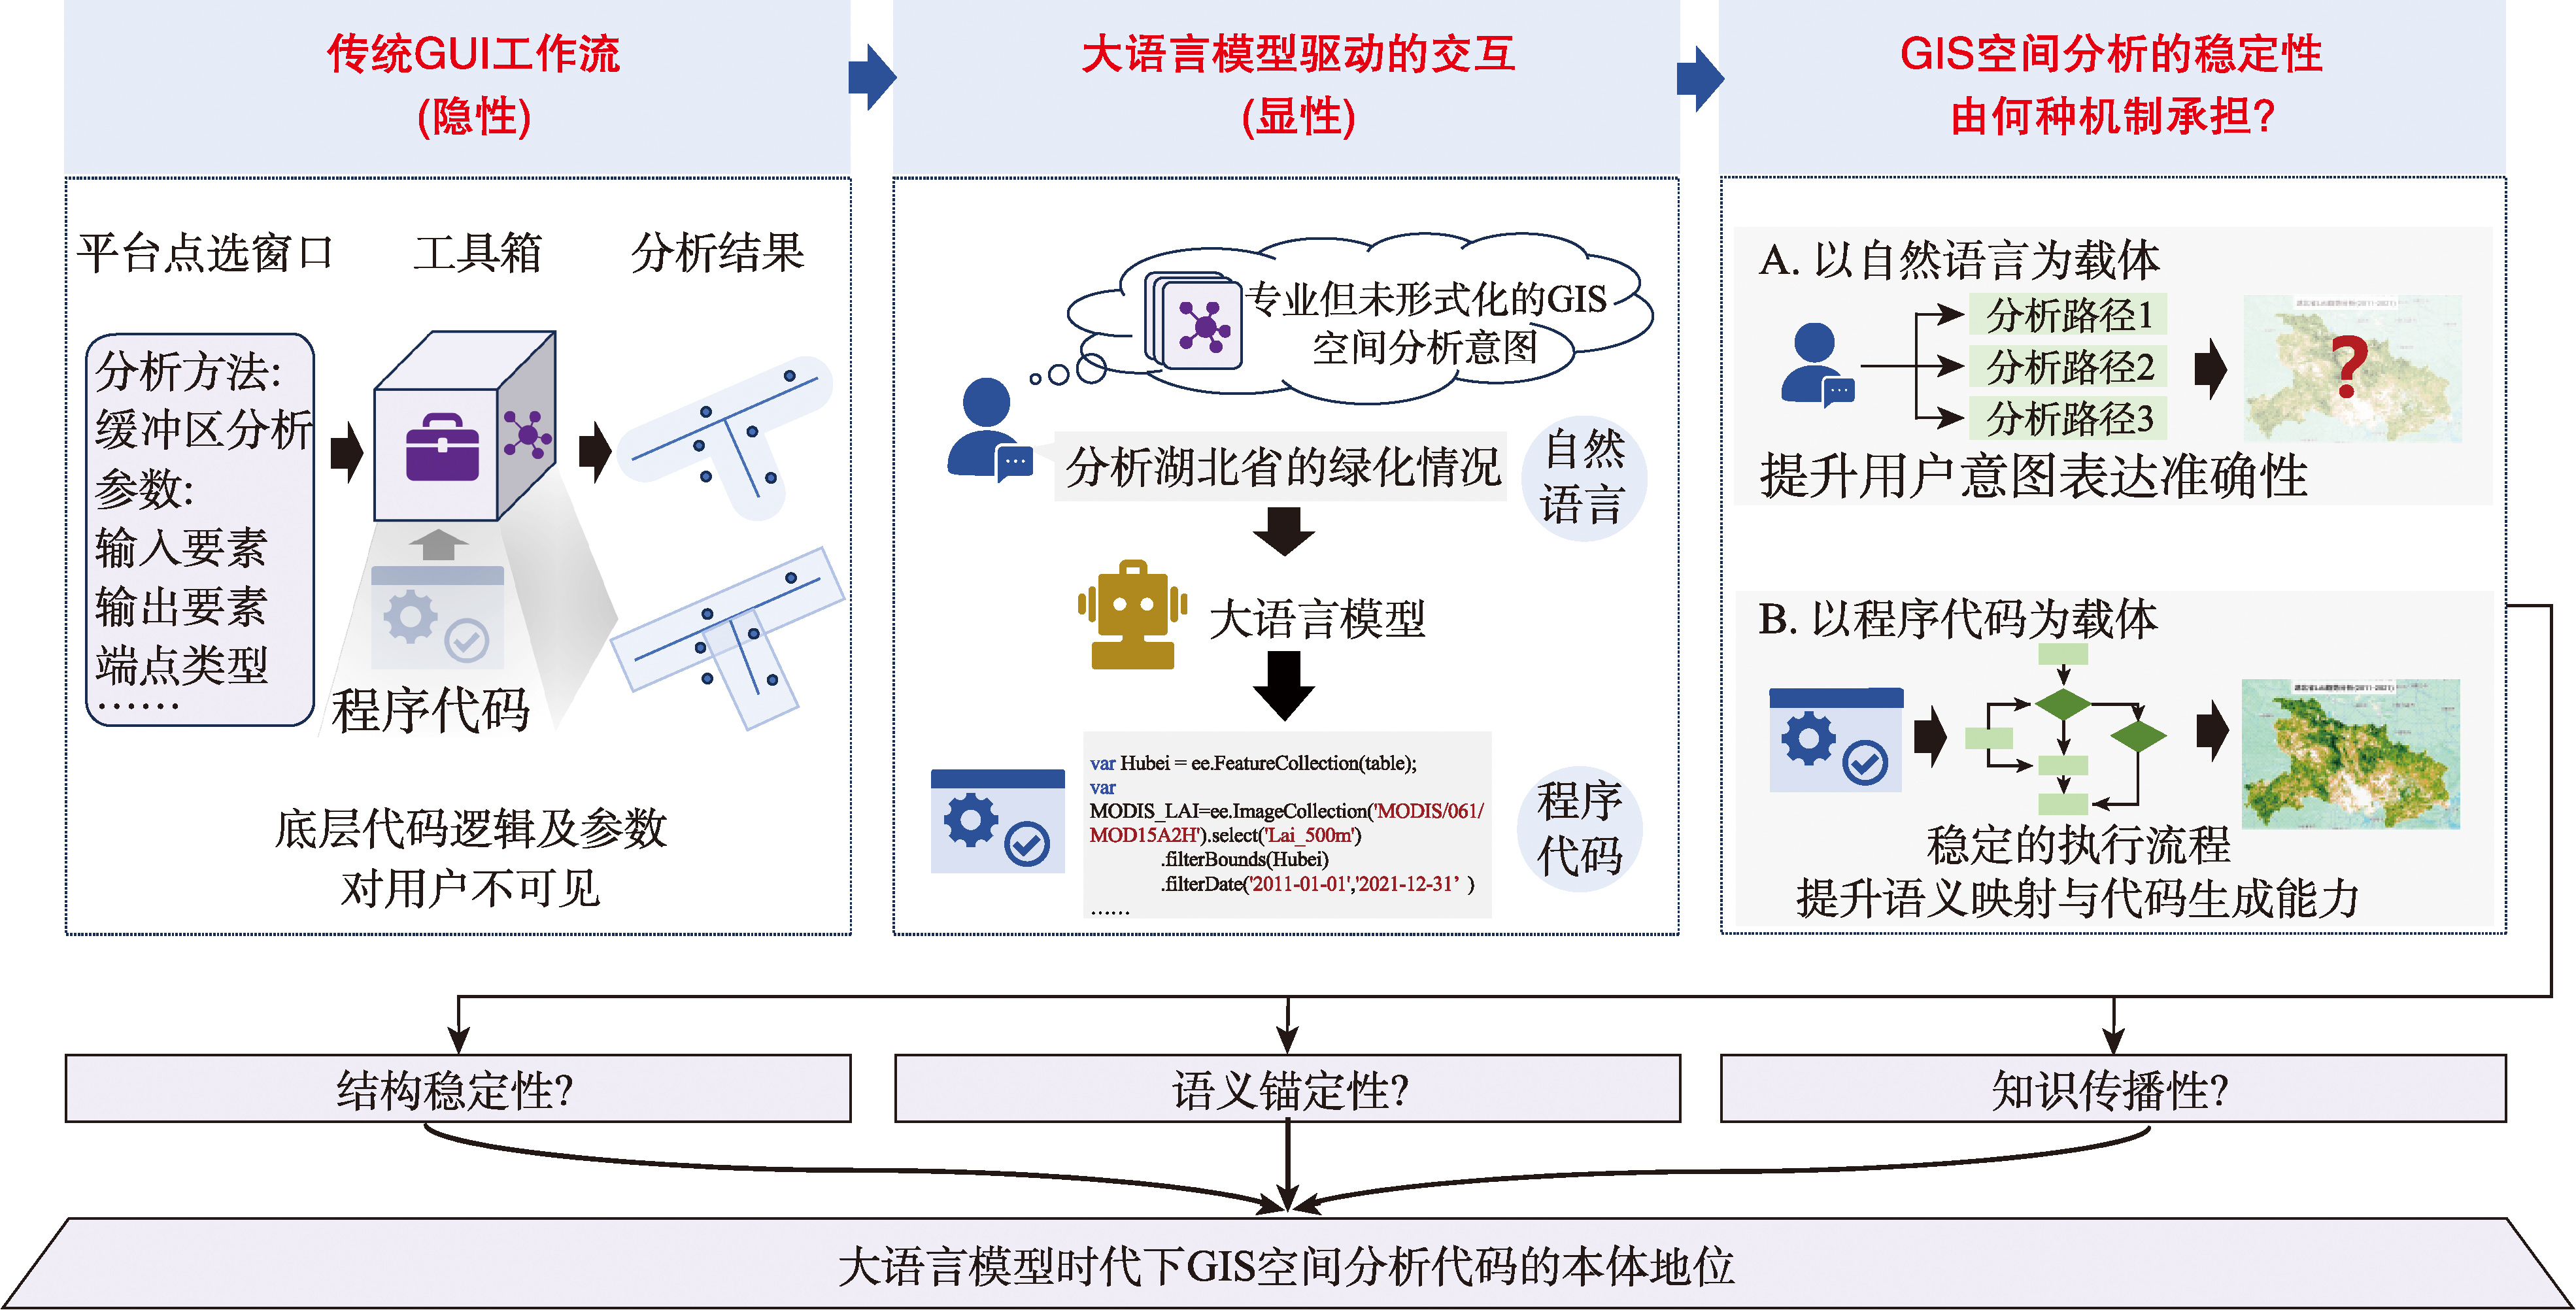
[Background] The emergence of Large Language Models (LLMs) has driven a profound transformation in the interaction paradigm of Geographic Information System (GIS) spatial analysis. This evolution has progressed from the early mode in which users directly wrote code to drive the analysis, through an intermediate mode in which code was indirectly invoked via GUI toolchain configuration, and is now shifting toward a new paradigm of "natural language-code-spatial analysis." Under this paradigm, natural language and program code jointly take the stage as the media driving GIS spatial analysis. However, the two differ in the structural stability of execution, the clarity of spatial semantics, and the transmissibility of the analytical process; discerning which of them constitutes the ontology of contemporary GIS spatial analysis is therefore essential for clarifying the optimization direction of LLM-driven GIS spatial analysis. [Analysis] Against this background, this paper advances a systematic argument for the ontological positioning of GIS spatial analysis code. It first defines the conceptual connotation of GIS spatial analysis code, identifies five functional types, and characterizes the capability boundaries across four categories of execution platforms, namely local general-purpose programming environments, spatial resource-hosting cloud platforms, database-embedded environments, and knowledge graph environments. It then explicates the driving mechanism of code from three dimensions—structural stability, semantic anchoring, and knowledge transmissibility—and argues that code constitutes the minimum complete unit upon which the scientific validity of spatial analysis is established, thereby affirming its ontological status within the GIS spatial analysis system. [Progress and Prospects] Building on this foundation, the paper reviews recent research progress centered on GIS spatial analysis code in the LLM era, and dialectically discusses two categories of research directions. The first category comprises directions that are currently feasible yet have not been systematically investigated, including spatial-semantic structural perception, domain-adaptive learning, autonomous agent ecosystems, knowledge transfer and accumulation, and code localization and repair. The second category comprises directions that still lack foundational support but are urgently worth exploring, including data and knowledge governance, spatial computing capability, causal explanation capability, and geospatial representation models. [Purpose] Through a systematic analysis organized around the driving mechanism, this paper delineates the theoretical role and methodological significance of GIS spatial analysis code in the LLM era, elucidates the theoretical framework and capability boundaries of this field, and provides a theoretical reference for research on intelligent GIS.
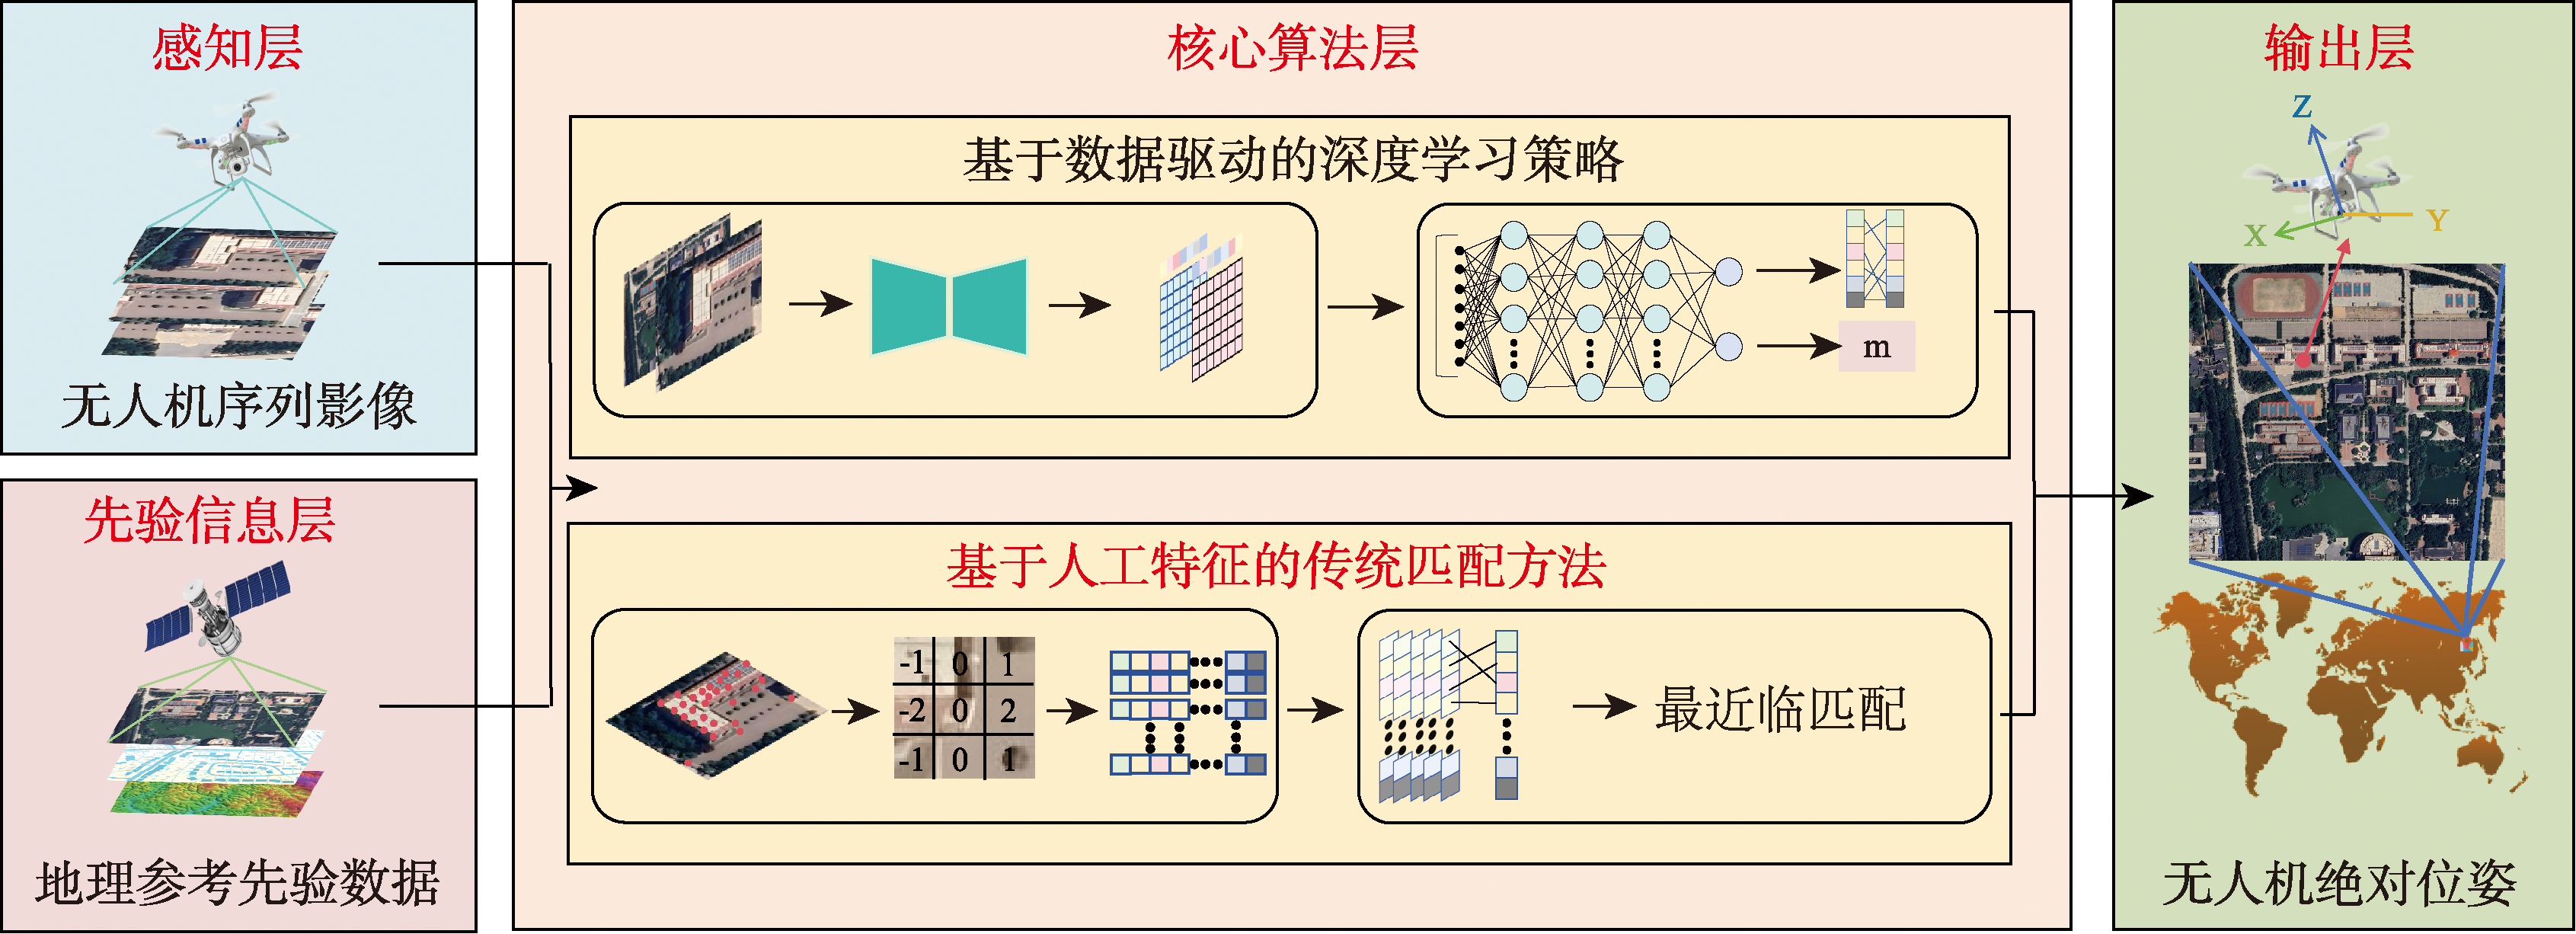
[Significance] In Global Navigation Satellite System (GNSS)-denied environments, Unmanned Aerial Vehicle (UAV) autonomy is impeded by signal outages and degraded positioning accuracy, which substantially limits mission effectiveness. To overcome these challenges, Absolute Visual Localization (AVL) has emerged as a central alternative technology. By aligning onboard UAV images with pre-existing geo-referenced data, AVL can accurately determine the UAV's position and orientation within a global coordinate frame. This capability ensures consistent and robust localization performance across different times, weather conditions, and environmental settings, making AVL an indispensable tool for all-weather and multi-scenario UAV operations. [Analysis] This paper provides a systematic review of UAV AVL methods, focusing on two key aspects: feature representation and paradigm innovation. In terms of feature representation, we observe a clear transition from traditional hand-crafted features, which rely on low-level geometric and texture information, to modern deep learning-based features. Deep learning models can automatically extract hierarchical features from raw images, capturing both local details and global context. These learned features are more resilient to variations in illumination, viewpoint, and partial occlusions, which are common challenges in dynamic UAV environments. Regarding paradigm innovation, we compare and contrast different approaches, including geometry-based methods that rely on explicit feature matching, learning-based methods that leverage neural networks for end-to-end pose estimation, and hybrid methods that combine the strengths of both. We also highlight several emerging paradigms that are reshaping the AVL landscape. These innovative approaches collectively enhance the scalability, efficiency, and cross-domain generalization of AVL systems, enabling them to adapt to new environments with minimal manual intervention or retraining. Based on a comprehensive analysis of publicly available datasets and standardized evaluation metrics, we identify several key challenges that hinder the widespread adoption of AVL technologies, including the need for improved model generalization across diverse environments, efficient deployment on resource-constrained UAV platforms, and effective fusion of multi-source sensory data. [Prospect] Finally, we outline several promising future research directions to advance the field of UAV AVL. The development of lightweight, dedicated architectures remains imperative to reconcile complex deep models with stringent onboard resource constraints. Enhancing cross-domain robustness through self-supervised learning and semantic priors is key to ensuring adaptability across diverse geographic, seasonal, and illumination conditions. Furthermore, building resilient multi-sensor fusion frameworks that dynamically integrate AVL with relative methods will enable reliable state estimation in challenging environments. Through synergistic progress in efficiency, robustness, and multimodal integration, UAV AVL can evolve from a research-focused technology into a dependable component of autonomous aerial systems.
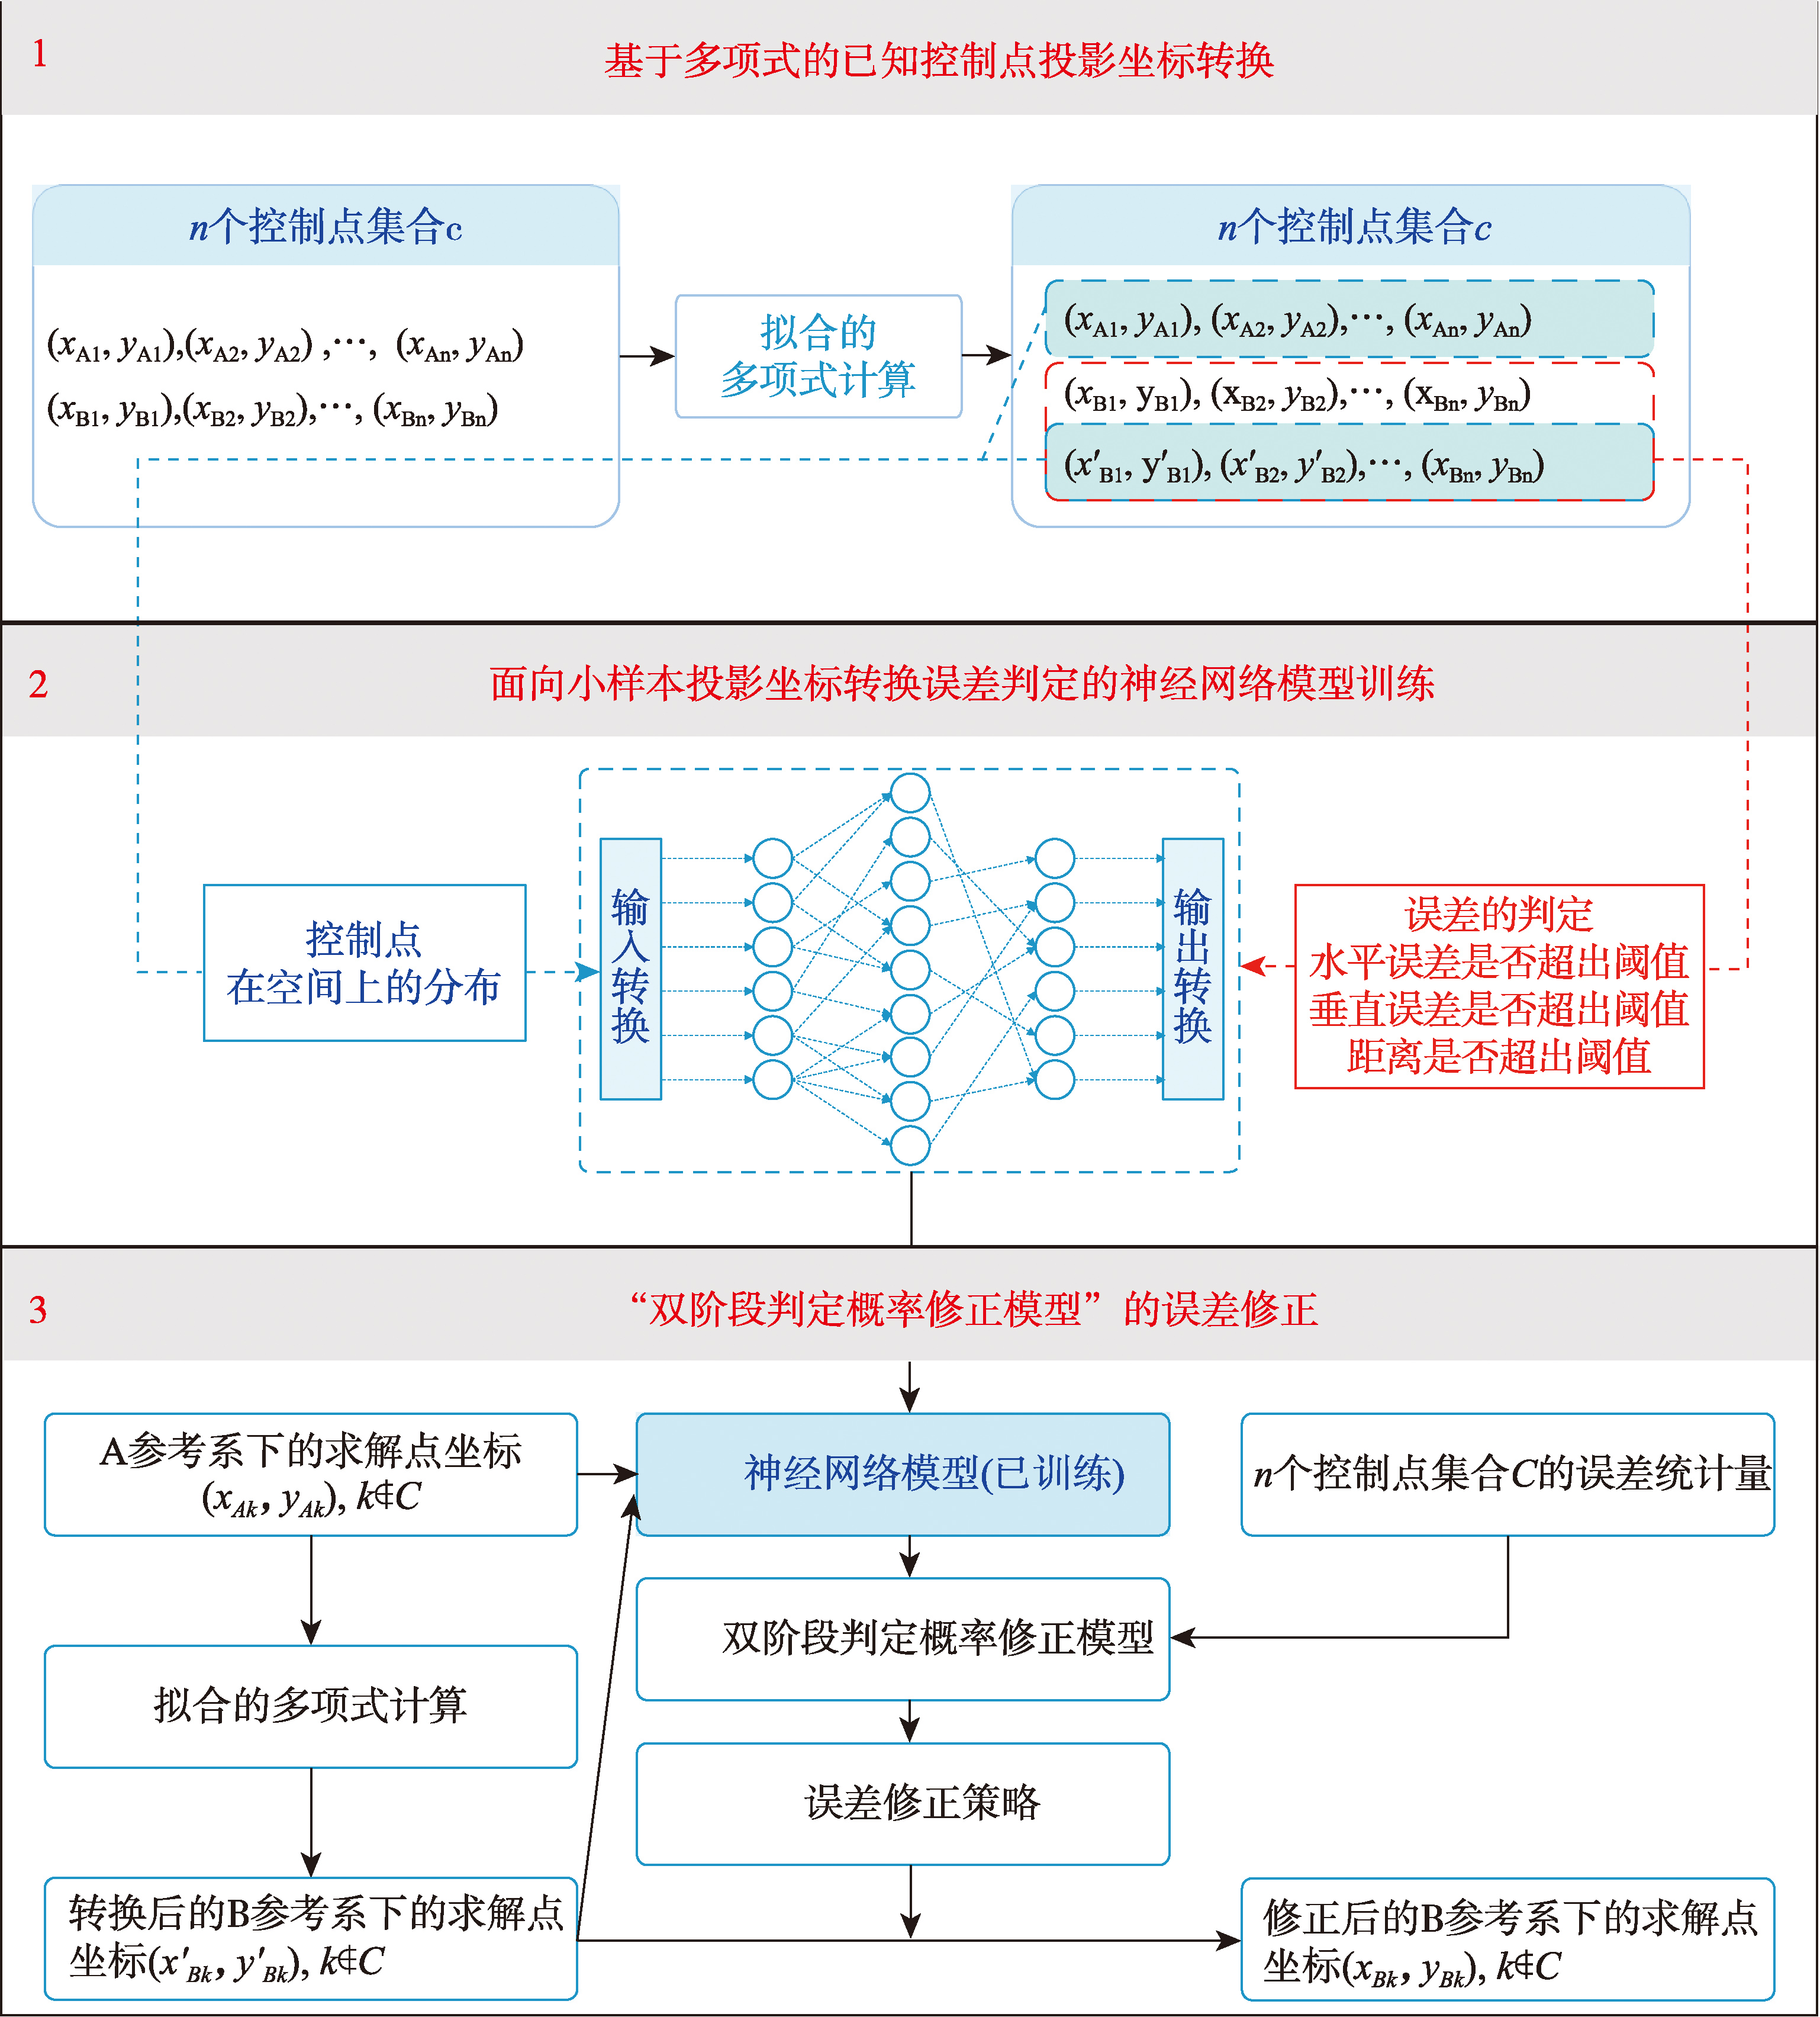
[Objectives] Aiming at the problems of low accuracy, poor stability and weak interpretability in neural network-based projection coordinate transformation under the condition of limited control points, this paper proposes a direct transformation method for small-sample projection coordinates based on two-stage judgment of neural network. This method is dedicated to solving the defects that traditional neural network methods cannot effectively judge the single-point transformation error and control the error rate, and realizing the optimization of projection coordinate transformation accuracy from both single-point and statistical perspectives. [Method] Firstly, the traditional regression problem of establishing the mapping relationship between two projection coordinate systems by neural network is transformed into two classification judgment problems: judging whether the distance error after coordinate transformation is within the set threshold range, and judging whether the horizontal and vertical direction errors fall into the given distribution area. On this basis, aiming at the possible contradictory, single-direction supporting and double-direction supporting situations of the two judgment results, a two-stage judgment probability correction model is designed by combining Bayes' law and Monte Carlo simulation. This model calibrates the probability value output by the neural network according to the logical relationship between the two types of judgments, and formulates corresponding active and conservative error correction strategies to realize the explicit correction of transformation errors. In the model construction, the BP neural network with simple structure and low training cost is selected as the basic framework, and the affine transformation six-parameter method is used to complete the initial conversion of control point projection coordinates, ensuring the engineering feasibility and reproducibility of the method. [Results] The experimental data are 438 homologous points covering an area of about 100,000 km2. The results show that compared with the conventional neural network regression model, the proposed method has the average accuracy improved by about 10%, with the average transformation error reduced from 0.563 to 0.508; the overall transformation error rate is significantly reduced from 40.6% to 12.9%. [Conclusions] This method addresses key limitations of traditional neural network approaches under small-sample control point conditions, including high error rates in both single-point and multi-point coordinate transformations and poor interpretability. At the same time, the proposed model is simple and fast to train and demonstrates strong engineering scalability. The method and its parameters can be adjusted according to the characteristics of actual data, and it can be extended to coordinate transformation scenarios on other platforms, such as unmanned aerial vehicles (UAVs). Therefore, it shows promising application potential in the field of surveying and mapping engineering.
[Objectives] A unified coordinate system is widely recognized as the fundamental infrastructure for achieving comprehensive cyberspace situational awareness and fine-grained security analysis. However, cyberspace is characterized as a virtual, dynamic, and non-Euclidean domain with distinctive features of distance irrelevance and topology dominance. These fundamental characteristics present inherent incompatibilities with conventional geographic coordinate systems that rely on Euclidean distance metrics as their underlying spatial reference. The absence of distance constraints and the dominance of topological relationships in cyberspace pose significant challenges for researchers attempting to establish a coherent spatial reference framework for network elements across different scales of analysis, thereby hindering the development of effective visualization and analytical tools. [Methods] To address the critical gaps identified in existing cyberspace element coordinate systems—specifically the absence of cross-scale linkage mechanisms, the disconnection between macroscopic and microscopic analytical perspectives, and the limitation that microscopic analysis remains confined to the port level without extending to the protocol dimension—a Cross-scale Network Space Element Coordinate Modeling Framework (CNSEC-M) is proposed in this paper. A standardized basis vector library is constructed by leveraging the layering mechanism inherent in the TCP/IP protocol stack, ensuring that each basis vector possesses well-defined network semantic meaning and hierarchical positioning within the protocol architecture. Furthermore, a dimension-stacking mechanism is introduced to realize on-demand dynamic instantiation of coordinate systems tailored to specific analytical requirements, enabling flexible combination of basis vectors according to analytical objectives. Through this dual-mechanism design, the framework is endowed with three essential properties: unified representation across scales, extensibility for incorporating emerging network elements, and seamless cross-scale linkage capability that bridges macroscopic situational awareness with microscopic behavior tracing. [Results] Comprehensive experiments were conducted using Scenario 3 of the CTU-13 real attack dataset, which encompasses authentic network traffic involving over 435 000 IP addresses and captures genuine botnet communication patterns under realistic network conditions. The experimental results demonstrate that a complete analysis loop from macroscopic cyberspace threat situational awareness to microscopic network threat behavior attribution is effectively supported by CNSEC-M. At the macroscopic level, the malicious Autonomous System AS2852 was precisely localized, and the anomalous port 6667 deployed within this AS for hybrid Command and Control (C&C) server operations was identified—a stealthy configuration designed to evade conventional port-based detection mechanisms. At the microscopic level, the communication chain was successfully traced to both the botnet host IP (147.32.84.165) and the C&C server IP (38.229.70.20), and the attack techniques were systematically characterized as SSH-targeted port scanning activities and TCP SYN Flood attack patterns. Performance evaluation indicates that a processing speed of approximately 233 000 IP addresses per second is achieved by the core mapping algorithm, verifying the efficiency and practicality of the framework for large-scale cyberspace element mapping in real-time or near-real-time security applications.

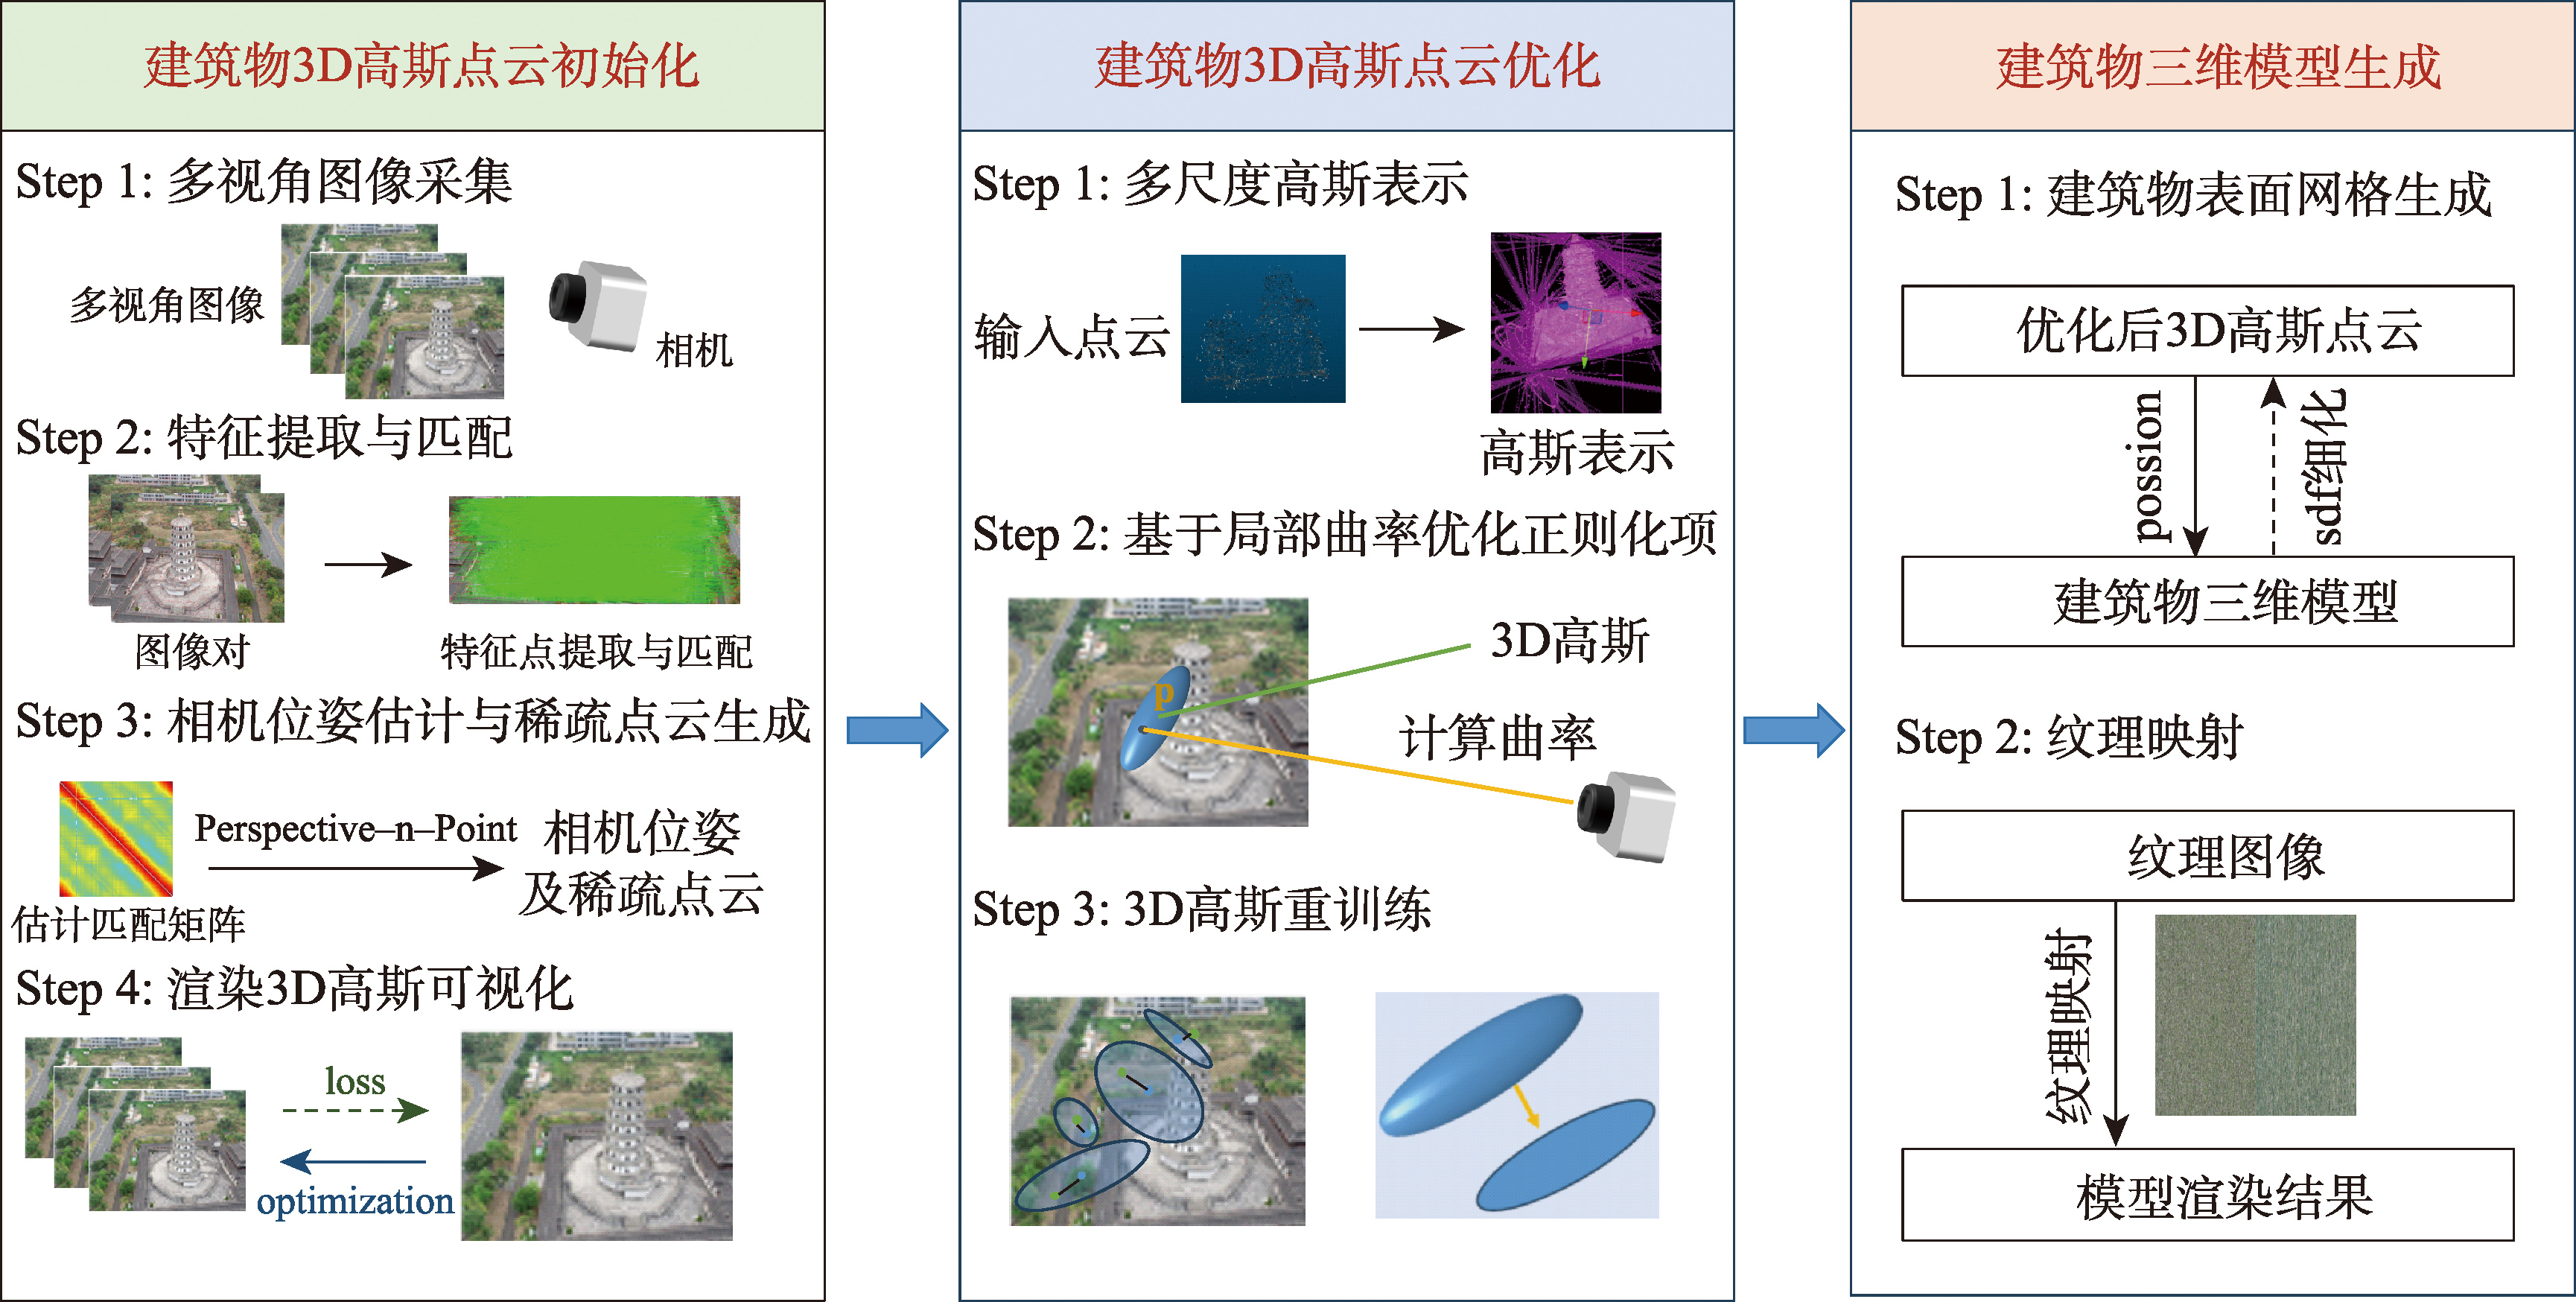
[Objectives] 3D reconstruction of buildings using multi-view images has important practical applications in a variety of fields such as surveying, visualization and urban management. Traditional image-based 3D reconstruction methods capture the 3D structure of a building by fusing image data from different perspectives to generate a 3D model of the building. However, it is often difficult for existing methods to take into account the geometric accuracy, detail restoration ability, and adaptability to complex scenes while optimizing the visual effect. Aiming at the challenges of high-precision 3D reconstruction of buildings in complex scenes, this paper proposes a 3D Gaussian Splatting-guided multi-view 3D reconstruction method for buildings, which can effectively capture the geometric structure and detailed features of buildings and generate 3D models with high geometric accuracy and superior detail preservation. [Methods] The core workflow of the proposed method consists of three stages: Firstly, Structure from Motion (SfM) is utilized to generate a sparse point cloud of the building scene from the multi-view image, and 3D Gaussian Splatting is utilized for point cloud smoothing and completion to generate a continuous 3D Gaussian point cloud. Secondly, a 3D Gaussian point cloud optimization strategy is designed for complex building surfaces, through multi-scale Gaussian representation and regularization terms based on local curvature optimization, so that the 3D Gaussian point cloud fits the building surface more accurately and enhances the smoothness and visual consistency of the reconstructed model. Finally, Poisson reconstruction is used to generate the initial mesh of the building from the 3D Gaussian point cloud, and combined with Signed Distance Field (SDF) to refine the surface structure to further improve the geometric accuracy and detail fidelity. Based on the proposed method, the experiments are validated on the Barn scene in the Tanks and Temples dataset, the Small Buildings dataset provided by ArcGIS and the self-collected Tower dataset, and the experimental results are compared with the Colmap, Neuralangelo, and SuGaR methods. [Results] In terms of geometric accuracy, the proposed method has an F1 Score of 0.46 and a Point-to-Mesh Distance of 0.049 on the Barn dataset, which is better than the comparison methods. In terms of render quality, the Peak Signal-to-Noise Ratio (PSNR) and Structural Similarity Index (SSIM) reach 27.83 and 0.92 on the Barn dataset, 29.67 and 0.94 on the Small Buildings dataset, and 32.69 and 0.96 on the Tower dataset, which are both better than compared methods. [Conclusions] The proposed method demonstrates significant improvements over comparison methods in terms of geometric accuracy, detail preservation and rendering quality in complex scenes, and is able to effectively recover the overall geometric structure of buildings and achieve stable rendering performance.
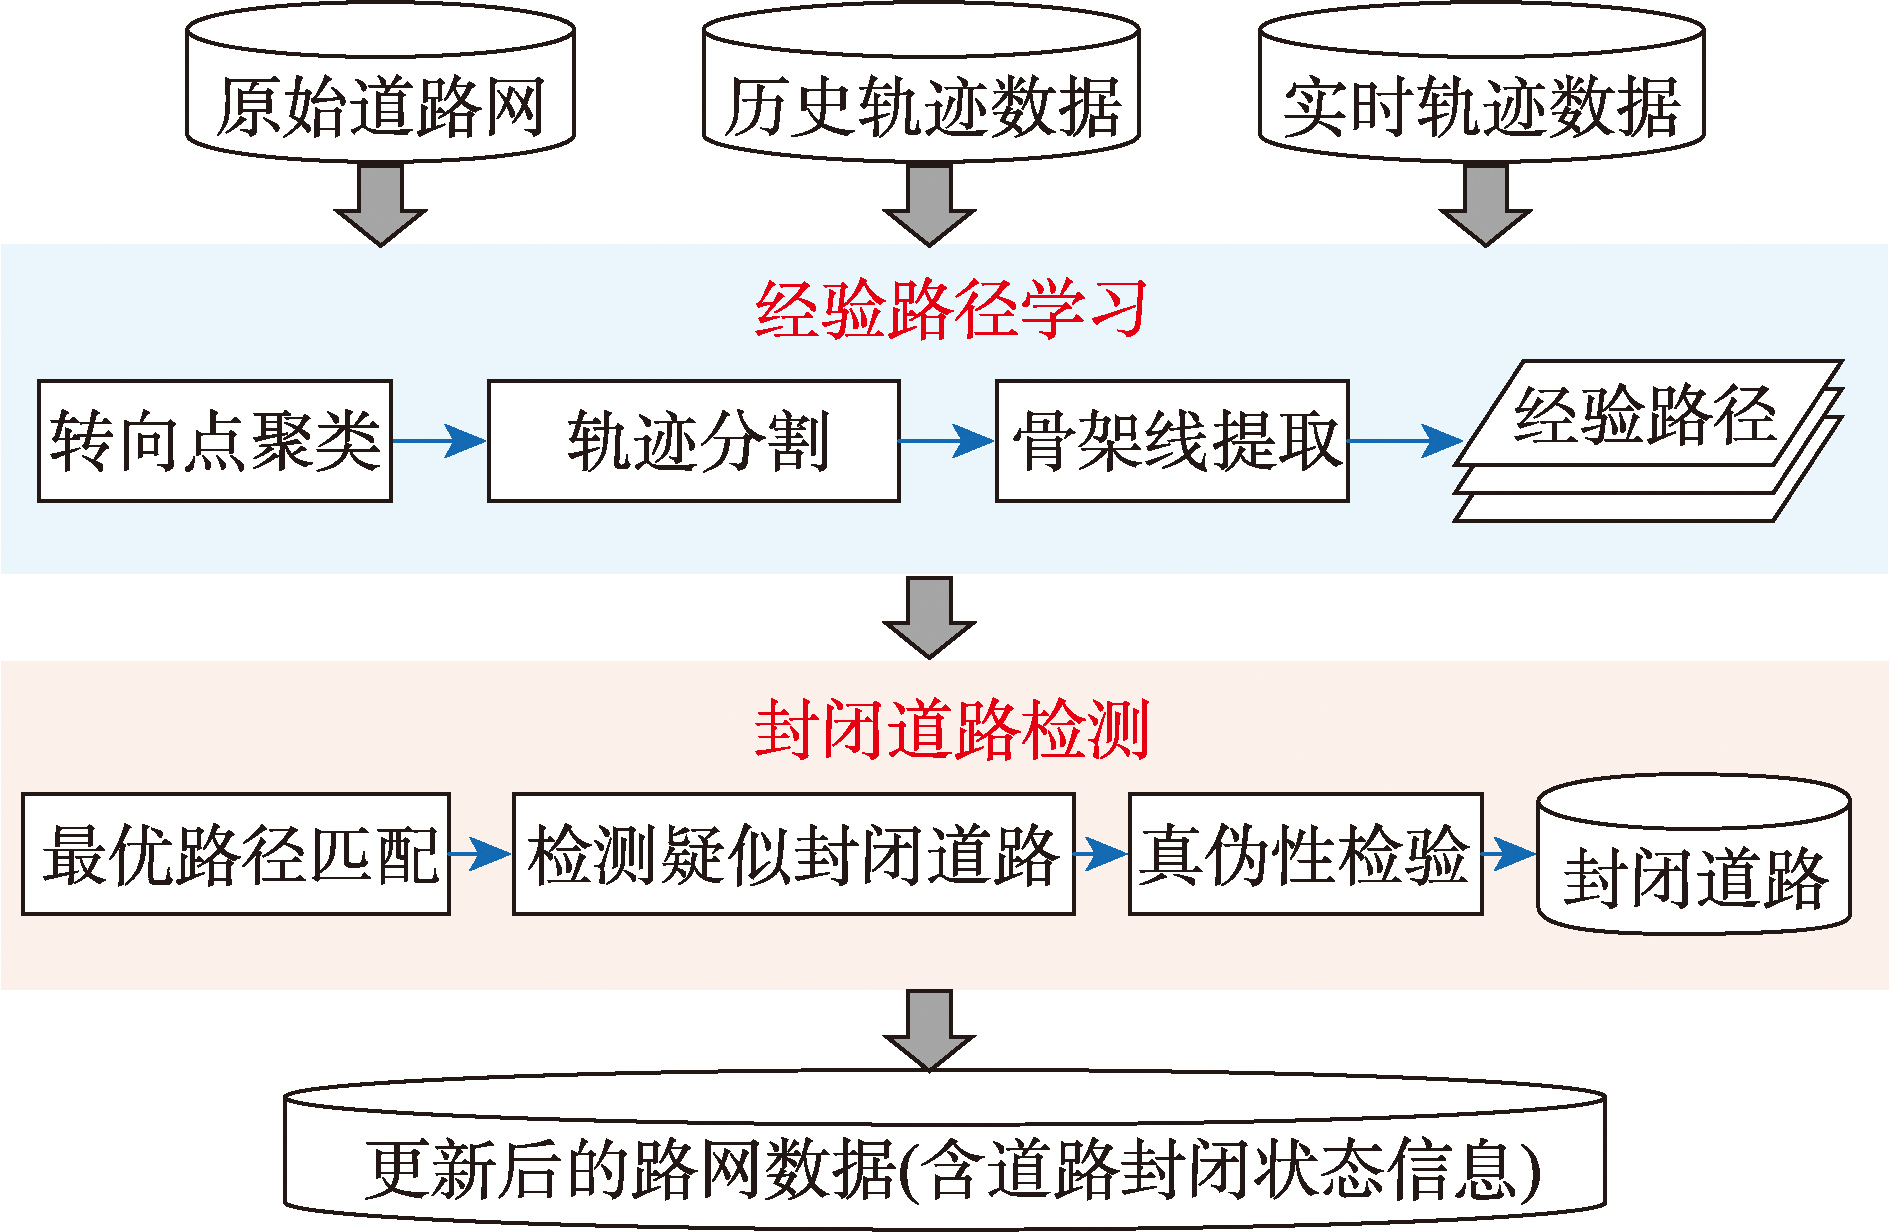
[Objectives] Road closures frequently caused by construction, traffic accidents, large events, or temporary traffic controls, are common and impactful sudden events in urban transportation systems. Such closures are often unpredictable and can lead to abrupt drops in traffic flow and reduced network efficiency. Rapid and accurate identification of road closures is essential for ensuring the timeliness of navigation map updates and the reliability of route planning. However, existing traffic flow-based threshold methods and statistical models often suffer from high miss rates, detection delays, and insufficient dynamic adaptability when identifying closures on low-traffic roads, making them inadequate for real-time updates of large-scale urban road networks. Extracting closure-related features from large-scale heterogeneous trajectory data still remains challenging. [Methods] To address these challenges, this paper proposes a rapid detection method for closed roads detection that fuses historical and real-time vehicle trajectories. The core idea is to leverage trajectories as direct indicators of road passability. The method first constructs empirical candidate paths from historical trajectory data, representing long-term stable travel patterns. Then, it uses deviation patterns in real-time trajectories as sensitive features of closure events. Specifically, the method comprises three steps: (1) mining regular travel patterns from historical data to build empirical candidate paths within the region; (2) integrating real-time trajectory data to identify anomalous driving behaviors such as U-turns and detours, thereby detecting suspected closed roads; and (3) applying a multi‑trajectory matching strategy to verify and confirm actual closed roads or segments. [Results] Experimental results based on simulated closed-road scenarios using 2014 taxi trajectory data from Wuhan, China, demonstrate that the proposed method outperforms classical approaches including the traffic‑flow threshold method, the Poisson statistical flow model, and the topology‑based T‑closure method. Specifically, the proposed method achieves approximately 10% improvements in precision, recall, and F1‑score. Moreover, it exhibits strong adaptability and robustness under low‑flow conditions and insufficient data coverage. [Conclusions] Compared with traditional flow‑based detection methods, the proposed approach offers three significant advantages. First, it systematically integrates spatial continuity and behavioral consistency of trajectory data, enabling more accurate characterization of changes in road passability. Second, it is flexible in data requirements, not relying on high‑density sampled vehicles or explicit closure annotations, making it applicable to various road types and multi‑scale network environments. Third, the method allows rapid verification of suspected closed areas using only sparse real‑time trajectories, ensuring good real‑time performance and deployability. Overall, this method provides a solution with high precision, robustness, and practicality for urban traffic state monitoring and dynamic network updates, supporting real‑time closed‑road information for navigation map updates and intelligent transportation system services.
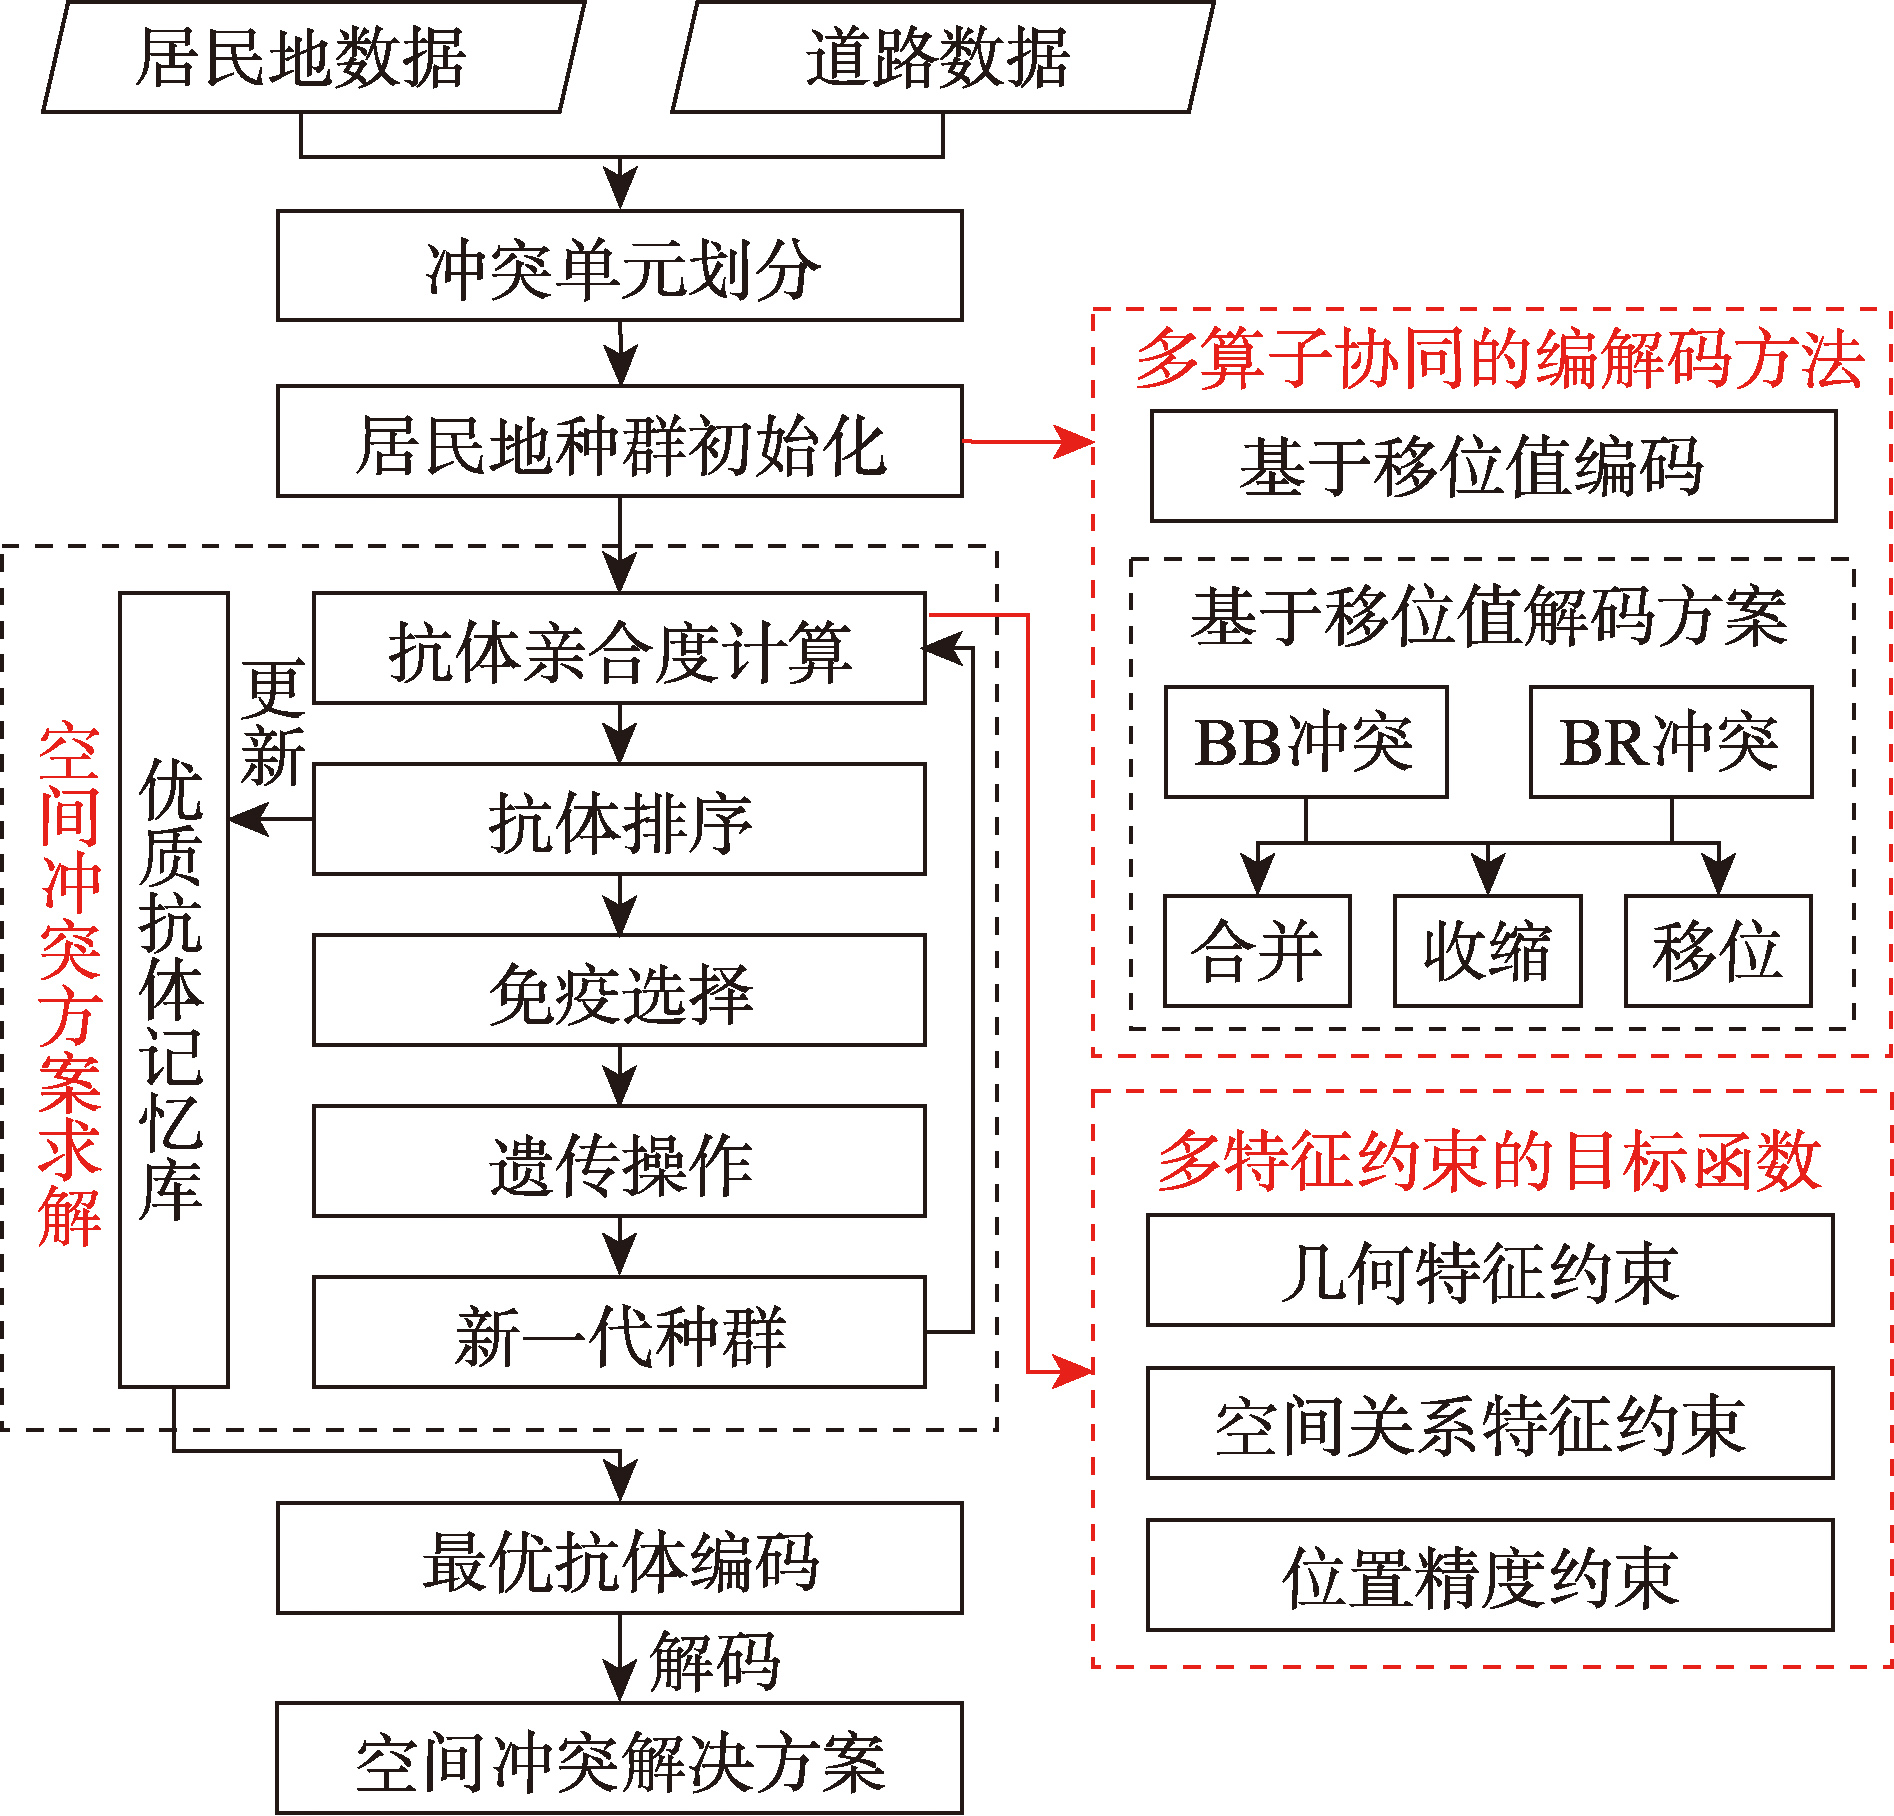
[Objectives] Spatial conflict detection and processing is a critical procedure for updating information ingestion in the incremental updating of geospatial data, and serves as an essential prerequisite for guaranteeing the quality, consistency, and long-term availability of geospatial data in dynamic mapping applications. Spatial conflicts arising from scale discrepancies and geometric mismatches during incremental updates primarily manifest as topological conflicts (e.g., overlaps, gaps) and proximity conflicts (e.g., insufficient minimum distance), which necessitate collaborative resolution via generalization operators including displacement, aggregation, and simplification. Existing methods predominantly focus on generating optimal solutions for displacement operator or resolving conflicts using multiple generalization operators according to predefined rules. The former approach neglects multi-operator collaboration, while the latter struggles to resolve complex secondary conflicts. [Methods] To mitigate these limitations, this paper proposes a multi-operator collaborative spatial conflict resolution method based on an immune genetic algorithm. The method incorporates displacement, shrinking, and aggregation operators into the optimization process of immune genetic operators. The immune genetic algorithm serves as the heuristic framework for generating optimal solutions to spatial conflicts. By designing an operator collaborative encoding mechanism and a multi-feature constraint function, the optimization algorithm can simultaneously search for the optimal operator types and optimal parameter configurations during iteration. Ultimately, it generates a globally optimal solution that balances conflict elimination effectiveness and geographic feature fidelity, which achieves a core breakthrough in transforming multi-operator collaboration from an auxiliary processing mode to an integrated collaborative optimization mode. [Results] A comparative experiment was performed on 1:50 000 residential areas and road data in a region of Zhejiang Province against existing advanced methods. Quantitative analysis results show that, compared with traditional multi-operator spatial conflict resolution methods relying solely on shift operators or serial collaboration, the proposed method in this paper can reduce both the original number of conflicts and conflict severity to zero. Meanwhile, it maintains a high similarity of over 0.95 in the two indicators of spatial feature variation and area feature variation. Qualitative analysis results indicate that this method can generate more reasonable spatial conflict solutions considering multi-feature constraints, effectively resolves conflicts between residential elements and between residential areas and roads, and is suitable for complex conflict processing in multi-scenarios with different regional densities and road distribution patterns. [Conclusions] The method deeply integrates a multi-operator collaborative framework with the immune genetic algorithm, overcoming the limitations of traditional single-operator optimization and local rule-based iteration. It achieves a synergistic improvement between complete conflict resolution and the retention of geographic feature fidelity, providing an efficient and feasible technical solution for spatial conflict processing in multi-scale residential area incremental updating.
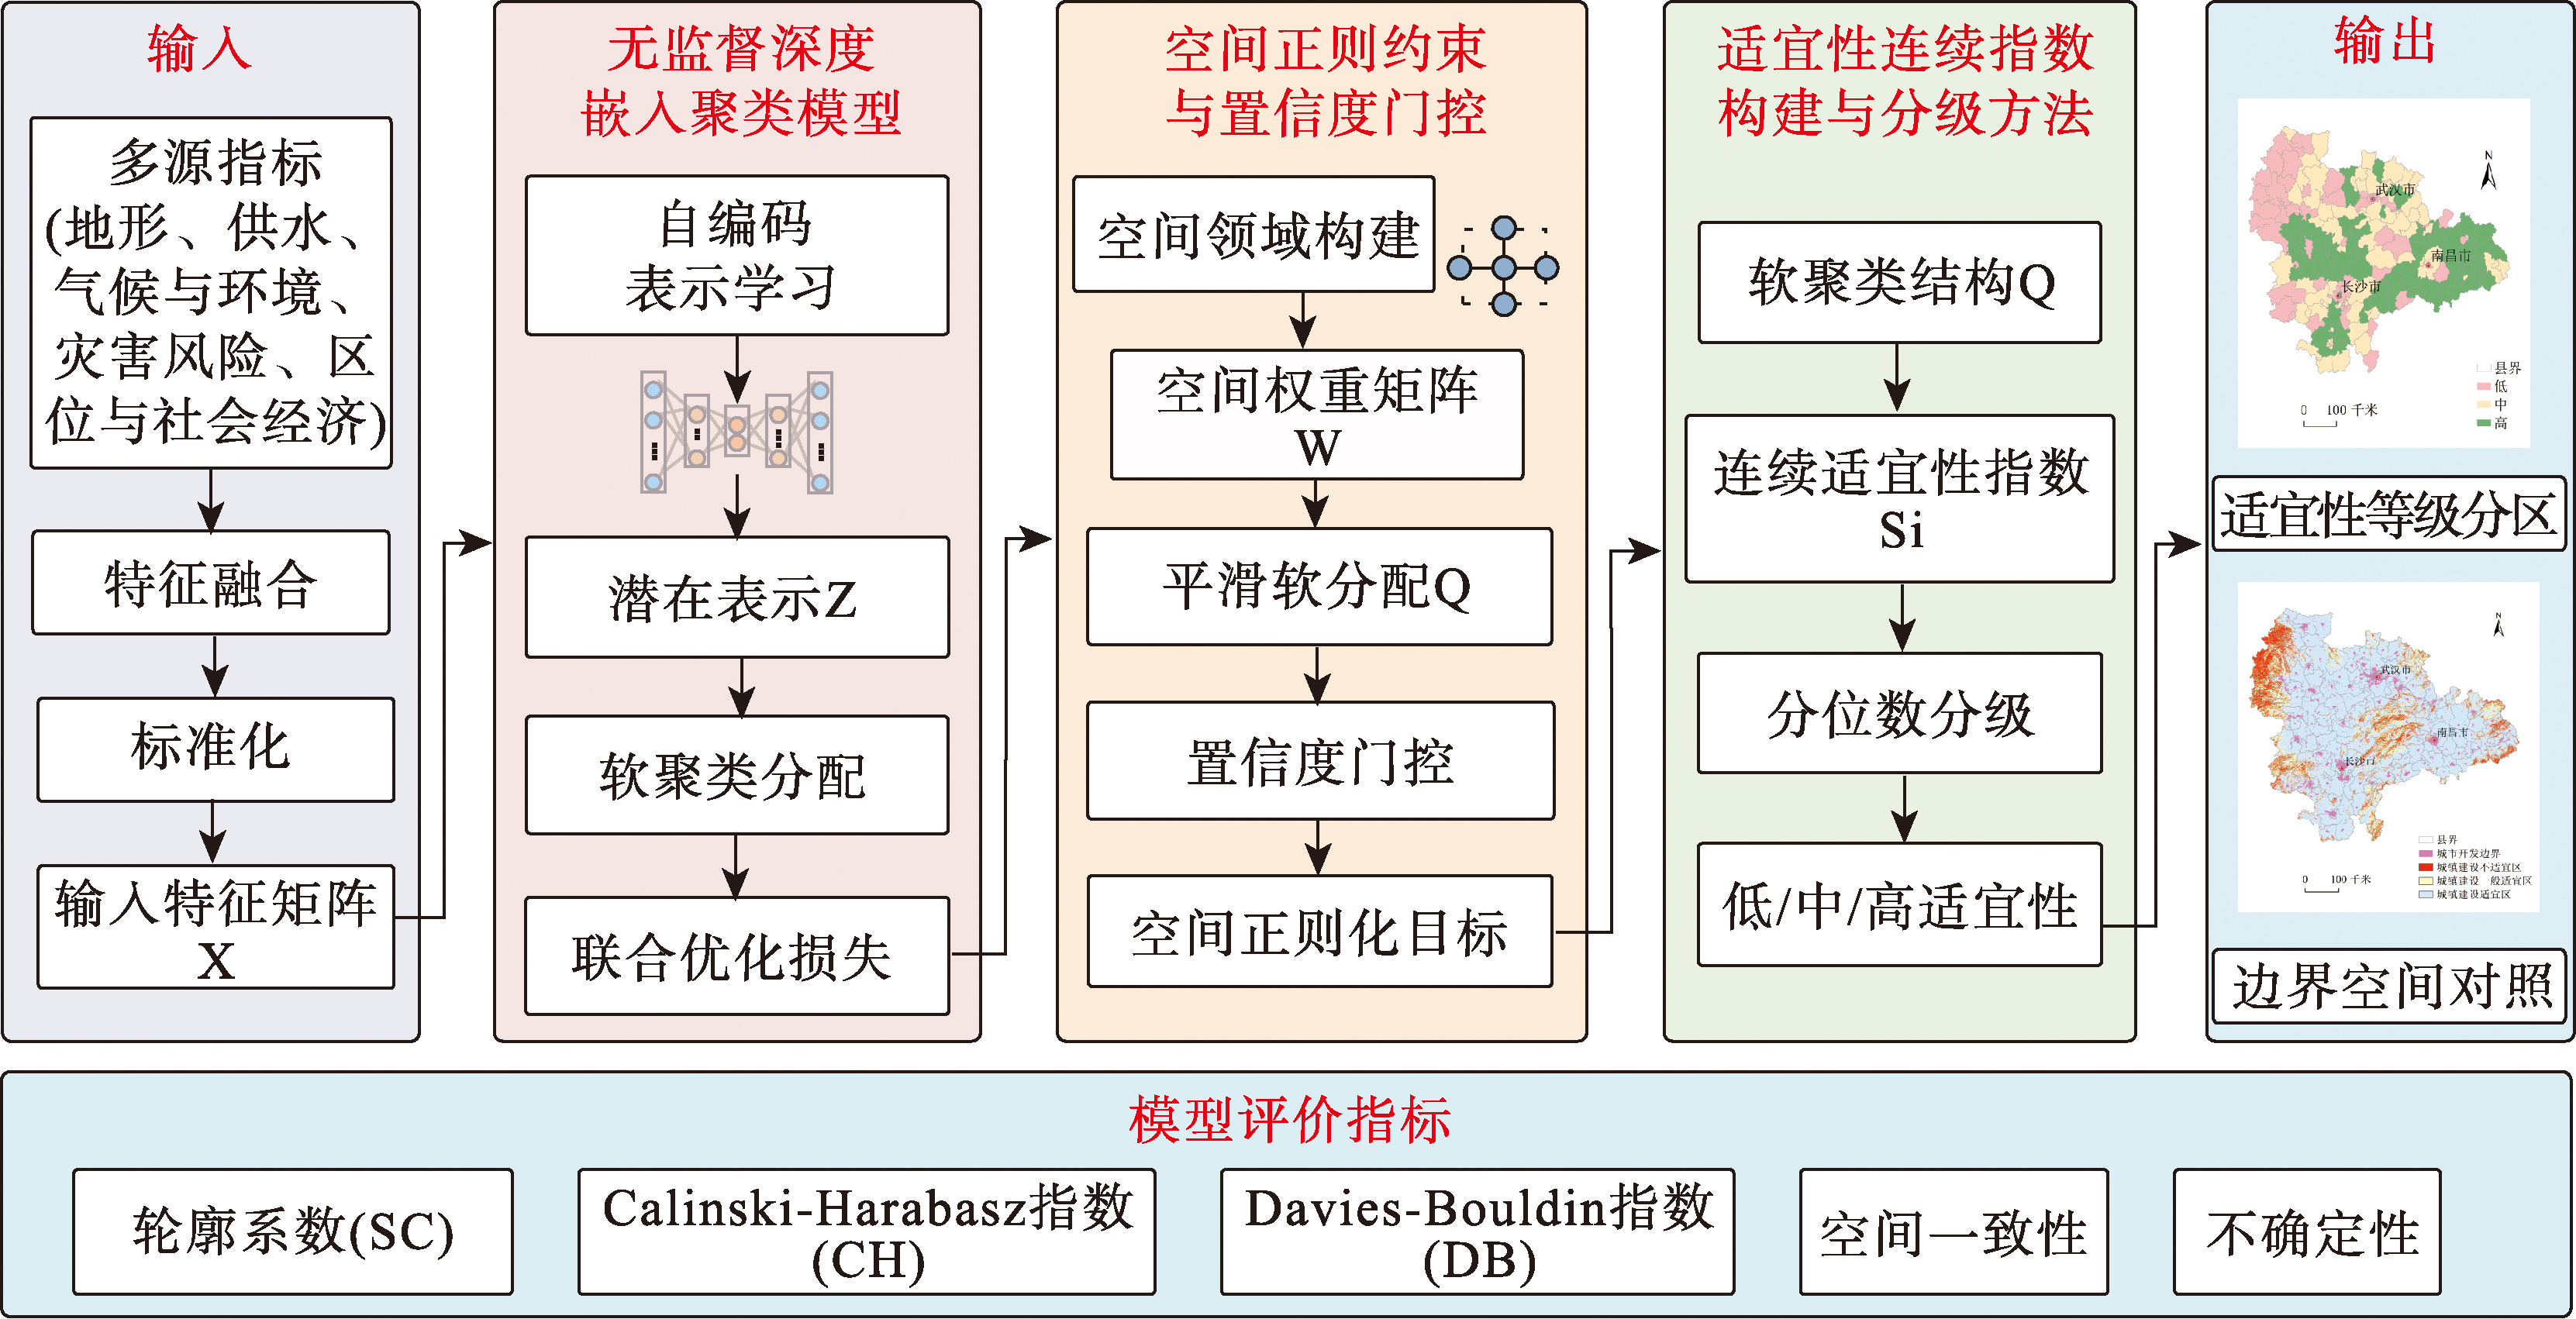
[Objectives] Urban construction suitability evaluation is an essential foundation for territorial spatial planning and urban development regulation. Traditional suitability evaluation methods often rely on indicator weighting and rule-based decision-making, making the results highly sensitive to expert experience and weight assignment, and insufficient for capturing complex nonlinear relationships and spatial heterogeneity among multi-source indicators. To address the issues of strong subjectivity and insufficient spatial continuity in suitability zoning under rapidly increasing multi-source spatial data, this study aims to develop an unsupervised suitability zoning method that reduces human intervention while ensuring spatial continuity and planning semantic interpretability. [Methods] An unsupervised deep clustering method incorporating spatial regularization (SR-IDEC) was proposed. The method employs deep embedded clustering with an autoencoder network to learn low-dimensional latent representations of multi-source suitability indicators, enabling unsupervised zoning of spatial units. A spatial regularization term based on spatial proximity relationships was introduced during clustering optimization, combined with a confidence-gated mechanism to adaptively adjust the strength of spatial constraints, thereby enhancing spatial consistency while avoiding excessive smoothing of boundary areas. Furthermore, soft clustering outputs were mapped into a continuous suitability index to achieve quantitative expression of zoning results. Taking the urban agglomeration in the middle reaches of the Yangtze River as the study area, K-Means, Gaussian Mixture Model (GMM), Agglomerative Clustering, and Spectral Clustering were selected as comparative methods. Model performance was validated using Silhouette Coefficient (SC), Calinski-Harabasz Index (CH), and Davies-Bouldin Index (DB). [Results] The experimental results demonstrate that SR-IDEC achieves superior clustering performance across all evaluation metrics. The Silhouette Coefficient of SR-IDEC reaches 0.860, representing improvements of approximately 32.1%, 23.6%, 22.7%, and 24.3% compared with K-Means (0.651), GMM (0.696), Agglomerative Clustering (0.701), and Spectral Clustering (0.692), respectively. The Calinski-Harabasz Index reaches 357.9, showing an improvement of approximately 98.3% compared with K-Means (180.5). The Davies-Bouldin Index decreases to 0.217, which is approximately 65.1% lower than that of K-Means (0.621). In addition, the suitability zoning results generated by SR-IDEC exhibit higher spatial continuity and clearer boundary structures, effectively reducing local fragmentation. [Conclusions] The proposed SR-IDEC method effectively captures nonlinear structural relationships among multi-source suitability indicators under an unsupervised framework. It significantly improves clustering quality while enhancing spatial continuity and zoning stability, providing a data-driven approach with spatial rationality and planning semantic support for urban construction suitability zoning.
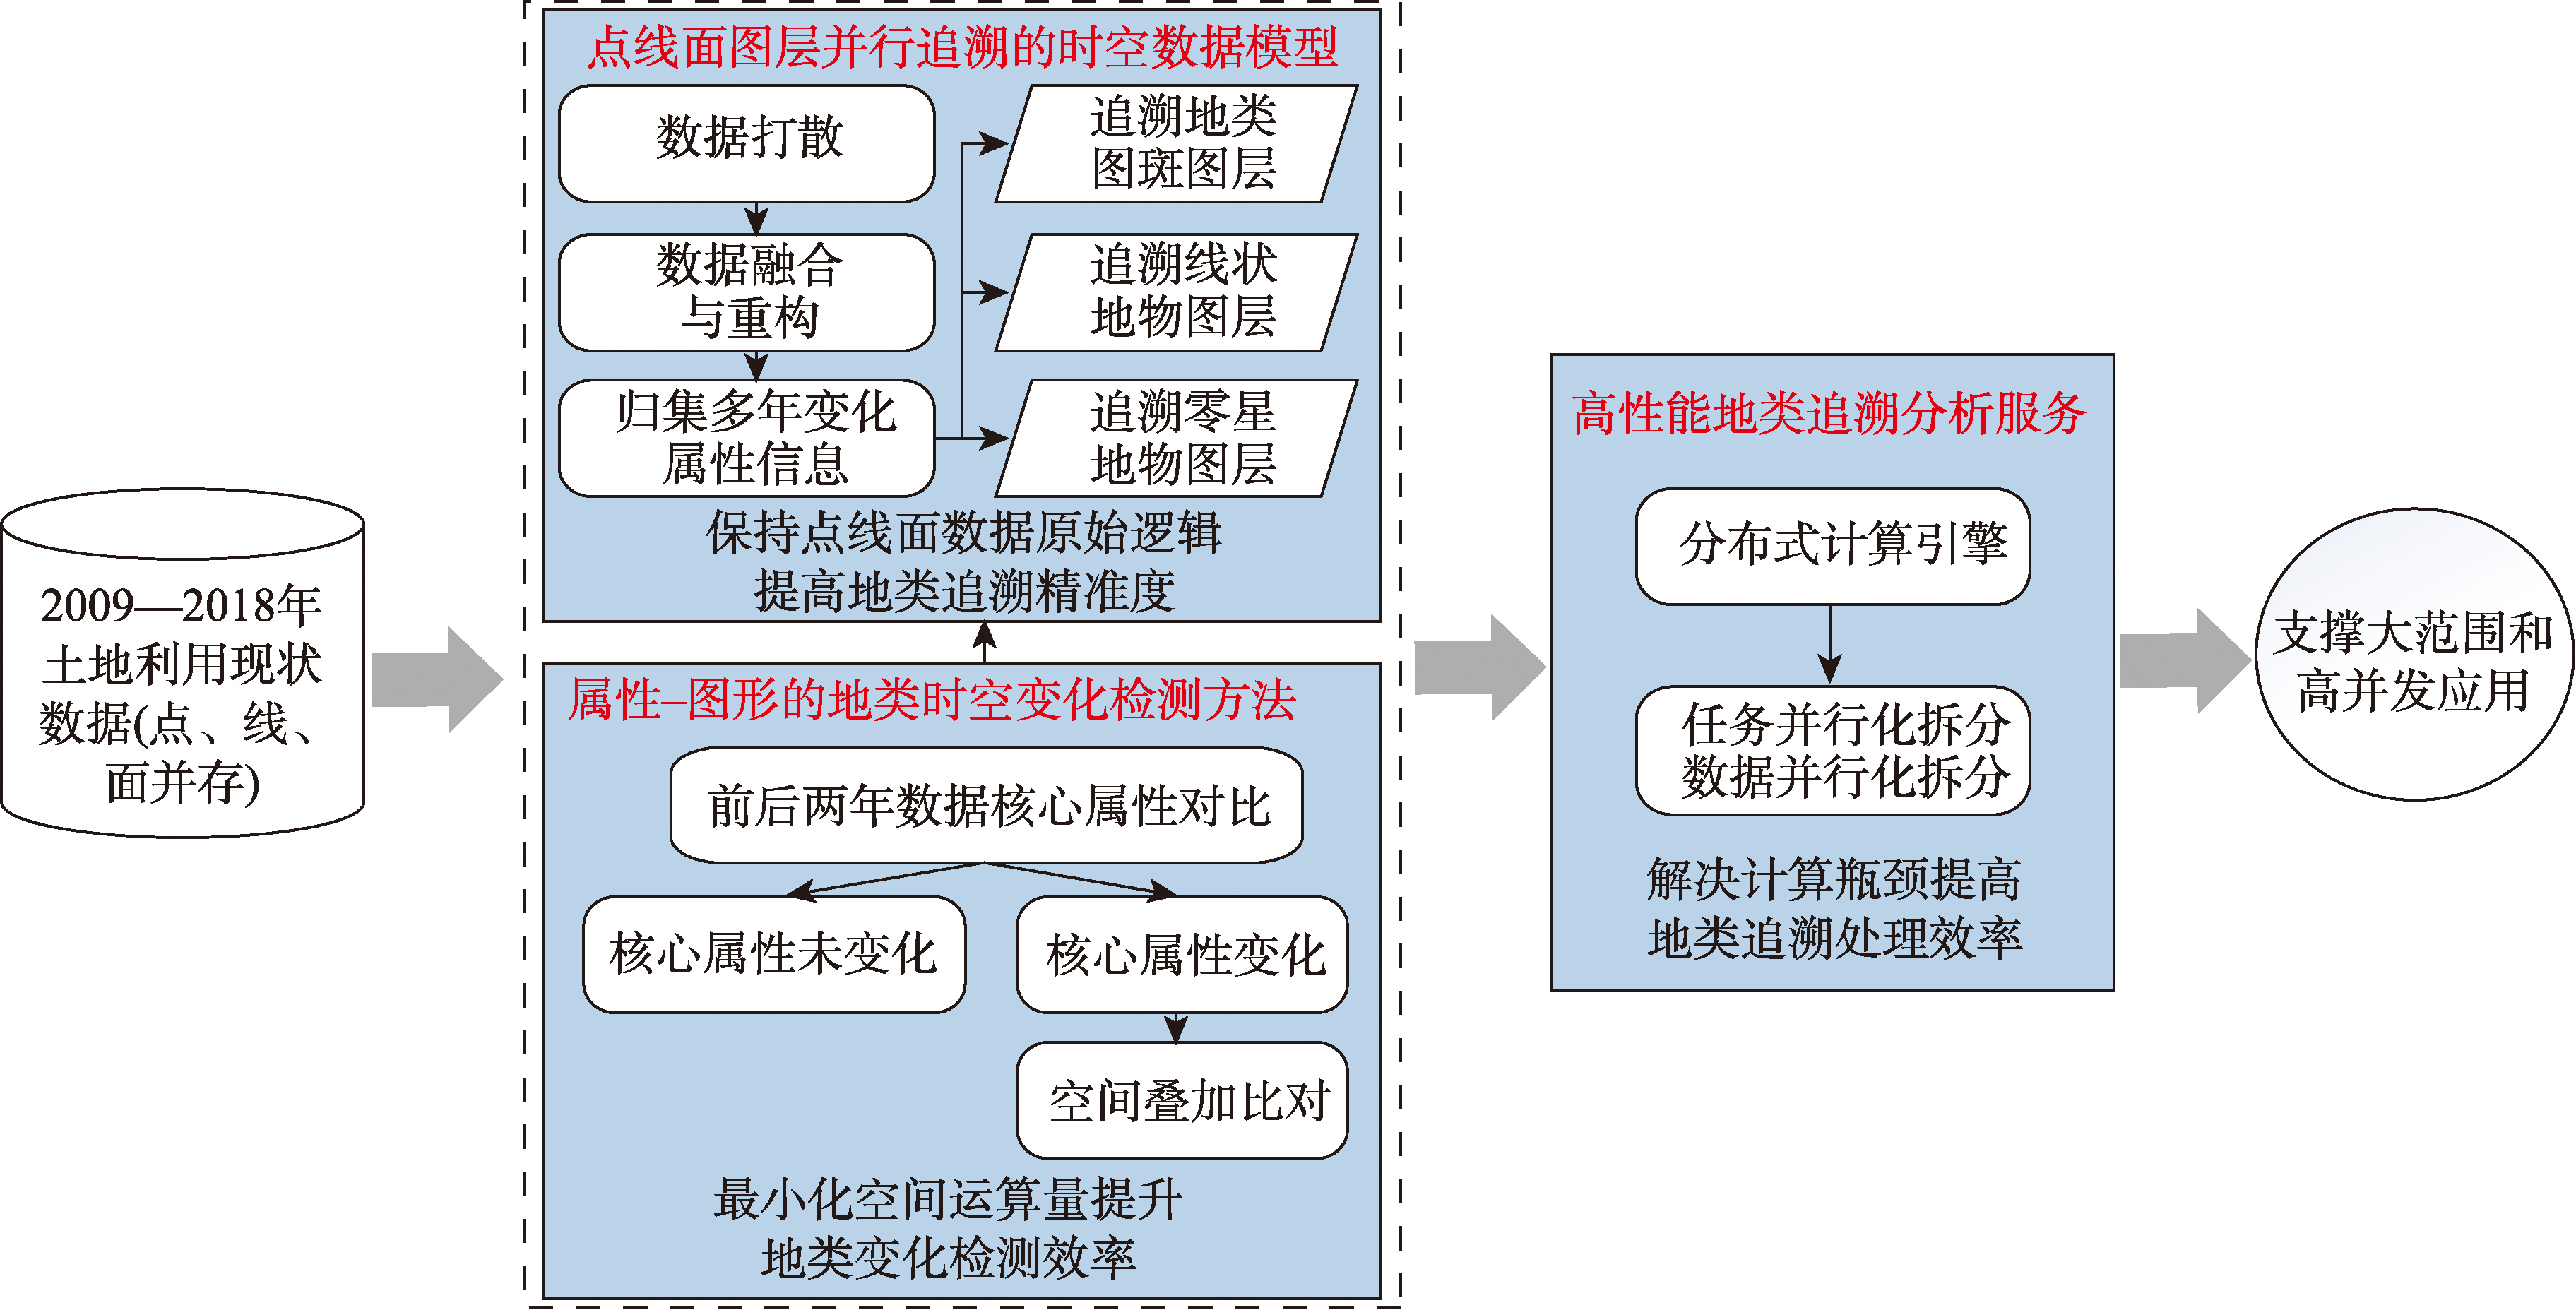
[Objectives] This paper addresses the need for tracing the historical land types of construction land during the approval process. [Methods] Based on the national land use survey data from 2009 to 2018, which incorporates point, polyline, and polygon layers simultaneously, an efficient retrospective tracing methodology is proposed to handle large-scale, multi-source, and long-term time series data. Firstly, this method establishes a spatiotemporal data model enabling parallel tracing of point, polyline, and polygon features, the model preserves the original graphical features and area calculation logic of sporadic features, linear features, and land type patches, in order to ensure the accuracy of land type retrospective results. Secondly, by designing an attribute-graphic change detection pathway, the method prioritizes attribute-based identification of unchanged patches to reduce spatial overlay operations, which significantly enhances the efficiency of land type retrospective processing. Finally, a land type retrospective tracing and analysis service based on a distributed computing engine was established. Through parallel task scheduling and distributed computing, high-performance computing for land type retrospective tracing is achieved in scenarios involving massive data and high-concurrency applications on a national scale. [Results] Through validation by 10 instances of linear and areal complex construction engineering projects spanning multiple provinces, the results indicate that: A total of 114 land patches across the ten validation projects were manually verified against the retrospectively traced land types and areas using the ArcGIS platform, the findings demonstrated complete consistency and accuracy. For one of the 10 validation projects, which involved a large number of parcels spanning multiple counties and required extensive tracing, a comparison of computation time was made with the full polygon construction method employed in other studies. The computation time was reduced from 48 hours to 0.5 hours, representing a tens-fold increase in computational efficiency. A comparison of the total land area before and after retrospective tracing for the 10 validation projects revealed a difference of 76.96 square meters, with a difference rate below 0.03‰, far lower than the 1‰ tolerance specified for total area in operational management, thereby meeting the accuracy requirements for construction land approval and management. [Conclusions] The proposed method demonstrates significant advantages over existing approaches in computational efficiency, tracing accuracy,and scalability for large-scale applications, providing reliable technical support for land type identification in construction land approval. Moreover, the attribute-graph change detection strategy employed in this study can serve as a reference for long-term spatiotemporal change detection in other fields.
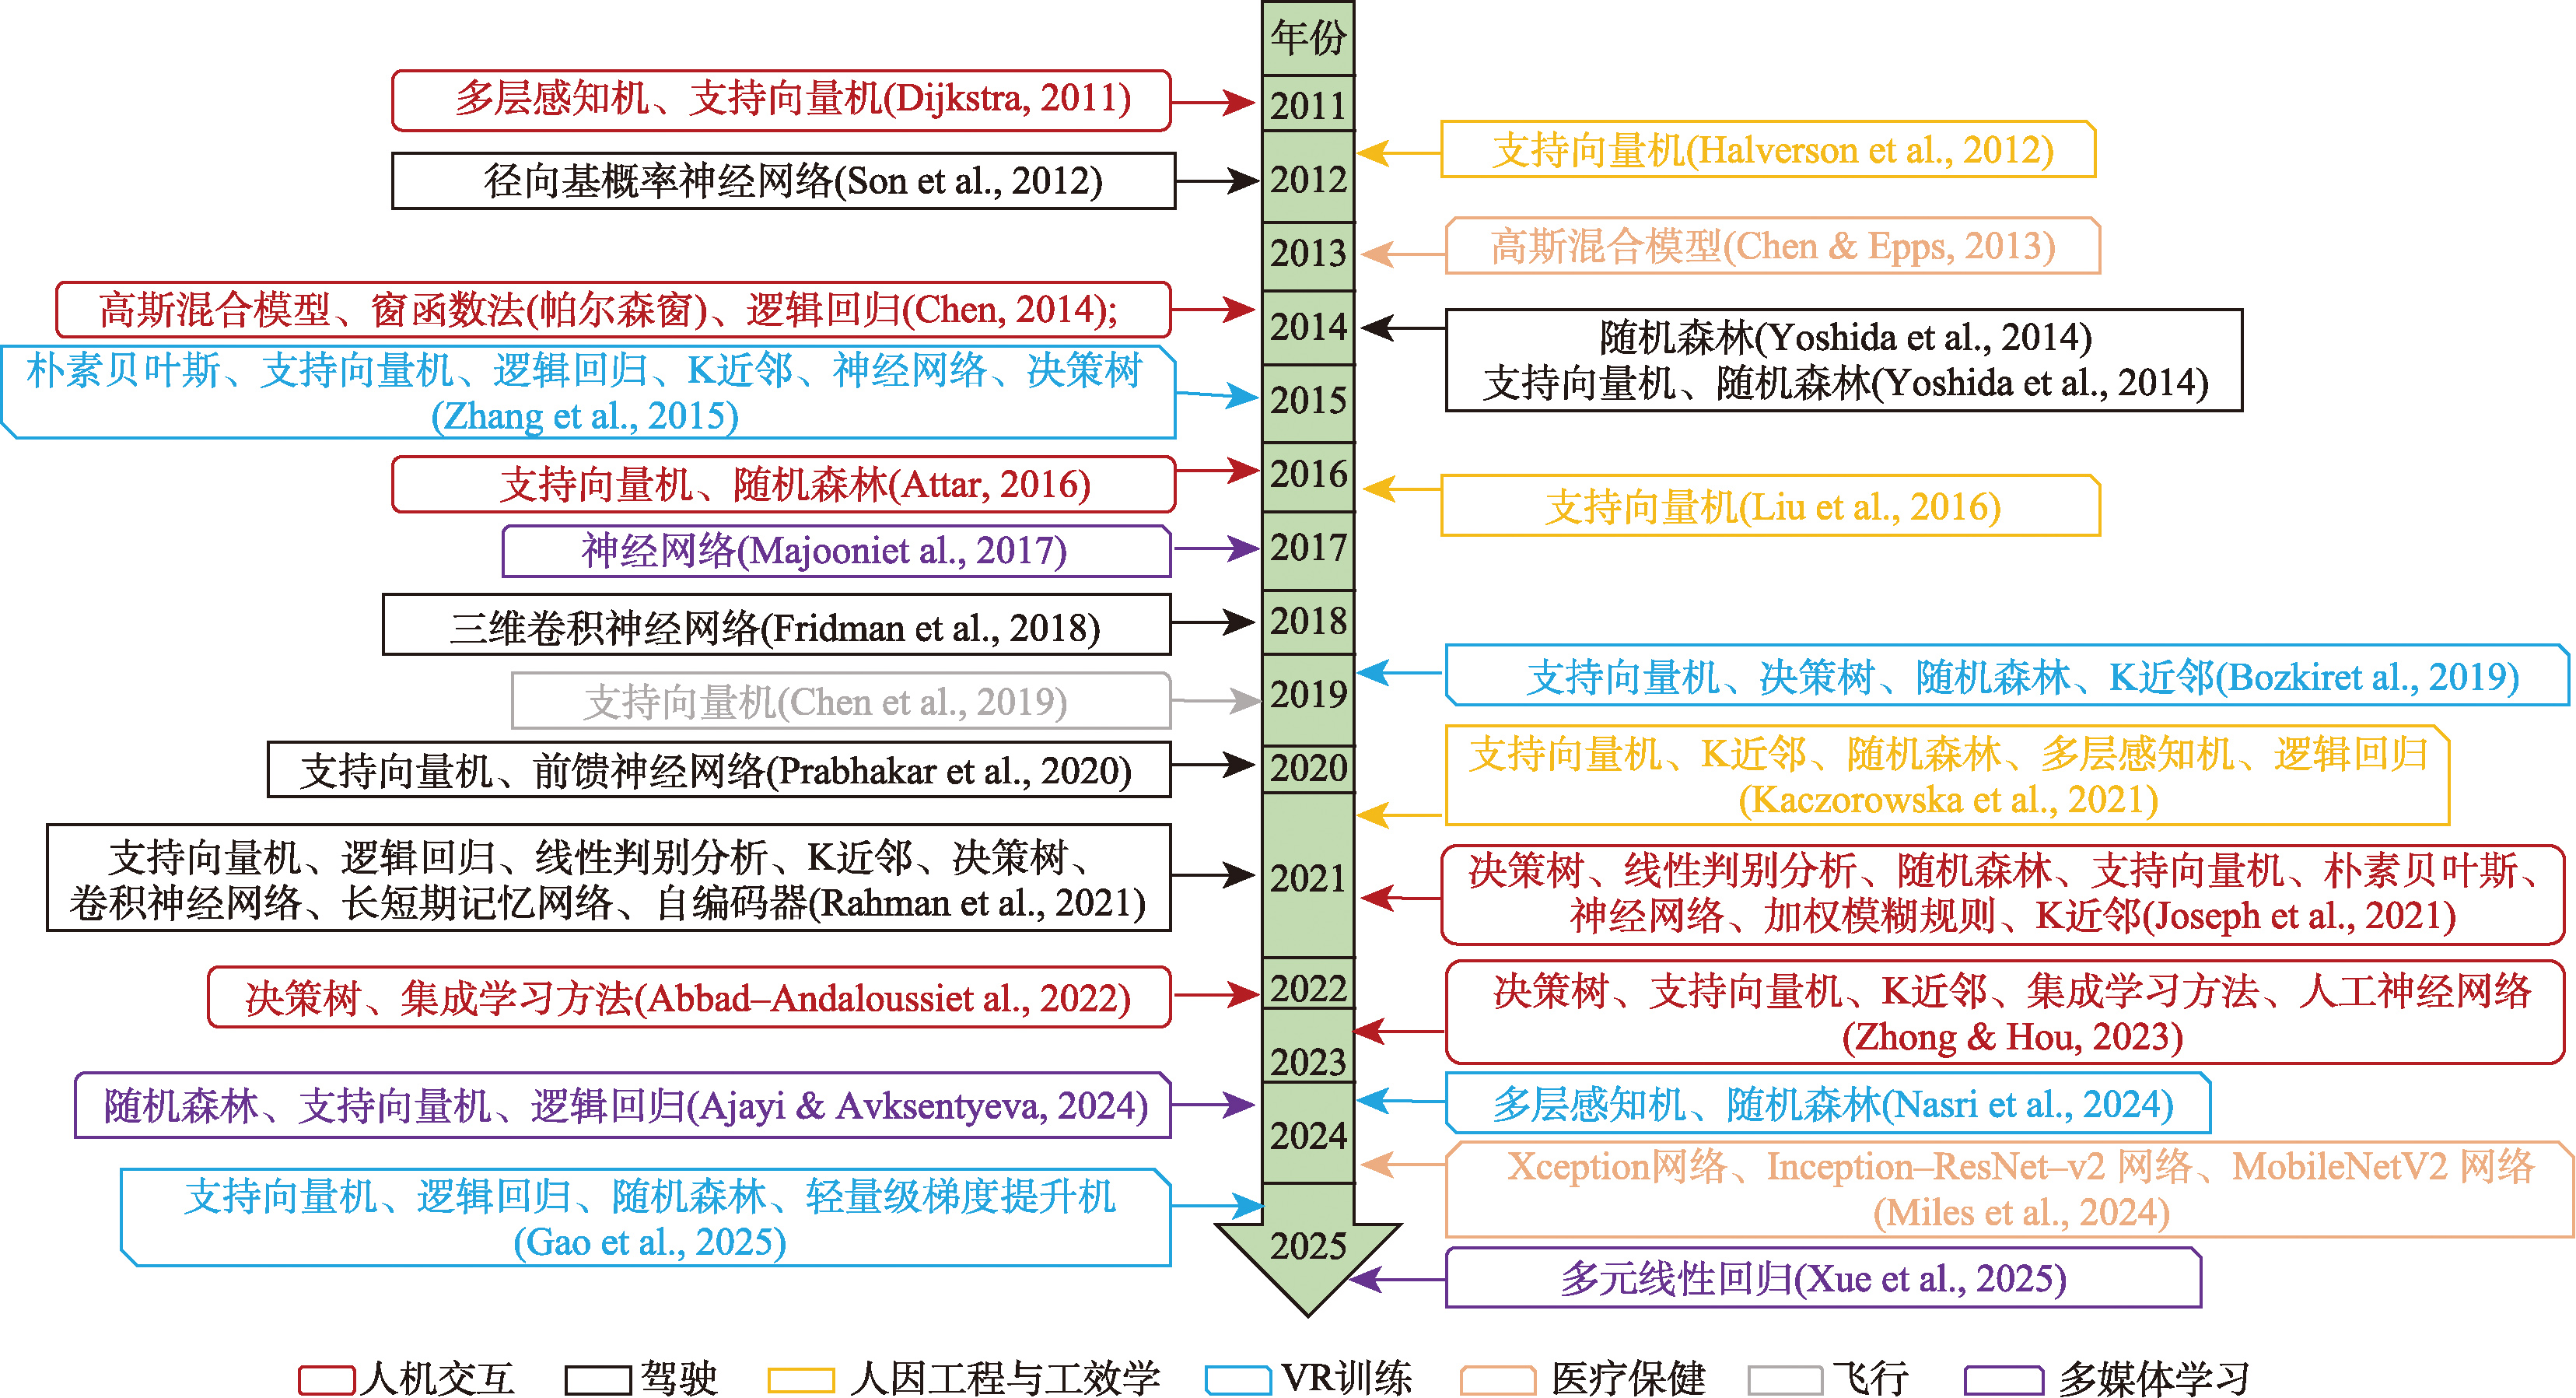
[Objectives] As Geographic Information Science advances into an artificial intelligence-driven phase, the forms and functions of maps are becoming increasingly generalized, and users' cognitive demands regarding maps are shifting from "seeing information" to "efficient understanding." Traditional methods for assessing cognitive load in map-based tasks are constrained by several limitations, including subjectivity, a static and outcome-oriented approach that overlooks process-related data, inability to support real-time evaluation or provide a basis for dynamic adjustment, and a lack of quantitative analysis. [Methods] In this study, eye-tracking technology and machine learning are integrated to establish a cognitive load assessment model for map localization tasks under different maps. The entire framework is divided into three stages: data collection, data processing, and model construction. Eye-tracking data are collected from 30 subjects via a between-subjects experiment under three map conditions (2D maps, 3D maps, and satellite imagery). After data cleaning and windowing processing, two-round feature selection is implemented using the Kruskal-Wallis test and random forest feature importance ranking. Finally, five classification models, including Logistic Regression (LR), Random Forest (RF), Support Vector Machine (SVM), Long Short-Term Memory network (LSTM), and Convolutional Neural Network (CNN), are constructed. The classification performances of these models for cognitive load are compared and analyzed, and the effectiveness of the proposed method is verified. [Results] The results of the eye-tracking experiment indicate that significant differences are observed in cognitive load among different maps: the highest cognitive load is detected in satellite imagery, followed by 3D maps, and the lowest is found in 2D maps. Meanwhile, differences in cognitive load levels are observed between genders, and a higher cognitive load is exhibited by male participants. The vast majority of eye-movement features extracted in this study show statistically significant differences across various cognitive load levels, and the effectiveness of the proposed feature construction method for the assessment of cognitive load in map localization was validated. Results from 10-fold cross-validation demonstrate that the optimal classification performance is achieved by the random forest model among the five compared models, with an average accuracy of 0.743±0.029 and an AUC value of 0.874 8. The superiority of this model over other models is confirmed by the Friedman test (p<0.001), and the feasibility and effectiveness of the machine-learning method based on eye-movement data for the quantitative assessment of cognitive load in map positioning are fully verified. [Conclusions] The proposed cognitive load assessment approach for map localization, which integrates eye-tracking technology and machine learning, is proven effective in quantifying the cognitive load level during map usage. Among all models, the random forest model is demonstrated to be superior in feature discrimination ability and classification stability, providing important methodological support and empirical evidence for constructing adaptive map systems, as well as for applications such as human-computer interaction and navigation assistance, personalized geographic information services, and experience optimization in virtual reality/augmented reality geographic environments.
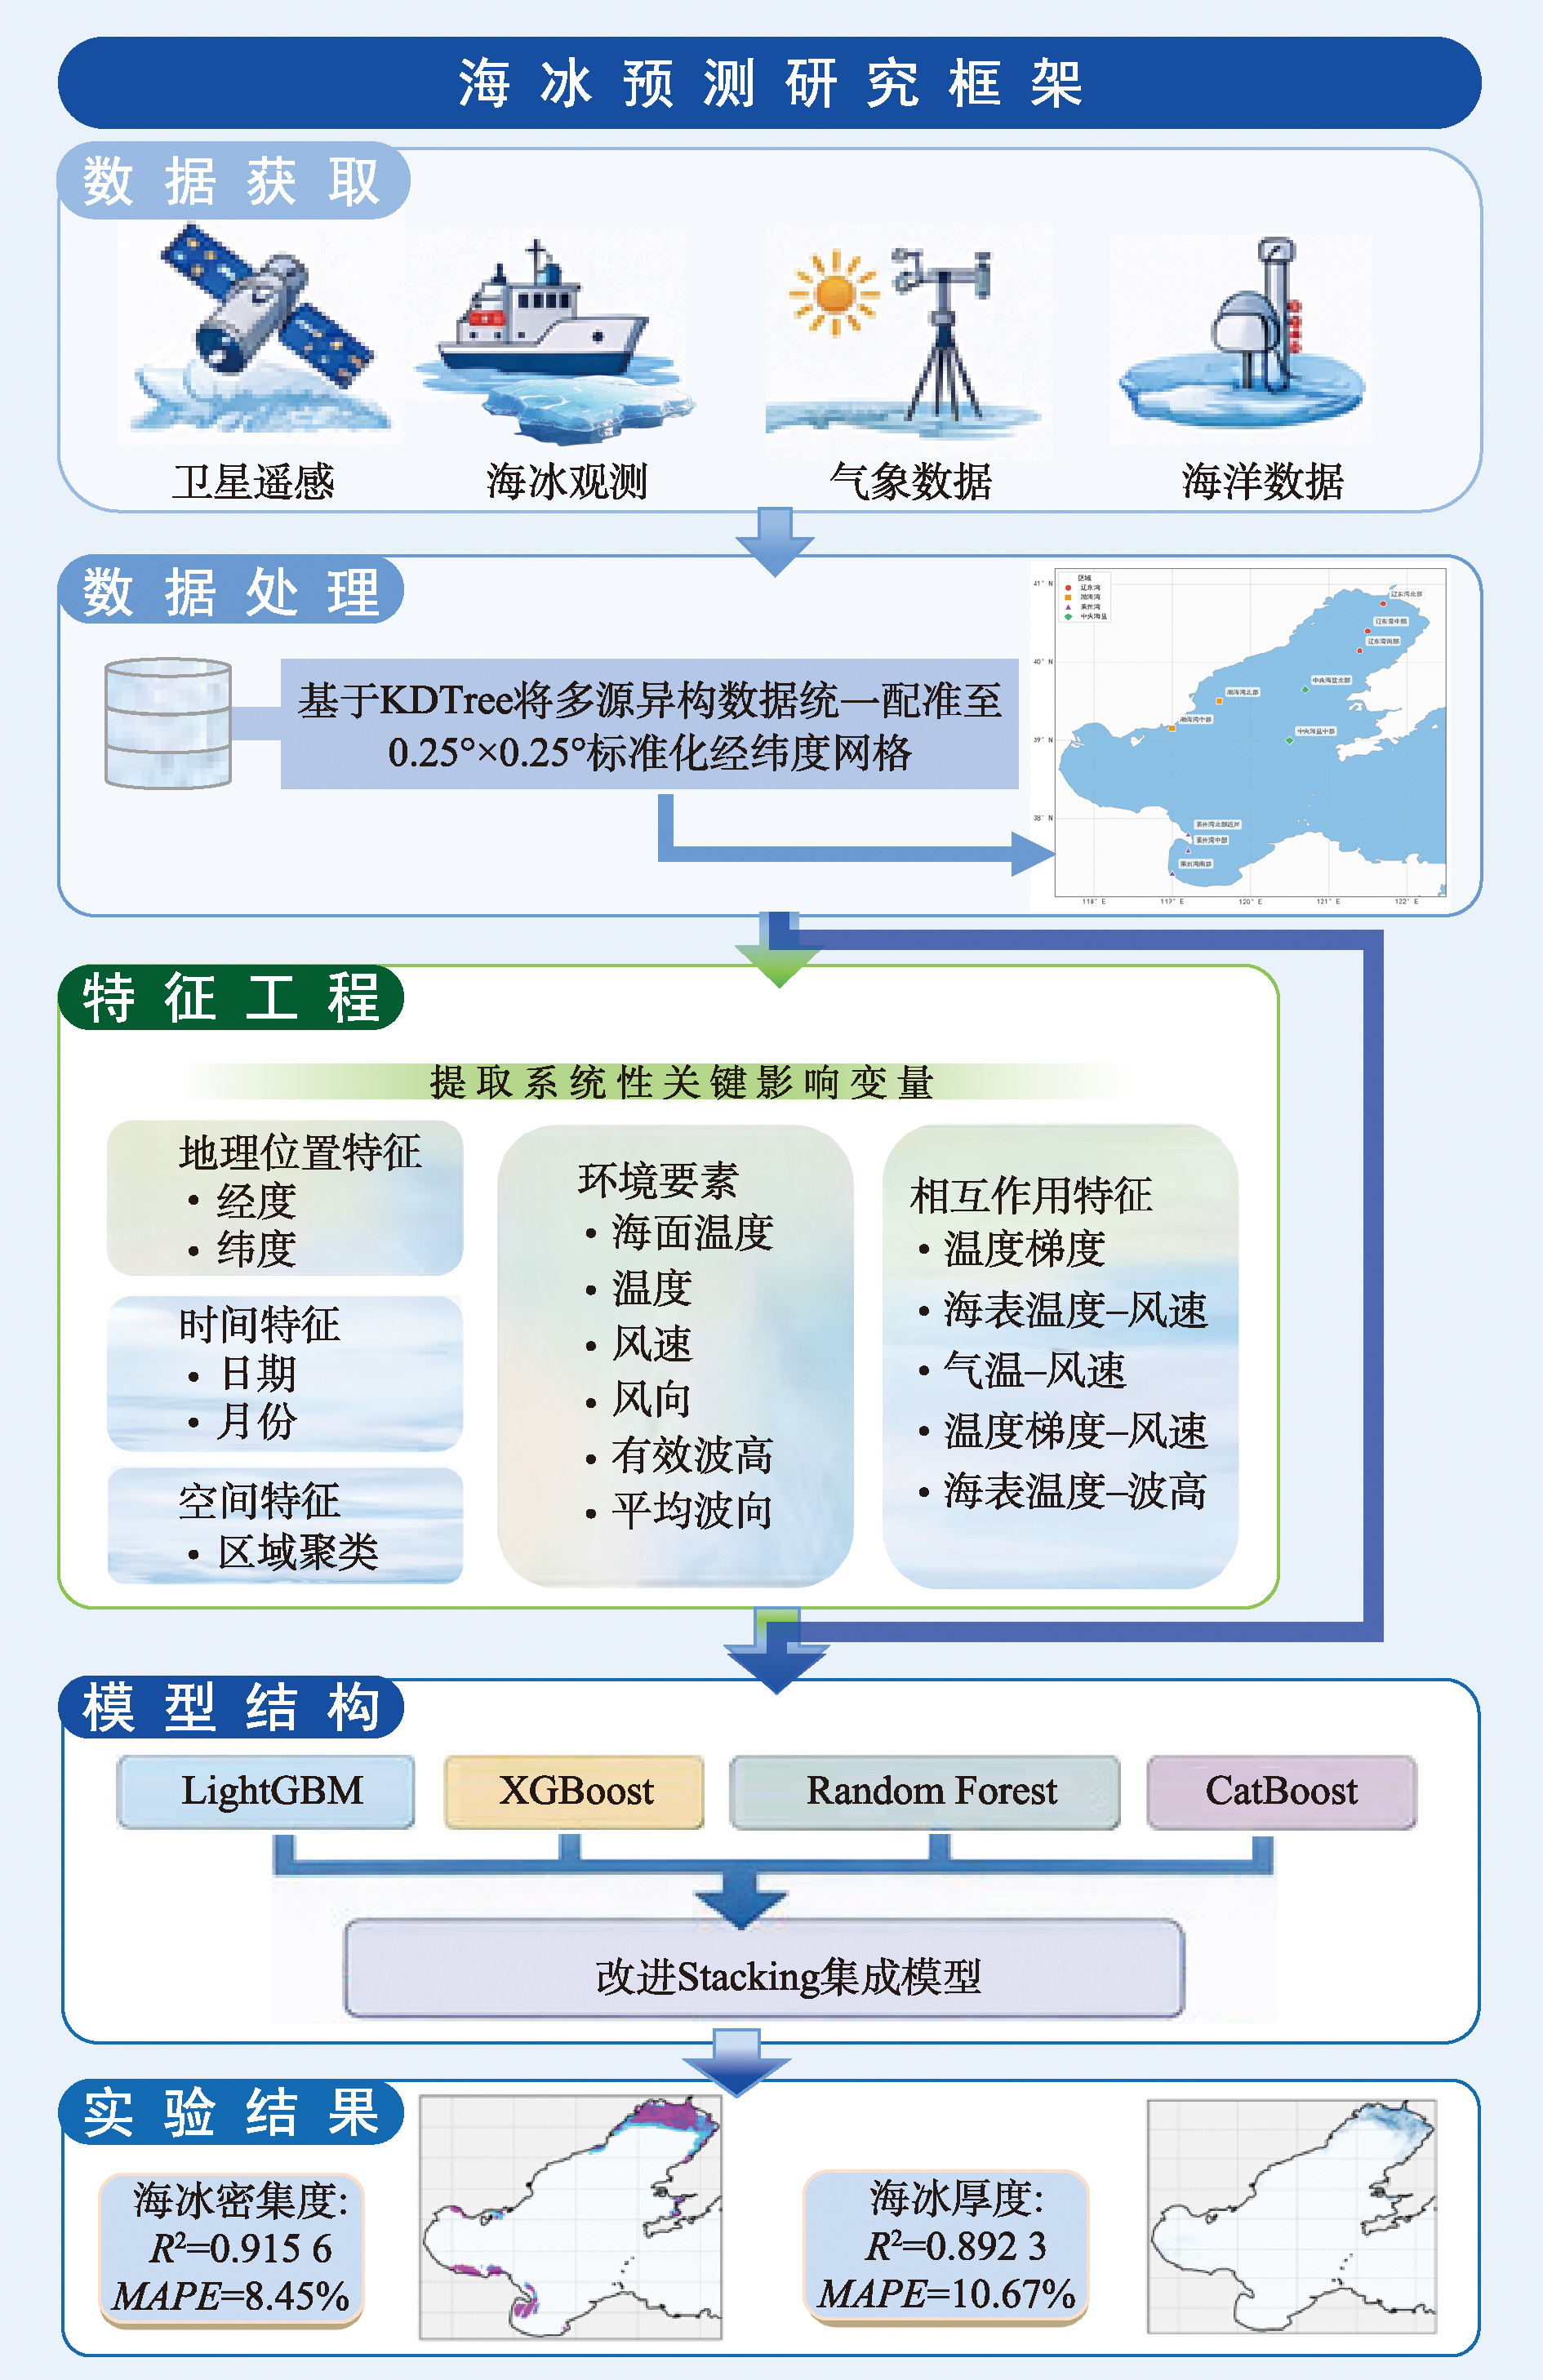
[Objectives] Sea ice is an important natural phenomenon in the marine environment and is widely distributed across the global oceans. The formation and evolution of sea ice in this region exert significant influences on marine ecosystems, maritime transportation, and offshore energy development. Accurate sea ice prediction is therefore essential for disaster prevention, risk assessment, and navigation safety in ice-affected waters. [Methods] Considering that sea ice monitoring data originate from multiple sources with notable differences in spatial and temporal resolutions, this study constructs a multi-source heterogeneous database integrating sea ice concentration, sea ice thickness, and various atmospheric and oceanic environmental variables. To address inconsistencies among datasets, a k-nearest neighbor inverse distance weighting interpolation algorithm optimized by KDTree spatial indexing is employed. This method enables efficient spatial search and interpolation, allowing heterogeneous datasets to be uniformly registered onto a standardized 0.25° × 0.25° latitude-longitude grid, thereby ensuring spatiotemporal consistency for subsequent analysis. Based on the integrated dataset, a systematic feature engineering process is conducted to extract key factors influencing sea ice evolution. The constructed feature system includes multiple categories of variables, such as spatiotemporal characteristics, meteorological conditions, and ocean dynamic factors, which collectively capture the environmental mechanisms affecting sea ice formation, growth, and melting. Given the complex nonlinear relationships between environmental variables and sea ice dynamics, an improved stacking ensemble learning framework is proposed to predict both sea ice concentration and sea ice thickness. The framework integrates several machine-learning algorithms, including LightGBM, XGBoost, Random Forest, and CatBoost, as base learners. Unlike conventional ensemble approaches based on fixed-weight voting or simple averaging, the proposed stacking architecture incorporates both the predictions of base learners and the original feature variables into the meta-learning stage, enabling the model to better capture interactions between environmental features and prediction outputs. [Results] The proposed method is applied to the Bohai Sea during the winters of 2021/2022 and 2022/2023. Experimental results show that the improved stacking model achieves high predictive accuracy. For sea ice concentration prediction, the model obtains an R² of 0.915 6 with a Mean Absolute Percentage Error (MAPE) of 8.45%. For sea ice thickness prediction, the model achieves an R² of 0.892 3 and a MAPE of 10.67%. These results indicate that the proposed model significantly outperforms traditional single machine-learning models and fixed-weight ensemble methods. Further comparison with the best-performing individual model, LightGBM, demonstrates that the improved stacking model provides substantial performance improvements. Specifically, the R² value increases by 24.32% and the Root Mean Square Error (RMSE) decreases by approximately 89.79% for sea ice concentration prediction, while the R² increases by 19.70% and RMSE decreases by about 71.80% for sea ice thickness prediction. [Conclusions] Overall, the proposed sea ice prediction framework provides an effective approach for integrating heterogeneous data and improving prediction accuracy, offering valuable technical support for marine environmental monitoring and climate-related risk management.
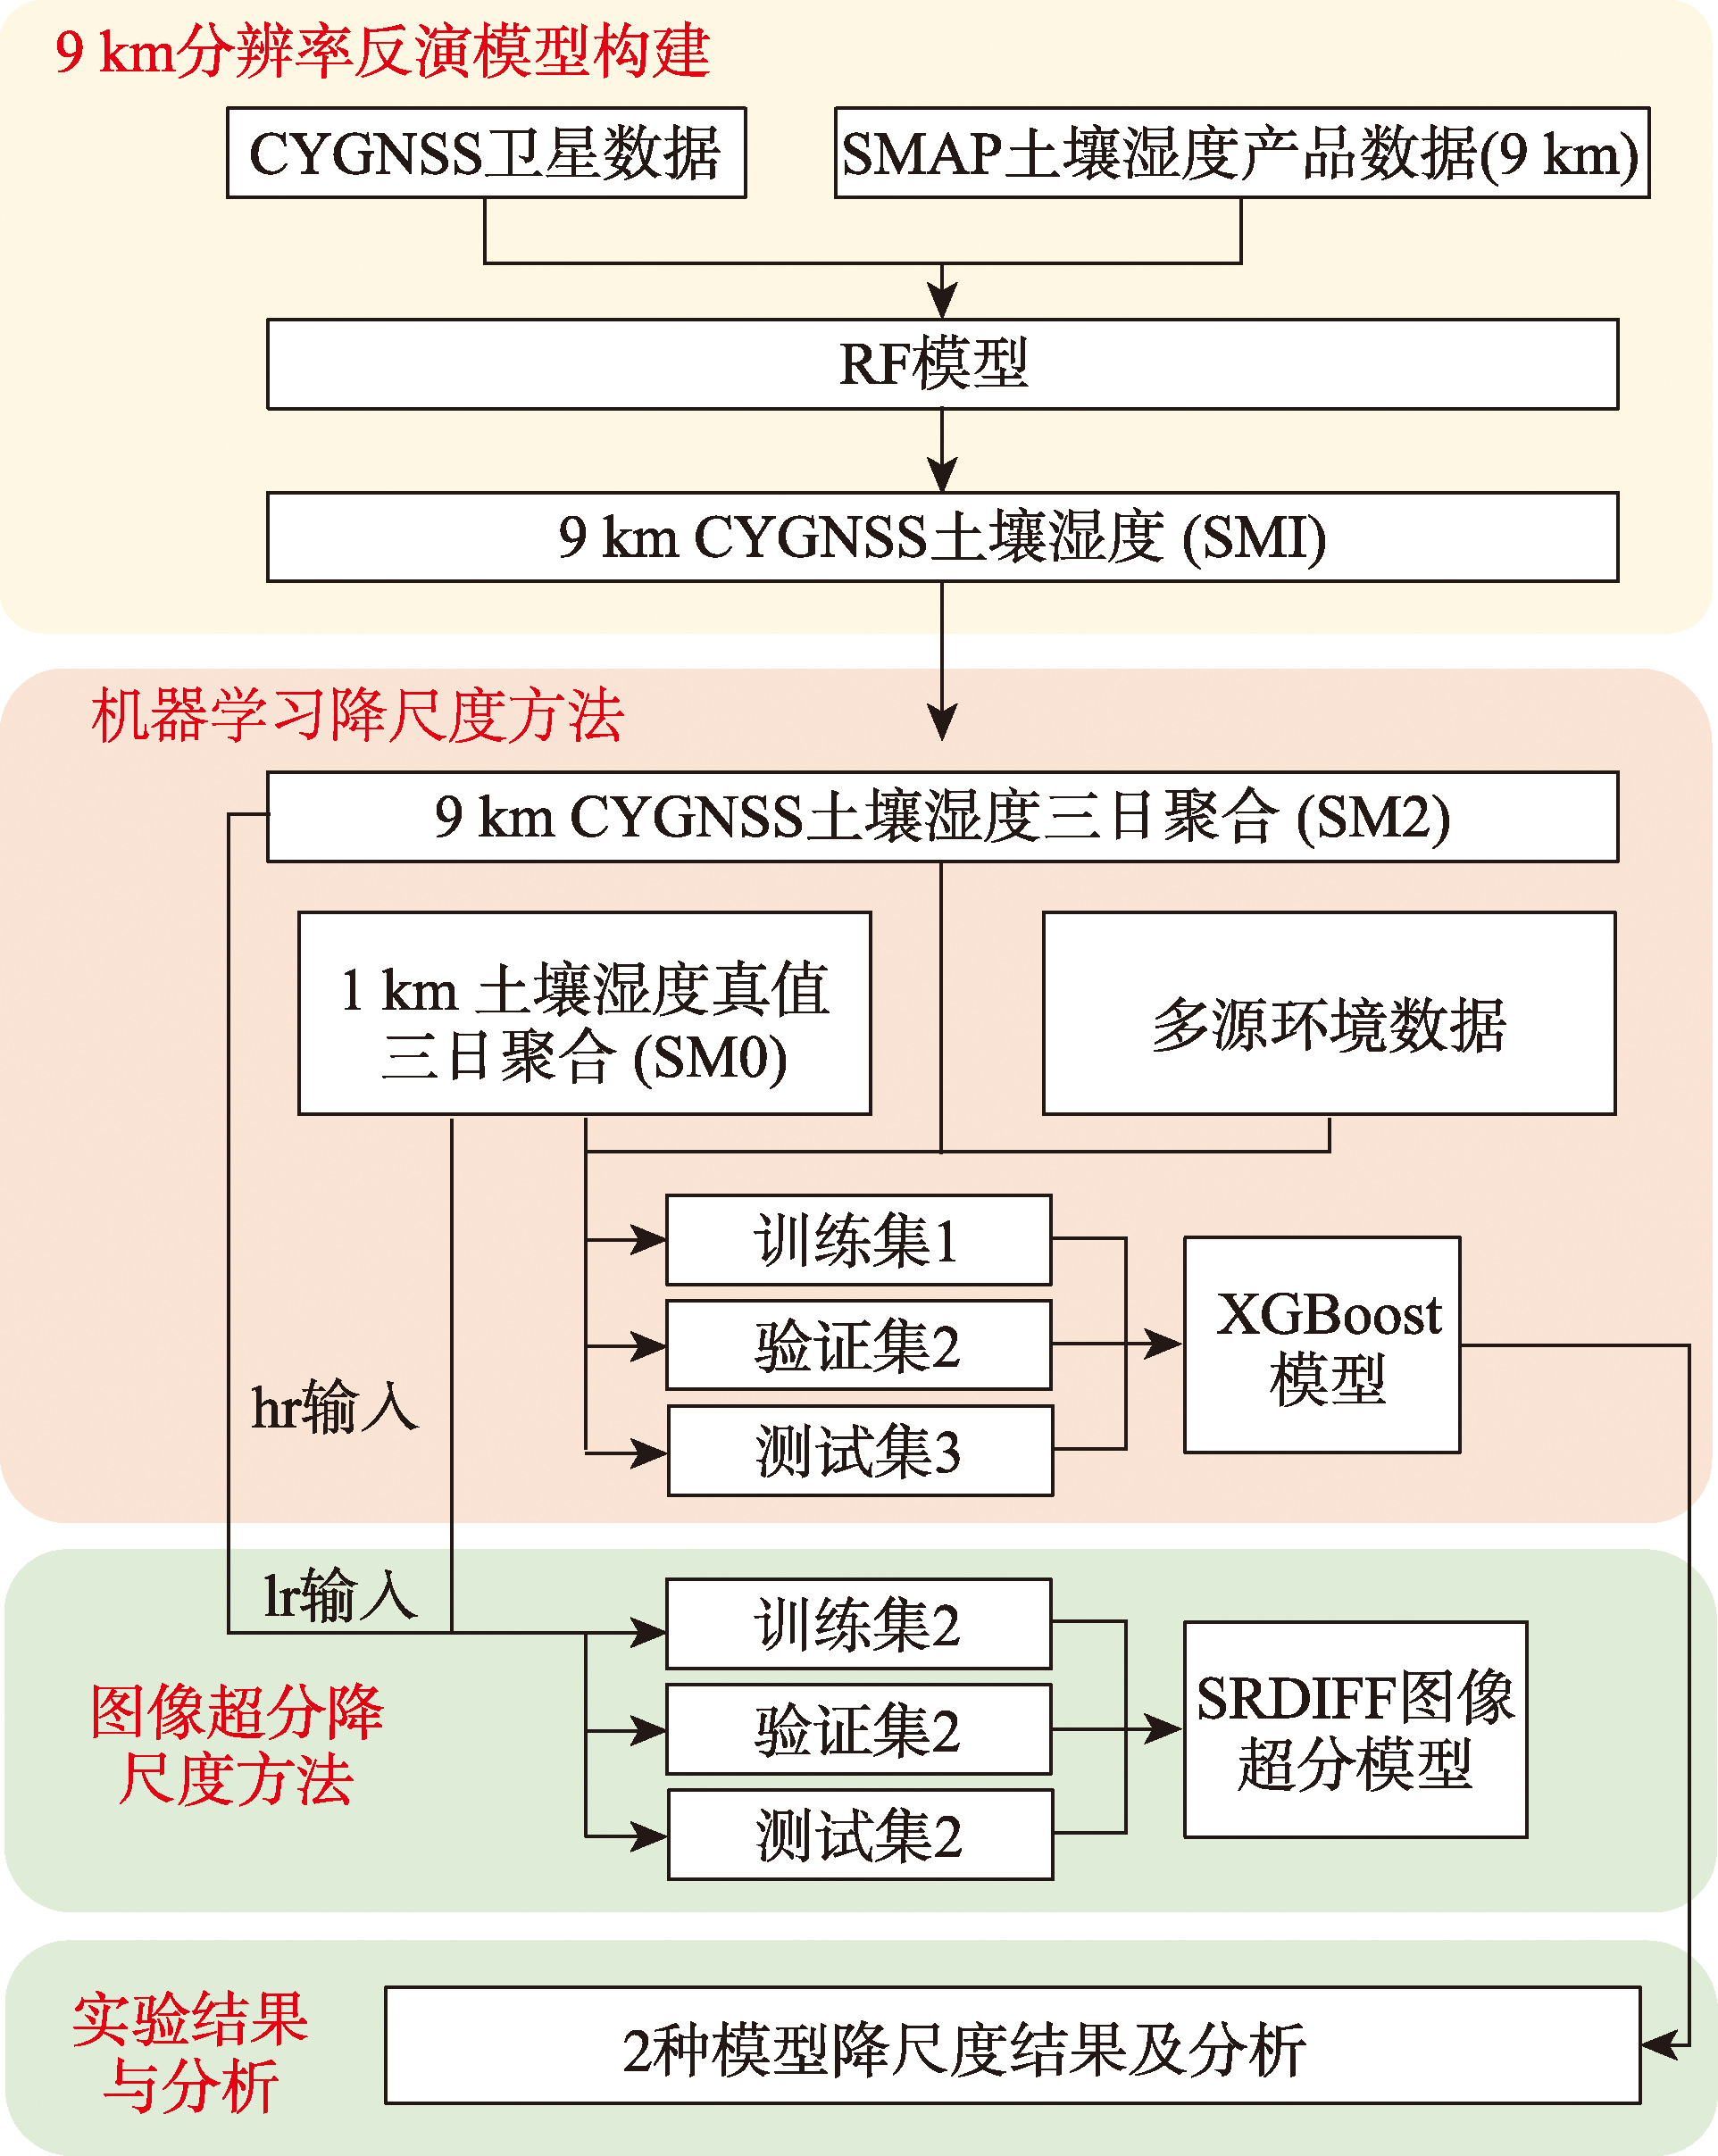
[Objectives] High-resolution soil moisture data serves as the core supporting data for meteorological operational services such as refined agricultural irrigation scheduling, drought disaster monitoring and ecological environment assessment, and is of great significance for improving the research accuracy of hydrological and meteorological processes at the regional scale. Aiming at the problem that the mainstream resolution of current spaceborne GNSS-R soil moisture retrieval is concentrated at 9-36 km, which is difficult to meet the needs of refined applications, this study carries out research on high-resolution soil moisture retrieval and downscaling based on CYGNSS satellite observations, so as to provide a practical and effective technical scheme for the generation of fine-scale soil moisture products. [Methods] Based on the CYGNSS satellite observation data from 2022 to 2023, combined with multi-source environmental and topographic factors such as vegetation water content, vegetation optical depth, surface roughness, elevation and land surface temperature, the Random Forest (RF) model was adopted to realize soil moisture retrieval at a 9 km resolution. On this basis, two independent downscaling methods were designed and compared to generate 1 km resolution soil moisture data. One was the machine learning downscaling method using XGBoost, LightGBM and Stacking models, and the other was the image super-resolution downscaling method based on the SRDIFF diffusion probabilistic model. The accuracy of the two downscaling results was verified and evaluated by using the China 1 km resolution daily all-weather surface soil moisture data as the reference truth value, with multiple indicators including Root Mean Square Error (RMSE), Correlation Coefficient (R), Mean Absolute Error (MAE), Peak Signal-to-Noise Ratio (PSNR) and Structural Similarity Index (SSIM). [Results] Compared with the China 1 km resolution daily all-weather surface soil moisture data, the 1 km soil moisture generated by the XGBoost model has the highest accuracy, with a Root Mean Square Error (RMSE) of 0.063 9 cm³/cm³. The RMSE of the downscaling result obtained by the SRDIFF model is 0.071 3 cm³/cm³, which still maintains good consistency with the reference data in spatial distribution trend. Further analysis shows that the XGBoost model is more capable of capturing small-scale spatial heterogeneity, while the SRDIFF model has obvious advantages in scenarios where high-resolution auxiliary data is missing or difficult to obtain. In addition, the accuracy of the model shows obvious seasonal differences, which is relatively low from March to September and high in October, mainly affected by the changes of precipitation and high-humidity sample proportion. [Conclusions] The proposed framework of "retrieval first, then downscaling" can not only generate high-quality high-resolution soil moisture products by combining original satellite data with environmental auxiliary data, but also generate such products through the transfer application of the SRDIFF image super-resolution model when environmental auxiliary data are missing. This framework provides an important reference for the development of GNSS-R high-resolution data products and the refined regional observation and management.
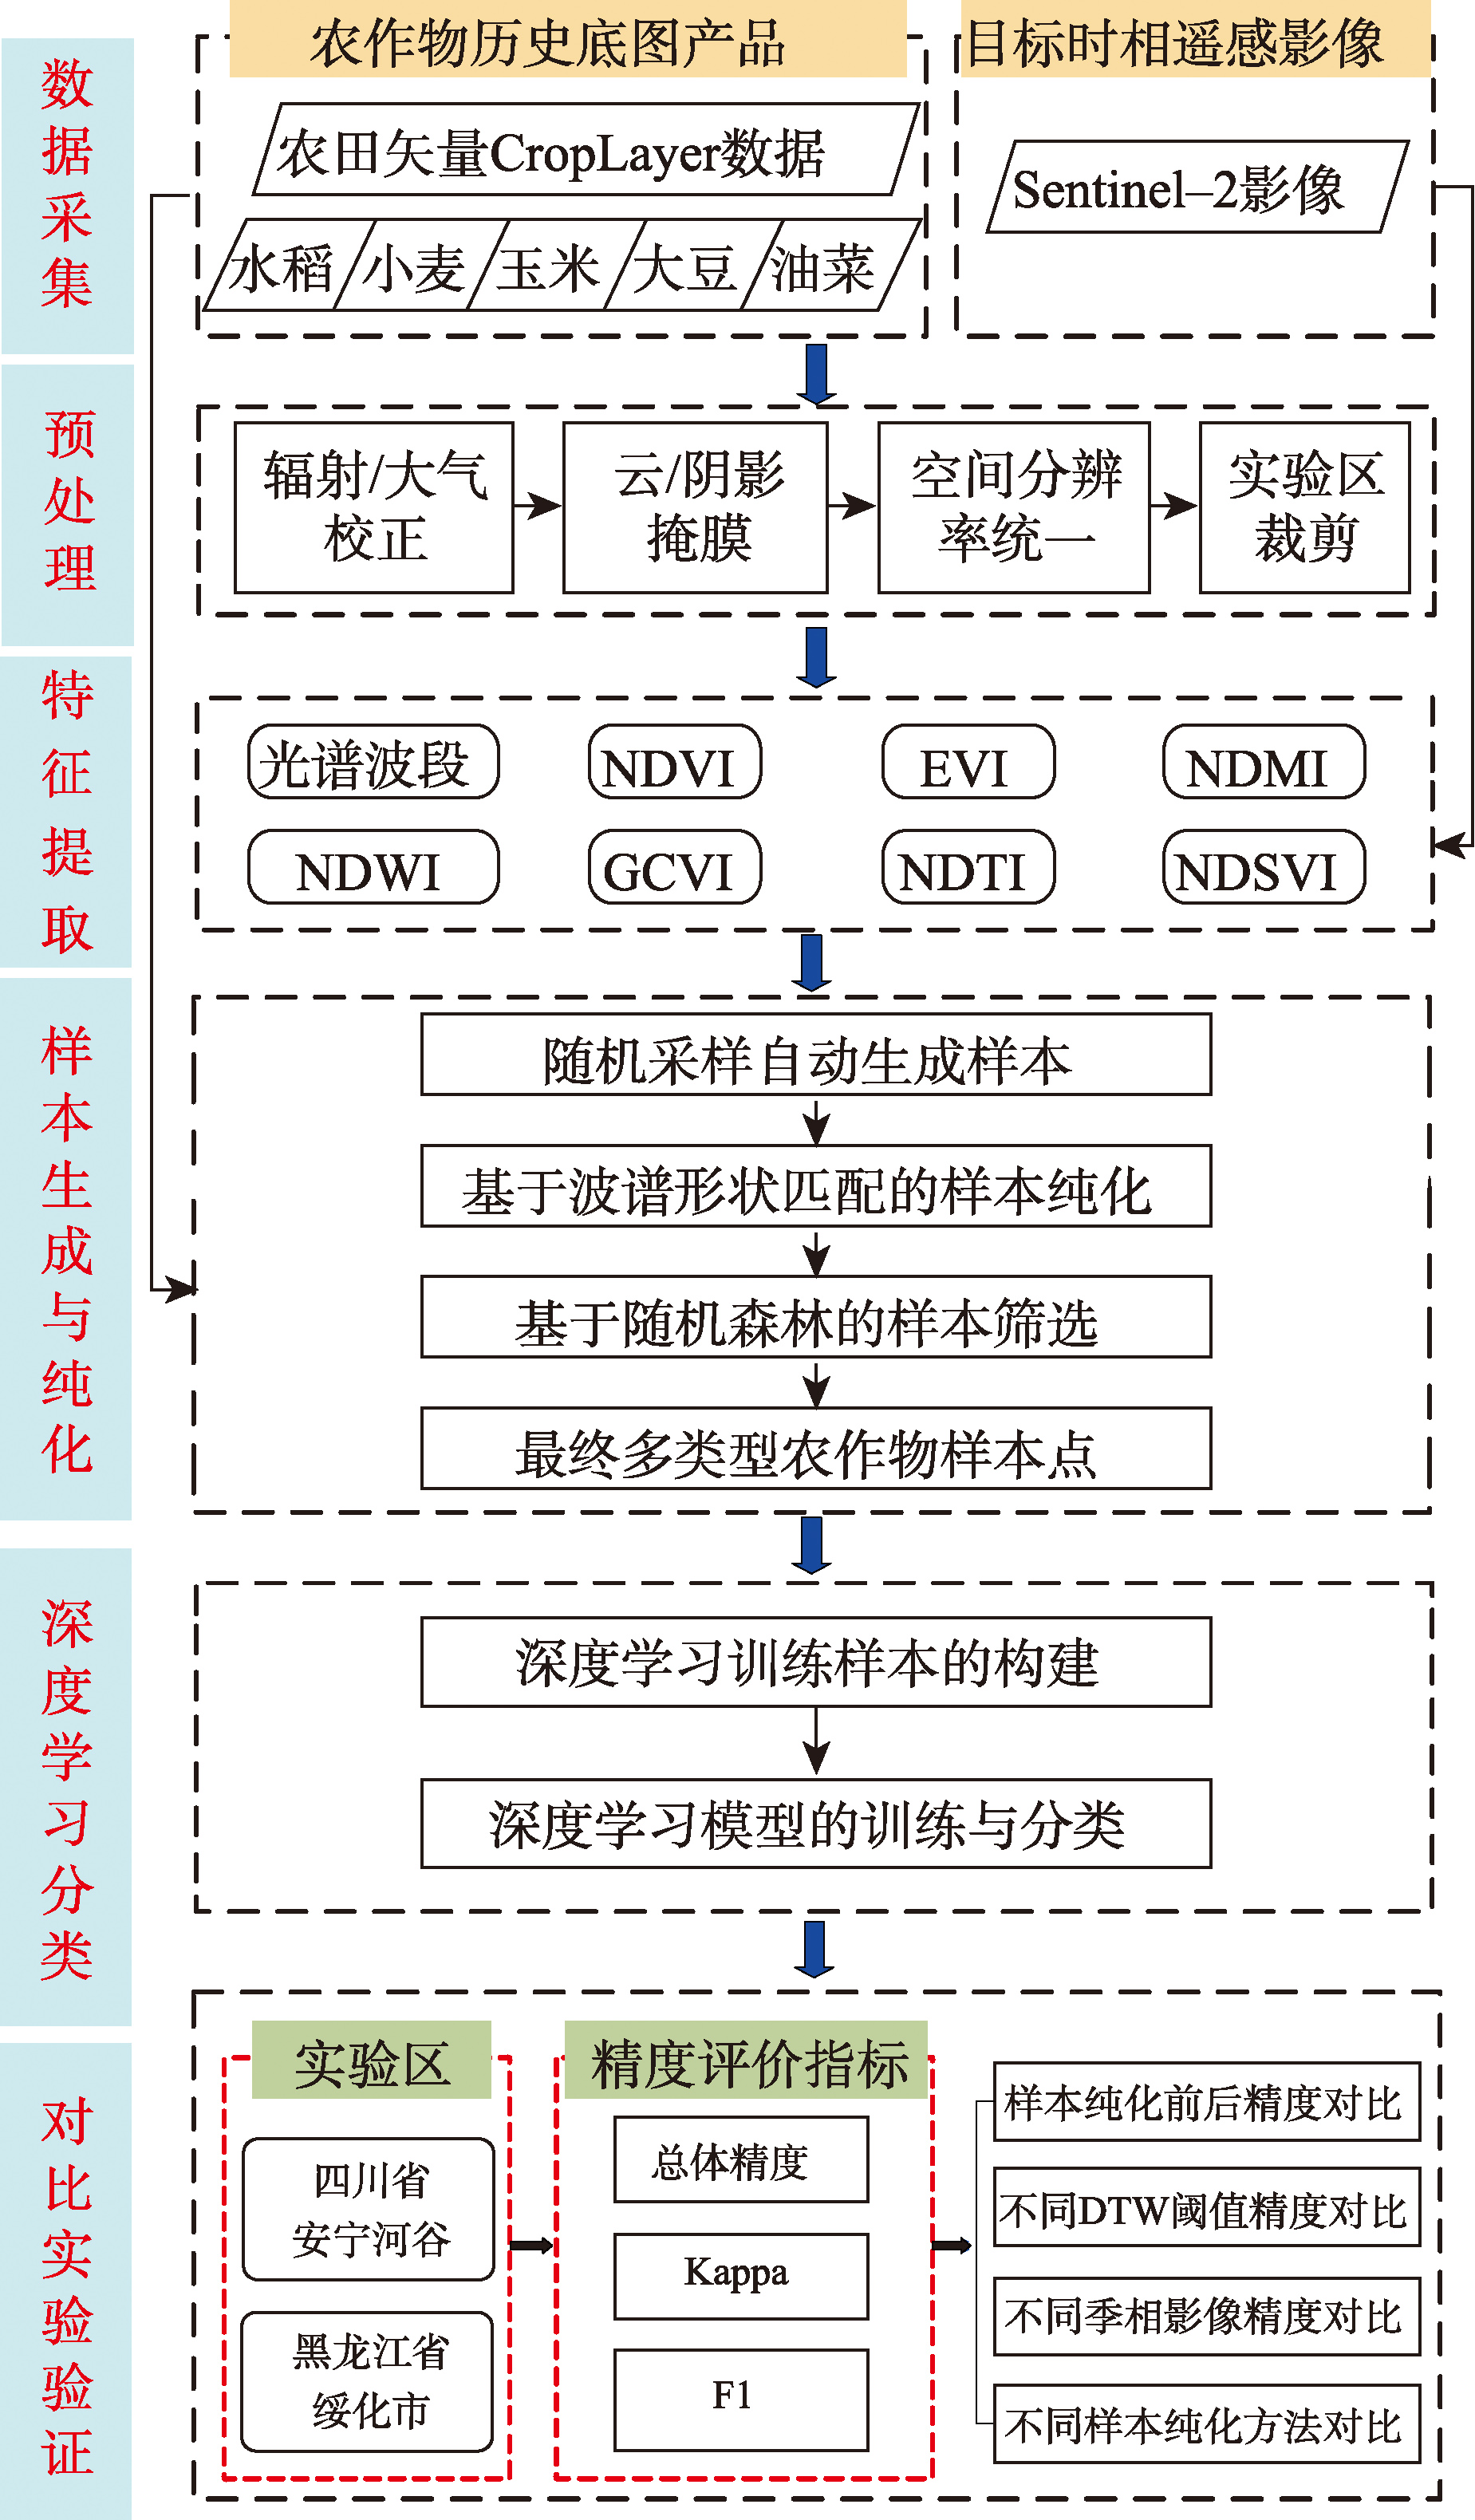
[Objectives] Fine crops classification has become an essential component of modern agricultural management, propelled by the development of high-resolution remote sensing and intelligent algorithms. [Methods] To address the challenge of samples acquisition in fine crops classification, this study proposes the samples purification method based on spectral shape matching and random forest, using historical farmland vector data and multi-source crops raster data, and Sentinel-2 multi-temporal images as the target temporal images. It first automatically generates initial sample points based on historical crop products, then by comprehensively evaluating the spectral clustering degree of the initial sample points and their confidence level for crops classification task using Sentinel-2 multi-temporal images, the initial sample points are optimized to obtain purified sample points of different crop categories. Specifically, the proposed samples purification method involves two sequential stages, firstly, spectral shape matching driven by the Dynamic Time Warping (DTW) algorithm quantifies the similarity between individual spectral curves and their corresponding mean spectrum of different crop categories such as rice, soy, maize, rapeseed and wheat, enabling the selection of spectrally concentrated and representative samples. Secondly, high-confidence filtering employs random forest classifier to assess classification reliability in order to retain only samples with high confidence. [Results] Experiments were conducted in two distinct agricultural regions, one is the Anning River Valley in Sichuan Province, characterized by complex and diverse crop planting structures, the other is Suihua city in Heilongjiang Province, representing large-scale and uniform cropping systems. This experimental design allowed a systematic evaluation of the effects of samples purification, DTW threshold selection, seasonal composition of Sentinel-2 time-series imagery, and different samples purification strategies on crops classification accuracy. The results showed that compared to using initial sample points, the overall accuracy of crops classification in the two experimental areas increased by 14.18% and 22.78% respectively after samples purification. When the DTW similarity threshold was set at 60%, the crop classification performance was optimal using the entire growing season composite images, with an overall accuracy improvement of 22.83% compared to autumn composite images. Compared to three existing sample purification methods, the proposed method achieved overall accuracies of 90.16% and 93.16% in the two experimental areas, respectively, demonstrating superior performance in complex crop planting areas and the robustness in handling fine crops classification in different scenarios. [Conclusions] The study provides a practical and effective technical pathway for fine crops classification by leveraging existing crop products.
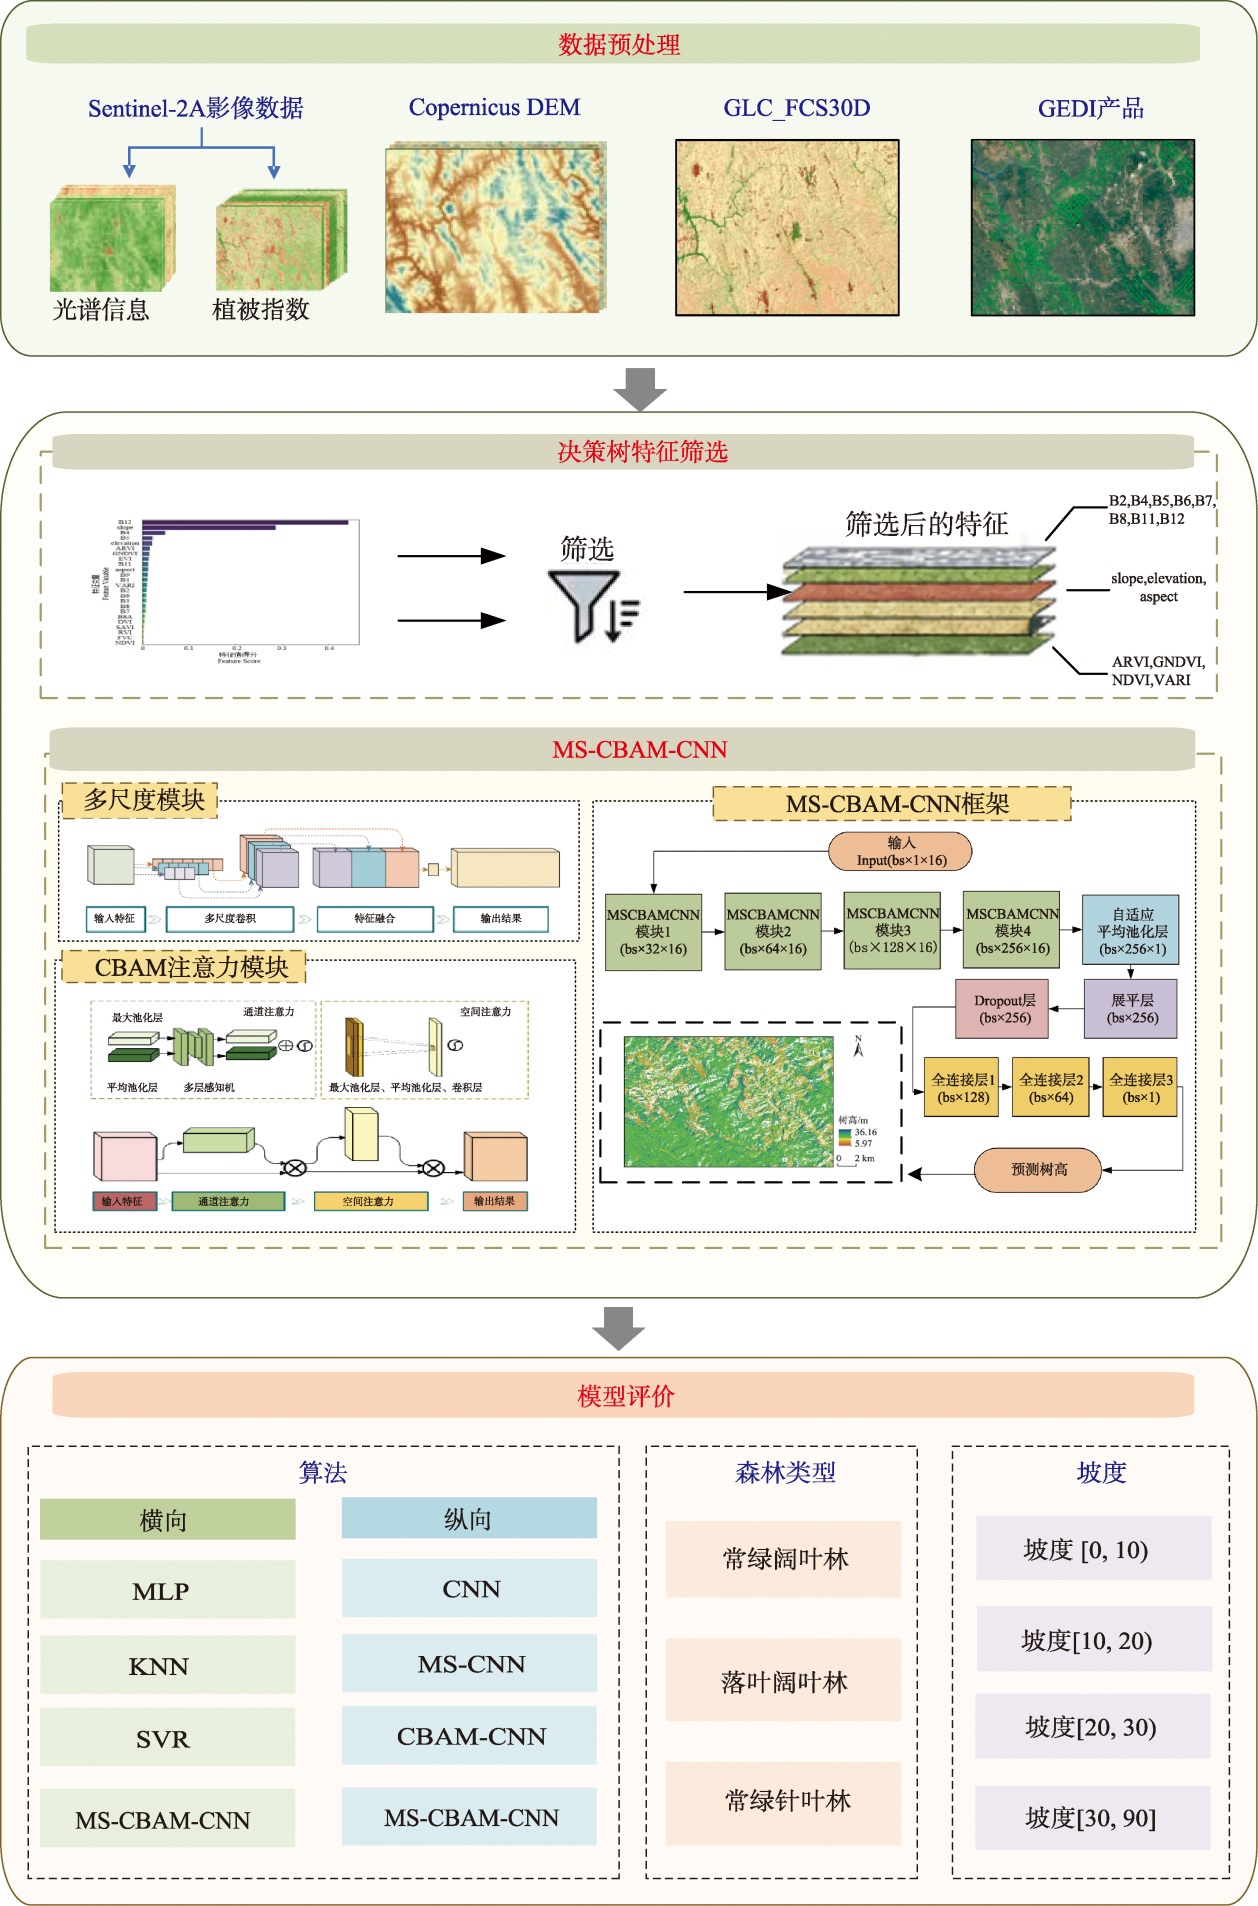
[Objectives] The Global Ecosystem Dynamics Investigation (GEDI) provides high-quality measurements of forest tree height but results in spatially discontinuous coverage, limiting its utility for large-scale ecological applications. Overcoming this limitation requires accurate estimation of forest tree height over broader regions by integrating GEDI data with complementary, spatially extensive remote sensing sources. This study aims to explore how integrating GEDI products with Sentinel-2 data can achieve continuity in regional-scale forest height retrieval. [Methods] Feature variables significantly contributing to forest tree height modeling were identified and selected from Sentinel-2 multispectral imagery and terrain data using a decision tree method. A novel deep learning model, the Multi-Scale Convolutional Block Attention Module Convolutional Neural Network (MS-CBAM-CNN), was subsequently developed. This architecture integrates Multi-Scale convolution to capture features at different spatial resolutions and incorporates a Convolutional Block Attention Module (CBAM) to enhance feature representation by focusing on critical spatial and channel information. Bayesian optimization was employed to systematically tune the model's hyperparameters for optimal performance. The finalized MS-CBAM-CNN model was applied to generate a comprehensive wall-to-wall map depicting the distribution of forest tree height across the Simao region for the year 2022. [Results] (1) The decision tree method selected sixteen feature variables demonstrating significant contributions to forest tree height modeling. This process eliminated redundant or noisy inputs while retaining the most informative predictors.(2) The experimental results comparing the accuracy of MS-CBAM-CNN (Multi-scale Convolutional Block Attention Module - Convolutional Neural Networks) with traditional machine learning algorithms, namely Support Vector Regression (SVR), K-Nearest Neighbor (KNN), and Multi-Layer Perceptron (MLP), showed R2 values of 0.67, 0.74, 0.74, and 0.76, respectively, and RMSE values of 3.52, 3.12, 3.11, and 3.00 m, respectively, indicating that MS-CBAM-CNN achieves the highest accuracy. (3) Ablation experiments further proved that the multi-scale features and CBAM attention mechanism were the main contributors to the performance gains. Compared to the model without these two modules, the R² increased from 0.71 to 0.76, and the RMSE decreased from 3.31 m to 3.00 m. [Conclusions] By synergizing GEDI footprints with spatially continuous Sentinel-2 data, the MS-CBAM-CNN framework successfully captures both local structural details and broader spatial contexts, thereby mitigating the inherent spatial discontinuity of GEDI products.The methodology effectively integrates GEDI products with Sentinel-2 and terrain data, leveraging deep learning to capture both local details and broader spatial context through Multi-Scale convolution and attention mechanisms. The results demonstrate the MS-CBAM-CNN model's capability for precise regional-scale forest tree height estimation, offering a robust technical framework for large-area forest structural parameter mapping that mitigates the spatial constraints of GEDI missions.
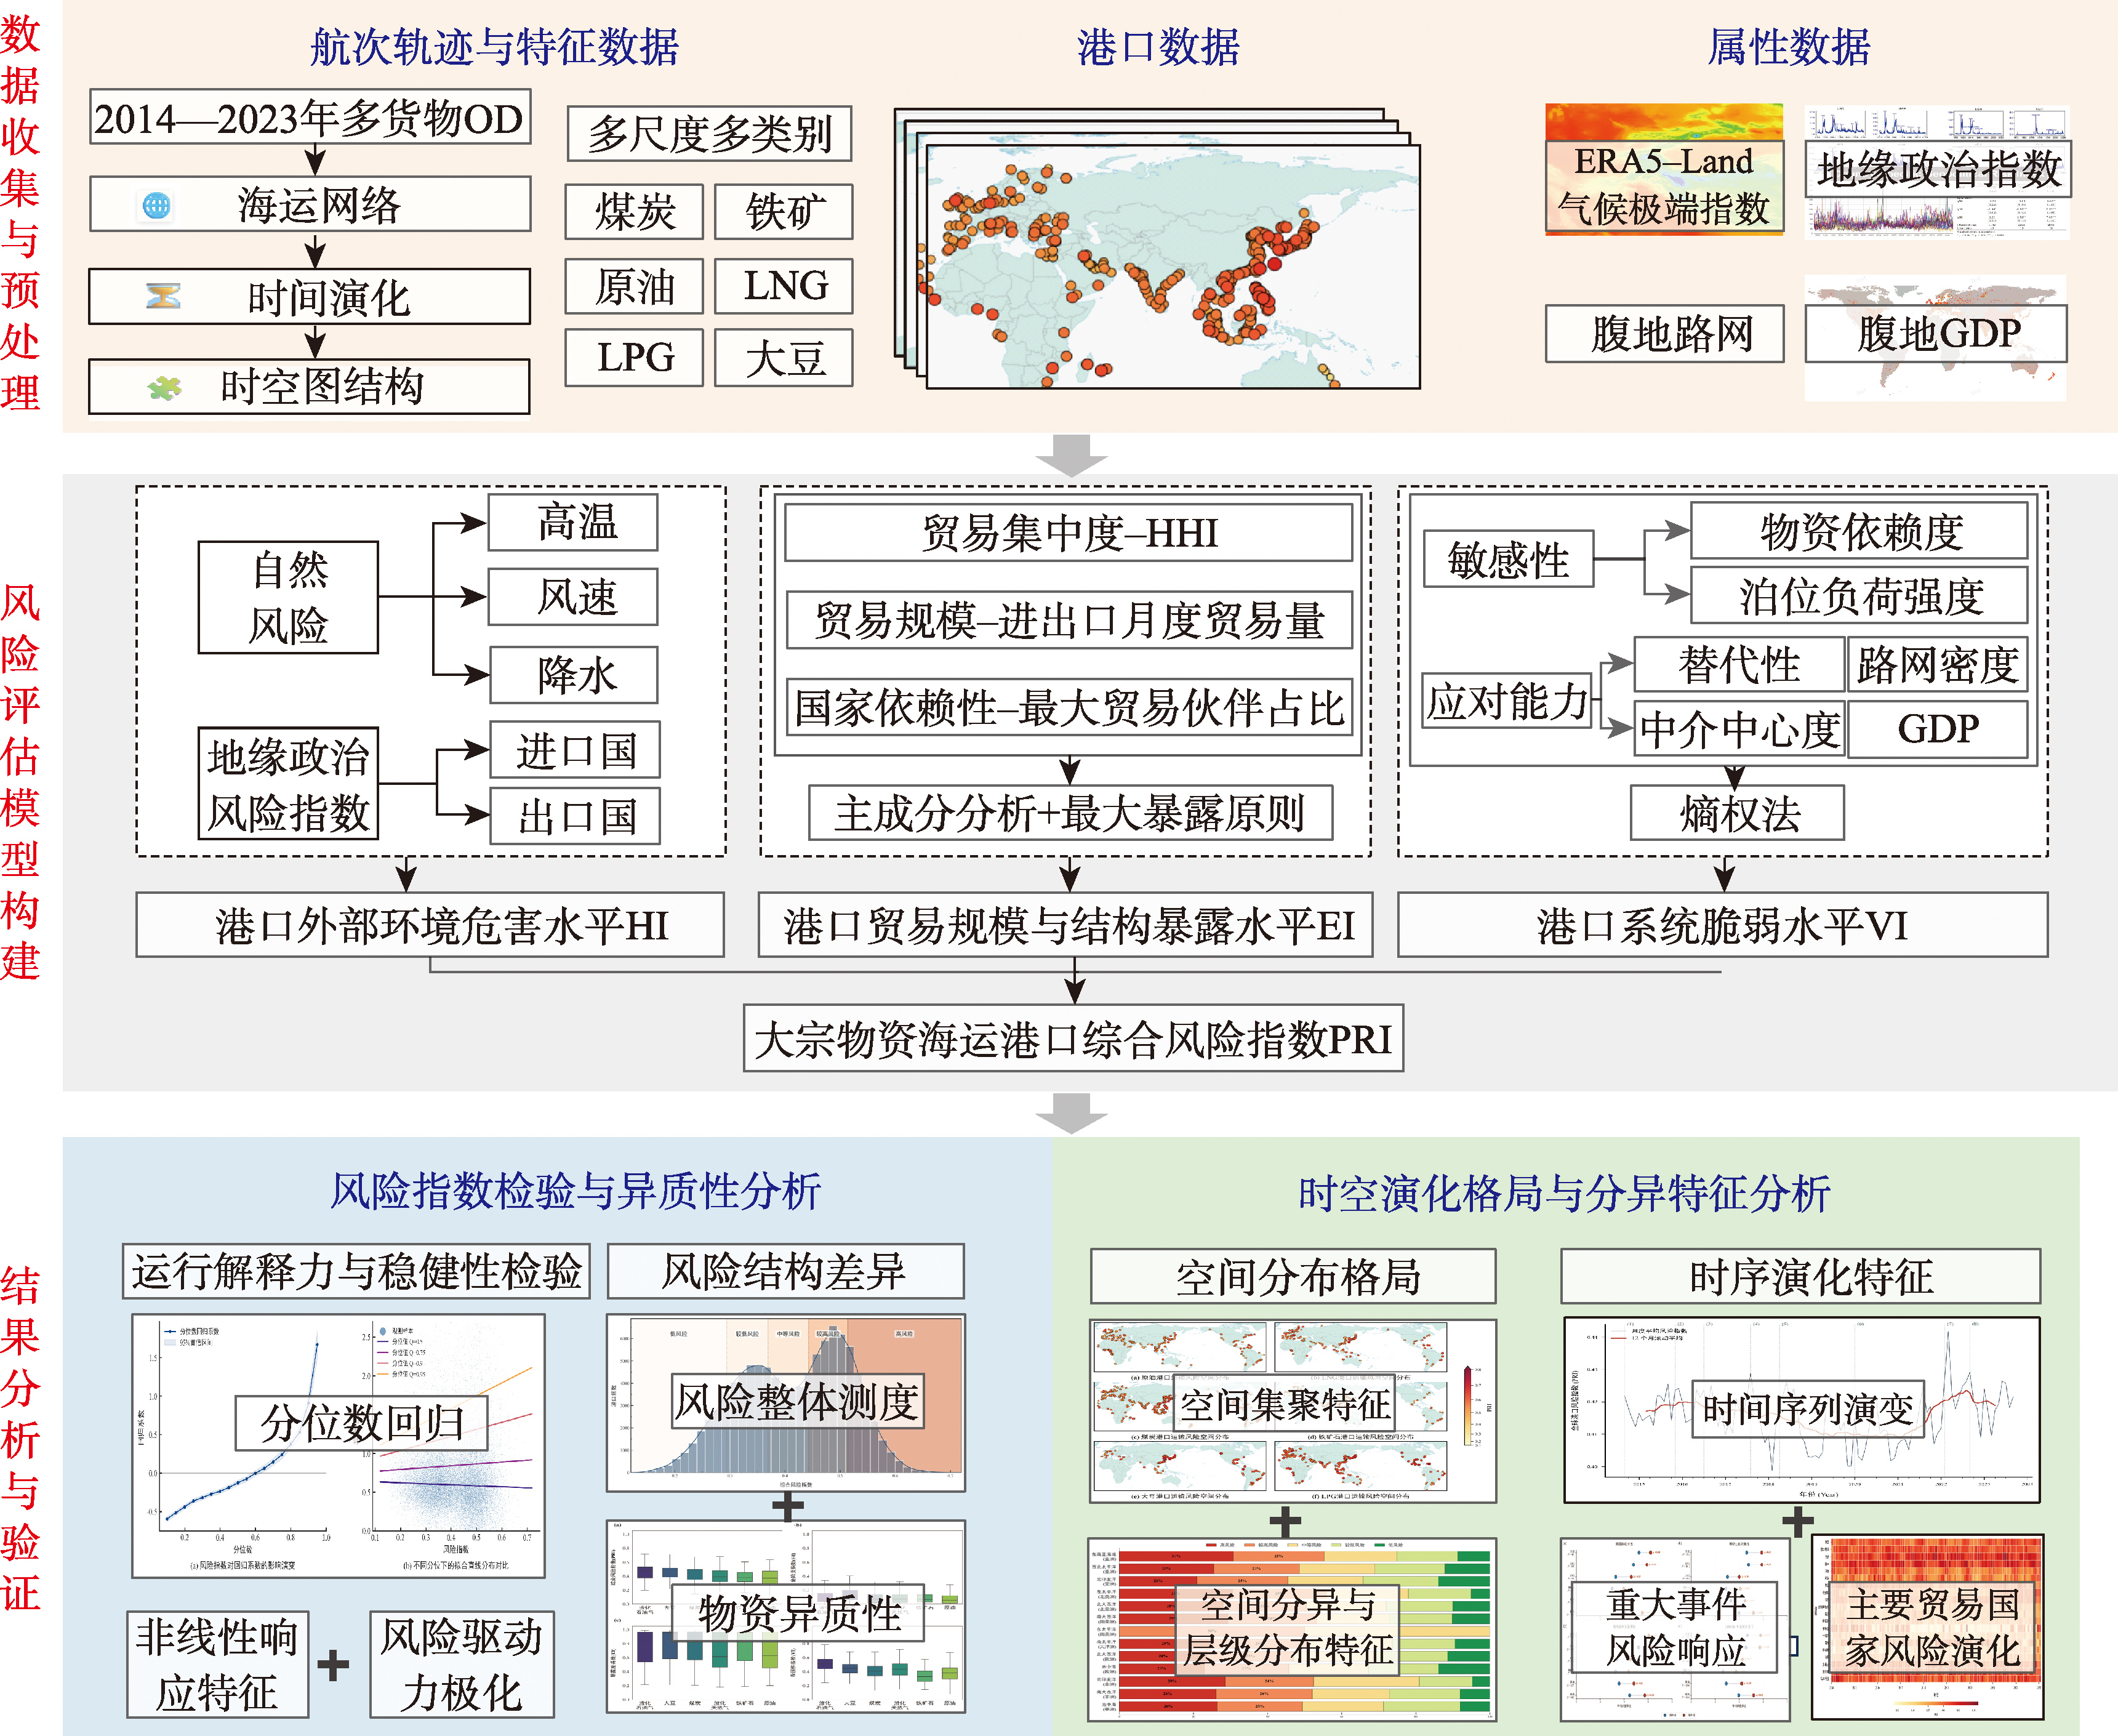
[Objectives] Global maritime trade of bulk commodities is highly dependent on the operational stability of port nodes, which is fundamental to national energy security and industrial stability. Against the backdrop of intensifying geopolitical conflicts and increasingly frequent extreme climate events, a systematic assessment of the composite risk landscape of strategic commodity transport ports, together with the identification of highly vulnerable nodes and their spatiotemporal evolution patterns, is of critical importance for enhancing global supply chain resilience. [Methods] Based on the IPCC disaster risk theoretical framework, this study develops a comprehensive risk spatiotemporal assessment model for port transport in the maritime system. In this framework, exogenous shocks such as extreme weather and geopolitical conflicts are characterized as hazards, hub status and trade scale represent exposure, and hinterland economic level and infrastructure conditions reflect vulnerability. Based on voyage trajectory data of major global ports during 2014-2023, integrated with multi-source risk factors such as climate and geopolitics, a multi-dimensional panel dataset covering six categories of bulk commodities-coal, crude oil, iron ore, liquefied natural gas (LNG), liquefied petroleum gas (LPG), and soybeans-was constructed. On this basis, Principal Component Analysis and the Entropy Weight Method were used for objective weighting, and combined with spatial autocorrelation analysis, STL time-series decomposition, and quantile regression methods, the validity, heterogeneity, and spatiotemporal evolution characteristics of the port risk index were systematically analyzed. [Results] The research findings are as follows: (1) Quantile regression results demonstrate that the risk index exhibits strong explanatory power for transport instability. In the extreme anomaly interval(τ=0.95), the amplifying effect of port risk on voyage delays is approximately 13 times greater than that at the median level. (2) Global port risk exhibits a bimodal polarization, forming stable "low-medium" and "medium-high" risk clusters. The coupling of high exposure with low-frequency hazards is the primary mechanism driving high-risk aggregation, with energy commodities showing higher risk levels than dry bulk. (3) The spatial distribution of port risk shows significant positive spatial autocorrelation. High-risk regions are mainly concentrated in Southeast Asia, the Northern Indian Ocean, and the Northwest Pacific, with high-risk ports in Southeast Asia accounting for 30.7% of the regional total.(4) Port risk evolution follows a trajectory of “long-term stability-phased decline-abrupt surge.” Since 2021, geopolitical events have induced a structural upward shift in the risk median. Compared with countries possessing diversified trade structures, energy-export-dependent countries exhibit higher sensitivity and weaker buffering capacity in risk evolution. [Conclusions] The research results can provide a scientific basis for port risk hierarchical management and control, key node identification, and supply chain resilience enhancement, and have important reference value for the security governance of bulk commodity transportation.
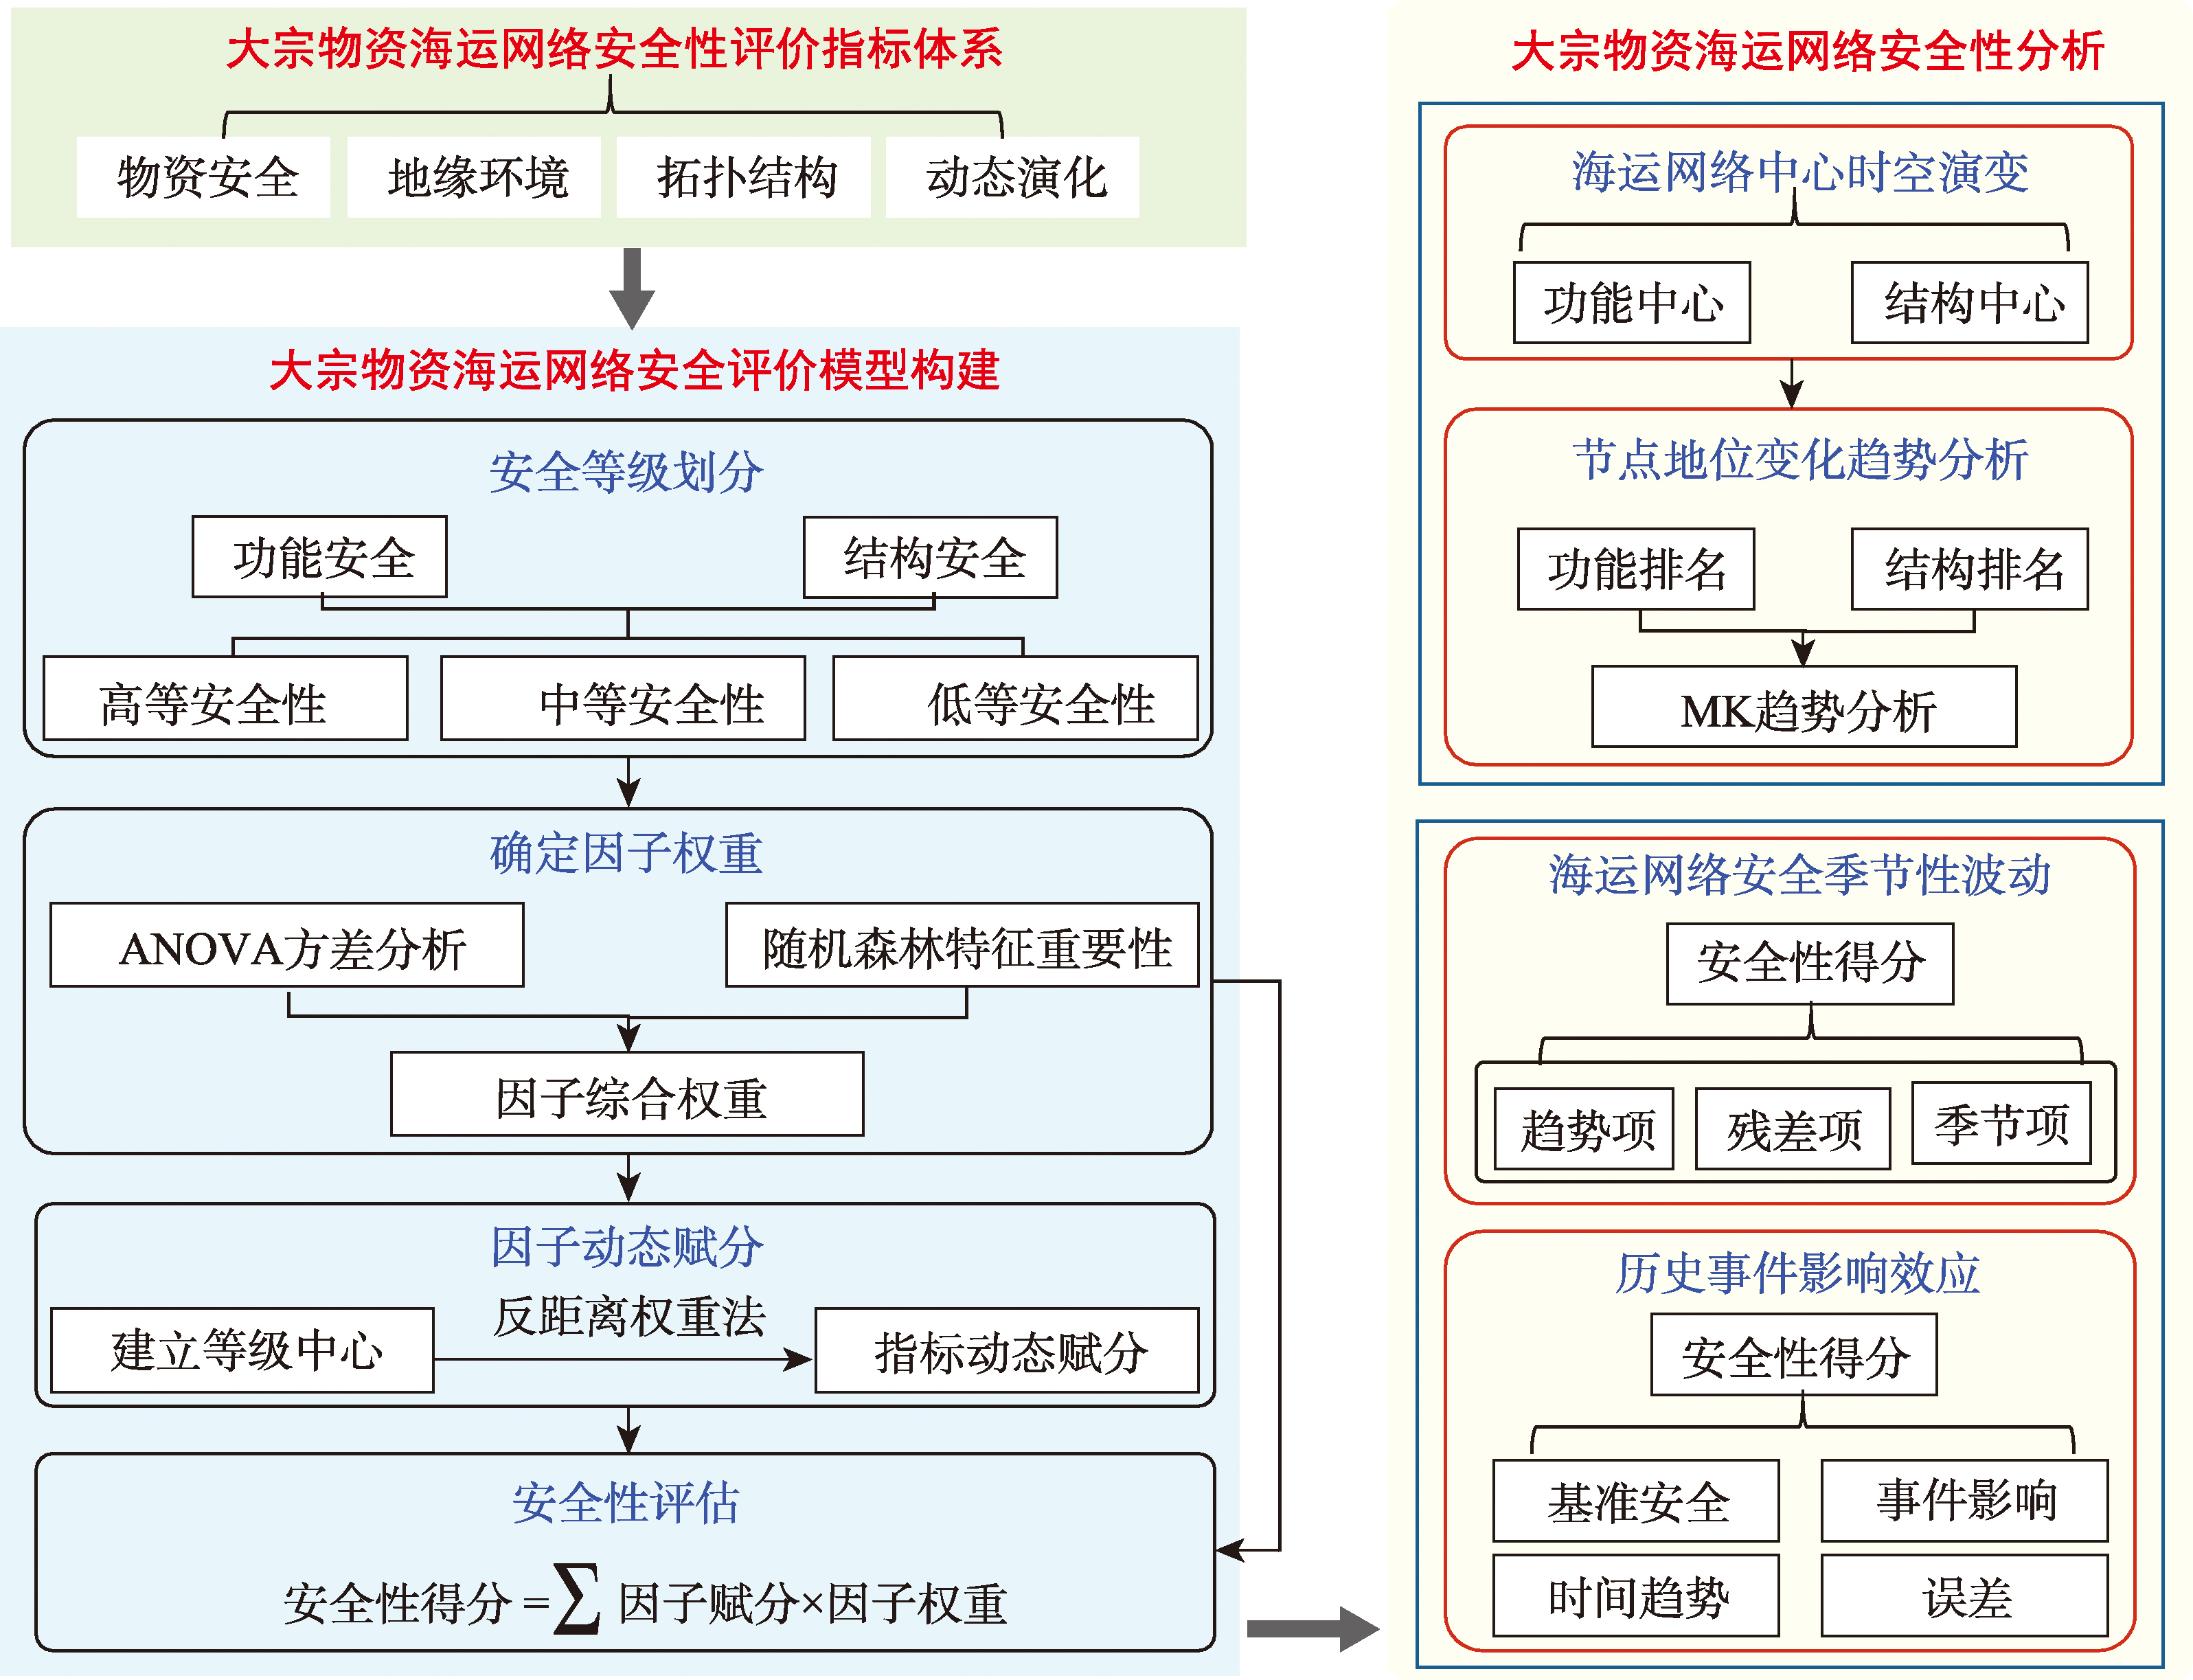
[Objectives] The bulk commodities maritime transportation network is a key link connecting the economic lifelines of countries, and its security is crucial to the stable development of national economies. Existing studies have limitations: (1) they focus on only a single type of material within the maritime transportation networks; (2) their evaluation index systems lack multidimensionality; and (3) their evaluation methods struggle to meet the needs of dynamic security assessment in complex environments. [Methods] This study employs Automatic Identification System (AIS) ship trajectory big data and complex network theory, taking six bulk commodities transportation networks—coal, crude oil, iron ore, Liquefied Natural Gas (LNG), Liquefied Petroleum Gas (LPG), and grain—from 2014 to 2023 as research objects. A multi-dimensional and multi-level security evaluation index system is constructed, and a dynamic security evaluation model is proposed based on combined weights (integrating statistical significance from analysis of variance (ANOVA) and feature importance quantified via a random forest model) and inverse distance centroid aggregation. In addition, the evolutionary characteristics of the bulk commodities maritime transportation network are analyzed from multiple perspectives and across multiple scales. [Results] The main findings are as follows: (1) Asian countries have long dominated functional centers, while structural hub nodes are frequently replaced. Trade focus is accelerating its shift toward resource-producing countries and the Asia-Pacific consumer market. (2) From 2014 to 2023, the security of maritime transportation networks for coal(monthly average increase of 0.005 1), crude oil (monthly average increase of 0.005 9), LNG (monthly average increase of 0.005 4), LPG (monthly average increase of 0.007 1), and grain (monthly average increase of 0.003 1) showed an upward trend, while the security of the iron ore network first increased and then declined. (3) September (for coal and crude oil) and February (for LNG, LPG, and grain) are peak risk periods for the bulk commodities maritime transportation network, while April is a favorable month for the security of iron ore, LPG, and grain transportation networks. (4) The Russia-Ukraine conflict, Brexit, and COVID-19 pandemic have generally exerted negative impacts on the security of the bulk commodities maritime network, although the network demonstrates adaptive resilience in some dimensions. [Conclusions] This study shows that the security of the global bulk commodities maritime transportation network has improved significantly over the past decade, although development remains uneven across different dimensions and risk-prone periods persist. The findings provide a scientific basis for decision-making and layout optimization to enhance the security of bulk commodities maritime transportation.
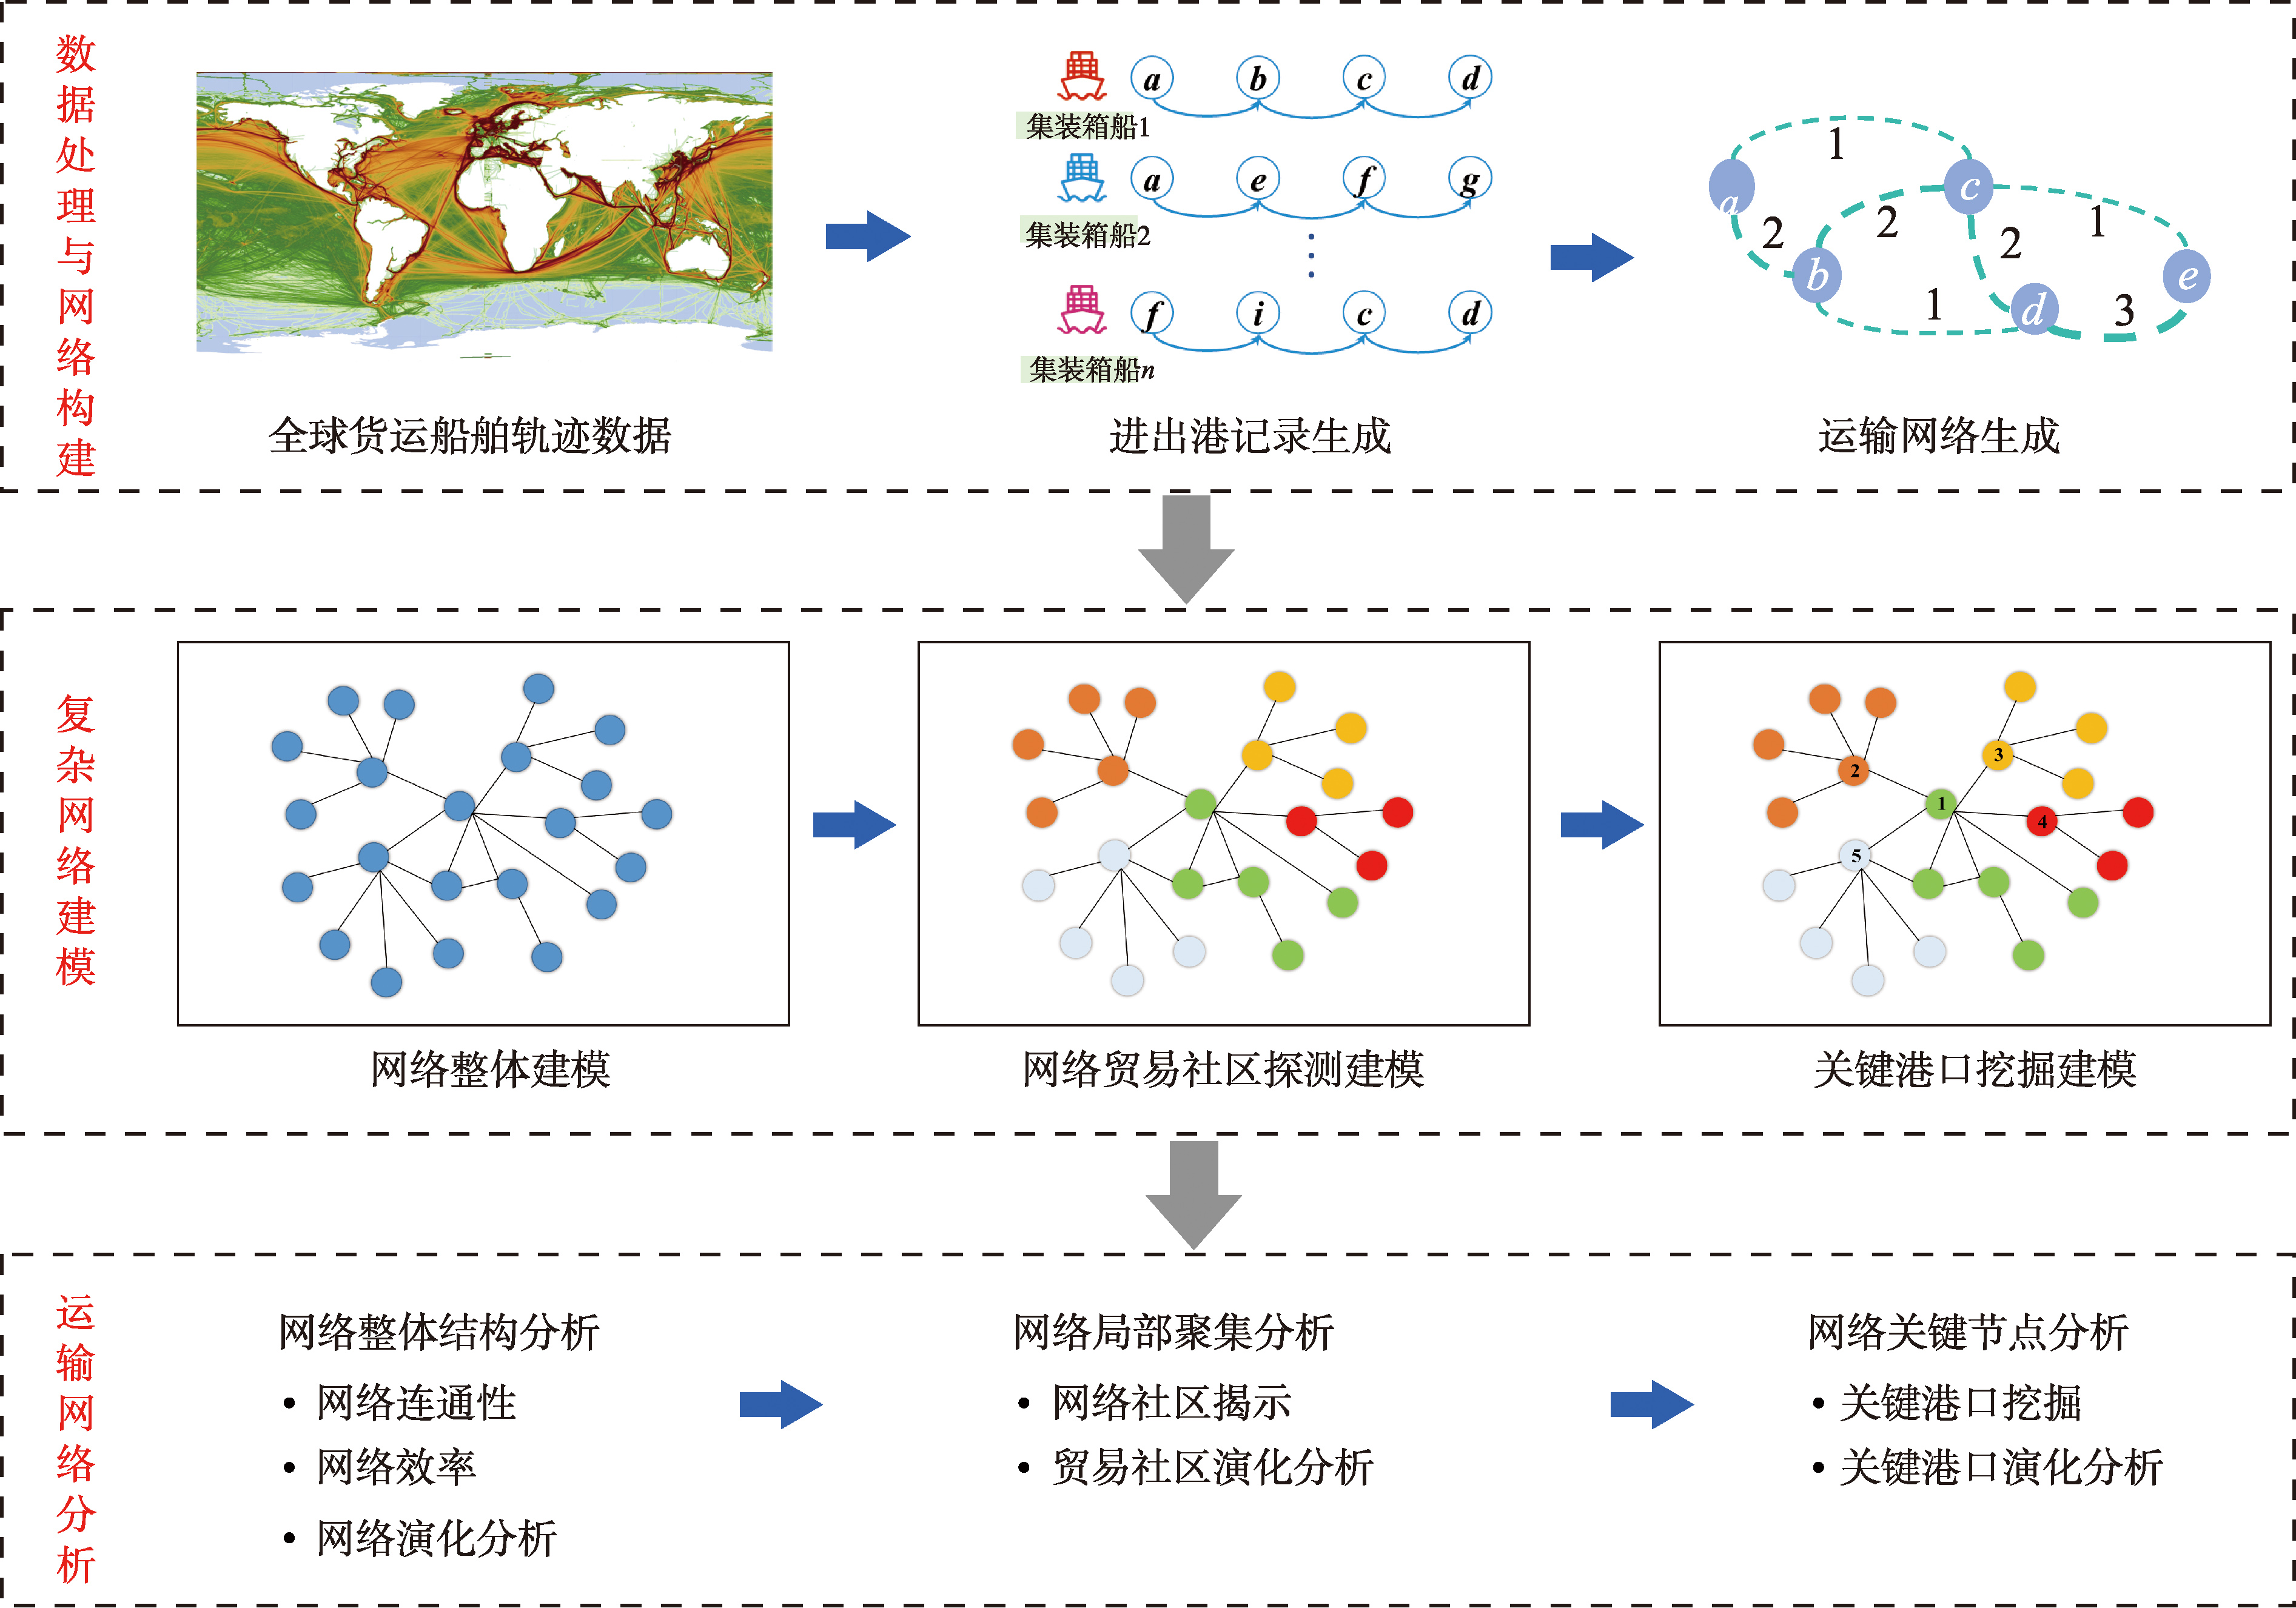
[Objectives] As the world's largest container shipping country and a major participant in global trade, China occupies an increasingly important position in the global maritime network. A systematic analysis of the structural characteristics and dynamic evolution of China's container shipping network is not only essential for understanding changes in the domestic logistics system, but also provides important insights into the spatiotemporal patterns of global trade flows. This study aims to examine the long-term evolution of China's container shipping network and to identify its structural transformation, trading community reorganization, and changes in the hierarchy of major ports. [Methods] A complex geographical network analysis framework was developed based on global container vessel trajectory data for the years 2013 and 2023. Using ship movement trajectories, China's container shipping network was constructed and analyzed from three analytical dimensions: macro-level overall network structure, meso-level trading communities, and micro-level key ports. Network indicators were applied to characterize structural features, community patterns, and port importance, enabling a comparative assessment of network evolution over the past decade. [Results] The results show that: (1) China's container shipping network has undergone a strategic transformation from extensive spatial coverage to core-oriented development. The overall network structure has gradually evolved toward hub consolidation and improved connectivity efficiency, indicating a shift from scale expansion to quality-oriented organization. (2) Although the network has consistently maintained five trading communities over the decade, their core ports, spatial distributions, and community scales have changed markedly, showing a transition from regional agglomeration to spatial dispersion. This evolution reflects dynamic adjustments in international trade flows and regional cooperation patterns. (3) A significant restructuring has occurred in the hierarchy of major Chinese ports. Qingdao Port has surpassed Ningbo-Zhoushan Port to rank first in terms of route number and voyage frequency. Within the Guangdong-Hong Kong-Macao Greater Bay Area, the functional division of labor among ports has become increasingly distinct, while the international transshipment role of Kaohsiung Port has relatively declined as a result of the enhanced competitiveness of mainland Chinese ports. [Conclusions] From the perspective of maritime big data, this study reveals the structural evolution, trade clustering characteristics, and port development patterns of China's container shipping network over the past decade. The findings provide empirical evidence for understanding changes in shipping network organization and port system structure, and offer a scientific basis for interpreting the dynamics of the container shipping industry.
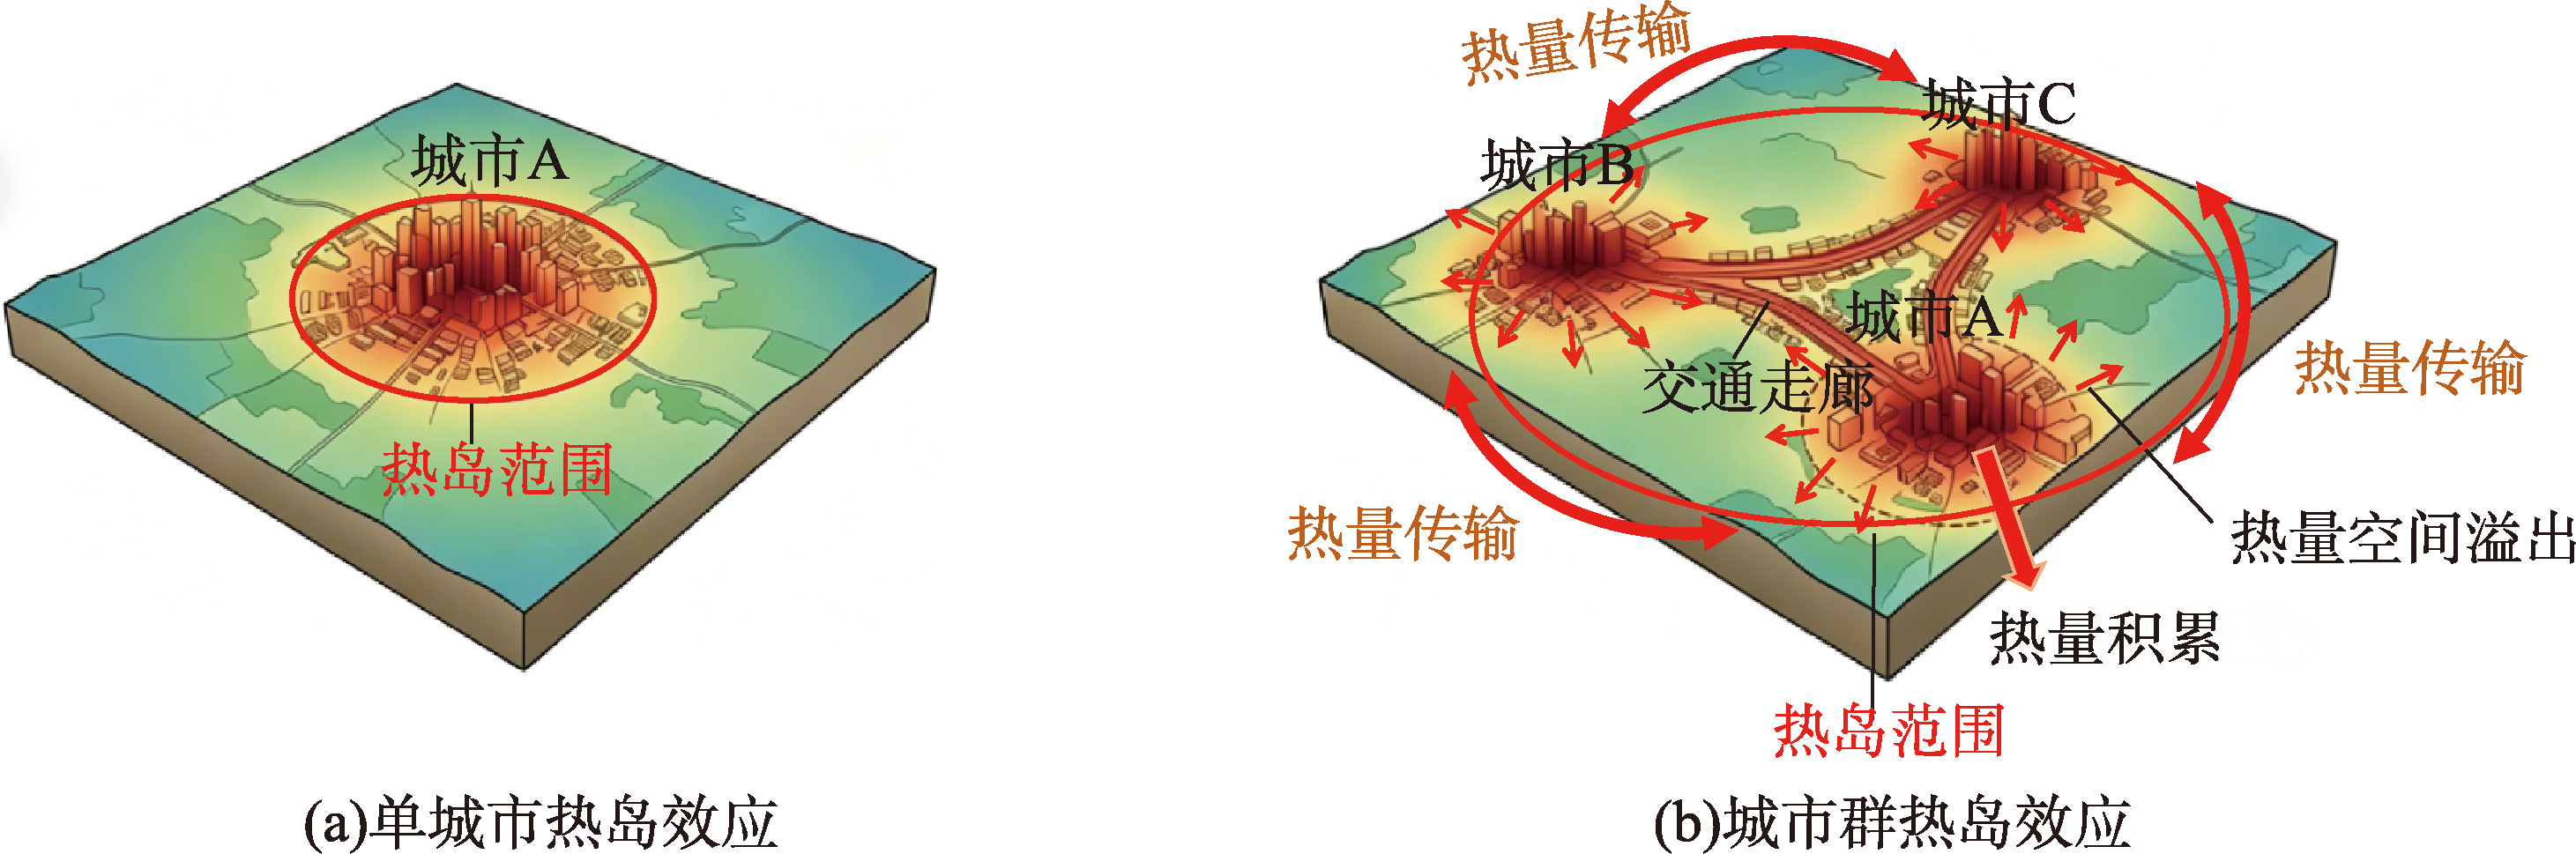
[Significance] With the acceleration of global urbanization, urban agglomerations have become the core carriers of regional economic development. The urban heat island (UHI) effect has emerged as a critical challenge, affecting ecological systems, energy consumption, urban livability, and public health. Revealing the spatiotemporal evolution and formation mechanisms of urban heat islands at the city cluster scale is crucial for guiding sustainable urban development, environmental policy, and regional planning decisions. Such understanding can advance the knowledge of regional climate processes, improve the efficiency of urban energy management, inform mitigation strategies, guide urban planning and thermal environment management, and support sustainable development. [Analysis] This paper systematically reviews the research progress on the UHI effect in eight typical urban agglomerations in China. It focuses on their spatiotemporal characteristics, formation mechanisms, driving factors, and mitigation measures, and also discusses the methodologies employed, including remote sensing, statistical analysis, spatial modeling, and machine learning approaches. These methods provide quantitative and systematic insights into the dynamics of urban heat islands, allowing for cross-city comparisons and multi-scale analysis. Furthermore, future research directions are outlined. Overall, existing studies indicate that the UHI effect in urban agglomerations generally exhibits pronounced spatial heterogeneity and hierarchical differentiation. Significant gradients exist between core cities and peripheral cities, reflecting the complex spatial organization of urban clusters. Spatially, the UHI effect tends to expand alongside the growth of built-up areas and often clusters along major functional corridors, reflecting the patterns of urban development and connectivity. Temporally, the UHI effect exhibits complex diurnal and seasonal variations, which can significantly influence local microclimates, energy demand, and urban livability. The evolution of the UHI effect is governed by the combined influence of natural and anthropogenic factors, among which anthropogenic factors, including population density, land-use changes, industrial activities, and energy consumption, generally play a dominant role. [Purpose] This review aims to systematically integrate existing research on the urban heat island effect in typical urban agglomerations in China. It seeks to reveal their spatiotemporal characteristics and underlying mechanisms and provide a scientific basis for urban planning and thermal environment regulation. Based on a comparative analysis of influencing factors and mitigation strategies, this review provides guidance for urban thermal environment management and supports sustainable development policies in urban agglomerations. Furthermore, by analyzing key scientific issues and future development trends, this review identifies current research gaps and potential directions for breakthroughs. It also aims to promote further research on coordinated thermal environment governance at the urban agglomeration scale, contributing to regional ecological sustainability and improved urban living conditions.
[Objectives] Urban functions and street-view features jointly shape the spatial pattern of theft crime. However, previous studies have often relied on a single data source to measure urban functions and have paid limited attention to the spatial spillover effects of surrounding functions. As a result, the interaction between macro-level urban functional contexts and micro-level street environments remains insufficiently understood. To address this gap, this study develops a multidimensional analytical framework to examine how urban functions and street-view characteristics interact to influence theft crime. By incorporating both local urban functions and their spillover effects, the study seeks to provide a more comprehensive explanation of crime-generating environments and to support refined urban safety governance and place-based crime prevention. [Methods] YC District of a city was selected as the study area. Multi-source spatial data were integrated, including theft incidents in 2019, points of interest (POIs), land-use data, street-view imagery, and socioeconomic data. First, land-use and POI data were combined to construct a complementary urban function measurement system and identify the core functional variables associated with theft crime. Second, the spatial spillover effects of these core functions were measured, and a multidimensional indicator system covering both urban functional spillovers and street-view characteristics was established. Finally, an XGBoost model was used to capture nonlinear relationships between the built environment and theft crime, while SHAP was applied to interpret variable importance and reveal the interaction effects between urban functions and street-view features. [Results] The findings indicate that land-use and POI data are highly complementary in measuring urban functions. Land-use data are more suitable for representing large-scale functional zones, whereas POI data are better at capturing small-scale facilities and service-related functions. Commercial service facilities (0.212 2), functional mix (0.485 3), and their spatial spillover terms (0.235 8 and 0.436 9, respectively) all significantly promote theft crime. In contrast, industrial land exerts a locally inhibitory effect (-0.199 5) but a positive effect in surrounding areas (0.104 3), suggesting clear spatial heterogeneity. More importantly, urban functions significantly moderate the relationship between street-view characteristics and theft crime, and the moderating effects of spillover terms are generally stronger than those of local functional variables. The spillovers of commercial services and functional mix are particularly influential, substantially changing the marginal effects of key street-view indicators. These interaction effects are especially evident for the building visual index, street enclosure, green view index, sky view index, and right-of-way indices. [Conclusions] The relationship between street-view characteristics and theft crime cannot be fully understood without considering urban functional contexts and their spillover effects. Urban functions not only directly affect crime, but also reshape how street environments influence criminal opportunities. Therefore, research on street features and crime should explicitly incorporate both local urban functions and spatial spillovers, so as to avoid biased interpretations of environmental effects and provide a stronger scientific basis for urban planning, situational crime prevention, and precision policing.
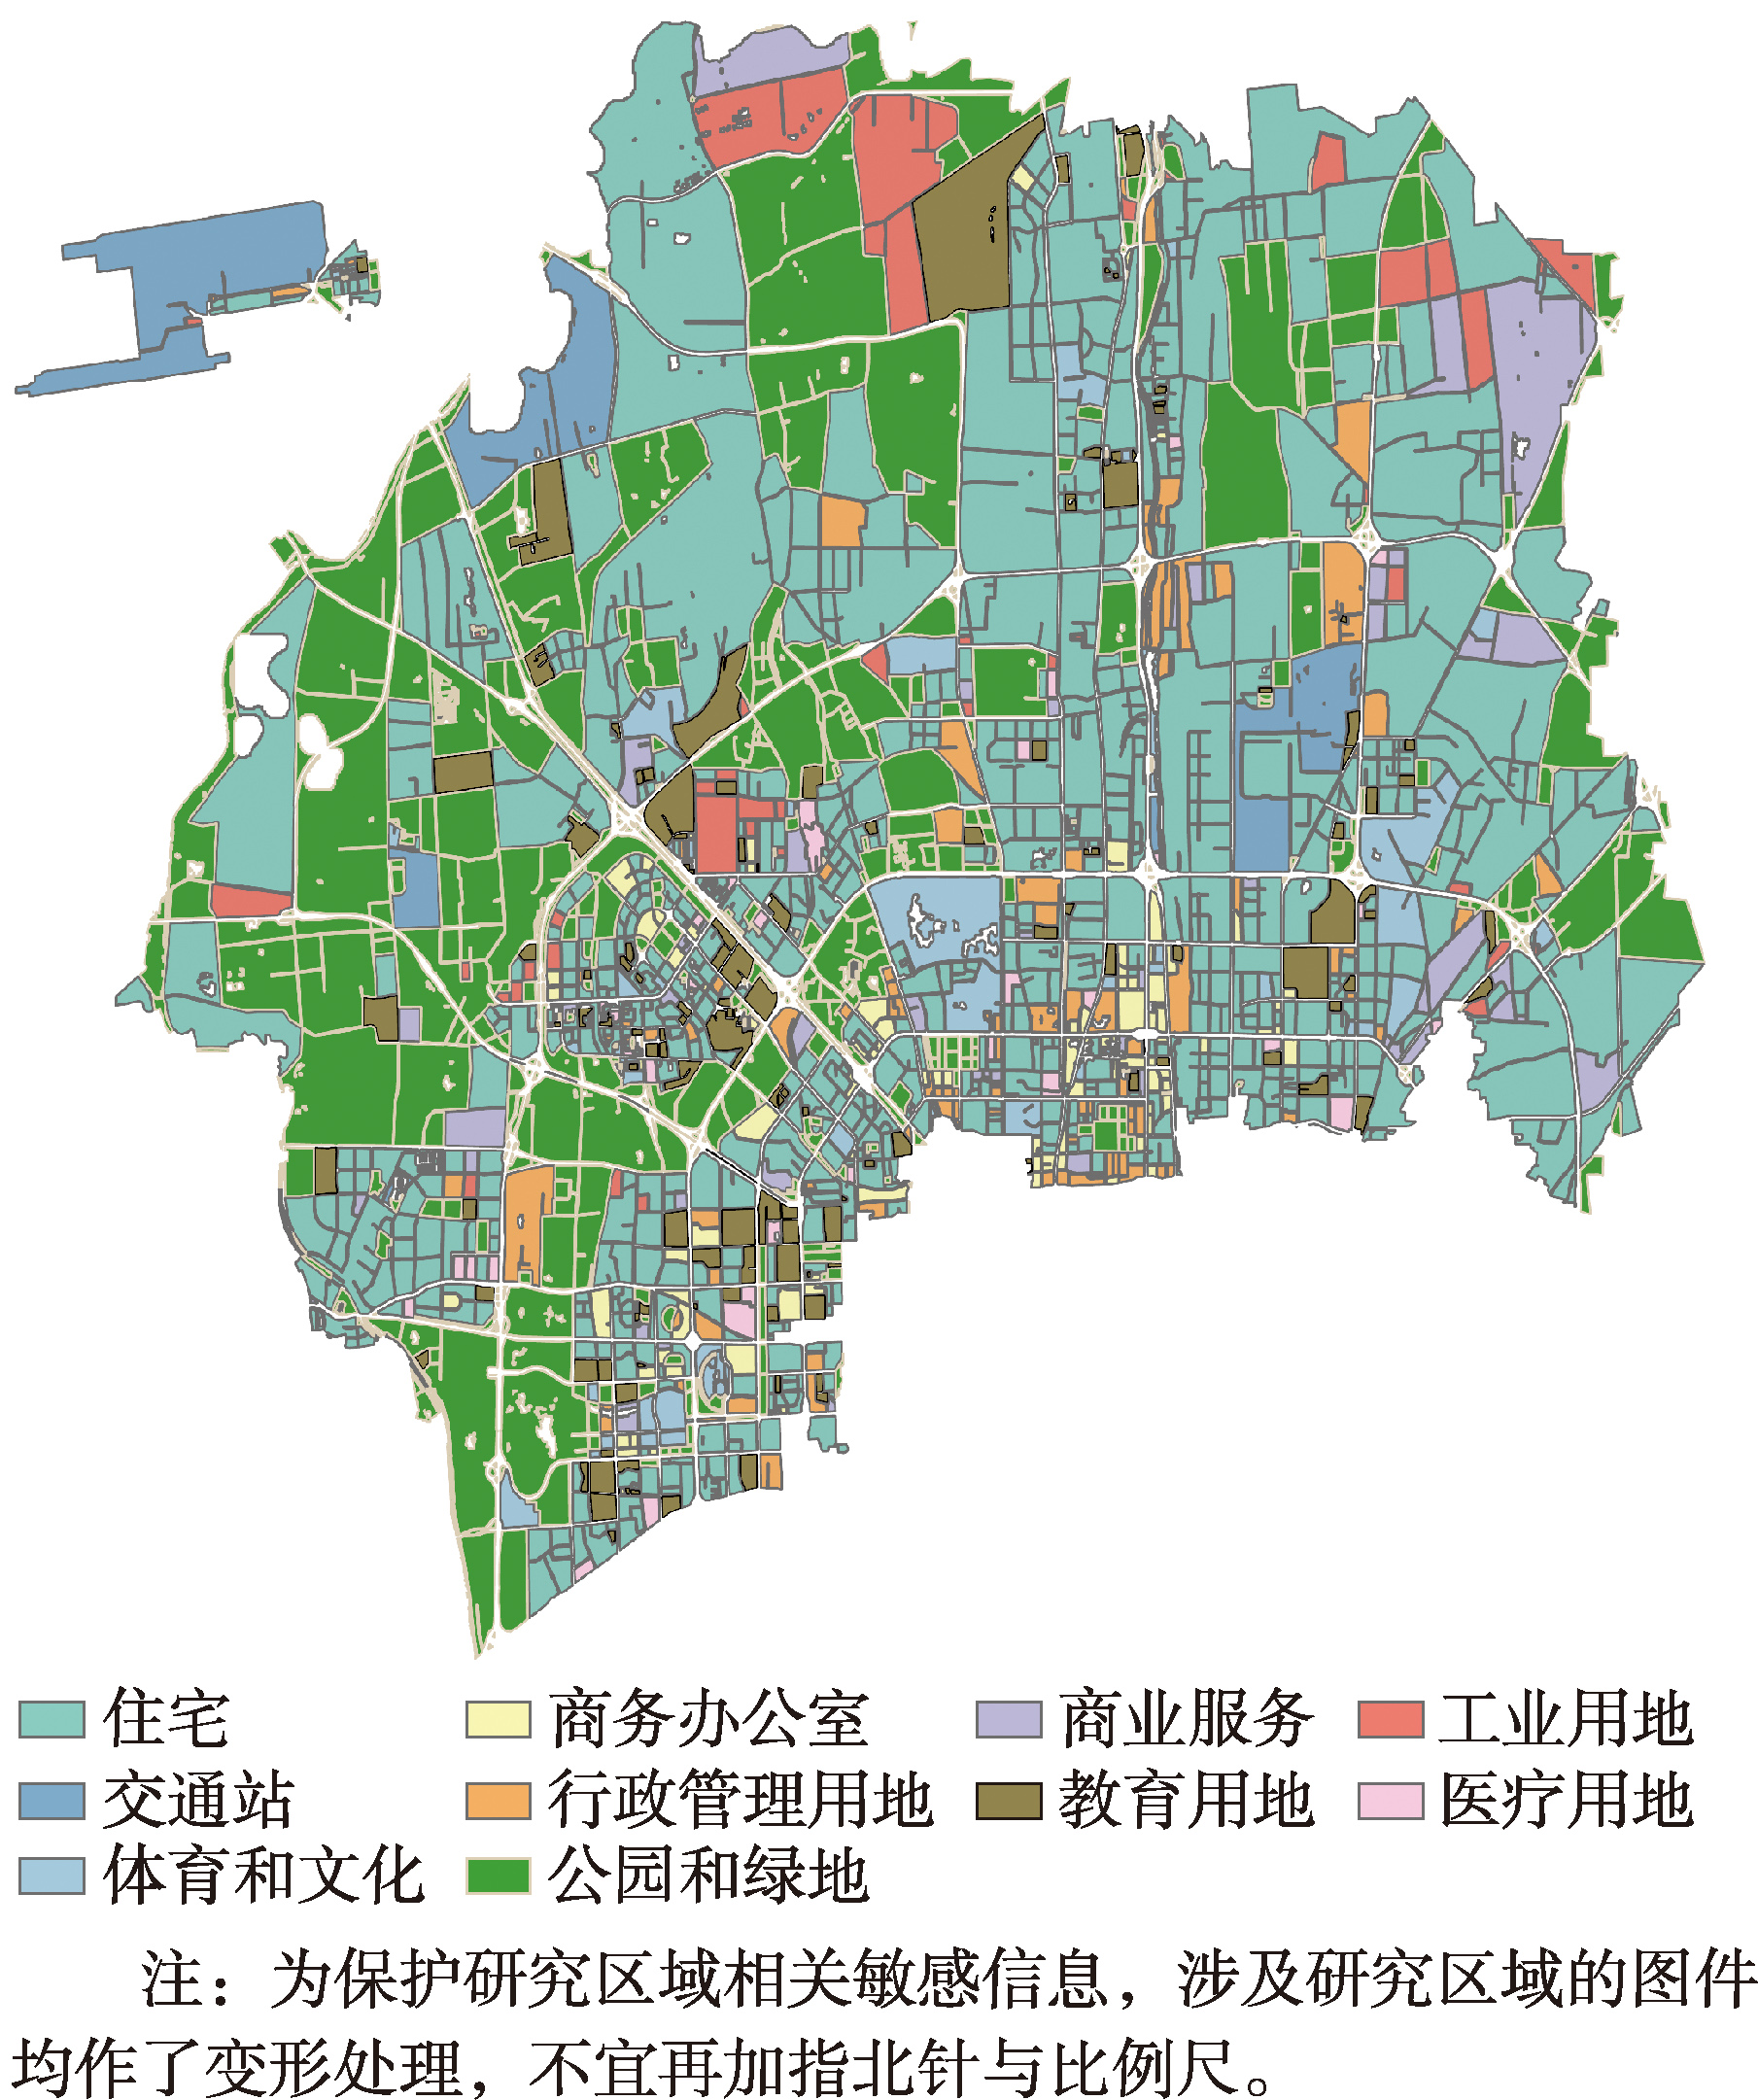
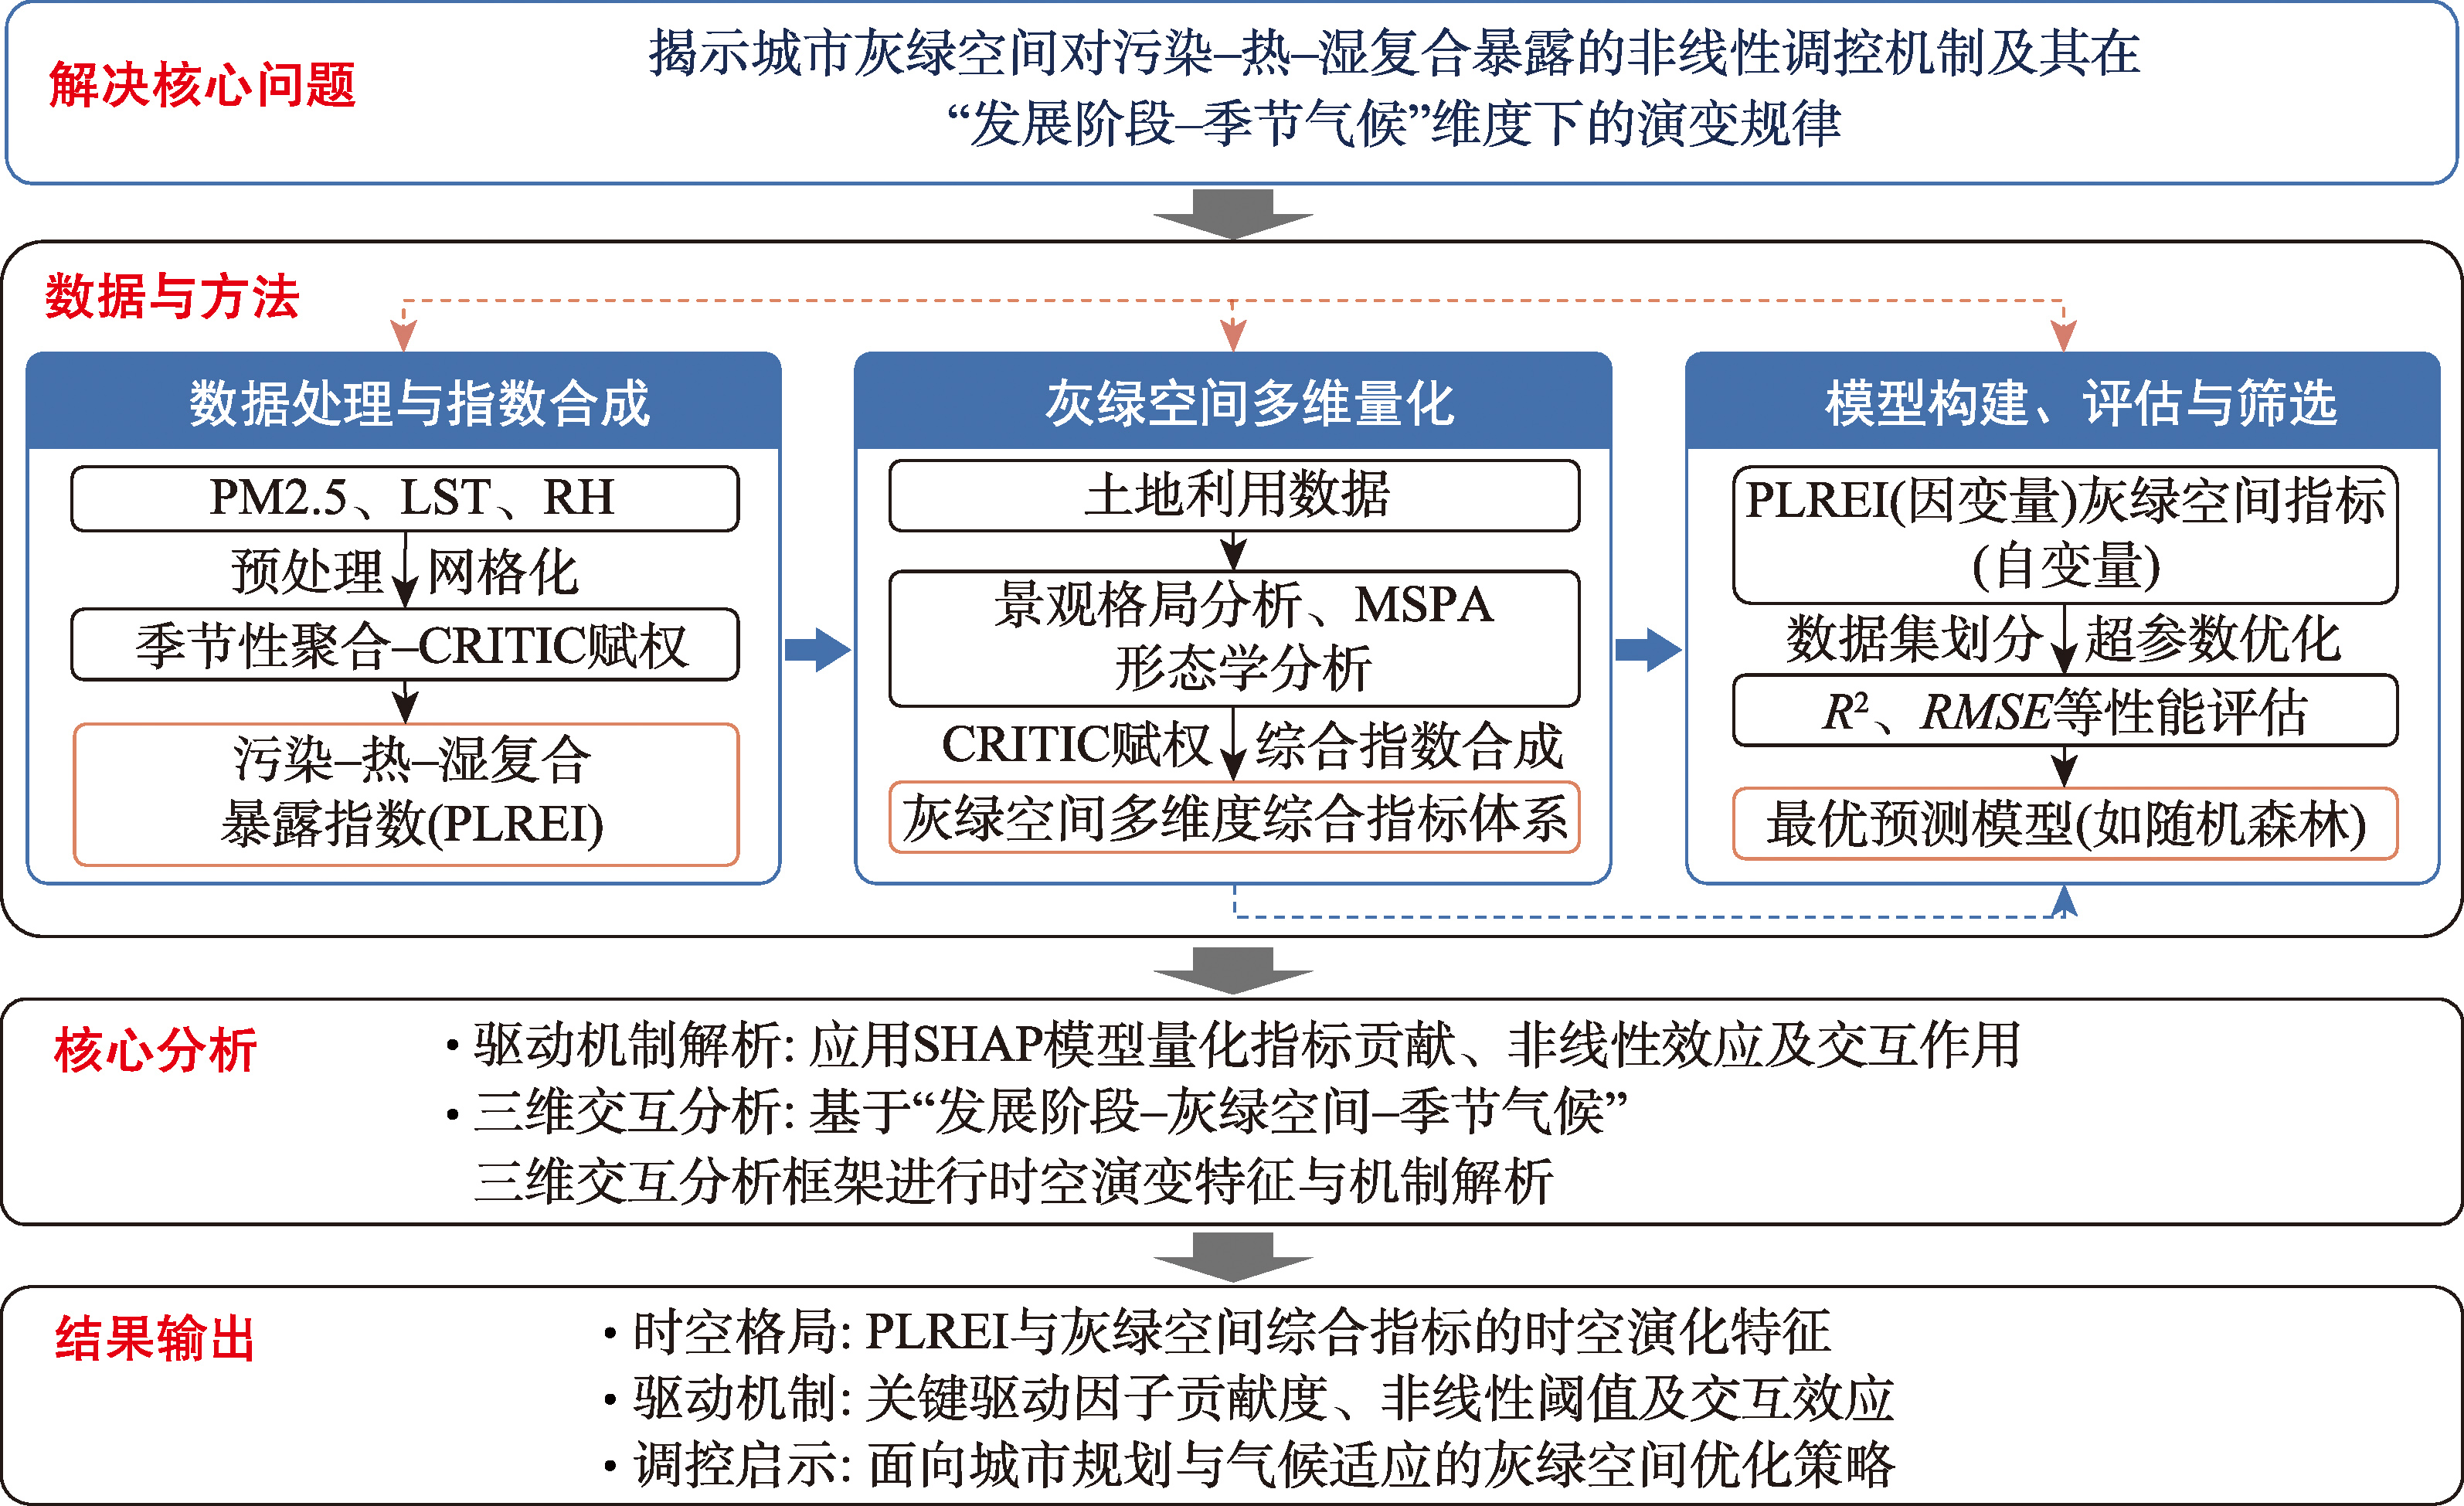
[Objectives] Against the backdrop of global urbanization and concurrent ecological crises, urban development patterns present differentiated demands for the regulation of pollution-heat-moisture compound exposure. Traditional spatial quantitative assessment methods, which rely on homogenized indicators and overlook the multidimensional attributes and nonlinear interaction effects of gray-green space, struggle to accurately characterize the spatiotemporal differentiation and driving mechanisms of compound exposure. This study aims to develop an integrated quantitative analysis framework combining Morphological Spatial Pattern Analysis (MSPA), the Criteria Importance Through Intercriteria Correlation (CRITIC) objective weighting method, and the Machine Learning with SHapley Additive exPlanations (ML-SHAP) model to systematically elucidate the regulatory mechanisms of gray-green space on pollution-heat-moisture compound exposure. [Methods] First, a comprehensive indicator system for gray-green space is constructed, encompassing four dimensions—scale, complexity, connectivity, and structural integrity, thereby overcoming the limitations of traditional single-factor quantification. Second, the MSPA method, originally applied primarily to green space, is extended to gray space, enabling a systematic characterization of the built environment as a spatial entity. Third, the CRITIC method is employed as an objective weighting approach to replace subjective evaluation, enhancing the scientific rigor of indicator synthesis and weight allocation. Finally, the ML-SHAP model is integrated to quantify the nonlinear effects, threshold effects, and interaction mechanisms of gray-green space indicators on pollution-heat-moisture compound exposure. Building on these components, a three-dimensional interactive analytical framework of "development stage-gray-green space-seasonal climate" is established to reveal the structural evolution of gray-green space regulation mechanisms in the context of urban development stage transition. [Results] The framework is empirically applied to Hohhot, an expanding resource-based city. The results demonstrate that: ① The method effectively identifies nonlinear influence patterns of gray-green space indicators on compound exposure. Building coverage intensity exhibits an S-shaped threshold effect, characterized by a sharp initial increase followed by stabilization. Its threshold point advanced from 0.5~1.0 standard deviations in 2010 to 0.3~0.6 standard deviations in 2020, reflecting the shaping effect of urban development stage transition on built-up area sensitivity. ② The method quantifies the interannual qualitative shift in the regulatory efficacy of green space. In summer, the influence trajectory changed from a "positive-then-negative" nonlinear pattern in 2010 to consistently negative regulation in 2020; in winter, it shifted from weakly positive to consistently negative regulation. This reveals the compensatory mechanism of ecological infrastructure development for the functional deficiency of vegetation during its dormant period. ③ The method captures the interannual evolution characteristics of gray-green space interactions. The synergistic exacerbation effect among gray space indicators expanded from sporadic occurrences only in spring in 2010 (synergy between building coverage and green space morphology) to a universal pattern across all four seasons in 2020 (synergy between building coverage and building morphology). Interaction intensity increased from 0.02~0.10 to 0.05~0.20, indicating the increasingly prominent superimposition effect of building coverage scale and morphological complexity. These findings demonstrate that the evolution of pollution-heat-moisture compound exposure is determined by the coupling pattern of gray-green space rather than by individual factors, with the essence of regulation lying in the dynamic adaptation between the "gray-green space coupling pattern" and the urban development stage. [Conclusions] The integrated MSPA-CRITIC-ML-SHAP method developed in this study transcends the limitations of traditional single-factor, linear-assumption-based quantification, enabling a systematic characterization of the multidimensional attributes of gray-green space, nonlinear influence trajectories, and interaction mechanisms. This method effectively identifies the structural evolution of gray-green space regulation mechanisms within the context of urban development stage transition, providing an extensible analytical tool for elucidating nonlinear response mechanisms in urban ecological systems. The research findings are applicable to the mechanistic analysis of other urban ecological issues, such as the greenhouse effect and thermal environment, offering methodological support for the development of differentiated governance and spatial regulation systems for urban compound exposure.
[Objectives] Social media has become an important platform for tourists to share travel experiences and perceive the image of tourist destinations. As a popular type of tourist destination, the scientific excavation and presentation of coastal tourist destinations' image are of great significance to the high-quality development of such destinations. Existing studies on tourist destination image excavation mostly focus on single-dimensional analysis and lack a unified analytical framework. Furthermore, few studies have conducted comparative analyses from the perspective of peak and off-seasons, leaving an obvious research gap. [Methods] Based on the cognitive-affective model and web text analysis method, this study constructs an analysis framework for tourist destination image mining based on multi-source social media data, which consists of three core layers: data input, analysis and processing, and result output. The framework clarifies technical paths including text collection, semantic extraction, sentiment recognition and structural presentation, thus providing a referable paradigm for the standardized and systematic excavation of tourist destination image. Taking Sanya Bay Resort as the case study area, this study selected 21 598 valid tourist reviews from Ctrip, Qunar, Mafengwo and Sina Weibo as the data source, and adopted the above-mentioned method for empirical verification. With the image differences between peak and off-seasons as the starting point, this study further explores the characteristics of tourists' perception of the tourism image of Sanya Bay Resort. [Results] The tourism image of Sanya Bay Resort forms differentiated perceptual structures and emotional orientations in peak and off-season contexts: tourists in the peak season prefer iconic landscapes and family travel, while those in the off-season focus more on leisure consumption and in-depth experiences. The affective image is generally positive, with the average proportion of positive emotions reaching 63.3%, which is significantly higher than the average 15.5% of negative emotions. There exists internal spatial heterogeneity within Sanya Bay Resort. Under the combined influence of resource types and tourist expectations, the four major subdistricts form "micro-destination" perceptual units with distinct attractions and experiential functions. [Conclusions] The analytical framework constructed in this study can systematically identify the cognitive elements, affective attributes and semantic structure of tourist destination image, and possesses favorable transferability and expandability, which provides a standardized technical path for the extraction of dynamic images from massive tourist-generated texts. The empirical study further reveals the characteristics of seasonal differences and spatial heterogeneity in the tourism image of Sanya Bay, thus offering methodological support and empirical reference for the image shaping, zonal management and strategy optimization of coastal tourist destinations.

 Astrophysics Data System(ADS)