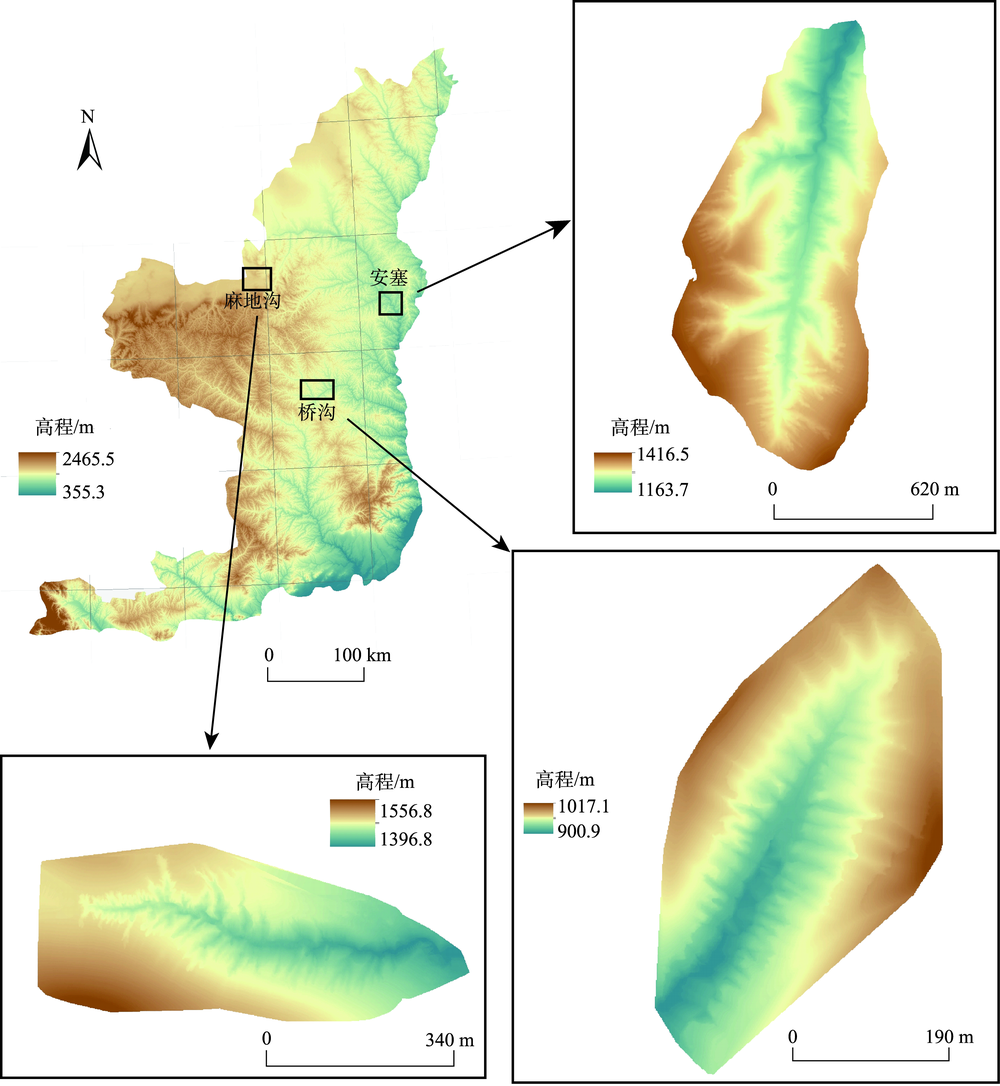
Terrain expression of loess erosional gully is the base of the researches of gully erosion modeling and prediction, which also have a great significance in related fields of geoscience. The quantitative study of gully features based on Digital Elevation Model (DEM) can contribute to the research of morphological change and formation process of erosional gully. Currently, the use of representative feature indicators to describe the morphology of loess erosional gully should be one of the most popular used methods in researches of erosional gully. However, due to the structural limitation of grid DEM, the uncertainty widely exists in the calculated results based on DEMs. In previous practical researches, it has been proved that the resolution of DEM is an important factor which can influence experimental results obviously and cause the uncertainty of feature derivatives. Especially in the area of the Loess Plateau, the fractured landform and complicated landscape elements influence the expression of morphological features. Thus, the impact of DEM's resolution are more obvious in this area. The aim of this study is to analyze the uncertainty of morphological feature expression in the Loess Plateau based on DEMs with different resolutions. In this paper, DEMs with various resolutions of three study areas in the Loess Plateau were established based on the point cloud data which were acquired by Unmanned Aerial Vehicle (UAV). Eight typical morphological indicators were selected and calculated based on DEMs. These indicators were divided into groups according to the definition of each indicator. Two groups were established to express the morphological features of gully channel and gully head respectively. The experimental results shown that DEM's resolution has great influences on morphological feature indicators of erosional gully, and the major relationships between indicators and resolutions are linear. The high development stage of erosional gully's horizontal extension can weaken the influence of DEM’s resolution on morphological feature expression. In addition, when using fixed-size windows to calculate morphological feature indicators of erosional gully, the decrease of DEM's resolution lead to the increase of actual analysis radius and then surface morphological change has a growth trend in calculation areas. This phenomenon results in the rise of gully cutting depth when using DEM with lower resolution. Besides, the main gully channel is less affected by resolution. Thus, the DEM data with low resolution can be used to calculate morphological features of main gully channel. Finally, the morphological indicators of gully head were analyzed and there are weak correlations between these indicators and the resolution of DEM.
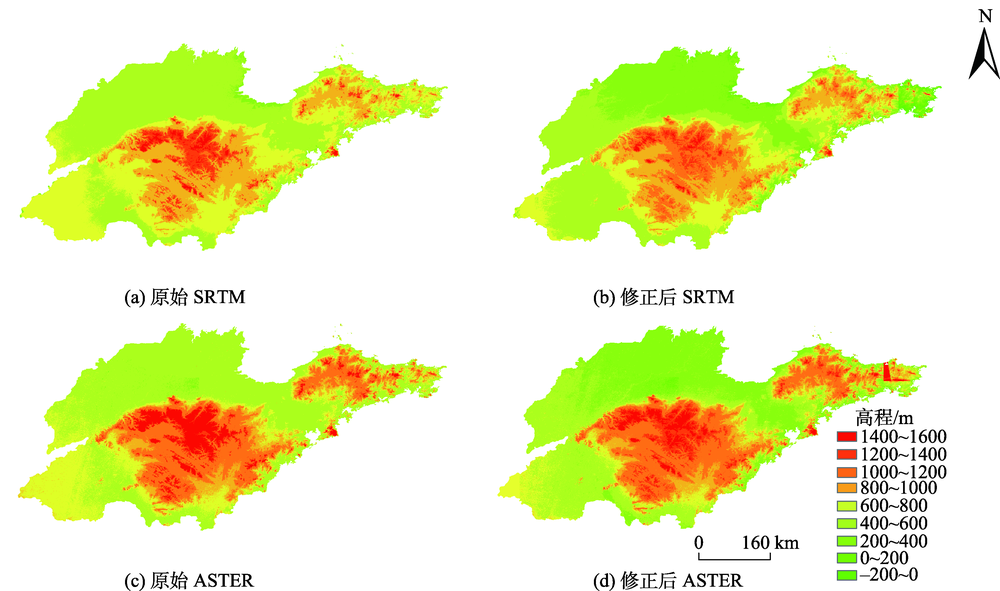
Shuttle Radar Topography Mission(SRTM) and Advanced Spaceborne Thermal Emission and Reflection Radiometer (ASTER) GDEM have a high spatial resolution and wide spatial coverage, which play an important role in many Earth researches. However, their error distributions are heterogeneous on different terrain types. In order to assess the elevation accuracy of the two DEMs, data from Geoscience Laser Altimeter System (GLAS) carried on the Ice, Cloud, and land Elevation Satellite (ICESat) are often used as the checkpoints due to their high accuracy. Taking Shandong Province as the research area, the accuracy of SRTM and ASTER GDEM are first evaluated by ICESat/GLAS in the years of 2003-2010 in this paper. Results indicate that the root mean squared errors (RMSEs) of SRTM and ASTER are 5.57 m and 7.20 m, respectively, which are much lower than the nominated accuracy. We further analyzed the effect of terrain slope and landscape type on the accuracy of SRTM and ASTER GDEM. Specifically, the study area was first divided into different sub-regions according to slope ranges (0~5°, 5~10°, 10~15°, 15~20°, 20~25°, 30~35°, 35~40°, 40~45°) and landscape types (farmland, shrub, forest, grassland, wetlands, water body), respectively. Then, the RMSE of each sub-region was computed and analyzed. We found that with the increasing of terrain slope, the accuracy of the two DEMs decreases, and under different land cover types, they also have different accuracy. More specifically, the two DEMs have a higher accuracy on farmland and shrub; while have a lower accuracy on forest and wet lands. To improve the accuracy of SRTM and ASTER, their error surfaces were first produced by interpolating the elevation differences between the DEM and randomly selected ICESat/GLAS data with the proportion of 90%. The interpolation methods include Inverse Distance Weight (IDW), Ordinary Kriging (OK), terrain-to-grid method (T2G) and Natural Neighborhood (NN). Then, the interpolated error surfaces were added to the original DEMs. Accuracy assessment of the improved SRTM and ASTER using the remaining 10% ICESat/GLAS demonstrates that IDW with the RMSEs of 2.20 m and 5.31 m is more accurate than the other interpolation methods. IDW is closely followed by T2G and NN. It is surprised to see that OK produces the worst results. Hence, SRTM and ASTER GDEM are improved with the IDW-based error surfaces. The ICESat-2 satellite was launched on September 15, 2018. It can emit 10,000 laser pulses per second, monitoring the height of glaciers and land in unprecedented detail. ICESat-2 collects elevation data over all surfaces spanning the world's frozen regions, forests, lakes, urban areas, and more. Thus, further researches will focus on improving the accuracy of SRTM and ASTER with the ICESat2 data.
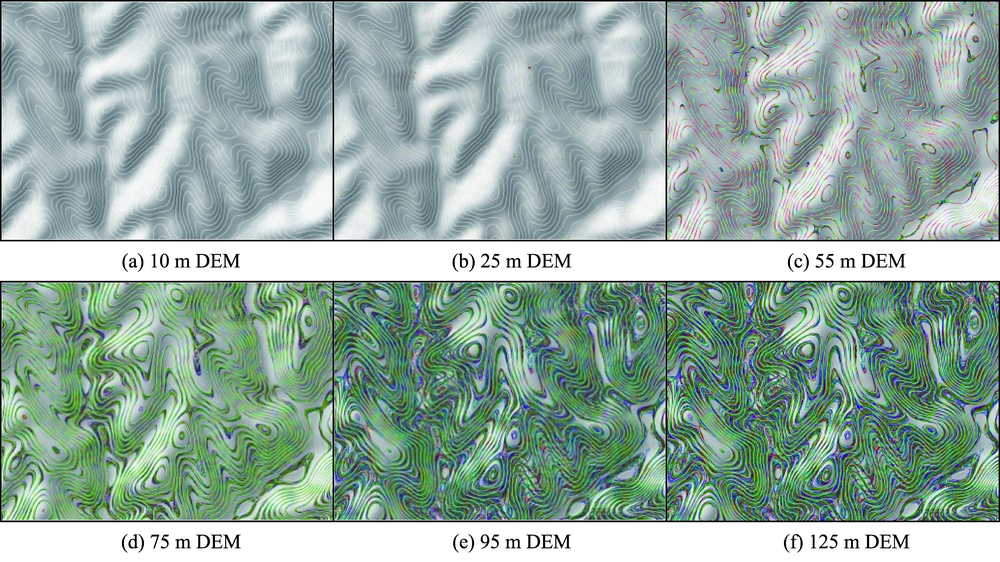
The accuracy of DEMs is the key issue for its quality and various applications. Theoretically, terrain morphology is the basis to derive the topographic information. Therefore, to establish the methodology of DEM's morphologic accuracy can promote the high-quality DEM productions and their widespread applications. Focusing on the cognition of the local slope concave-convex property, this paper analyses the influences of grid point locations and grid cell sizes on this morphological property. As such, this paper arms to further improve and develop the theory and method of DEM quality. At first, this paper introduces the basic concept of terrain morphology accuracy represented by the gridded DEM, consisting of elevation sampling accuracy and elevation relation accuracy of local points, local slope morphology accuracy, regional terrain relation accuracy and global terrain structure accuracy. Herein, the local slope morphology accuracy can be represented by the local slope concave-convex property, including three categories of flat slope, concave slope and convex slope. To quantify the concave-convex property, the error metric is defined using the multi-scale DEMs and several statistic indexes of the error metric are presented. At last, taking loess hill region as the study area and 5、10、15、25、…、155 m DEMs generated by the TIN-based method as the experimental dataset, the comparative method is applied to investigate the characteristics of the local slope concave-convex slope varied with the grid-point location and the grid cell size. The main conclusions of this research are reached as follows: (1) the morphology accuracy of DEMs must be considered in the production of high-quality DEMs. In this study, 10 m size (jumping rate is equal or lesser than 0.3%) is optimal threshold of the grid cell size for 1:50 000 DEMs. (2) When the DEM resolution is higher than the threshold, the DEM has almost the same concave-convex property with the real topography, followed by the less changes in the transition area between the positive and negative terrains. When the resolution of DEM is lower than the threshold, the local slope concave-convex property would have a significant uncertainty changed with the grid-point location and the DEM resolution.
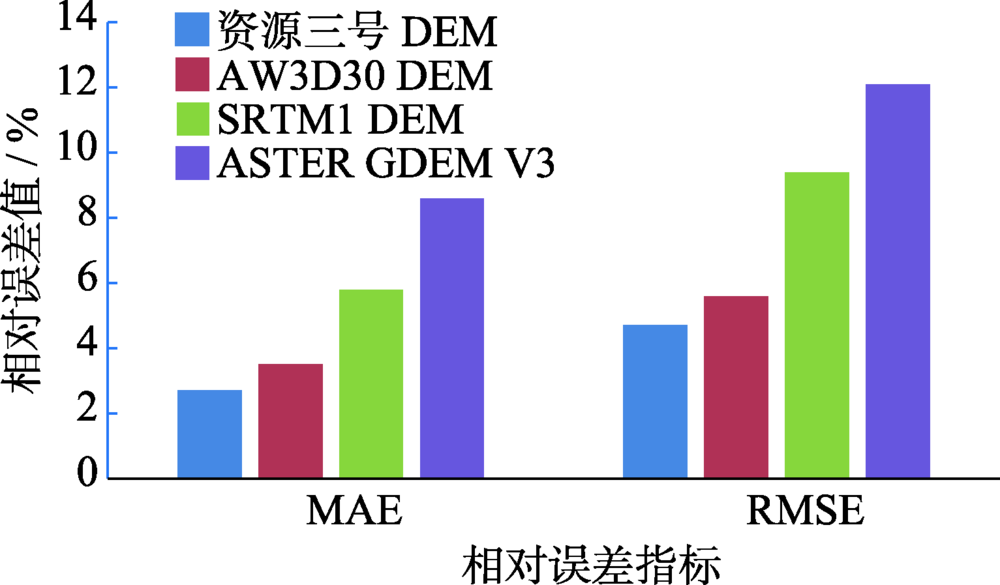
Global open DEM datasets provide important data sources for digital topographic analysis. Compared to the existing global open DEM datasets, the DEM data made from ZY-3 Satellite have higher spatial resolution, wider coverage and better currency, which results to a great likelihood to produce a global DEM dataset with high quality from ZY-3 Satellite. So the error comparison among the DEM datasets made from ZY-3 Satellite and the global open datasets will provide scientific basis for the global DEM dataset production made form ZY-3 Satellite data. Taking the Taiyuan City (the middle region of Shanxi Province) as a test area, this paper made an error comparison among the DEM datasets made from ZY-3 Satellite (ZY-3 Satellite DEM) and three typical global open DEM datasets (AW3D30, SRTM1 and ASTER GDEM) based on the referencing DEM data produced by laser-point cloud data with high accuracy. Meanwhile, the mean value, mean absolute value, root mean square value and standard deviation value are computed for the absolute error and the relative error at different slope classes. The research results show: (1) the error distributions for all of the four DEM datasets show relatively good symmetry. Meanwhile, the mean error value is approximate to 0 m, especially for the SRTM1 and ASTER GDEM data. So the root mean square error values and the standard deviation error values are approximate for all the four DEM datasets. (2) ZY-3 Satellite DEM has the lowest root mean square error value (4.6 m), so it has the highest accuracy. The next is the AW3D30 data (with root mean square error value of 5.6 m), then the SRTM1 data (with root mean square error value of 8.8 m). ASTER GDEM has the highest error values (with root mean square error value of 12.6 m), so it has the lowest accuracy. Meanwhile, the relative error and the absolute error show similar rules for the four DEM datasets. (3) The errors of the ZY-3 Satellite DEM, SRTM1 and ASTER GDEM data rise with slope increasing. The error of AW3D30 data shows an undulation tendency of rising first, and then falling with slope increasing. The error for the AW3D30 data is lower than that for the SRTM1 data at any slope classes except for the 0°~2° class. At all the slope classes, ASTER GDEM data has the highest error values of all. Overall, compared to other three DEM datasets, ZY-3 Satellite DEM data has the lowest error values and the highest accuracy at all the slope classes.
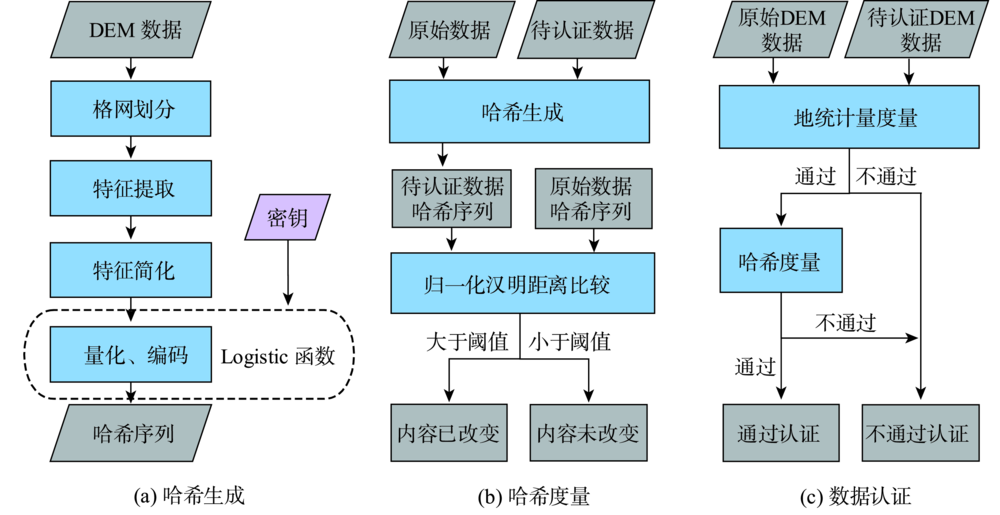
As a type of fundamental and important geographic data, the integrity of DEM data cannot be ignored. The commonly used technology for data integrity authentication is mainly based on traditional cryptography and digital watermarking technology. The former is very sensitive to the change of every bit of data, suitable for accurate authentication of text data; while latter is mostly based on data carrier for authentication, seldom considers if DEM data content changes or not, and needs additional secure channels and communication media. In this paper, based on the requirement of authenticity and integrity of DEM data and the shortcomings of related authentication algorithms, a DEM data authentication algorithm was designed based on the Perceptual Hashing technology, which can achieve tamper localization. Perceptual hashing is a kind of method that maps multimedia data unidirectionally into perceptual summary sets (i.e. hash sequences). It inherits the characteristics of traditional Hash functions such as unidirectionality, anti-collision, and summarization, and is robust to the operation of content preservation, so it can better meet the requirements of DEM data authentication. The main ideas of this algorithm are as follows: Based on the characteristics of a large amount of DEM data and abundant details, the DEM data is divided into regular and non-overlapping grids. Feature extraction is the key of Perceptual Hashing algorithm. In this paper, the discrete cosine transform was used to extract features and generate the eigenvector matrix. Then the eigenvector matrix was digested. Next, the simplified eigenvector matrix was scrambled by using a Logistic chaotic system to meet the security requirements of authentication. Followingly, the scrambled matrix was quantized and coded to generate perceptual hash sequence. In the data authentication stage, the relative error of elevation between the original data and the data to be validated was calculated firstly. Subsequently, the perceptual hash sequence of the original data and the data to be validated was normalized to measure the Hamming distance. Combined with the determination threshold, the DEM data was authenticated. The scope of tampering would be located on the "grid unit" mentioned above. The algorithm has strong robustness against DEM data format conversion, watermarking embedding and other attacks. It is sensitive to various operations of changing contents, and can recognize and locate minor tampering of DEM data. Compared with the traditional DEM authentication algorithm, this algorithm innovatively regards "content" as the sole criterion of identity determination, which effectively compensates for the traditional digital watermarking method's excessive dependence on information carriers.
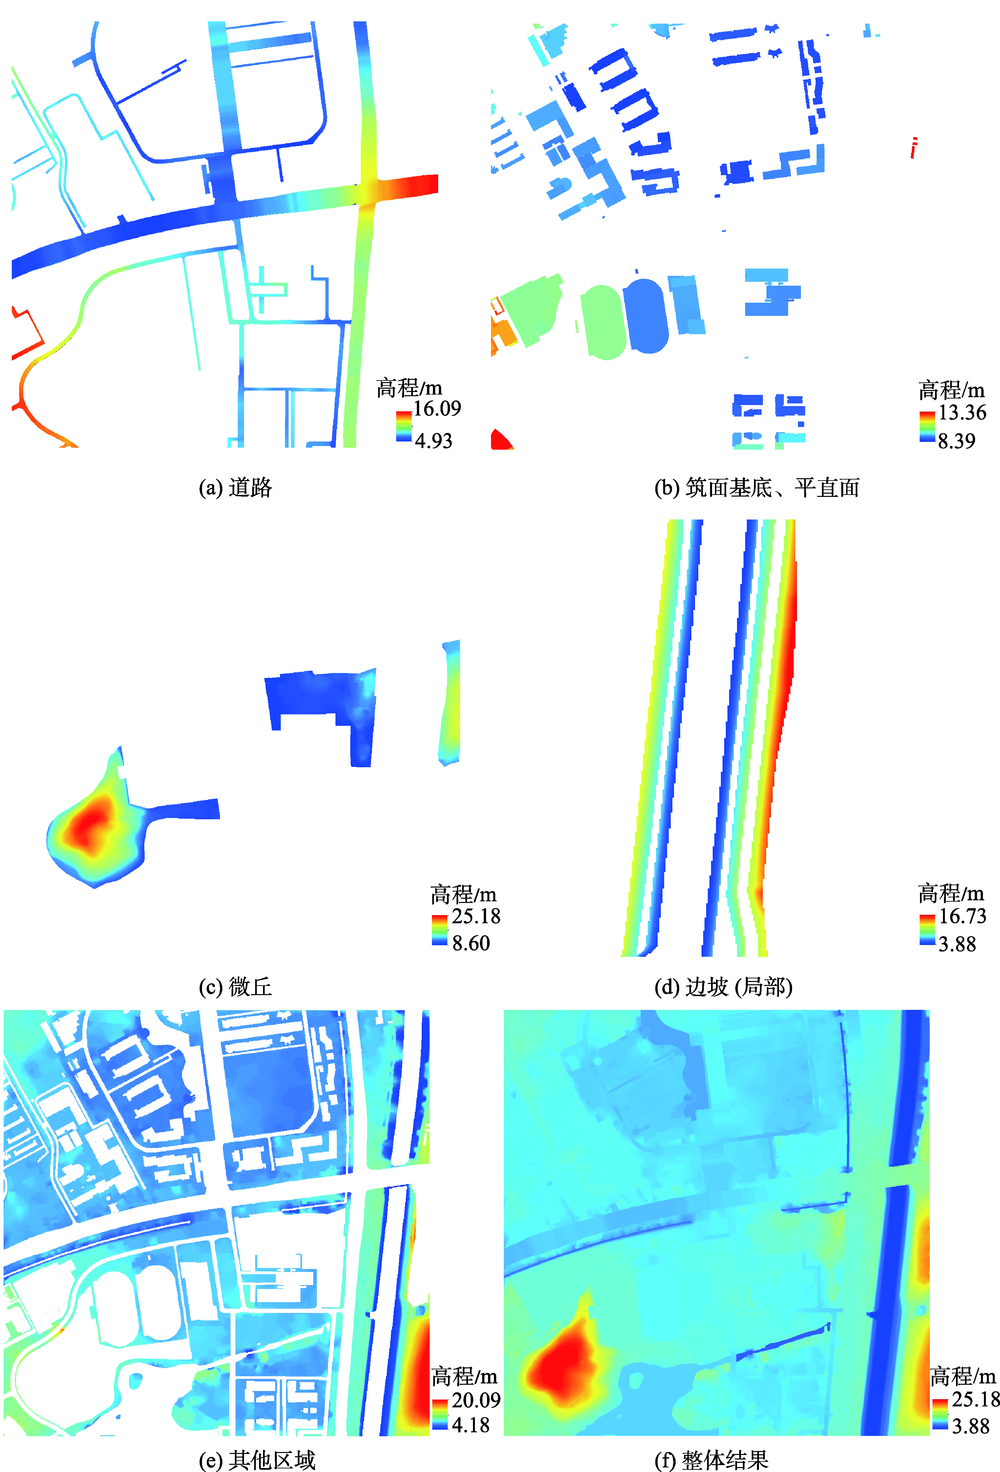
Digital Elevation Model(DEM) is the digital expression of terrain surface morphology. As an important basic geographic information data, DEM has an important application in the field of natural and human sciences. Therefore, the construction of DEM data with high form accuracy and elevation accuracy has become a hot issue in related research fields. With the development of human society, the transformation and influence of human activities on the topography are becoming more and more significant, the surface modification taken by human activities makes it diversified and discontinuous. At this time, traditional DEM construction methods cannot meet the accuracy requirements of DEM in these areas. To solve this problem, this paper proposes a multi-model collaborative approach to construct DEM. Firstly, the features of the earth’s surface are classified according to their morphological features and semantic information. Then, this research construct DEM according to the design of different features of the earth's surface and the selection of appropriate methods. Finally, the research fuse and stitch the results of DEM to form a regional and complete DEM result. This paper chooses a suburban area of Nanjing as the experimental area and takes a large-scale topographic map as the basic data source to carry out DEM construction experiment. The results show that compared with the traditional DEM construction method, the multi-model collaborative DEM construction method proposed in this paper can effectively guarantee the expression of various types of terrain elements in the experimental area. Especially for the terrain transformed by human activities, such as roads, slopes and other areas, the DEM constructed by this method has a significant advantage in morphological accuracy.At the same time, the height accuracy analysis results based on the verification point method show thatthe elevation accuracy of DEM constructed by this method is also better than that of traditional DEM constructed method. Especially for some areas with regular shape and relatively scarce elevation information, the accuracy advantage of this method is particularly remarkable. This research results prove that the proposed multi-model collaborative DEM construction method is suitable for DEM construction in areas where human activities are transformed or significantly affected.The research of this paper has certain theoretical significance and application value for enriching the method system of DEM construction and analysis, as well as the production of high-precision DEM data in urban areas.
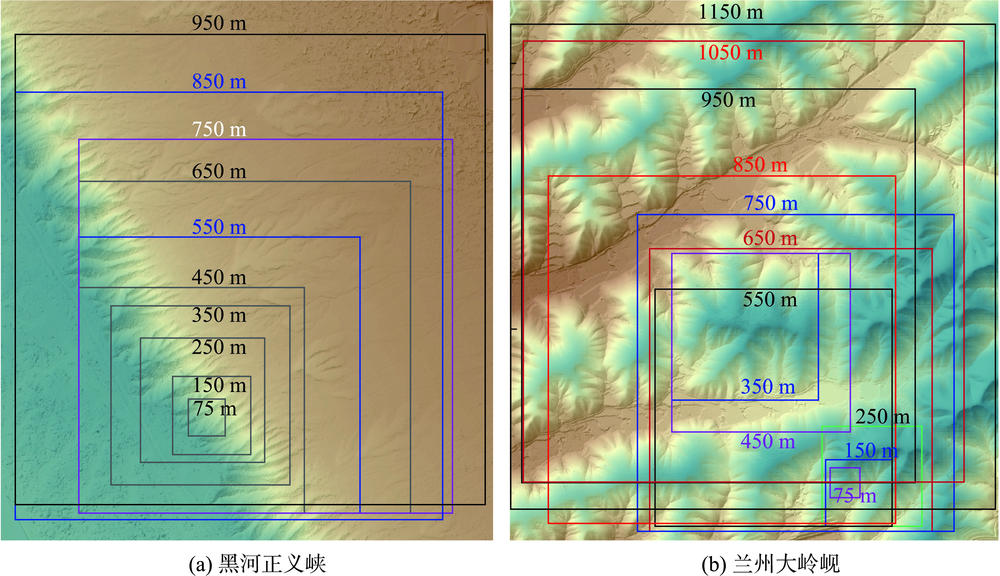
Valley spacing is an important characteristic to describe the distance between adjacent valleys. It can reflect the structural feature and spatial distribution of valleys. In this study, we took the Heihe Zhengyixia region and Lanzhou Dalingxian region as examples. We used the ArcGIS to resample the digital surface models (DSM) at 0.12 m resolution which were obtained by unmanned aerial vehicle to different resolution DSM. The different resolution DSM data were further processed by Fourier transform in MATLAB software. We compared different spectrums to build the relationship between land surface spectral feature and valley spacing. Analytical results show that: (1) for the first-order valley region, the effective identification of valley spacing feature signal in the spectrum required a terrain resolution higher than 1/5 of valley spacing. The terrain resolution could directly affect the identification accuracy of valley spacing signal. While the space domain had less influence on the valley spacing signal identification. (2) for the multi-order valley region, the effective identification of valley spacing feature signal in the spectrum required a terrain resolution higher than 1/3 of valley spacing. Either the decrease in terrain resolution or the increase in the spatial domain could decrease the spacing signal of lower-order valleys and increase the spacing signal of higher-order valleys in the spectrum.
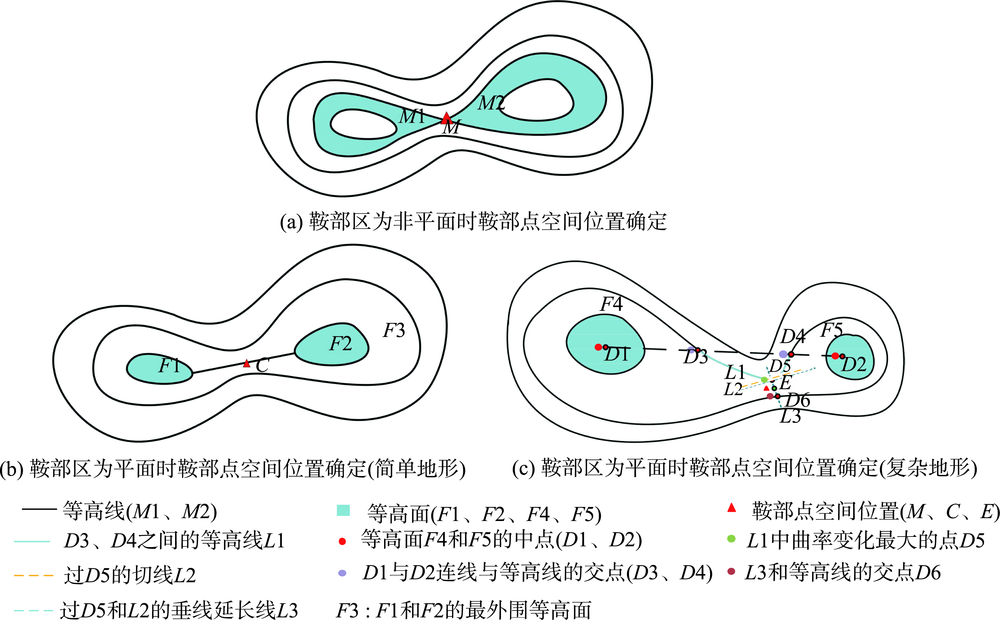
The saddle point is one of the important terrain feature points that reflects the fluctuation of the surface morphology. Accurate extraction of saddle points is beneficial to the analysis of spatial relationship and structural feature of terrain. Existing saddle point extraction methods are usually directly based on regular grid DEMs data which not have topological relation, unable to take into account the spatial topological relationship between saddle point and surrounding terrain and the influence of complex terrain on them. Many false feature points which are not in the saddle region will be extracted, and saddle points in some key areas also will be ignored. Thus, this paper designs an algorithm for extracting saddle points based on contour data according to the morphological characteristic of saddle points. This algorithm makes use of the feature of contour closure, converts contour lines into contour polygons data according to certain rules, and then uses the adjacent topological relations between contour polygons to recursively search and automatically extract the saddle-points. The experimental results show: (1) The number and position of saddle points are significantly related to the size of the contour interval. Within a certain range of scales, the smaller the contour interval is, the more saddle points are extracted, and the position accuracy is gradually improved. (2) Compared with the method based on regular grid DEMs data extraction, this method can more effectively filter many false feature points which are not in the saddle region, improve the accuracy of saddle point extraction, and also reduce the complexity of the saddle point extraction algorithm. In addition, DEM scale is selective for saddle point extraction. Compared with incremental contour method to extract saddle points, the idea is to find the intersection point which is the saddle point by extending the adjacent pseudo-saddle point contour line to the junction, this way has the advantage of more accurate position. However, this method requires DEM data with high precision, and when applied to 5-meter spatial resolution DEM data, most saddle points can't be extracted. The method in this paper is to use the midpoint of the nearest point in the two peaks as the saddle point, whose point position is not completely accurate, resulting in a certain error in spatial position accuracy. However, it can identify the majority of saddle points effectively, which has an advantage over the method of extracting saddle points mentioned above. Thus, the method in this paper can effectively improve the integrity of saddle point extraction and is more suitable for the DEM scale data (5 m DEM) in this paper.
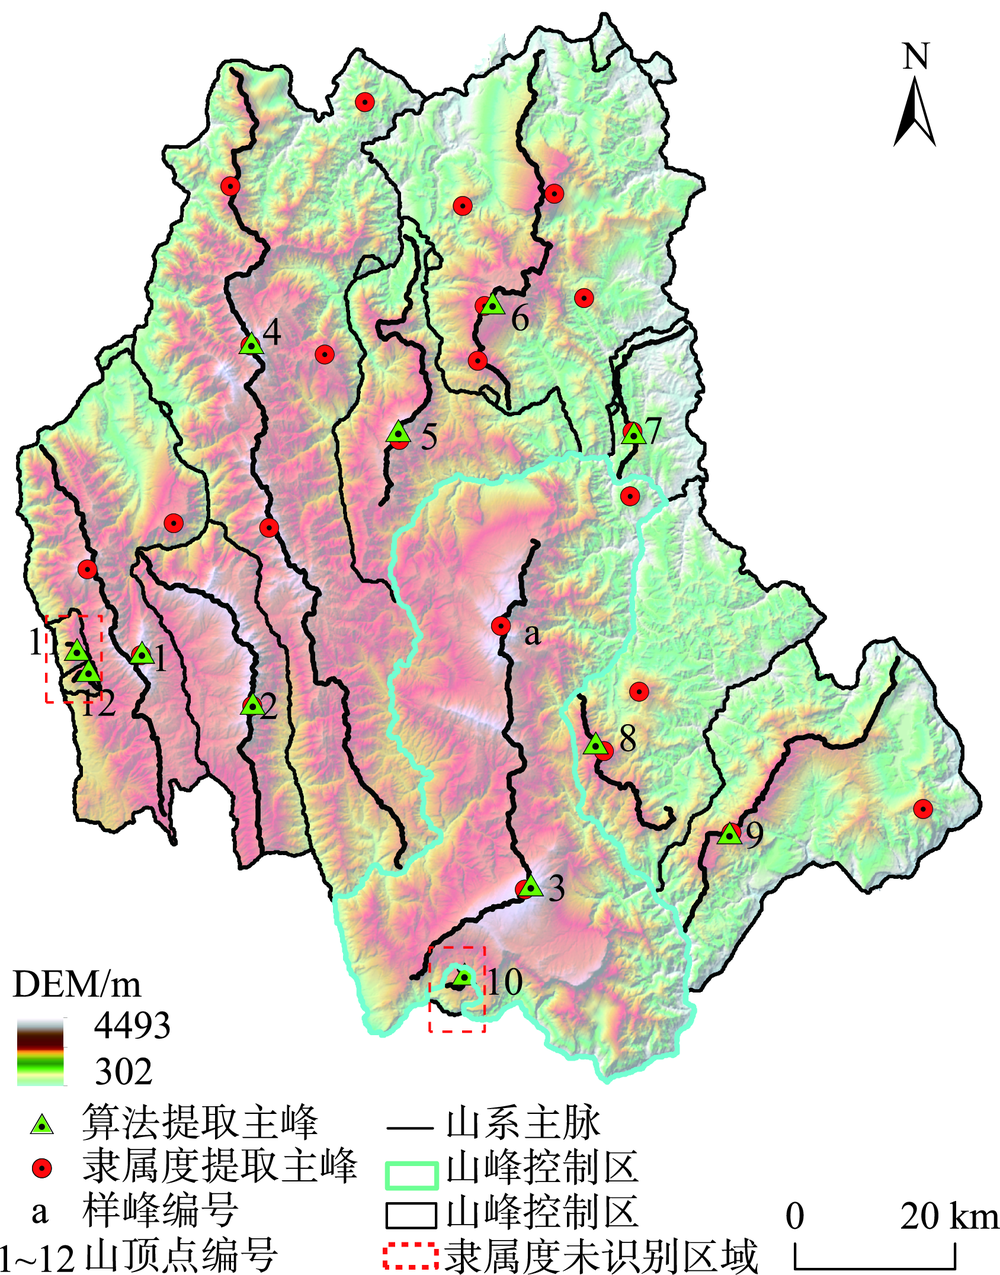
As a vital source of spatial data, DEM plays an important role in the process of geomorphologic characteristics analysis. DEM provides us an opportunity to study the earth surface with an even broader perspective aided by digital terrain structure analysis. The terrain surface often can be regarded as a combination of some fundamental elements, which include the peaks, ridge lines and valley, etc. The peaks and ridge lines depict the macro relief of the terrain, which explains why they often can be used to reveal the morphology, pattern, and evolution processes of the landform. Although the platform of ArcGIS enables the peaks and ridges to be extracted efficiently, there are still many obstacles in existence on the issue of landform features extraction. Firstly, the peaks and ridges extracted by the existing methods are independent of each other, ignoring the expression of their relationship. Secondly, the peaks often be picked out since they are the highest point in a given neighborhood, but these peaks are not necessarily mountain tops in the geomorphological sense and in cognition of mankind. The Liangshan Plateau Mountain in Sichuan Province is taken as a case study, since it is a typical mountainous area and is a transitional zone between the Qinghai-Tibet Plateau and the southwest edge of Sichuan Basin. A novel integrated strategy is provided in the paper to extract mountain peaks and ridges that are close to human cognition. The first step of the method is to section the terrain to obtain the highest points in every patches and the border of the patches. Then the ridge lines are extracted and ordered by a coding formula. An important step in the process is to identify the main peaks and the major ridge lines and finalize the integration of the peaks, mountain ridge lines and their territory. For the purpose of verification, the peaks and ridges extracted by the fuzzy logic algorithm are also presented in the paper. For the results, there are 9 main peaks in the region, 53 secondary peaks with an average elevation of 2540 m. And then 230 ridge lines are obtained, of which 9 main mountain ridges with an average length of 60 km. Besides, there are 9 mountains with an average area of 1017 km 2. Overall, the mountain system in this area shows a nearly north-south trend. When the fuzzy membership of peaks is between 0.98 and 1, the mountain peaks obtained by the two methods roughly coincide with each other, while the corresponding membership of the ridge lines is between 0.37 and 0.57. When compared with the results obtained by other methods such fuzzy logic method, the advantages of our algorithm are reflected in the better expression of peaks, main ridges and their interrelationships. It is important in helping people understand that where the mountain peak is, and that where the mountain ridge is, and it is from this point that we think our algorithms have achieved a preliminary transition from raster matrix to geographical objects. This study can be applied to assist in the classification of geomorphological types, regional geographic planning, etc.
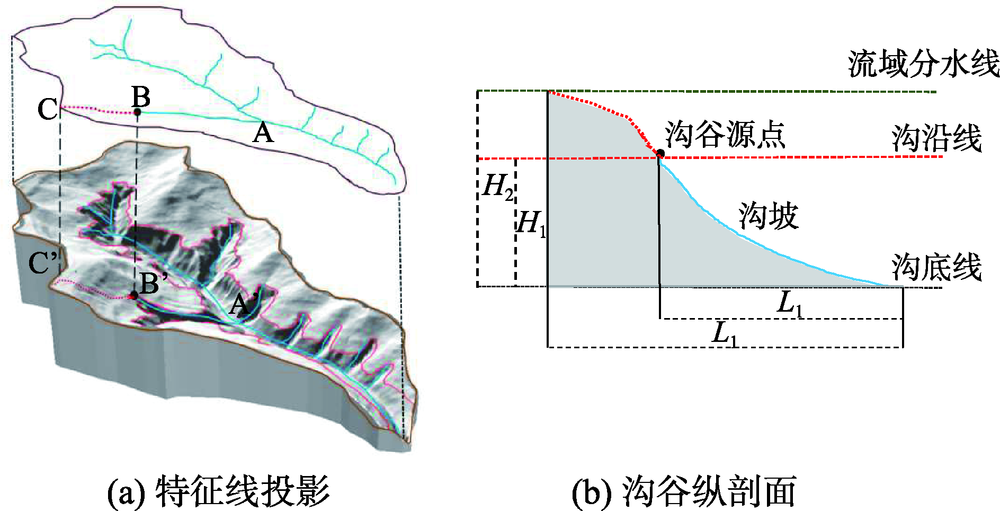
The gully source point is the most active part on the shoulder line. The spatial length of streamlines from the gully source point to the upstream watershed boundary line and the downstream gully line is an important identifications for spatial structure of the loess shoulder line, watershed boundary line and gully line. Proximity degree of gully source point to watershed boundary line spatially is a key point for quantifying the geomorphological development process in loess basin. To explore the loess landform areas watershed gully source point to approach watershed boundary line, reveal the loess watershed landscape development process and the method of main erosion processes. In this paper, A core factor of quantifying the three line spatial structural: Proximity Index (PI) was established from horizontal and vertical dimensions, including Horizontal Proximity Index (HPI) and Vertical Proximity Index(VPI). 42 study sites of 16 geomorphic types in the Loess Plateau of northern Shaanxi based on the digital elevation model data with 5 m resolution were selected and the spatial differentiation of their mean values (MHPI, MVPI) in the Loess Plateau of northern Shaanxi was discussed by using of the digital terrain analysis method. Besides, 4 typical watersheds including 5 whole gully levels were selected from 42 sites as the key study areas in Chunhua, Yijun, Ganquan, and Suide which located in loess tableland, loess residual tableland, loess ridge, and loess hill respectively in the north-south sequence. The Mean Proximity Index Variability (MPIV) of key study sites was calculated in the watershed scale. Results show that: ① There is a strong spatial autocorrelation of the Mean Proximity Index(MPI) in the Loess Plateau of northern Shaanxi. MHPI presents a trend of increasing firstly and then decreasing in the north-south sequence, and gradually decreasing in the east-west direction. MHPI reaches the maximum in the valley hilly area along the Yellow River. MHPI decreases firstly and then increases from southwest to northeast, and gradually decreases from northwest to southeast, and reaches the minimum in the Loess tableland area of Weibei region; ② The positive and negative MHPI values in watershed scale are sensitively related to loess tableland and hilly gully regions; ③ MHPI and MVPI of the 4 key sample areas are consistent with other terrain indexes in the north-south sequence. The MHPI of 104 external confluence region has a good correlation with the average slope (P=0.43, a<0.001),while the MVPI has a strong correlation with the hypsometric integral (P=0.75, a<0.001).The Mean Proximity Indexes (MPI) comprehensively take into consideration the spatial relationship of the three typical structural control lines in the Loess Plateau and have obvious indication significance for the development degree of the loess landform.
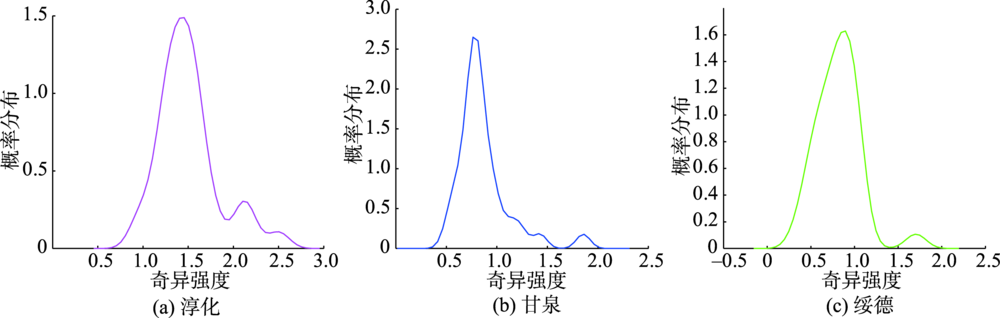
The characteristics of topographic relief variation are diverse from one landform type to another in the Loess Plateau. Great differences of topographic relief variation exist in different directions, which is known as topographic anisotropy. As fractal theory and geomorphology research become increasingly cooperative, Multifractal Detrended Fluctuation Analysis (MF-DFA) method, an effective means to quantitatively describe the nonlinear evolution process of complex sequences and the self-similar structural features formed by nonlinear evolution processes, manifests great potential in the study of topographic anisotropy of different landforms. In this paper, multifractal spectrum parameters were introduced to describe the variation characteristics of topographic anisotropy, in order to illustrate the local and global variation pattern of topographic anisotropy of different loess landforms. Based on 5 m-resolution Digital Elevation Model (DEM) data, three typical areas, Chunhua County of loess tableland, Ganquan County of loess ridge and Suide County of loess hill, were selected as the study areas. After that, MF-DFA of the variation characteristics of topographic anisotropy were conducted on these three areas. The results show that the topographic anisotropy of the three loess landform types has significant multifractal characteristics. The singularity strength of the topographic anisotropy from strong to weak turns out to be in the order of Chunhua, Suide and Ganquan counties. The probability of the singularity strength of topographic anisotropy in Chunhua County reaches the maximum at singular strength of 1.4, and there is a small peak around the singularity strength of 2.2. The probability of the singularity strength of topographic anisotropy in Ganquan County reaches the maximum at singularity strength of 0.7, with a second peak around the singularity strength of 1.8. Differently, the singularity strength of topographic anisotropy in Suide County is evenly distributed around 0.8, reaching the maximum at singularity strength of 0.8. The overall singularity strength of Chunhua and Ganquan counties are 1.4 and 0.7 respectively, while the probability distribution of topographic anisotropy in Suide County appears symmetrically. It can be concluded that the singularity strength of the topographic anisotropy is the highest in loess tableland, followed by that in loess hill. The singularity strength of the topographic anisotropy is the smallest in loess ridge. The results confirm that multifractal singularity strength is an effective method for the description and analysis of the topographic anisotropy of loess landforms, e.g., tableland, ridge and hill. This study can provide quantitative information support for the accurate classification of loess landforms as well as topographic indicators for regional water and soil erosion assessment.
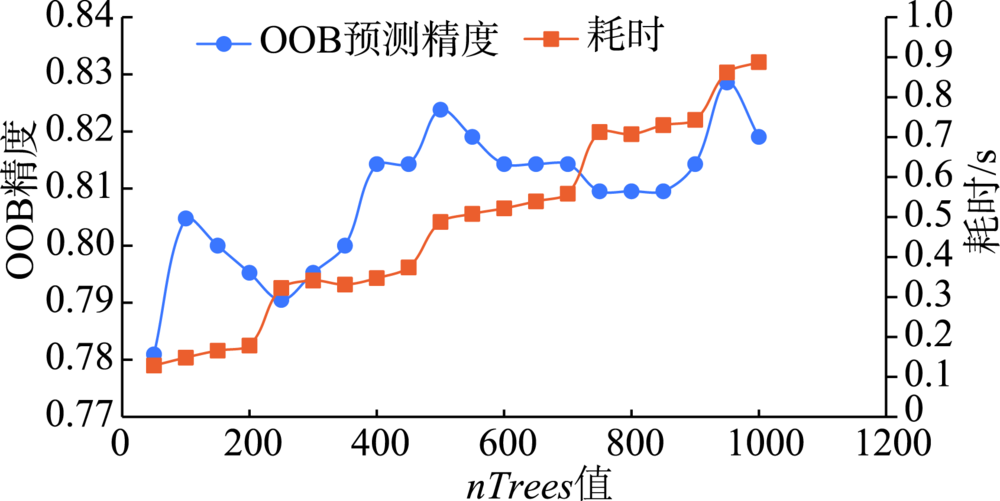
Landform classification is one of the most important steps tor eveal the mechanisms of surface matter flows and energy conversion, which could inform the scale and layout of human construction activities. However, traditional landform classification methods based on Digital Elevation Model (DEM) often use a small number of topographical derivatives or landform characteristics, resulting in insufficiently precise classification results. However, object-oriented landform classification performs better in that reliable classification can be achieved by maximizing the homogeneity within and between objects. But how to set conditions in object segmentation remains a challenge. In this paper, a geomorphological classification method based on watershed unitwas proposed, by accounting for many characteristics of watershed unit including statistics of basic topographic factors, feature point and feature line, basin and texture characteristics. Firstly, hydrological analysis based on DEM divided the study area into different small basins as the experimental units. Then, 29 features were extracted within each unit to represent watershed morphology using digital terrain analysis; feature selection and parameter calibration were carried out based on Random Forest (RF) algorithm. RF is a supervised integrated learning model aggregating different outputs of a single decision tree to reduce variances that may lead to classification errors in the decision tree. Finally, the watersheds in training set were selected to train the RF classifier, and the trained classifier was used to classify the landform of the whole study area, based on which we studied the landform spatial differentiation pattern. This experiment achieved good results in the landform classification of the Loess Plateau in northern Shaanxi Province. It is one of the areas with the most serious soil erosion and the most fragile eco-environment in the world. Most of them are covered by thick loess, and the topography is fluctuant. Result shows: (1) Compared with manual interpretation, excellent classification results based on small watershed in the study area were obtained, with the classification accuracy reaching 85% and the Kappa coefficient 0.83. (2)All small watersheds were divided into eight types of landforms. The same type of landforms showed obvious spatial aggregation. There were boundaries and transitional zones between different types of landforms. (3) Different geomorphological regions explained different situations of loess deposition and runoff erosion in different regions. Our findings suggest that the combination of RF algorithm and DEM data can achieve better classification results.
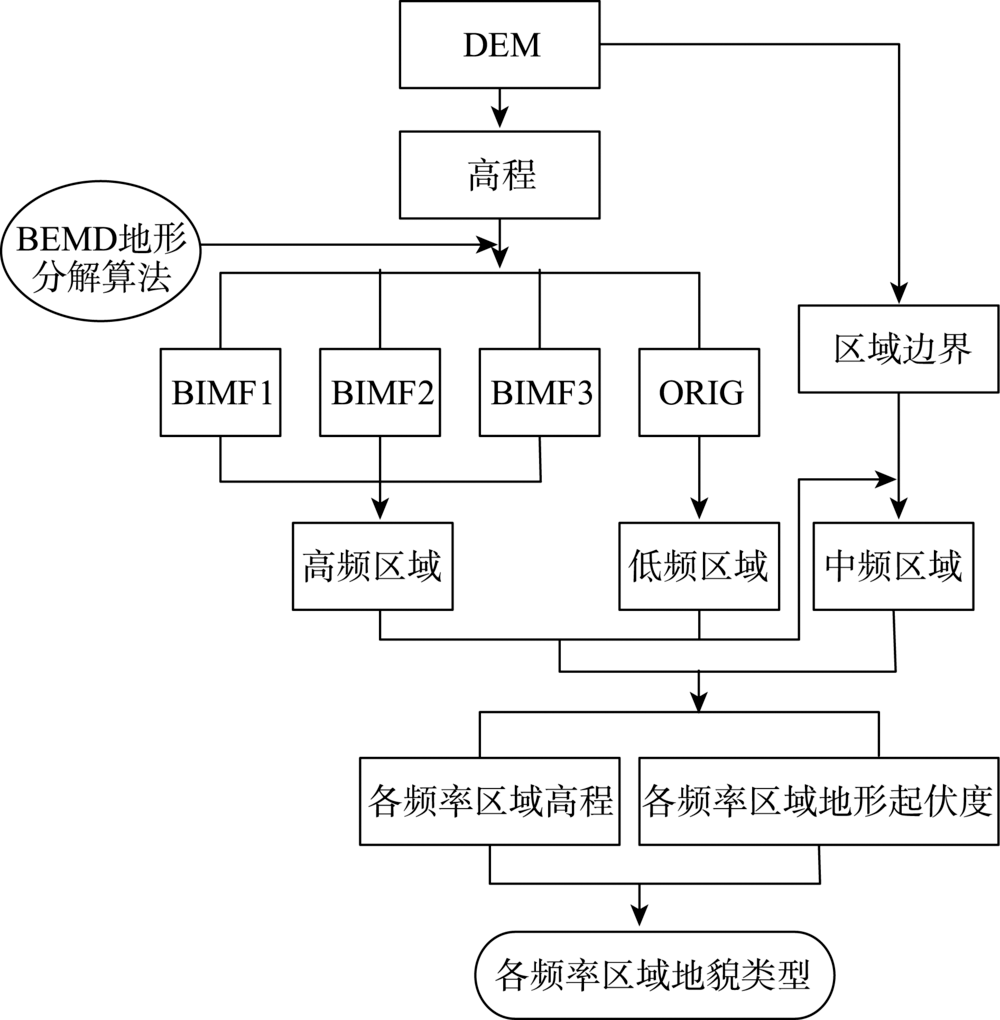
Geomorphology refers to the ups and downs of the terrain, that is, the shape of the surface. Geomorph-ological classification plays an important role in many application fields such as temperature, precipitation and solar irradiation. In this paper, the Digital Elevation Model(DEM) data of Fujian province with a spatial resolution of 90 m is selected as the geographic signal. The two-dimensional empirical mode decomposition(BEMD) is applied for decomposition processing to obtain several two-dimensional intrinsic mode functions(BIMF1~ BIMF3) with different scales and different physical meanings as well as the corresponding residual ORIG. These BIMF components correspond to the microtopography of different scales, and ORIG shows the geomorphic distribution trend of the study area, reflecting the general distribution area of plains, hills and mountains. The optimal calculation unit is determined by the method of variable point analysis, and the first order classification of each signal area is carried out by using the degree of relief, and the second level classification is carried out according to the absolute height. Finally, the first class classification and the second order classification are combined to realize the classification of terrain. This classification process reflects the complex characteristics of geomorphological assemblage in the study area. The results show that: (1) Superimpose BIMF components and extract the components and regions larger than 74m as high-frequency signal regions. The region is dominated by the low mountains with small relief amplitude, and is accompanied by middle mountain with small relief amplitude and hills. (2) The region with residual height less than or equal to 340m in ORIG was extracted, and the region containing high frequency signal was removed as the low-frequency signal region, which was mainly plain and hills. (3) The remaining area is defined as the intermediate frequency signal area, and the geomorphology of the area is dominated by flat hills and small mountains with small relief amplitude. The results show that the geomorphology of Fujian can be divided into seven main types: low frequency plain, low frequency hill, intermediate frequency hill, high frequency hill, low mountain with small degree of relief in middle frequency, low mountain with small degree of relief in high frequency, middle mountain with small degree of relief in high frequency.
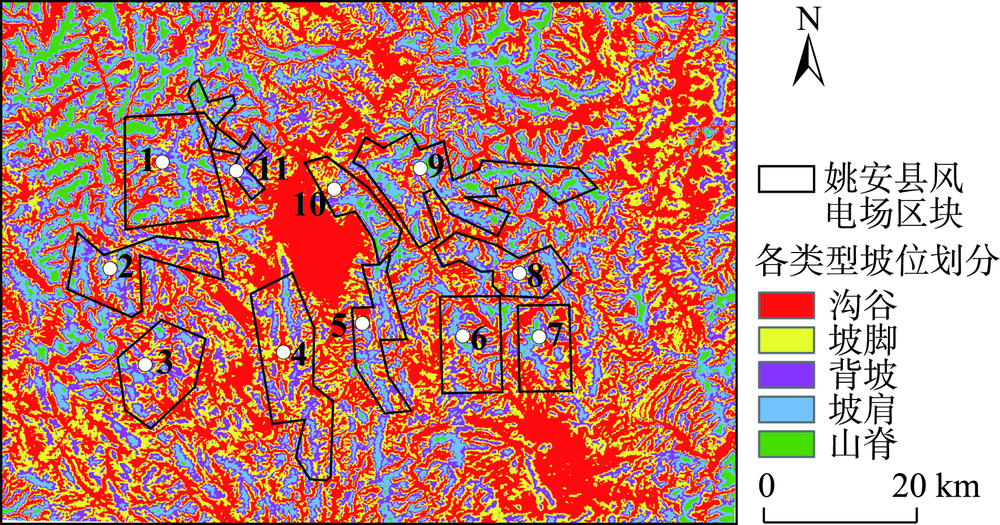
The slope position has generally been applied in a wide range of soil and vegetation studies. The slope position is manually classified in a long history into five types such as valley, footslope, backslope, slope shoulder, and ridge. It leads to issues of low automation, low precision and time consuming. This paper proposed a K-means algorithm of Machine Learning for clustering classification of slope position in mountainous areas. The performance improvements for the conventional K-means algorithm can be achieved by clustering number selection using the Calinski-Harabasz clustering evaluation index and by initial clustering centers finding using K-means++ in the context of slope position detection. The optimized K-means algorithm of a combination of peak area identification through the morphological white top hat transform function was applied into the automatic detection of slope position in Yao'an County, Yunnan Province based on 90 m×90 m SRTM DEM data. In order to validate this algorithm, a series of replicated experiments were carried out with different threshold values. Three accuracy measures of this algorithm such as Calinski-Harabasz clustering evaluation index, Adjusted Rand index and SSE can be estimated for these experiments. The results show that: (1) the best performance of this K-means algorithm is achieved with a clustering number k = 5; (2) this K-means algorithm is significantly better by using K-means++ to select the initial clustering centers than unoptimized selection; (3) the convergence of this K-means algorithm is the best if the iterations iter = 10,000. Furthermore, these results were obtained in a particular suitable window i.e. 25×25, and the window was compared to other two windows, that is, 13×13 and 37×37. An alternative statistical approach is the direct estimation of classification proportions of slope position for the study area, which can be achieved by evaluating point samples of backslope, slope shoulder, and ridge. Automatic mapping results in the planned wind farms are obtained up to 57.13%, which also indicates that the use of the proposed K-means algorithm may further enhance the potential of slope position detection. The advantages of our algorithm seem to lie in the help it gives for the development of automatic clustering classification of slope position as well as simple manipulation in spatial databases. Further improvements are needed in better performances by integrating fuzzy theory into this algorithm, suitable window selection by using the abruptshift analysis approach, as well as more topographic attributions such as slope, profile curvature and plan curvature, which will lead to the development of our algorithm.
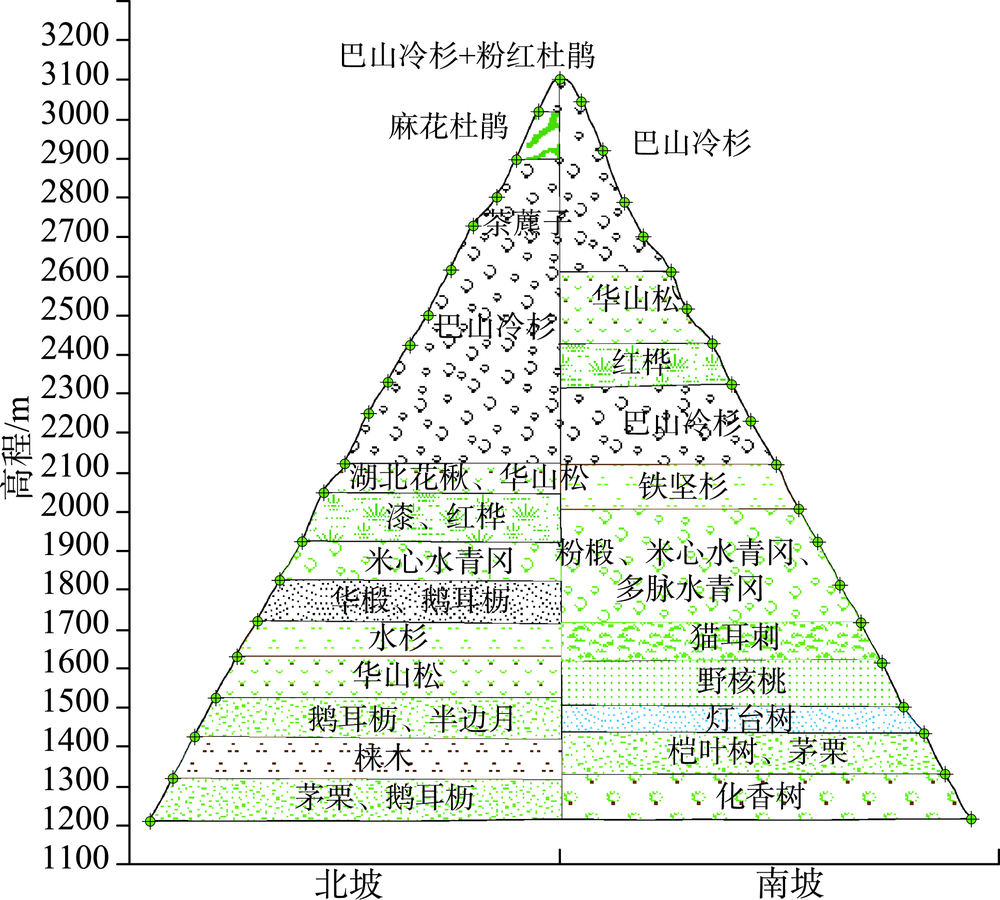
The Shennongjia Forestry District is one of the areas with the highest biodiversity in China. The complex topography exerts great influence on vegetation distribution in this region. This paper used the maximum entropy model (MaxEnt), digital elevation data, vegetation distribution map, and field-surveyed data, to study how the topographic characteristics affect local typical vegetation distributions at two scales, i.e., vegetation type and population levels. The relationship models between vegetation type and topographic factors, and between plant population and topographic factors were established respectively by quantifying the topographic ranges of vegetation types and plant species. Results show that: (1) the spatial distribution of different vegetation types was affected by different topographic factors. The distribution of coniferous forests was affected by elevation and coefficient of variation in elevation, the distribution of broad-leaved forests was controlled by elevation and aspect, and the distribution of shrubs was controlled by aspect and the slope of aspect. The factors affecting the distribution of grasses were various. (2) The elevation ranges of typical plant species were generally consistent with those of vegetation types. Specifically, 90% of coniferous forests were distributed at elevation between 1600 and 2600 m, and the typical populations of Abies fargesii and Pinus armandii were distributed at elevation of 1700~3200 m. 85% of the broad-leaved forests were distributed within the range of 1000 m to 2000 m in elevation, and the typical populations of Cyclobalanopsis glauca, Carpinus turczaninowii concentrated at elevation between1000 to 2000 m. 95% of shrubs occurred at slope of aspect within 0~40 degrees, and the typical populations of Rhododendron simsii and Rosaceae mainly occurred at slope of aspect less than 40 degrees. The relationship models used for vegetation types and plant species were different. The relationship between vegetation types and topographic factors was fitted using Gauss model. While the relationship between typical species and topographic factors was relatively complex, and the distribution patterns of different species were even different. (3) Vegetation distribution showed a rather weak relationship with typical slope characteristic. This study provides a basic reference for vegetation protection, vegetation restoration, and vegetation management in the Shennongjia region.
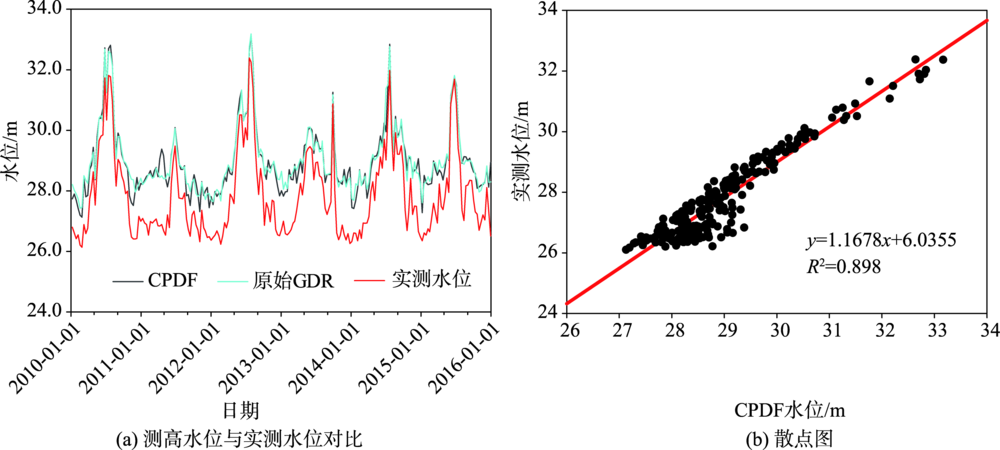
As one of the important characteristics of lakes, lake water level is an important indicator for evaluating the change of lake water storage capacity. As a new remote sensing monitoring technology, satellite altimetry technology has played an increasingly important role in monitoring the dynamic changes of lake waters, and has become an effective means for lake research, water resources investigation and wetland protection. This study took Hongze Lake, Gaoyou Lake and Dongting Lake as examples, using the Centralized Probability Density Function method (CPDF) to improve the accuracy of Jason-2 altimetry data, as well as analyze the correlation of precipitation and water level of each lake. Besides, based on the measured water level data we compared the accuracy of the original GDR data of the Jason-2 altimeter satellite and the satellite data processed by the CPDF method. Results show that: (1) The distribution of Jason-2 original GDR data points is sparse, most of the data are relatively concentrated, and there are certain periodic changes, but the evaluation results show poor accuracy, so the original GDR data cannot be directly used for lake water level monitoring. (2) CPDF method can greatly improve the accuracy of the water level data of the altimeter satellite. The evaluation results of Hongze Lake and Gaoyou Lake show that the RMSE decreased from 1.92m and 1.74m to 0.32 m and 0.36m, and the correlation coefficient increased from 0.28 and 0.04 to 0.85 and 0.72, indicating that Jason-2 altimetry data processed by the CPDF method can achieve higher accuracy in lake water level monitoring. However, it is worth noting that for the lake, which is with narrow north-south widths and large changes in daily water levels (such as Dongting Lake), the accuracy of the raw GDR improved by the CPDF method would be limited. (3) The precipitation of Dongting Lake had the strongest correlation with the water level, followed by Gaoyou Lake,the water level changes of Gaoyou Lake and Dongting Lake lag behind the precipitation by about 1 month and 1-2 months respectively. However, the precipitation of Hongze Lake was not significantly negatively correlated with the water level, which is partly due to the adjustment of water level by the Hongze Lake water conservancy project. This study is of great significance for obtaining lake water level values using altimetry satellites, and then for dynamic monitoring of lakes, especially in filling lake water level data in data-poor areas.
Simulating the surface flow dynamics is of great importance in disaster prevention and mitigation, which could benefit the land remediation, regional planning, environmental protection and water resource management. Therefore, in this paper the Compute-Unified-Device-Architecture (CUDA) is embedded into the TIN-based surface flow dynamic simulation algorithm to get a parallel method for simulating the surface flow discharge. The aim of this study is to rapidly and accurately perform the surface flow dynamic simulation at any position and any time to meet the actual application requirements. First, the proposed algorithm extracts the critical points and drainage network from a high-precision Digital Elevation Model (DEM) to generate a drainage-constrained Triangulated Irregular Network (TIN). Second, the flow direction of each triangular facet over the TIN is calculated by the coordinate data of the triangular facets. Third, the flow path network is traced by the flow direction and rainfall source points. Fourth, the flow velocity of rain dropsover the flow paths is obtained by the flow velocity calculation kernel function based on the manning formula. Finally, by combing the flow velocity with the pre-set time, the algorithm can rapidly simulate the flow discharge at any location by usingthe flow discharge count kernel function. The specific paralle lization process consists of the transmission mode of data, partition model of thread and implement ation of the flow velocity calculation kernel function and flow discharge count kernel function. Data transmission in the paralle lization process includes the input and output of data. It inputs the data of the DEM, rainfall source points and flow path network from the CPU to GPU and outputs the data of the flow discharge calculated by the above two kernel functions from the GPU to CPU. The two kernel functions are parallelized by the flow paths. Each thread handles a single flow path. As a result, flow paths are divided by the partitioning method to obtain numerous thread blocks and the number of the thread in each thread block is allocated by the computing power of the GPU. The Black Brook Watershed (BBW) located in the north-eastern of New Brun swick was selected as the study area. To validate its accuracy and efficiency, the proposed method was compared with TIN-based surface flow dynamic simulation method. The experimental results demonstrate that the proposed algorithm can greatly improve the simulation efficiency while maintaining the accuracy simultaneously and its acceleration ratio can reach up to 11.2. In addition, the parallel algorithm was compared with the Soil and Water Assessment Tool (SWAT) model to verify its precision. The experimental results indicate that the Nash coefficient of the parallel method is increased by 88% and the correlation coefficient is increased by 5%.
The rapid urbanization has constantly changed the transformation of land resources. With rapid growth of economic and population, urbanization has also led to many ecological and environmental problems. Simulating the mechanism of urban expansion and providing early warning of the risk of urban land use change in the future can help to regulate and control urban development. In addition, most urban expansion simulation studies select common drivers and uniform transformation rules for simulation and prediction. Insufficient consideration of spatial heterogeneity increases the simulation error.This paper proposed an urban expansion simulation model based on the geospatial partition and Future Land Use Simulation (FLUS) model for simulating and predicting complex land use change. The model used multiple indicator data for spatial clustering in township streets and grid units, and divided Pearl River Delta into 10 sub-regions. Urban expansion simulation was performed under unpartitioned and partitioned scenarios with geospatial partition results. The simulation results of the urban expansion in the Pearl River Delta from 2005 to 2015 show that the simulation accuracy under the partitioned (FoM=0.2329, increase 9%) scenario is significantly higher than that of the unpartitioned scenario. Land use conversion potentials in different districts display spatial differences. Combining geospatial partition with FLUS model can simulate urban land use change more effectively. The Markov chain model was used to predict the number of future land types. The model was further applied to simulate land use changes in the Pearl River Delta in 2025, 2035 and 2045. Based on the impact of urban expansion on urban form, ecology and intensity, this paper constructed an urban expansion early warning indicator evaluation system to assess the alert of urban expansion. Furthermore, this system can predict the level of urban expansion deterioration and provide a scientific reference for urban development planning and monitoring. Based on the simulated results of land use change between 2025 and 2045, an early warning analysis of urban expansion in Pearl River Delta was conducted at the partition and city level. The results show that the urban expansion of most cities in the region will reach above the middle and heavy level in 2045. Dongguan will always maintain heavy level in the future. Urban expansion in Pearl River Delta is not optimistic. The analysis suggests that strengthening macro-control on urban expansion in Pearl River Delta to alleviate alarm of future urban expansion.
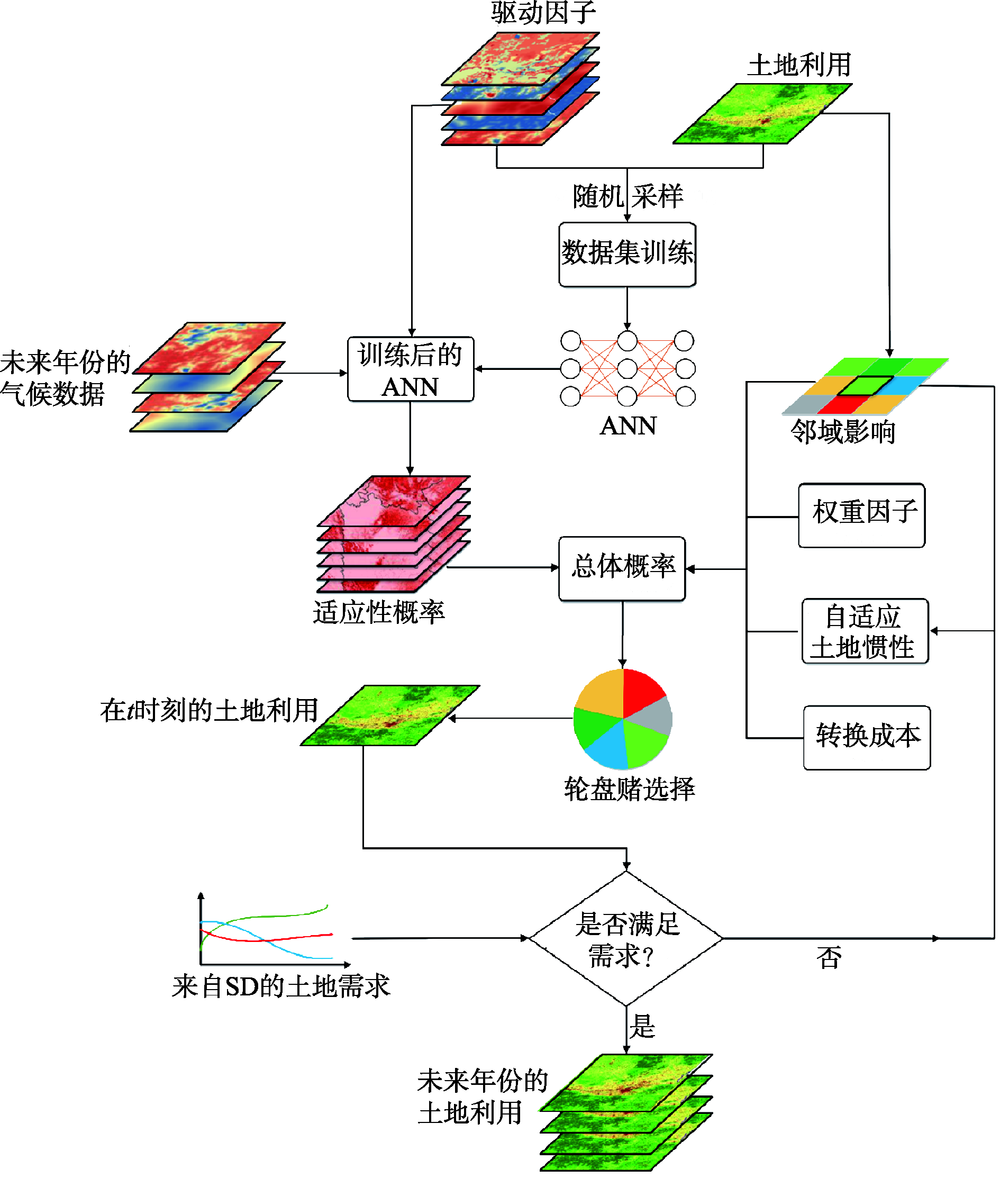
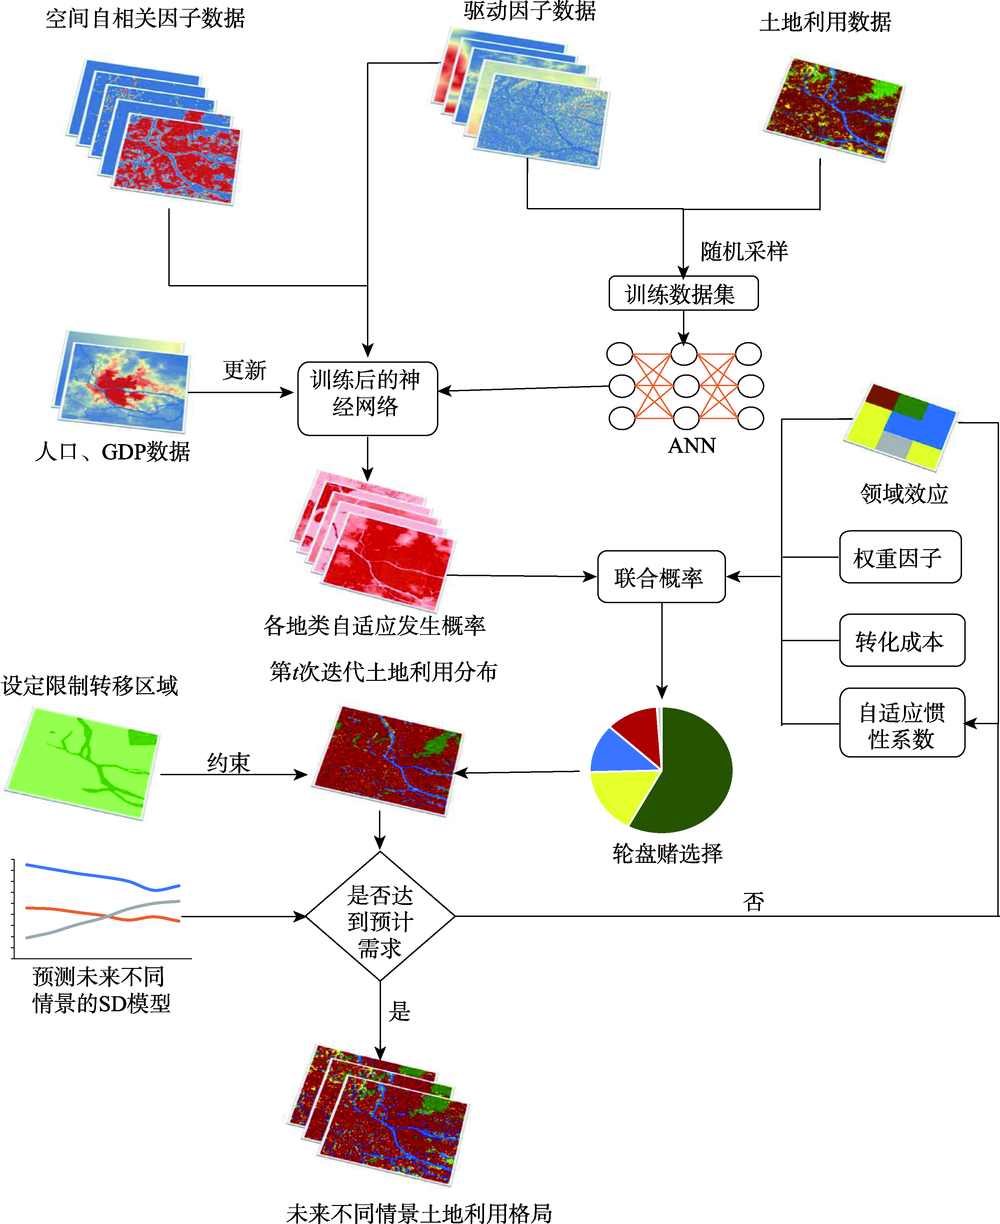
The Future Land Use Simulation (FLUS) model is a new model for simulating multiple land-use changes, and has a broad application prospect. This paper improved the FLUS model by incorporating a spatial autocorrelation factor into the Artificial Neural Network (ANN) module of FLUS, selected thePearl River Delta region as the case study area, and validated the improved FLUS model based on the land use data of 2009 and 2015, as well as a series of driving factors. Three future land-use scenarios in 2035: the baseline scenario, cultivated protection scenario, and ecological protection scenario, were simulated using the improved model. The results showed that: (1) After incorporating the spatial autocorrelation factor, the model had better predictive powerfor the occurrence probability distribution ofeach land use. The ROC values of cultivated land, forestland, water area,construction land, and unused land increased from 0.819, 0.928, 0.885, 0.855, and 0.861 to 0.857, 0.934, 0.890, 0.863 and 0.978, respectively. (2) The simulation accuracy of the improved FLUS model was improved. The Kappa value increased from 0.732 to 0.744, and the FOM value increased from 0.077 to 0.106. (3) The scenario simulation results indicated that under all three scenarios, forestland and construction land would increase, whereas cultivated land would decrease. Apparent differences also existed in the simulated change sizes and locations of each land use type under different scenarios. Under the baseline scenario, construction land would expand rapidly at the expense of a large amount of cultivated land. Under the cultivated land protection scenario, cultivated land area would remain at a reasonable level, the expansion of construction land would alleviate, and the land use layout would tend to be reasonable. Under the ecological protection scenario, cultivated land, forestland, and water area would be well protected, the layout of construction land would be more rational, and the land use sustainability in the study area would be improved significantly.
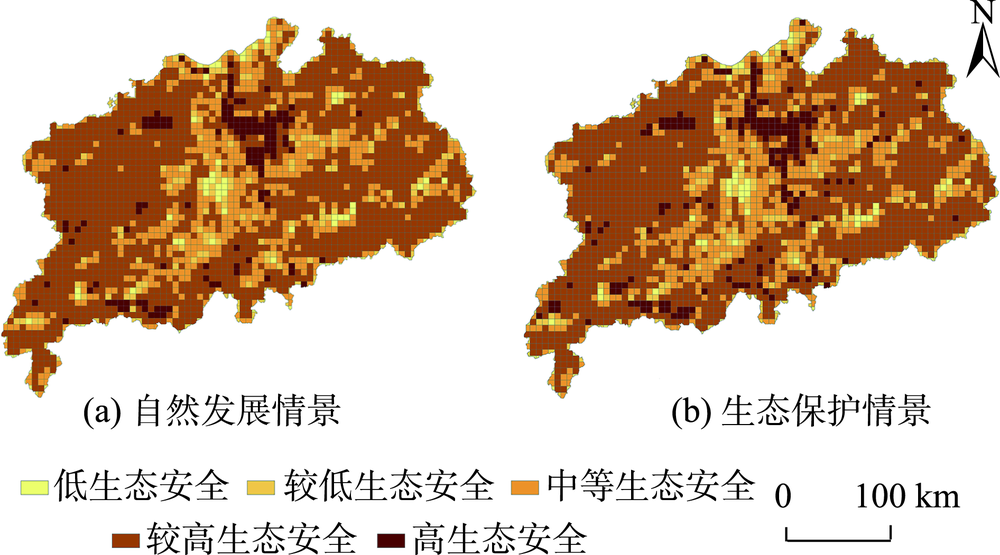
As China has been vigorously promoting the new-type urbanization and implementing spatial planning policies, city clusters have become the urbanization frontier. But the contradiction between economic development and ecological protection restricts the sustainable urbanization. As the basis of urban development, the changes of land quantity and distribution have a significant impact on the structure and functioning of ecosystem. Therefore, land ecological security assessment of city clusters and predicting future land use patterns of city clusters based on such an assessment are crucial to the sustainability of city clusters. The assessment of land ecological security is the basis of the optimal allocation of land resources, and land use simulation is an important method to predict the trend of land use changes. Combination of the two methods can provide reference for optimizing land use patterns and protecting the eco-environment. By studying the city clusters around Poyang Lake, this paper analyzed land ecological security patterns and changes of the city clusters. Based on the results of land ecological security assessment, the paper set up the business-as-usual scenario and the ecological protection scenario. By combining the multinomial logistic regression and Multi-Criteria Evaluation method (MCE), the paper constructed the CA-Markov model to predict land use patterns in 2030 under the two scenarios, and conducted comparative analyses. Results show: (1) In 2005, 2010, and 2015, the average ecological security of the city clusters around Poyang Lake were 0.574, 0.573, and 0.571, respectively. The security level were low in the middle and high in the east and west in the spatial layout. (2) In 2030, the newly developed urban lands under the business-as-usual scenario will mainly occur in Jiujiang, Shangrao, and Nanchang. Under the ecological protection scenario, the lands for constructing towns and other construction purposes will be restricted properly for compact urban growth. (3)Under the ecological protection scenario, the area of high ecological security zones will be 39.39% larger than that under the business-as-usual scenario,and it tends to be distributed more evenly. The ecological security of the city clusters, including areas around Poyang Lake, the central part of Jiujiang, Xinyu and Ji'an, will be effectively protected. It is hoped that the present study can serve as a reference for the land use planning and ecological protection of thecity clusters around Poyang Lake.
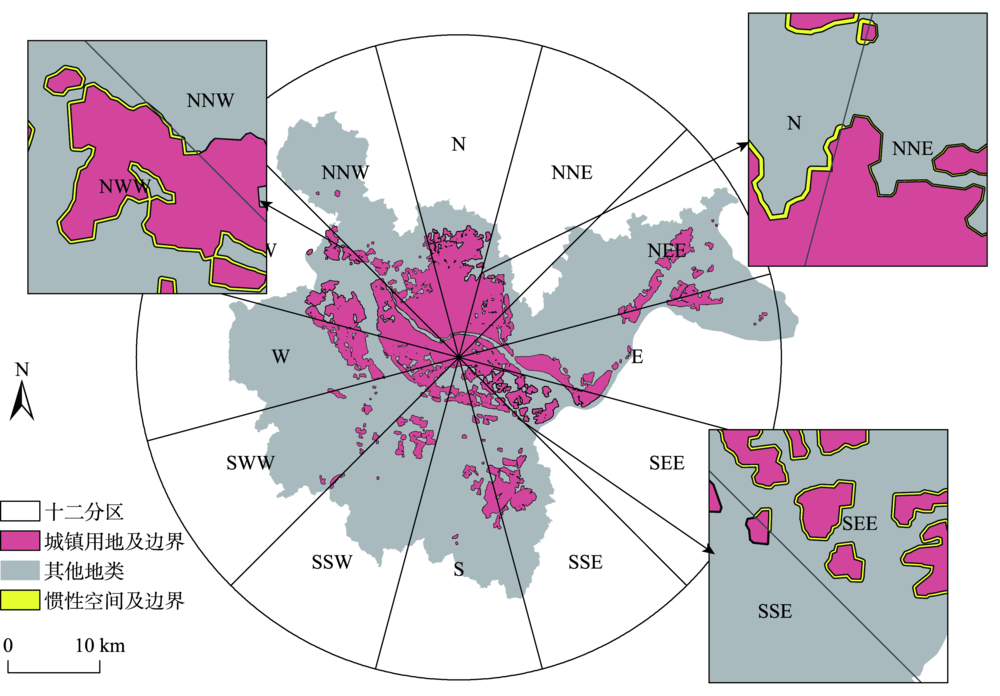
:Delineation of urban growth boundary is an important means to prevent the disorderly spread of urban land, protect the ecological environment of the open space outside the cities, and realize the smart growth of cities, which is of great significance to the healthy and sustainable development of cities. Currently, the studies on urban growth boundary delineation mostly use model method, such as Cellular Automata (CA) model, a relatively mature model, to simulate future urban patterns. However, these studies mostly focuses on the delineation of urban growth boundary. There is little effort on quantitative delineation of the inertia boundary of urban growth. The delineation of inertial boundaries can not only reserve a certain space for urban development, but also improve implementation efficiency in urban planning. Based on this, we proposed a method based on the kinetic energy theorem of the mechanics. The FLUS model and the Morphological Erosion and Dilation method (MED) were used to delineate the urban growth boundary. Slope and land use type were used as the frictional force to delimit the inertial boundary. The FLUS model inherits the Artificial Neural Network (ANN) and the Cellular Automaton(CA) model for simulating and predicting the future urban landscape. The MED was used for the clustering of urban neighborhoods to merge into a single area, while eliminating small but isolated urban plaque. In our paper, we selected Fuzhou, a coastal developed city with obvious changes in recent years, as the study area. We simulated the land use patterns from 2000 to 2015 to verify the accuracy of the model. The overall accuracy of land use simulation in 2015 was 0.9389 and the Kappa coefficient was 0.9165. We further predicted the land use pattern in 2027, and delineated the urban growth boundary and inertia boundary in 2027. Results show that the FLUS model and MED can effectively simulate land use and better fit the growth boundary of urban land use. Using the method of kinetic energy theorem for reference, the inertia boundary of a city can be well delineated according to the expansion resistance in different directions and the expansion intensity in different directions, which provides practical operability and reference values for future study.
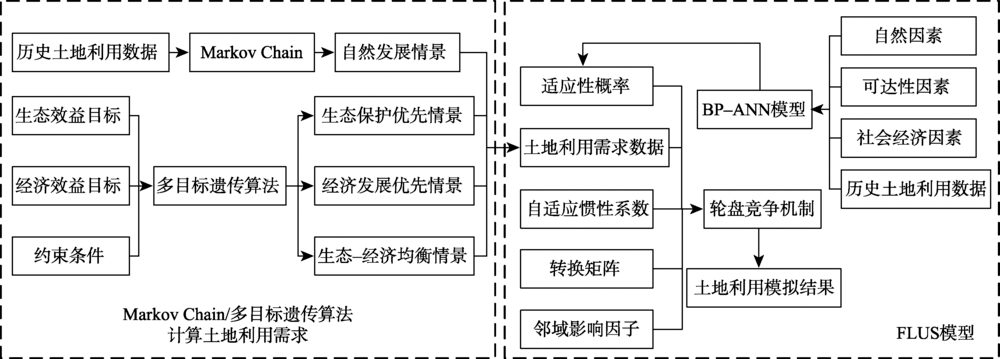
:The ecological environment of the agro-pastoral ecotone in Northwest China is extremely fragile. Due to global warming, the frequent droughts in this region have seriously affected agriculture and animal husbandry, which is not conducive to the sustainable socio-economic development of the agro-pastoral ecotone there. It is the special location and ecological value that determine the region has an important strategic significance in socio-economic development and ecological environment protection in China. The usage of land resources plays an important role in not only the ecological environment, but the socio-economy. Therefore, the purpose of this paper is to achieve ecological environmental protection and economic development by optimizing the allocation of limited land resources in the region. The application of multi-objective genetic algorithm and FLUS model can improve the land use optimization configuration from many aspects (i.e., quantitative structure, spatial distribution, comprehensive benefits). In addition, the combination of the genetic algorithm and multi-objective programming model can provide more alternative options for it. In this paper, the multi-objective genetic algorithm and FLUS model are used to simulate the land use change of the region in 2025. By setting up four scenarios (i.e., natural development, ecological protection priority, economic development priority and eco-economic equilibrium), we explore how to optimize land use allocation on the condition of considering both the protection of ecological environment and the development of social economy. The results suggest that the eco-economic equilibrium optimization scheme shows great advantages in both the quantitative structure and spatial distribution of land use types, and its comprehensive benefits are superior to the other three scenarios. On the premise of reasonably limiting the speed of economic development, this scenario has enabled the ecological construction to develop at stable speed. Its economic benefits have increased by 8.96% compared with those under the ecological protection priority scenario, and its ecological benefits have increased by 0.77% compared with those under the economic development priority scenario. The scenario achieves the coordination between ecological protection and economic development.The eco-economic equilibrium optimization scheme has shown great potential in many aspects, such as promoting the development of unused land, assisting in the adjustment of land use structure, and driving the optimization of industrial structure. The optimal allocation of land use provides decision-making assistance for the future ecological environment construction and economic development planning of the agro-pastoral ecotone in this region. In addition, to solve the contradiction between economic development and ecological construction in the agro-pastoral ecotone, the government should strictly co-ordinate arrangements for various types of land, while enhancing the comprehensive utilization of land resources.
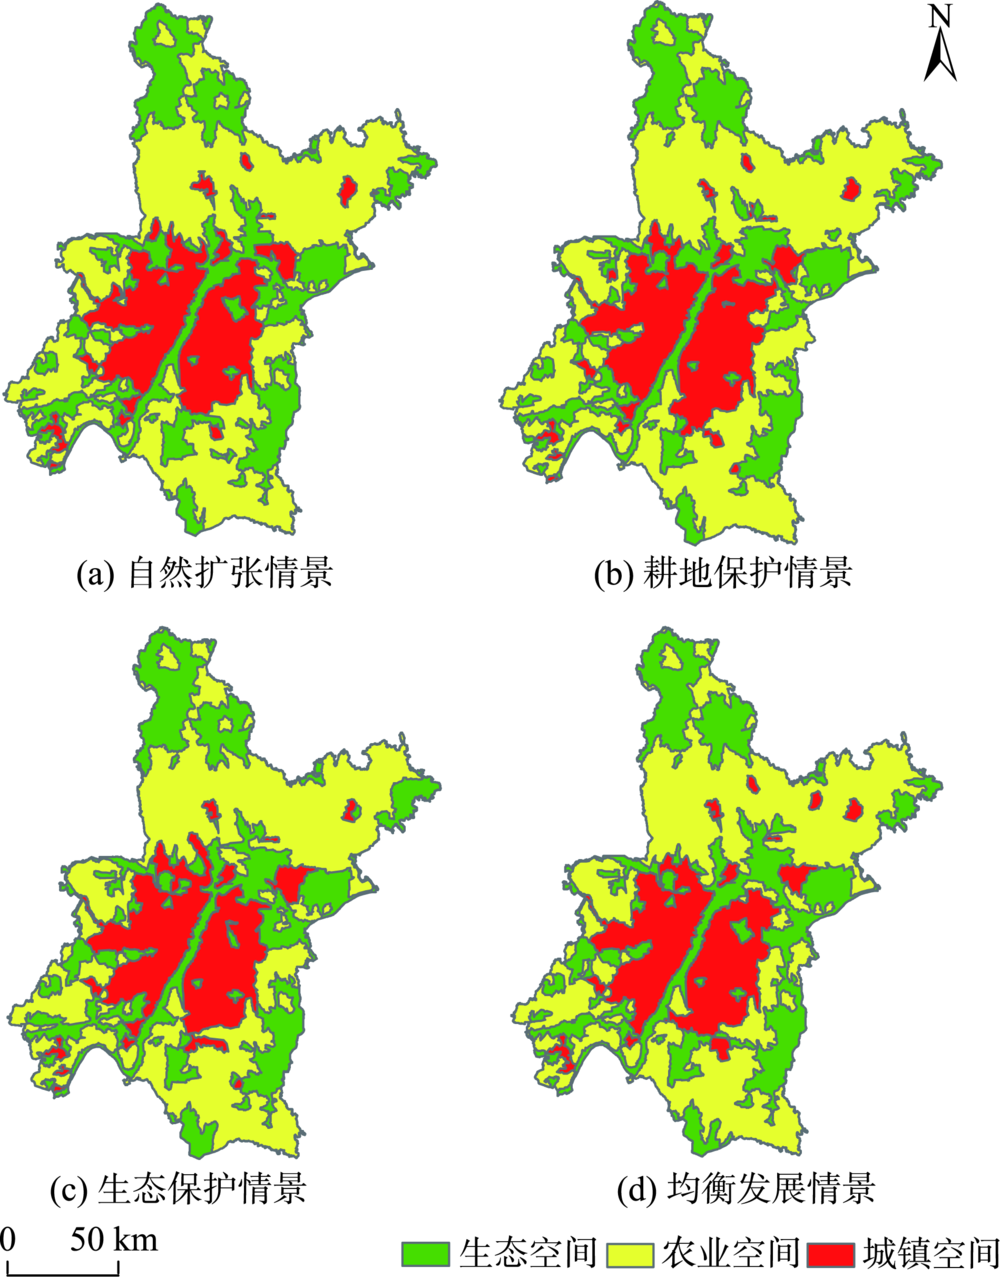
The urban-agricultural-ecological space zoning (referred to as the "three zones") is the core content of land space planning. It is important for scientific and rational planning and using of limited land resources. The former researches set up various indicator systems for "three zones", mainly based on the current regional land use and socio-economic development status. But they rarely incorporate future land use changes into the "three-zone" delineation process, making the results less forward-looking in guiding practice. To make up the gap of current research, we propose a new "three zones" delineation method in this paper. It is based on the simulation of land use scenarios and combines the advantages of indicator system and decision tree data mining, which is different from the traditional method of "indicator system - weighted comprehensive value". This paper selected Wuhan as the research area, and used this method to explore the spatial differences of the "three zones" under different land use scenarios in the future. We simulated four land use scenarios of Wuhan in 2035 (Natural development scenario, Farmland protection scenario, Ecological protection scenario and Balance development scenario) based on the land use of Wuhan in 2015. After that, we combined the constructed indicator system and multiple textual references to select typical samples for decision tree training. Then using the classification rule set generated by the decision tree (86.4% average accuracy) to identify the "three zones" spatial categories of the research units. Finally, we obtained the "three zones" distribution under different land use scenarios. Compared with the similar former researches, the method proposed in this article is more reasonable and feasible and can be used in specific research and practice. Besides, we found that: (1) there are obvious differences in the area, spatial distribution and main change types of the "three zones" caused by different land use scenarios. So, it is indeed necessary to incorporate future land-use changes into the "three zones" delineation process. (2) The spatial distribution of "three zones" in different land use scenarios shows similar characteristics. The differences in spatial distribution of "three zones" in different land use scenarios are mainly the border area where the main land use function changes. Therefore, these areas are the key areas that land space planning should focus on.
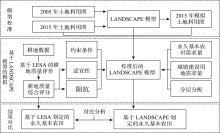
Demarcating permanent prime farmland is an effective way to realize farmland protection, intensive land use and food security. With the challenging of rapid urban expansion, the completion between urban expansion and farmland protection is unavoidable. It is urgent to reasonably demarcating permanent prime farmland by synergizing farmland protection and urban expansion. In view of this conflict, taking Wuhan as an example, this paper carries out the demarcation of permanent prime farmland by using LESA (Land Evaluation and Site Assessment) method and LANDSCAPE ( LAND System Cellular Automata model for Potential Effects) model, attempting to achieve balanced development of urban expansion and farmland protection, which provides reference for scientific demarcation of permanent prime farmland under the background of multiplanning integration, and provides support for prime farmland protection and optimizing of land allocation. Firstly, comprehensive evaluation and classification of farmland in Wuhan is carried out through LESA, then based on this result, simulation of demarcation of permanent prime farmland and urban expansion is carried out through LANDSCAPE model, at last, the results of the two methods are compared in quantity, quality and spatial patterns. The results show that permanent prime farmlands demarcated in two methods have little difference in quantity and quality. The area of permanent prime farmland demarcated by LESA method is 243 259 hm 2, 45.63% of which land fertility grade of cultivated land is between grade 1 and grade 3. The area of permanent prime farmland demarcated by LANDSCAPE model is 243 200 hm 2, 45.77% of which land fertility grade of cultivated land is between grade 1 and grade 3. There are more than 80% of the permanent prime farmland that land fertility grade is between grade 1 and grade 5 in both methods, which shows that the total quality of permanent prime farmland is good in either method. However, the result of LANDSCAPE model is better in spatial patterns, which permanent prime farmland demarcated by LANDSCAPE model distributes concentrated and is regular in shape. It's remarkable that 15.8% of permanent prime farmlands demarcated by LESA are overlapped by urban constructive land in the processing of urban expansion, which has been effectively avoided by LANDSCAPE model. The possible cause of this conflict are as follows: (1) The permanent prime farmland demarcated by LESA method is based on ranking of integrated score, in which the requirements for concentrated fragmentation and shape index of permanent prime farmland are not considered; (2) The conflict of farmland protection and urban expansion is not considered in LESA method.
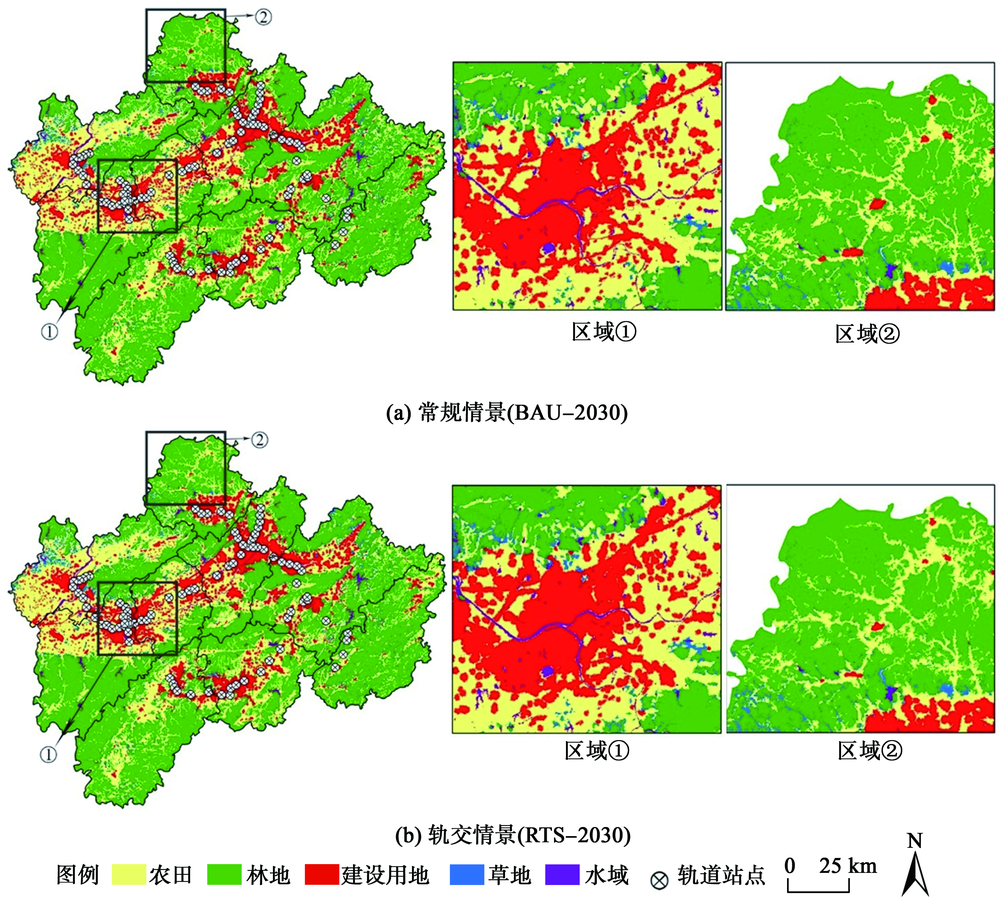
Urban rail transit possesses significant impacts on land use change and urban development. This study applies Future Land Use Simulation Model (FLUS) to reproduce land use changefrom 2000 to 2010 in the Mid-Zhejiang urban agglomeration based on GlobeLand30 datasets. The simulation results in 2010 show that the FLUS model can reproduced a realistic land use pattern with an overall accuracy of 89.74% and FOM 29.86%. A Markov chain is then used to predict the total land demand in 2030 for predicting future land use scenarios. We design two scenarios: the scenario of business-as-usual (BAU-scenario) and the scenario based on planned urban rail transit sites (RTS-scenario). Within 5 km from the urban rail transit, the RTS-scenario yields a significant effect on built-up areas with an increasing expansion intensity, where the newly built-up areas are allocated in the suburb sand are greater than that produced by BAU-scenario by 45.25 km 2.The newly built-up cells mainly occupy high-quality farmland. The farmland transformed to built-up area is higher in RTS-scenario than in BAU-scenario by 33.34 km 2.We categorize the built-up expansion intensity (BUI) into five levels: lowest, low, medium, high and highest. The BUI for RTS-scenario is higher than that for BAU-scenario because the former’s proportion of expansion intensity above the lowest level is 3.70% greater than of latter. Spatial patterns for forest, grassland and water are similar between both scenarios. This study not only indicates that FLUS can be used to capture land use change and predict future scenarios, but also helps to examine the effects of urban rail transit site plansin the Mid-Zhejiang urban agglomeration.
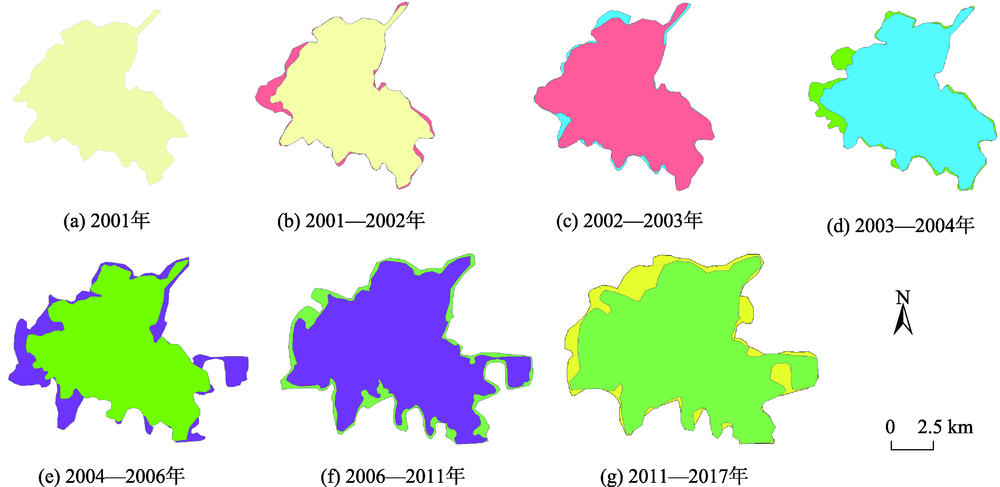
Urban Expansion (UE) is a critical parameter to examine urbanization level. In fact, UE is often accompanied with people, strategies, and urban elements extending over the old edge of city. Hence, UE is a highly complex socioeconomic phenomenon. Dynamic models are very effective to reveal the features and mechanisms of UE. In particular, Cellular Automata (CA) is one of the kinetic models to simulate the natural evolution process and famous for its broad range of applications. A large amount of research findings argue that CA is one of the most potential tools to understand UE. In this study, a multi-factor restricted expansion simulation model of CA (MCES-CA) was proposed according to CA's main features and the main influencing elements of UE. This paper took a middle-zone city named Hengyang City as the case study area. Hengyang City is located in southern Hunan Province of China, and has been positioning to develop into the regional central city of southern Hunan. Hence, it is high significant to reveal the main features and mechanisms of Hengyang City's expansion based on MCES-CA. Firstly, we downloaded LANDSAT images and ASTER DEMs through the internet, and collected Hengyang City's Planning datasets from the Planning Burau of Hengyang Government. Next, we developed the MCES-CA model by the Model Builder Tools of ArcGIS. Then, we ran it to observe the entire expansion process of Hengyang City from 2001 to 2017. We employed the Expanding Intensity Index (EII) and Expanding Velocity Index (EVI) to assess the MCES-CA model. Results show: (1) Hengyang City presented different expansion directions in different ages. (2) The spatial expansion process of Hengyang City was composed of two main stages. (3) The main factors of shaping the expansion process of Hengyang City were geo-environments and development planning. (4) The simulation results were in accordance with the real states of Hengyang's UE. Our findings suggest that MCES-CA is a potentially popular tool to capture the EU processes of cities because it is easy to build and complete. For future research, we can improve the simulation accuracy of MCES-CA by refining transformation rules.
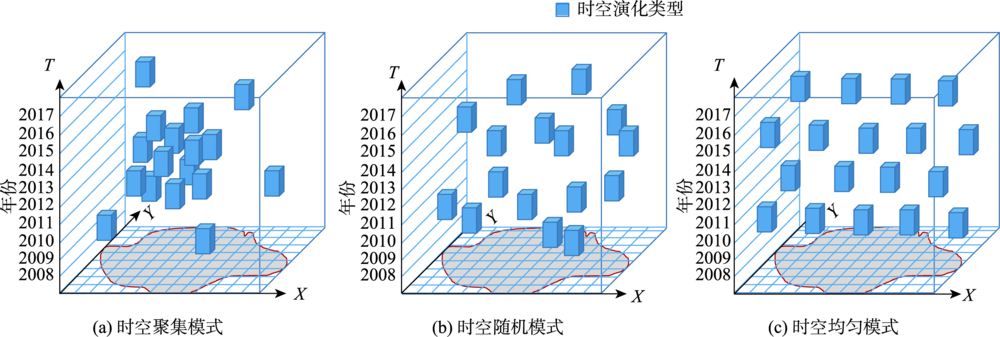
Due to human activities and rapid urban expansion, land use/land cover has changed dramatically. The change has a great impact on the ecological environment and surface landscape. The change process of land use and cover change is not only affected by various factors such as nature and economy, but also an external representation restricted by the laws of human activities and natural factors. Therefore, it is of vital significance to study the change process of land use and land cover. For the monitoring and analysis of land use and cover change, the traditional method focuses on the study of the overall differences in land use structure in each spatiotemporal snapshot. This method cuts off the organic connection of land use units in the evolution process between different snapshots. Traditional research has the phenomenon of paying attention to pattern but neglecting process and emphasizing simulation but despising measurement. This paper takes the land change process composed of serial land use data as the core research object. The advantage of this is that the relevant land evolution units at different time snapshots can be considered as a unified whole. On this basis, this paper chooses the nearest spatiotemporal distance to measure the spatiotemporal agglomeration of the land use change process. First, through multiple experiments, the appropriate space-time grid was selected to segment the land use/land cover data in the study area. Secondly, based on the analysis, the typical land use change process was extracted. And then, for the land use change process object on the space-time cube, calculate the average nearest-neighbor spatiotemporal distance. The distance is compared with the distance value in the random mode based on Monte Carlo simulation, so as to judge the spatiotemporal aggregation of the land use change process in the study area. Finally, the results were tested for statistical significance. The land use data of Huainan mining area from 2008 to 2017 was used for empirical research. The land use evolution process from cultivated land to grassland in any two years was selected as a typical spatiotemporal evolution type. The results show that this type of land change in the study area has exhibited a spatiotemporal aggregation pattern in the past 10 years, but the pattern is not statistically significant. The research in this paper is helpful for grasping the evolution process of land use units in space and time, and to explore the potential spatiotemporal evolution patterns in the process of land use change.
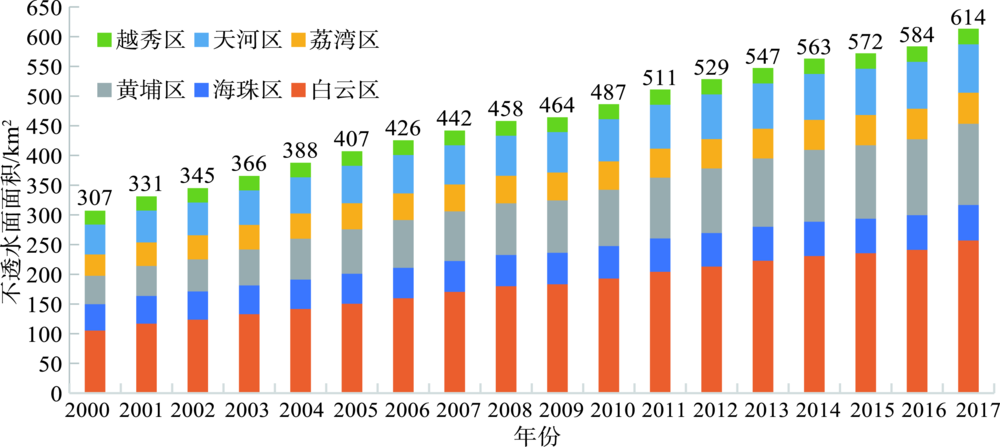
For assessing urbanization level and urban environment, the mapping of impervious surface has become a research hotspot. Compared with single-phase imagery, time series mapping can depict temporal trends, which is of great significance for monitoring urban expansion. Based on the Google Earth Engine platform, this paper calculated BCI and NDVI using Landsat TOA data from 2000 to 2017, and determined their thresholds by an adaptive iteration method to extract the initial impervious surface. Then, Temporal Consistency Check (TCC) was performed to make the time series of impervious surface more reasonable. Results show that: (1) Adding NDVI to both BCI and TCC improved the quality of impervious surface mapping. (2) The average accuracy of impervious surface mapping in this paper was 90.4%, and the average Kappa coefficient was 0.812. (3) The impervious surface area of Guangzhou downtown nearly doubled from 2000 to 2017 with a decreasing growth rate. (4)The newly developed impervious surface mainly concentrated on the relatively backward outskirts of Guangzhou downtown. (5) Elevation, road density, and shopping mart density were the main factors influencing the expansion of impervious surface.