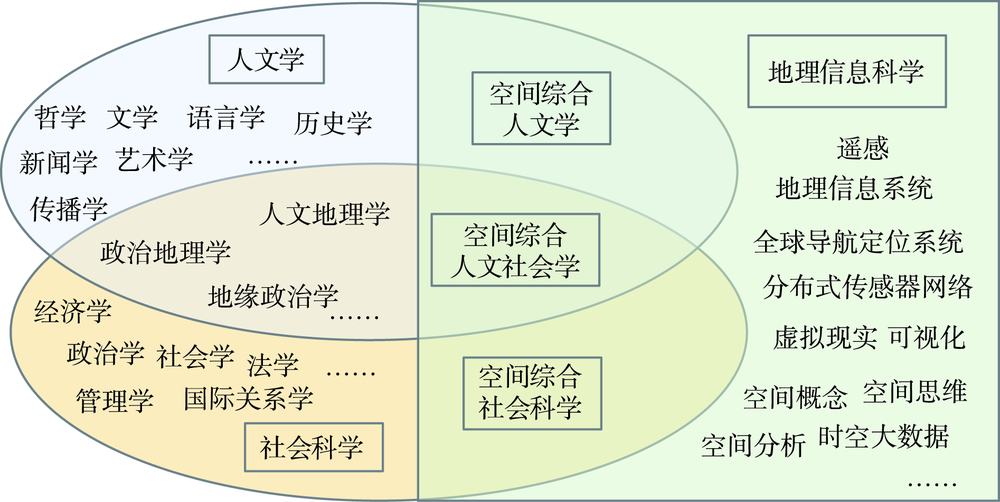
Humanities and social sciences are undergoing the transformation of quantification and spatialization. The Geographical Information Science (GIS), with powerful functions of spatial data management, spatial analysis and geo-visualization, has been widely used in humanities and social sciences in the era of big data, resulting in an emerging inter-disciplinary field that is Spatial Integrated Humanities and Social Sciences (SIHSS). SIHSS can provide new comprehensive solutions to practical problems that are difficult to solve in a single discipline. Since the first forum on spatially integrated humanities and social sciences was held at the Chinese University of Hong Kong in 2009, this new inter-discipline has developed vigorously and achieved significant progress. We comprehensively summarized the progress of this new field on the tenth forum, held at Wuhan University in 2019. GIS has been fully integrated with humanities and social sciences, including philosophy, history, literature, art, sociology, economics, politics, and management science. On the one hand, scholars and experts in the field of GIS are actively expanding their research fields to provide spatial and visualization technologies for scholars in fields of humanities and social sciences. On the other hand, scholars in fields of humanities and social sciences are actively learning GIS technologies and bringing spatial thinking into their research. Meanwhile, some open platforms, codes, and tools customized for scholars in fields of humanities and social sciences are constantly emerging. In this paper, based on a comprehensive summary of the recent progress of SIHSS, we first investigated the thought and framework of the research on SIHSS, and then introduced the progress in each detailed direction of SIHSS, including history integrated GIS, literature integrated GIS, linguistics integrated GIS, GIS and philosophy, human dynamics, human geography, politics GIS and, GIS and management science, spatial econometrics, geo-computation for social science, spatial social networks and spatial interaction networks, geography of crime, geography of public health, etc. We also summarized methodologies for the research on SIHSS, including spatial thinking, cognitive psychology and spatial cognition, spatial visualization and virtual geographic analysis, and GIS platform development, etc. Finally, we proposed research directions of SIHSS in the future, including further improving the research framework and developing new methods of SIHSS, combining perspectives of map, data, spatial analysis and visualization, developing online platforms and promoting open data and open source tools, further expanding the application of GIS in humanities and social sciences, and strengthening education and training on SIHSS. We conclude that GIS is about to play an increasingly important role in humanities and social sciences and SHISS will also achieve greater advancement and achievement.
Historical Geographical Information System and Science (HGIS) is a new interdiscipline subject between Geographical Information System (GIS) and History. The geographical process in historical period has been studied quantitatively and the geographical process model is built accordingly through HGIS to provide research basis on which to make future-oriented scientific predictions, by combining the technical methods of GIS, the space perspective of geographers, and the time perspective of historians together organically. HGIS emerged in the mid-1990s and has been bringing opportunities and dynamism to the development of GIS, History, and Historical Geography. HGIS maintains a sound momentum of growth, meanwhile there are some unresolved issues with it. In recent years, HGIS is overcoming systematic technical obstacles and developing in the direction of science, offering increasingly rich HGIS service. This article reviews the generation progress and the early practice of HGIS, andthen summarizes the current research status of HGIS from five aspects: digitization, data model, database and its system, spatial analysis, and visualization, by combing and analyzing the related literatures at home and abroad. In the last part of this article, the trends of HGIS are analyzed and summarized from several aspects: the spatialization and digitization of historical data, historical geographical spatio-temporal big data, the construction of historical geo-spatial framework and its service, the research on historical geographical spatio-temporal process and the construction of its model, and the formation of the discipline system of historical geographical information science and technology. These trends provide new research ideas for the future of HGIS.
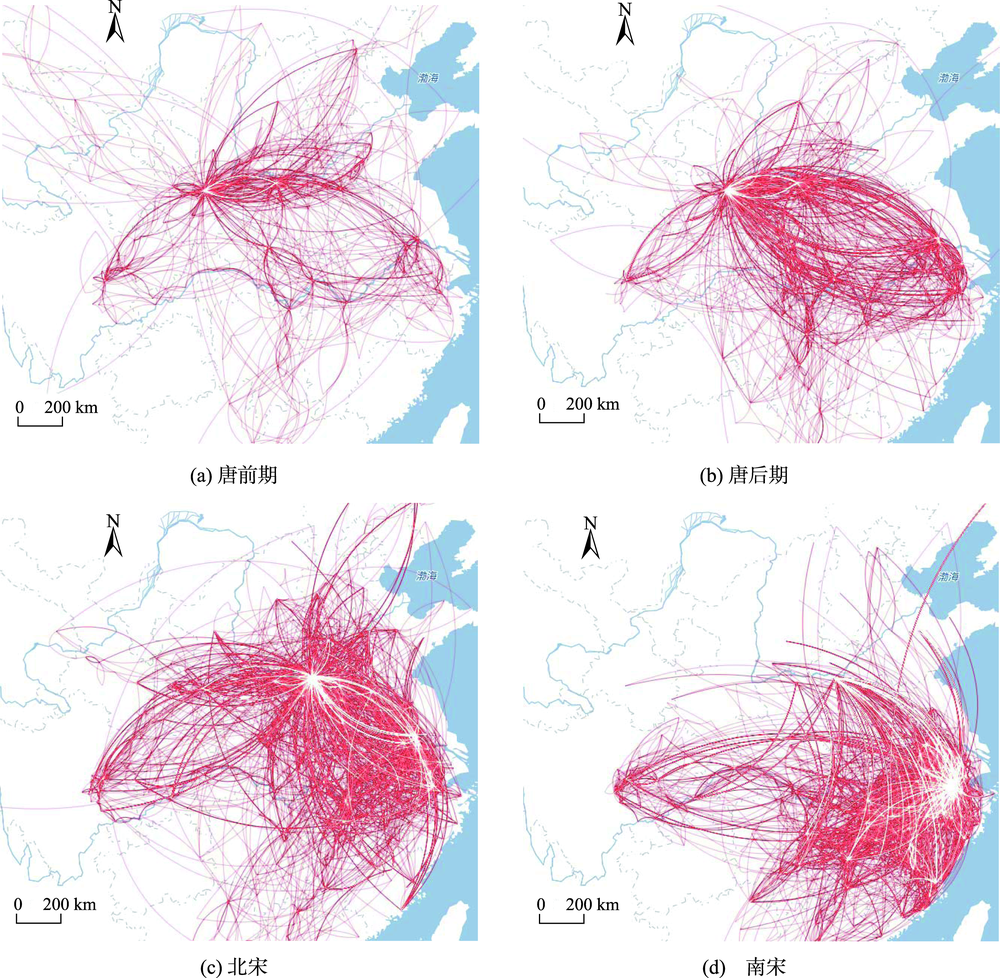
Chinese historical culture has always been a hot topic in Chinese literature research. Most researches are based on the literary works themselves or individual litterateur' characteristics, which are lack of the support of big data about ancient litterateurs' behaviors. The historical development is created by the groups of the individuals, and ancient literati's behaviors potentially influenced and determined the distributions and transitions of ancient culture in the field of cultural geography. This paper proposed a method of big data analysis based on literati's locations and aggregations of literati movements, and demonstrated the changes of the cultural-center cities in Chinese history based on the literati's footprint data in the Tang and Song Dynasties. The opinions about three transitions of Chinese historical cultural center in cultural geography are basically built on qualitative analysis and on the inference of three historical battles, which is short of valid ancient cultural data to validate. This paper tried to examine and demonstrate the opinions based on data science, information science, and GIS analysis techniques. Records about 110 000 footprint data of more than 300 important literati in the Tang and Song Dynasties were collected from the relatedcultural works and literatures, and the paper used location-linked technology in GIS field to form trajectories, and constructed the literati migration network map. The spatialized PageRank algorithm was adopted to calculate the Chinese cities' cultural attractions and their ranks, which visualized the literati aggregation center in different eras and plotted the cultural-center cities of the Tang and Song Dynasties using heat maps. At the same time, quantitative descriptions of the cities' cultural attractions and geographic distributions and changes of different cities in Tang and Song Dynasties were illustrated by maps and tables in this paper. To demonstrate the transition of Chinese historical culture center, the paper summarized the cities' cultural attractions in the Tang and Song Dynasties by the interval of 20 years, and reshaped the change curve to visualize the comparisons and changes of culture weights about south and north in historical china over time. Then, this paper scientifically demonstrated the two latter times of the three cultural movements of the Chinese cultural center from the perspective of data science by quantitative analysis and graphic visualization. It was found that the southward movement of the Chinese cultural center was completed as early as the NanSong Dynasty. This paper also analyzed the formation of the cultural-central city and analyzed the possible factors of the cultural-center southward movement with the historical contexts.
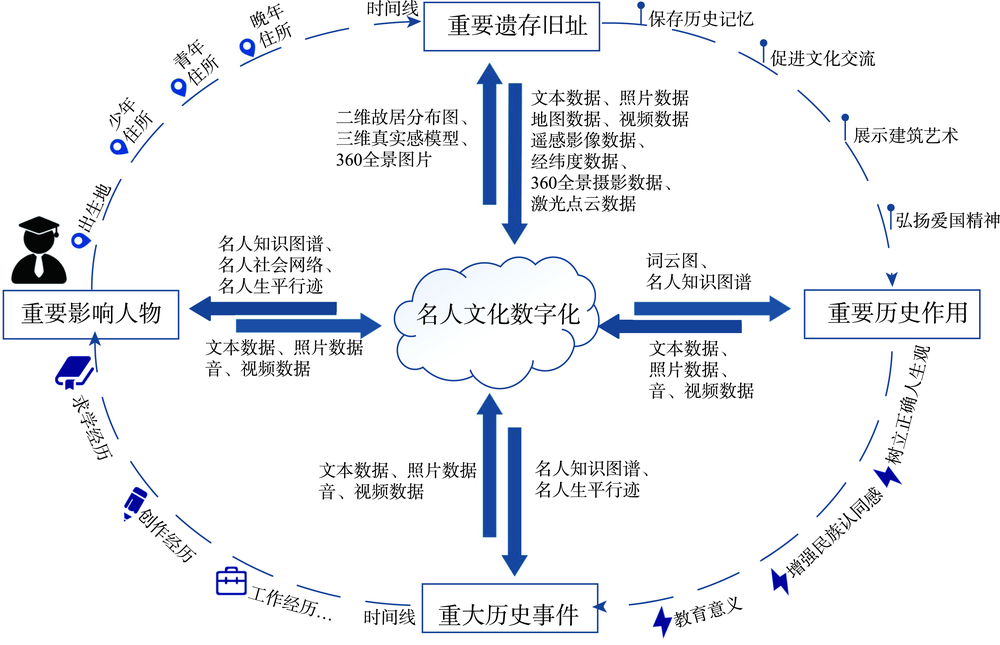
Historical celebrities are the creators and inheritors of outstanding Chinese culture in thousands of years. The spread of historical celebrity culture is of great educational value. The “MinGuo QingLiu” is an outstanding part of celebrity culture. However, most of the descriptions about it exist in literary works, such as pan-literary narratives and stories, lacking systematic collection of celebrity cultural theme data, i.e., celebrity sites, life trajectory, and social relationship. Based on the heterogeneous celebrity cultural data, this paper constructs a digital framework of celebrity culture, and takes "MinGuo QingLiu" as an example to solve the problem of the organization and visualization of celebrity cultural data. Based on the digital celebrity culture framework, text mining can be used to extract hidden information from group biographies, and dynamic display of celebrities' two-dimensional life trajectory, three-dimensional former residence locations, and celebrity knowledge graph is performed to realize intelligent query analysis of related information. The results of the visual analysis reveal changes incelebrity groups' central figures and gathering places, social relationship, the degree of intimacy between celebrities, and the reasons for the intersection. Thus, the proposed method not only allows ordinary people to understand the characteristics of the "MinGuo QingLiu" intuitively and multi-dimensionally, but also helps literary researchers to deeply analyze the life and social relationships of characters, and to develop new models for inheriting and promoting celebrity theme culture.
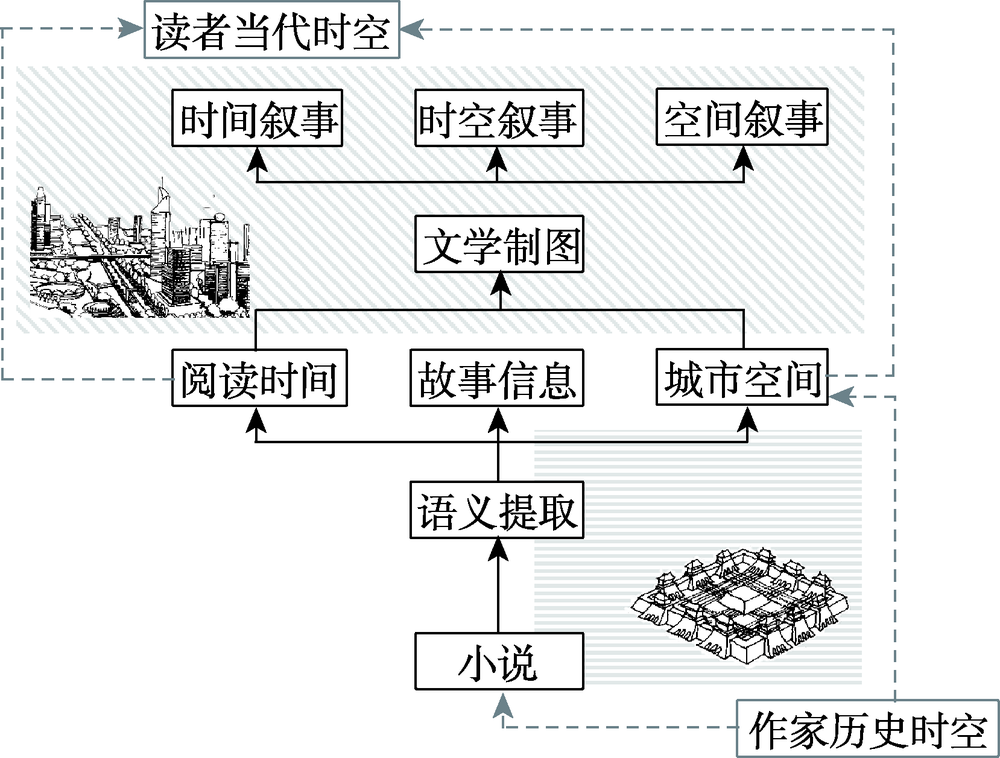
Literary cartography enables the representation of literary space and the mapping between diachronic text and synchronic space. It serves as an 'ancillary science' in literary geography methodologies. Previous cartographic practices usually focus on either of these two items rather than considering text and space as an interactive entirety. In order to reconstruct the traditional relationship between linear narrative and juxtaposed space in Chinese classical narrative literature, this paper proposes a framework of digital models integrating theories of spatial narrative and methods from literary cartography, computational narratology, and geo-narrative, and consequently reveals the spatio-temporal narrative of a Chinese classical novel, The Tale of Li Wa, which is about a love story happening in the capital Chang'an of Tang Dynasty (618-907 AD) and has been diversely interpreted by literary critics and historians since approximately 900 years ago. The framework is inspired by M.M. Bakhtin's chronotope concept which highlights the context of narrative, Gabriel Zoran's topographical-chronotopic-textual space which emphasizes the fictional literature space as a reconstruction process involving readers, and W.J.T. Mitchell's spatial metaphor focusing on "a spatial apprehension of the work as a system for generating meaning". This Time-Space-time-Space framework enables varied structured semantics (including the spatio-temporal information) semi-manually derived from the novel's text and its necessary historical context, as the lack of mature natural language processing tools for ancient Chinese. These value-added structured semantics are then extracted and fused to map the instantaneous spatial pattern perceived by readers in the flow of reading time through data visualization, computational social science, and spatial analysis. The organized spatio-temporal representations of The Tale of Li Wa can help re-understand this classical narrative and its social context of Tang Chang’an city in a situational, vague, and explanatory approach. The Time-Space-time-Space framework, along with the new practice on literary cartography, embeds linearity, experience, and significance of the narrative in an open and dialogic field. It also provides a potential of narrating the place and reading the narrative from both "macro-micro" and immersive perspective.
The trajectory of historical celebrities reflects the historical and cultural background at their time. Through the spatial visualization and analysis of the trajectory of historical celebrities, the historical and social status can be explored and analyzed. The visualization and analysis of the social network of historical celebrities is conducive to the analysis of the political background and the relationship between the characters at that time.However, there are limited GIS based analysis tools for humanities and social sciences and historical celebrities analysis. Most of the current studies to investigate the social network of the historical celebrities only analyze the social network within a certain time period, and fail to conduct a time-division study on the geographical location of social relationships. Taking Xuan Zang and Ouyang Xiu as examples, this paper explores the visualization method of historical celebrities' trajectories based on WebGIS, analyzes the spatial distribution of historical celebrities' trajectory points based on kernel density estimation and standard deviation ellipse, and constructs the spatial social network of historical celebrities at multiple time stages. Finally, this paper analyzes the social network of historical celebrities with their historical background,stories, works, and spatial results.We find that: (1) The migration trajectories of historical celebrities are basically consistent with the migration trend at that time, which is greatly affected by social changes; (2) Historical celebrities had a larger social network circle when they were in power, while the social network circle was greatly reduced at their downfall. This paper explores the methods of spatial visualization and the analysis of the trajectories of historical celebrities, which can be referred for the analysis of spatially integrated humanities and social science.

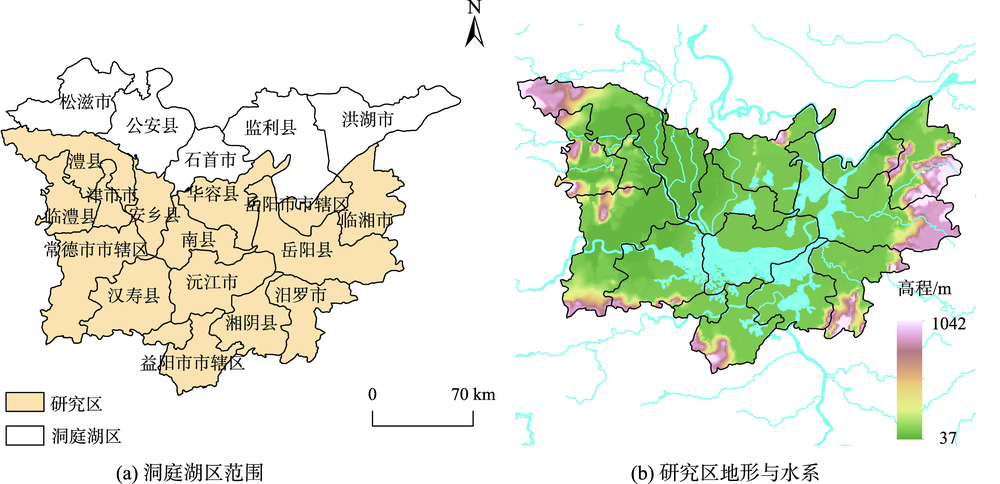
Land cover change is an important factor affecting the climate system and has important research significance in global climate change researches. Gridded historical land use data have been widely used in various global change models. This study used the military topographic map of the Republic of China as the basic data source and modern administrative divisions as the base map, to reconstruct the spatial distribution of croplands in the Dongting Lake district of Hunan during the period of Republic of China. To compare with the HYDE 3.1 data, the cropland data were constructed at a spatial resolution of 10 km×10 km. Results show that: (1) the total area of croplands in Dongting Lake district during the period of Republic of China was about 11432.01 km 2, accounting for 44% of the study area. The area of croplands in Hanshou, Huarong, Ding cheng, and Li xian, was the largest, dominated by dike farmland. Linli, Miluo, and Yueyang had less croplands, which were mainly non-dike cultivated land; (2) the land reclamation rate of Dongting Lake district during this period was large, with the maximum value greater than 90%. High reclamation areas with reclamation rate >40% accounted for 61%, and mainly occurred in the river estuary regions or alluvial plain. Low reclamation areas with <=40% accounted for 39%, and mainly distributed in the hilly landscape area; (3) compared to the HYDE 3.1 dataset, the error of constructed cropland area within a grid (10 km×10 km) greater than 40% accounted for 17%, which was mainly affected by the distribution of rivers. The reconstruction area in the HYDE 3.1 dataset was relatively large. It was difficult to consider the distribution of water systems in a small area, which leads to a relatively low reconstruction accuracy in the Dongting Lake district of Hunan. This paper uses the measured maps of the Republic of China to reconstruct the spatial distribution of croplands in the embankment area of the Dongting lake during this period, which provides basic data for land use and regional sustainable development in the lake area.
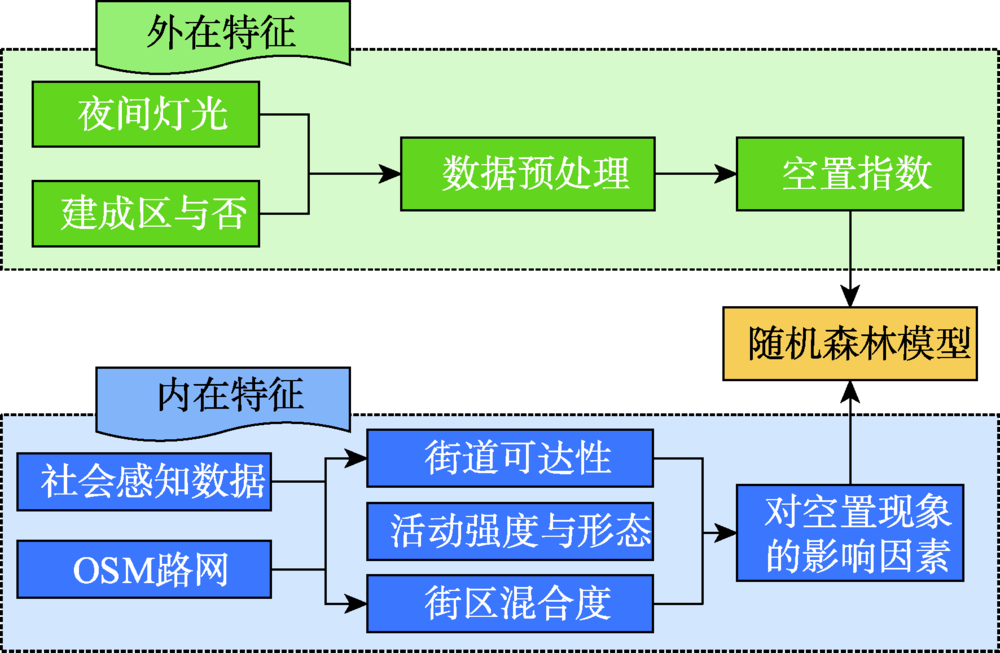
With the rapid construction of urban areas, it is necessary to make assessment of the built-up areas. As the city develops and expands, many of the build-up areas may show the phenomenon of vacancy with a small population, few businesses, and seriously low productivity.It is a serious obstacle to urban development and leads to the decrease of street vitality. In order to promote the healthy development of cities, it is necessary to evaluate the existing phenomenon of vacancy in cities. This paper proposes a method to quantify and evaluate the phenomenon of vacancy at the city block level with avacancy index, as well as investigate its influencing factors. Firstly, a vacancy index is determined by the characteristics of a vacant town based on nighttime light data and land cover information. The nighttime light data of Luojia-1A satellite whose resolution is higher than DMSP-OLS and NPP-VIIR, reflect the intensity of nocturnal activity. In SAR interferometry, coherence is the criteria of phase stability. Stabilized objects in urban areas can be identified as buildings according to the coherence, which shows the external characteristics of vacant towns. By visualizing the vacancy index in the study area, failed construction in urban areas can be identified. Then, based on classical urban design theories on spatial vitality promotion, a series of factors of urban vitality are summarized as the internal influencing factors of the vacancy phenomenon, including the distance to the street, integration, choice, the crowd density, function of street-block, mixture of primary use, and mixture of building ages. These internal influencing factors of the vacancy phenomenon are quantified by social sensing data and road information. Lastly, the extrinsic and intrinsic features of vacancy are combined, a Random Forest model is employed to refine the vacancy index and rank the importance of the influencing factors. We use the urban area of Wuhan as a case study. Wuhan develops and expands fast in recent years. The areas with severe vacancy can be identified by visualizing the vacancy index with this proposed method. Meanwhile, the influencing factors that have the most impact on the degree of vacancy, accessibility of road network, and population density, are also identified. In this paper, the phenomenon of vacancy is analyzed from two perspectives, multi-source remote sensing data and multi-source social sensing data, both of which have time series correspondence. Thus, the results of this paper are reliable and can assist with the assessment and analysis of the phenomen on of vacancy in urban areas.
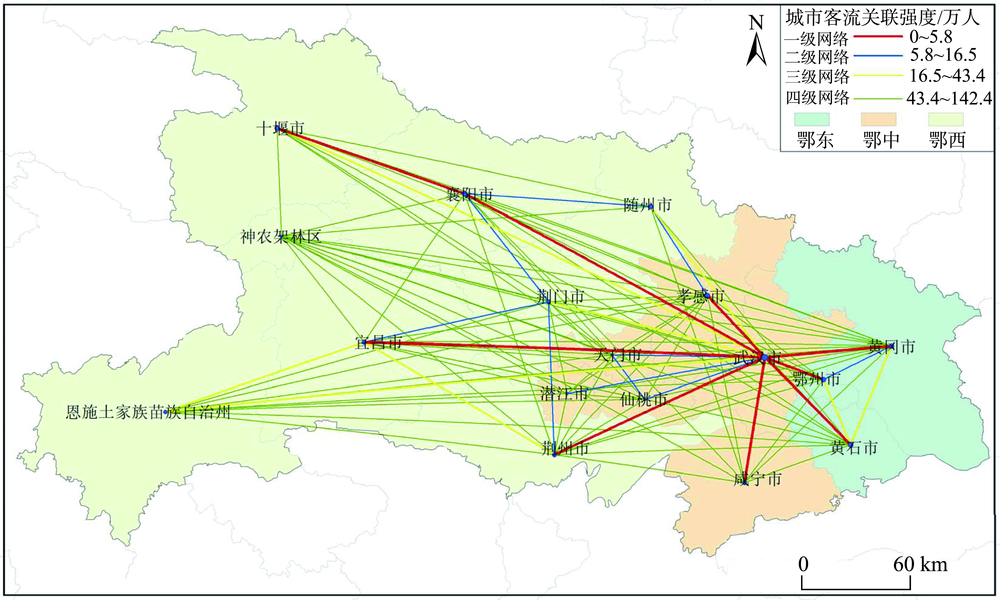
Based on the data of railway passenger flow, this paper uses the urban network model to analyze the characteristics of network connection strength and organizational structure in Hubei Province from the mobility and agglomeration of railway passenger flow between cities. Results show that: (1) The urban network structure within the scope of Hubei Province has initially formed, showing the overall trend of “strong in the east, weak in the west, low in the north, and high in the south”. At the same time, within the scope of Hubei Province, the single-center network pattern is obvious while the cross-regional links are weak; (2) The directivity of the central city and the regional proximity are obvious, and the whole province is greatly influenced by Wuhan. The eight surrounding cities closely related to them are the main parts of Wuhan “1+8” urban circle; (3) The traffic axis is the main direction of passenger flow connection, with Shiyan-Xiangyang-Jingmen-Wuhan, and Enshi-Yichang-Jingzhou-Wuhan as the main cities, the “>” type cities with passenger flow are closely linked. Moreover, the pivotal role of Xiangyang and Yichang in Western Hubei has become increasingly prominent. Finally, based on empirical research, this paper makes some discussion on the meaning, trend, and orientation of provincial spatial planning.
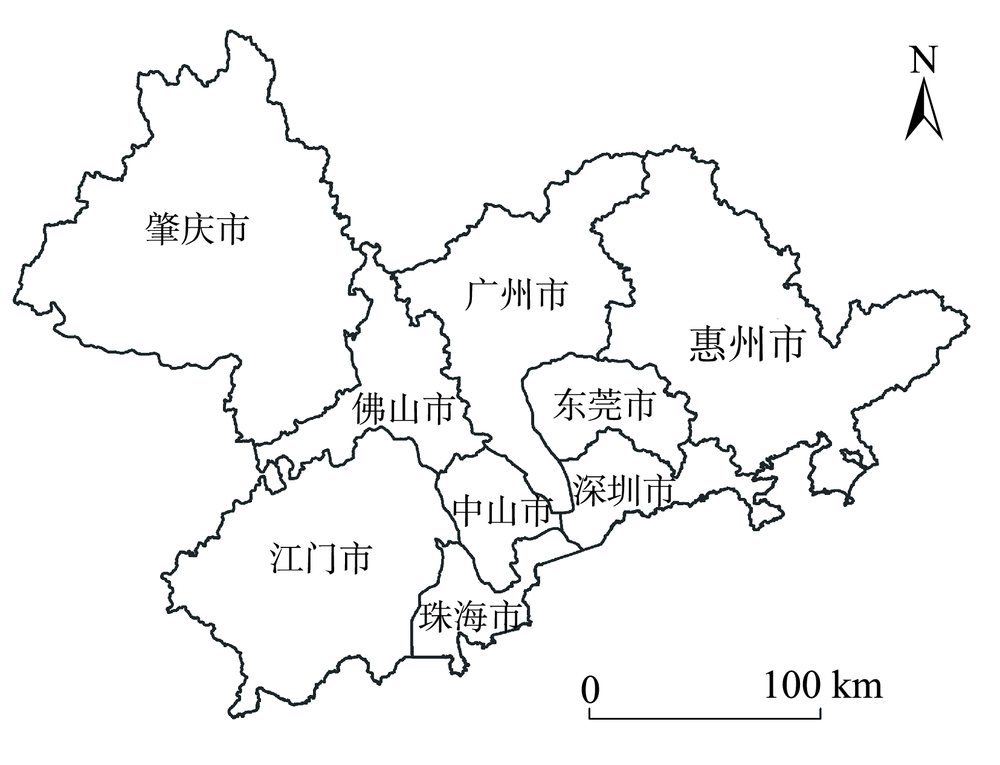
High-speed rail has strong impact on the spatial pattern of regional economy in the Pearl River Delta urban agglomeration. Exploring the coupling of high-speed rail and regional economy is thus of great scientific value. In this paper, we comprehensively quantified the impact of high-speed rail on the spatial pattern of regional economy over the Pearl River Delta urban agglomeration using cities panel data in 2010, 2014, and 2018. We quantified the regional economic connection, regional advantage potential, and regional economic space stability, respectively, using gravity model, regional superiority potential model, and Theil coefficient. Our results show that: (1) the intensity of economic relations between cities in the Pearl River Delta increased over years, with a stronger economic relations along north-south direction than the east-west direction. Core zones of economic relations included Guangzhou, Shenzhen, Dongguan, and Foshan.The sub-zones of economic relations were represented by Zhongshan, Zhaoqing, and Huizhou. And the radiated zones of economic relations covered the whole Pearl River Delta. The regional influence of high-speed rail on the economic development of the Pearl River Delta cities was also uneven. Guangzhou, Shenzhen, Dongguan, Foshan, and other cities with strong economic strength occupied the core positions. As a result, the economic ties between other cities may need to be improved in the future; (2) with the construction and operation of high-speed rail, the regional advantage of each city over surrounding cities increased greatly from 2010 to 2018. However, the differences in regional advantages of each cityalso increased gradually. Dongguan, Zhongshan and other second- and third-tier cities with strong economic strength, small urban geographical scale, small population scale, and superior geographical location benefited most. These cities had great potential to be new regional growth centers in future; (3) for the overall difference of regional economy in the Pearl River Delta, the spatial heterogeneity of regional economy increased first and then decreased. For the group differences in the area, the difference of economic development levels between first-and second-tier cities showed a significant increase first and a slight decrease trend then. The difference of economic development levels between second-and third-tier cities showed a decreasing trend. The study provide useful references for future transportation planning.
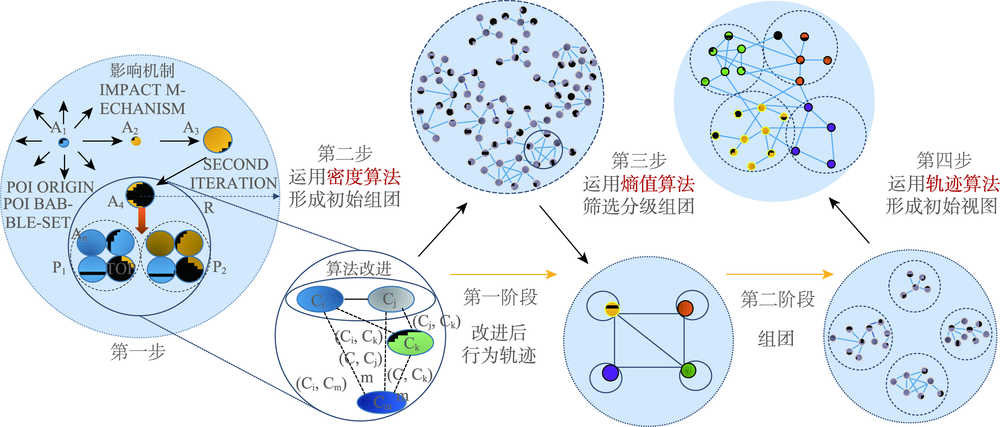
Analysis of the urban creative industry' s image visualization based on the perspective of human geography is of great significance for the integration between urban deep space and regional innovation development. However, the intelligent dynamic spatiotemporal modeling of Swarm groups is insufficient in meeting the visual development of the spatial clustering of creative industries. This study aims to provide a basis for decision-making within city management. Starting from the influencing factors of spatial clustering of creative industries in urban areas, a novel process of density-based interest spatial clustering of path (DBICP) is proposed together with a computer browser to aggregate visual images. First, according to the indicator system of influencing factors, and through the space bayonet traffic data and industry indicator data during 2014 to 2018, preprocessing is performed for constructing a spatial standard clustering algorithm: The density-based spatial clustering of applications with noise. Second, a hierarchical optimization of clustering density is performed to develop a new DBICP algorithm and obtain a preliminary trajectory image. Finally, using source code translation, the output of spatially-aggregated trajectory images under the browser interface is completed. Through the selection of 7 creative spatial indicators, the selection of more than 4000 points of interest, 2 groups algorithm tests, data of 3 groups bubble-set preliminary planning, 3 sets of Canvas dynamic simulation sequential planning, and E-charts spatial dynamic partial planning are accomplished. The average moving trajectory distance is 4.88 km, the regional agglomeration degree is 0.84, and the dynamic agglomeration evaluation index is 5.01. The results of the process as applied to the sample city of Shanghai show that three different clustering patterns have been formed in the spatial distribution of creative industries in Putuo District, Pudong New District, and Xuhui District, thus evidencing the control response strategy of allocation, uniform distribution, and siphon. The vector clustering image generated by the method proposed in this paper can explore the clustering characteristics of smart dynamic activities of the urban big data in the future and can also effectively solve practical urban problems, such as business clustering graphical measurement and community traffic image survey, and provide relevant technical support and research means for the large-scale spatial dynamic clustering supervision of urban geography. The method overcomes the lack of clustering classification and trajectory measurement in traditional images, effectively finding clustering information of image trajectories from the index data. This in turn embodies the interdisciplinary integration of geographic and sociological information, thus providing a clustering method.
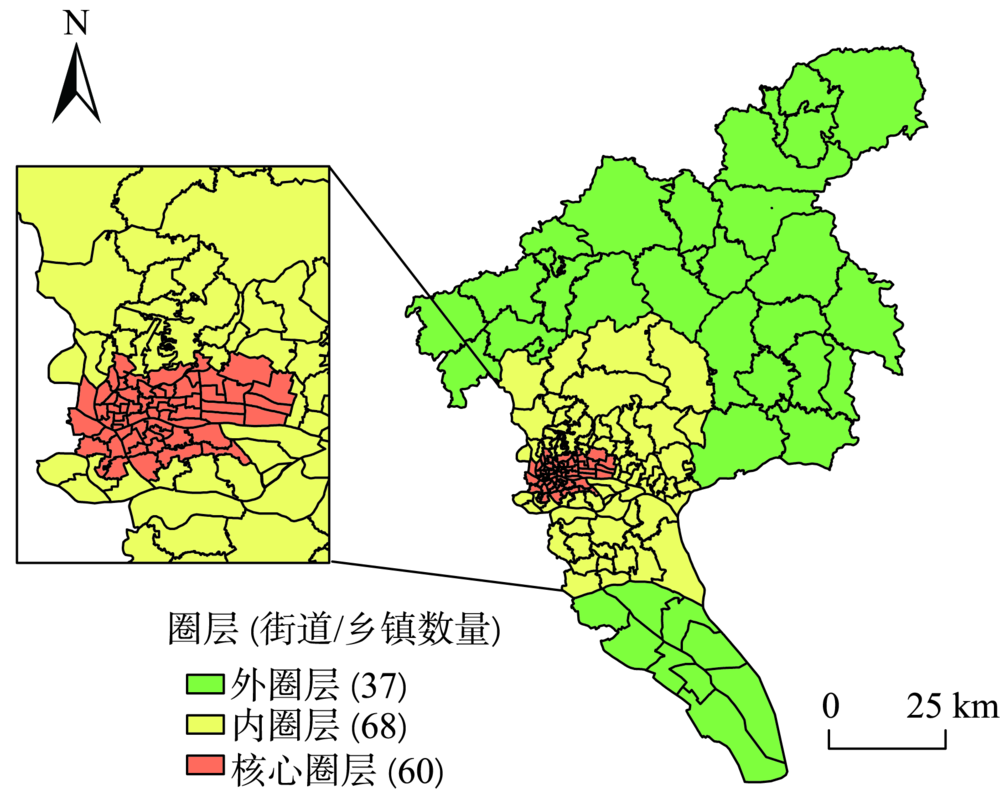
With the rapid development of urbanization in China, the complicated growth between population and land use in urban areas has attracted increasing attention. Under the background of new urbanization, studying the relative growth relationship between the urbanization levels of these two elements of different dimension is beneficial to exploring both the degree of coordination and the driving force of the man-land coupling development. In this paper, we calculate the index of man-land coupling urbanization to identity four types of coupling on the street (township) scale, which is based on the Landsat time series images, the census and yearbook data in Guangzhou from 2000 to 2015; To further quantify the degree of coupling and analyze their spatial pattern, we developed the allometric growth model fitting the annual average growth rate of man and urbanized land for the four categories, including increasing and decreasing ratio of man and land, increasing ratio of man and decreasing ratio of land, decreasing ratio of man and increasing ratio of land. The new model can delineate the more significant allometric growth for the street (township) units of the different categories than that analysis for the whole area. The main results are as follows: (1) From 2000 to 2015, the coupling development population and land urbanization on the street (township) scale in Guangzhou shows obvious characteristics of three-tier spatial structure. The allometric growth models of four types of man-land coupling show three kinds of equations, including positive allometric, negative allometric and negative power-law, which proves that the classification of allometric growth is helpful to analyze the dynamics co-evolution of man-land urbanization; (2) The allometric growth patterns of the Guangzhou's circle structure reveal the man-land coupling's harmonious situation of urbanization. The core circle, inner circle and outer circle respectively presents the development of compact, intensive expansion, and extensive expansion. In addition, through the joint spatial analysis with the renovation and transformation in old urban areas, it indicates that the development of urban renewal has certain positive effects in Guangzhou. The core and inner circle have formed the harmonious growth development trend preliminarily. Nevertheless, the outer circle is obviously developing towards the accelerated expansion of population and land during the late period, which needs to be paid more attention to preventing the phenomenon that the suburbanization of the outer circle is transformed into extensive growth. To conclude, the research results can provide support for both the cognitive exploration of the new urbanization theory connotation and the empirical research of the Guangzhou case.
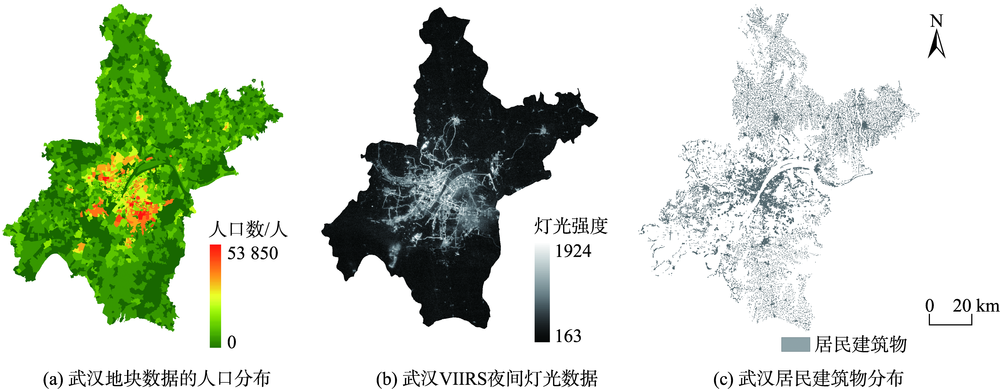
Carbon emissions of residential buildings have an important impact on energy conservation policies, emission reduction strategies, and sustainable urban development. However, current studies mainly focus on carbon emission estimation for an entire city or a large region. There is a lack of consistent methods of carbon emission estimation for residential buildings. Thus, this paper proposes a method to calculate carbon emissions of residential buildings by the fusion of multiple datasets. Our method firstly uses a top-down based strategy to assign the total carbon emission to each urban block. Then it adopts a bottom-up strategy to establish an emission calculation model for each residential building by taking into account urban block planning factors, socioeconomic factors, and residential building morphological factors. This paper applies the proposed method to estimate carbon emissions of all residential buildings in Wuhan city. Our results show that: (1) Carbon emissions of residential buildings decreases from the central city to the suburbs, which is closely related to population distribution; (2) Carbon emissions of residential buildings are heterogeneous and exhibit a heavy-tailed distribution. For instance, there are 89% of residential buildings with carbon emission lower than the average of 1.28 ton and 11% of residential buildings with carbon emission higher than the average; (3) Residential buildings within the same urban block have slight difference in carbon emission with an average standard deviation of 7.66 ton, while residential buildings located in different urban blocks tend to have significantly different carbon emissions with an average standard deviation of 51.30 ton; and (4) Carbon emissions of residential buildings are more likely to be affected by plot ratios in planning factors, population density in socioeconomic factors, and shapes of residential buildings. Our method and experimental results can provide decision support for sustainable planning of urban residential areas.
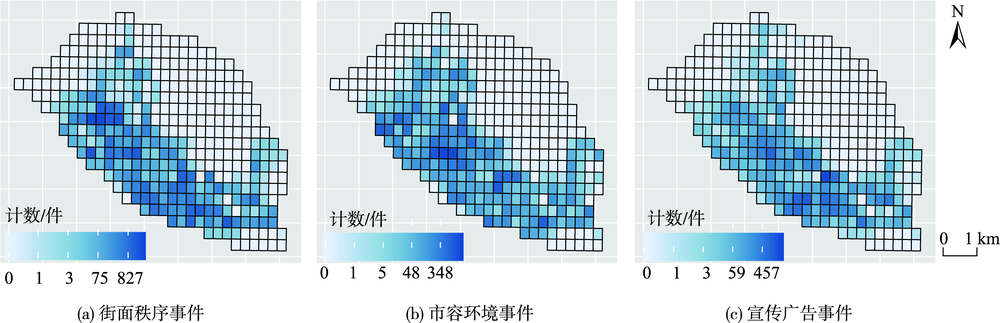
Urban management events are regional and periodic. The spatiotemporal laws and potential impact factors implied in urban management events are vital for improving urban management. However, research on the temporal and spatial changes of urban management events and influencing factors are rare. In this paper, by using the Bayesian space-time model, we modeled and analyzed the temporal and spatial evolution characteristics of three types of city management events-street order, urban environment, and publicity advertising-in the P district of H city, Northwest China, and explored the impact of urban management events as well as the underlying impact factors. We found that: (1) There were spatial differences in the relative risk distribution of the three types of urban management events. The street order type was concentrated in the residential and commercial areas of the city, while the urban environment type was concentrated in the residential areas of the city. The advertising type was mainly concentrated in the commercial areas of the city. The spatial risk posterior probability estimate indicated that the above two regions are hotspots of urban management events. (2) The relative risks of urban management events were more prominent on Tuesdays, Fridays, and Saturdays, but there was no obvious monotony in general trends. Meanwhile, the hourly trends had irregular fluctuation, everyday from 8 to 10 and from 14 to 15, it was a period of the high incidence of urban management events, and its relative risk was much higher than other periods. (3) For different built environments, the potential impacts of these factors were quite different. The relative risk of urban management events was significantly associated with restaurants, transportation, and living services, all positively correlated. (4) The relative risk of urban management events presented obvious spatial and temporal heterogeneity. and it is reasonable and necessary to consider the impact of spatial and temporal effects when analyzing urban management events data. Our findings are meaningful for relavant government departments to make effective policies to control and reduce the relative risk of urban management events, especially for the study area.
A large number of traditional settlements are considered as a major part of China's excellent cultural heritages. These traditional settlements have been receiving increasing attention since the end of last century because they play an important role in promoting social and cultural constructions and can support social strategies, such as Chinese Great Rejuvenation. The theory of Cultural Landscape Genes of Traditional Settlement (CLGTS) proposed by Chinese scholars at the beginning of this century caters to the current social needs for preservation and development of traditional settlements and corresponding cultural heritages. CLGTS has attracted more and more scholars nationwide to analyze or interpret the core traditional cultural features of traditional settlements from the perspective of bioinformation. However, there is still a lack of research findings on the geographical information features of traditional settlement landscape genes and related understanding approaches. To explore this issue and find possible solutions, this work focuses on the following aspects: (1) People need conceptual, description, and measurement systems while analyzing and capturing geographical information. Because geographical information contains some key attributes that allow us to model the geographic world correctly, such as semantics, geometries, properties, dimensions, spatio-temporal frameworks, spatial association, existence states. (2) Traditional settlement landscape genes are one of the most special cultural elements due to their rich dialectical features. This shows that traditional settlement landscape genes are a potential way to understand the cultural characteristics of traditional settlements. In addition, traditional settlement landscape genes are also considered as the collections of cultural symbols. (3) In a wide range, we can extract rich geographic information from the traditional settlement landscape genes, such as spatial positioning, carriers, history, as well as cultures. According to the above, this work tries to establish the potential approaches to capture the geographical information connotation of traditional settlement landscape genes. Based on the practice and corresponding experiments, this work explores and proposes four methods: symbolization, data mining, family tree analysis, and spatial pattern mapping. It is well known that big spatio-temporal data is driving us to develop new methods or technologies to understand geographic information features of the world well. Through this work, it is clear that exploring the geographical information features of traditional settlement landscape genes is of great significance. Because this not only help us understand the traditional settlements and corresponding cultural heritages in depth but also help us extend the horizon of GIS discipline and promote the development of Human-GIS. In future work, we should pay more attention to exploring ways of understanding the mechanisms of geographic information features of traditional settlement landscape genes.

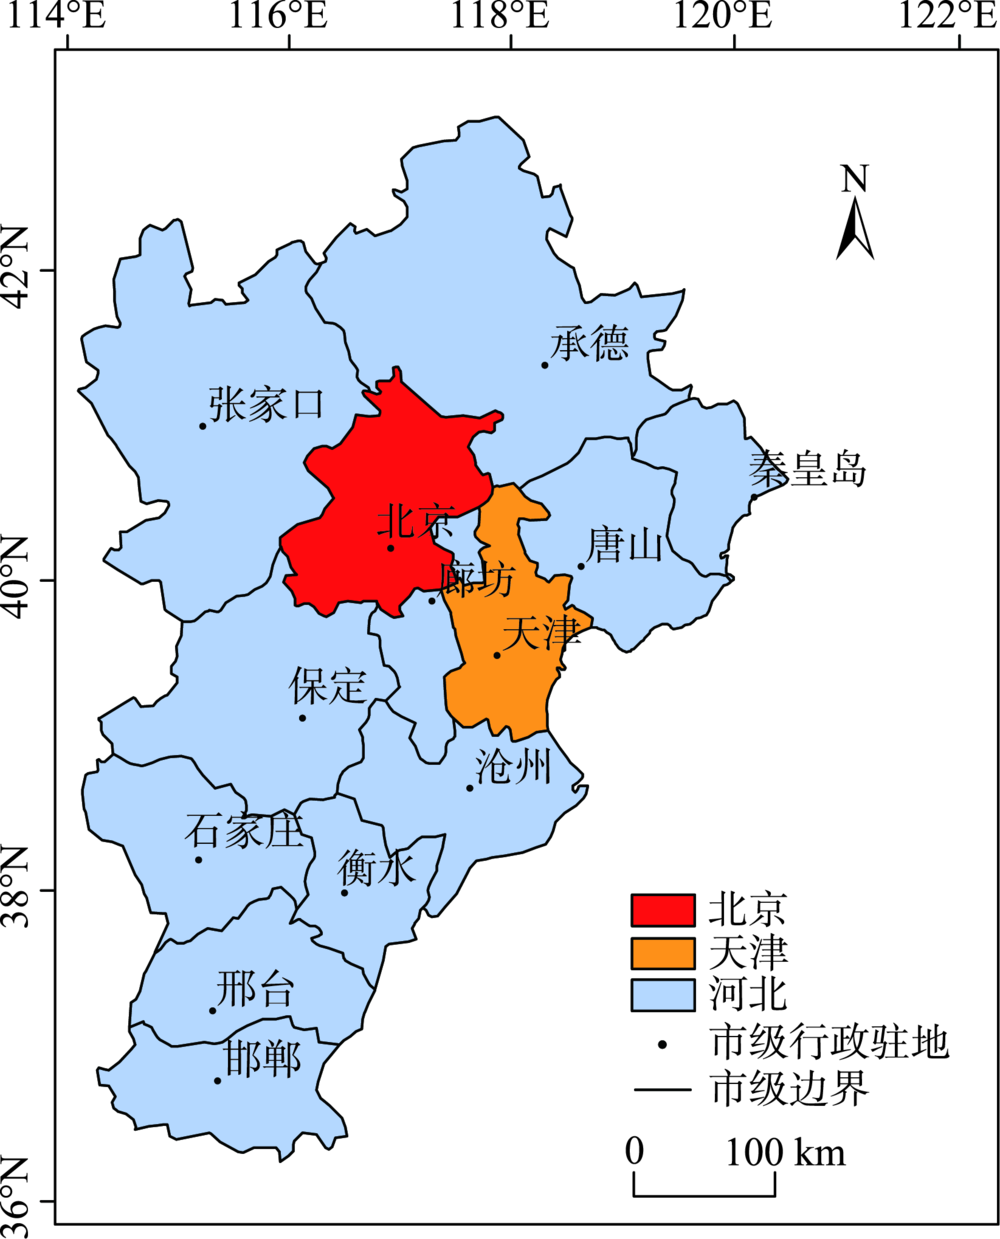
Quantifying the spatial distribution of population is a basis and hot issue in population geography researches. At present, there are large differences between different scales of spatialized population data in the world, because of various production methods, data sources, etc. This leads to the inconsistency of population spatialization, especially the 1 km-scale data which is widely needed. This paper takes Beijing-Tianjin- Hebei region as study area to build a population spatialized model at 1 km spatial resolution, based on multi-source data such as the township scale census data in 2000 and available mobile location data. The statistic population distribution weight (p) is calculated using the light projection method. Preliminary population spatialization is calculated using the area-weighted method, and the preliminary data is further modified by the exponential smoothing algorithm. Finally, the population spatialization dataset (PJ2000) with 1 km resolution in Beijing-Tianjin-Hebei region is obtained. This dataset integrates the small-scale characteristics of the township street demographic data and the advantages of mobile phone location data. The PJ2000 dataset reflects the actual location and the detailed characteristics of the population distribution in Beijing-Tianjin-Hebei region. Combined with the population density dataset (i.e., WorldPop) and China's kilometer gridded population spatial distribution dataset, the accuracy assessment of PJ2000 is carried out from three aspects: method difference, quantitative error, and regional comparison. The PJ2000 dataset solves the problem of the different distribution of population density over the same land cover type but different towns, and addresses the large difference in the gridded data of population spatialization. The overall accuracy of PJ2000 dataset is 90%, with 87% townships (streets) showing relative error less than 0.5. The correlation coefficient (r) between PJ2000 and the pop2000 township demographic data in the year of 2000 is 0.95. In addition, the population density distribution of this dataset is relatively uniform at the local to large scale. Our results prove that the accuracy of the population density dataset with 1km scale is significantly improved. The population spatialization model is constructed by integrating multi-source data such as township-level demographic data and mobile location data. In the future, it is expected that this method could be applied to obtain the population spatialization distribution for other city agglomerations. Our model could provide high-quality population density dataset for collaborative development of urban agglomeration and risk assessment of natural and man-made disasters in cities, such as earthquake, flood, fire, and public infectious diseases.
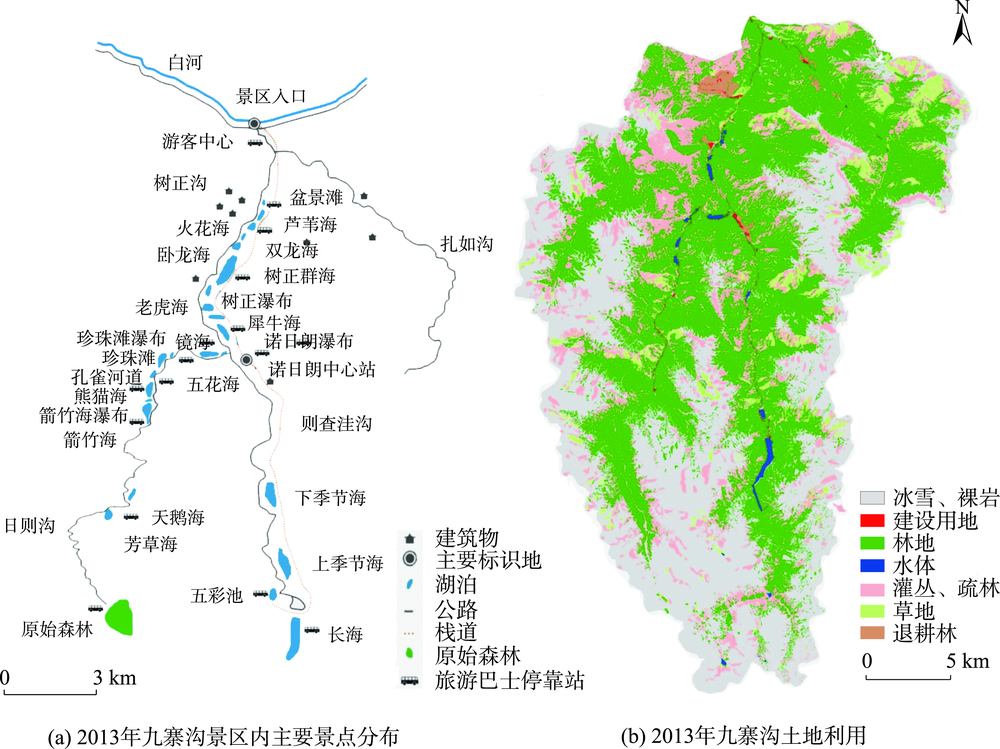
Landscape ecology is the scientific basis of sustainable landscape development. Participatory mapping based on stakeholders is effective to establish the landscape service category system and quantitative indicators. The evaluation of landscape services primarily focused on the complex and dynamic relationships between human and environment. Landscape service is a special type of ecosystem services. It emphasizes the landscape functions and spatial characteristics that are being used by human, as well as ecosystem service shifts from simple ecological protection to integrated landscape architecture. This paper aimed to evaluate the potential of using local stakeholders as key informants in the spatial assessment of landscape service indicators. In our study, we took Jiuzhaigou Nature Reserve as an example to introduce the “landscape services” and mapping of all the landscape service indicators based on local stakeholders. A total of 17 different material, and non-material cultural landscape service indicators were established and mapped separately on an aerial image using local stakeholders in semi-structured interviews. These landscape service indicators were presented and analyzed spatially for better understanding of landscape-level service structure, pattern and relationship. Assessing the wide variety of landscape services, e.g. livestock, medicinal resources and dwelling, requires a wide range of data sources for their identification. In total, we obtained 737 landscape service points with participatory mapping in analysis. Our results show that local involvement and participatory mapping enhanced the assessment of landscape services. Spiritual belief, religious activities and residents' village buildings had a high synergistic relationship. Jiuzhaigou scenic spot service had positive spatial correlation, and the observed values ??in the unit shared a same trend. The local autocorrelation indicated a significant local spatial agglomeration phenomenon at the Jiuzhaigou landscape service point, and the "high-high" clusters of landscape services were mainly distributed at the entrance. While the “low-low” clusters of landscape services are mainly distributed in areas such as forests, which was far away from human habitation and activity areas. Many material landscape service indicators were spatially separated and scattered in the study area. And the well-being of locals also depended on the non-material services, e.g., public places of social interaction and cultural traditions. These benefits from nature demonstrated spatial clustering and coexistence, and were close to settlements where the highest intensity and diversity were found. Based on our results, the integration of participatory mapping methods in landscape service assessment is crucial for collaborative, bottom-up landscape management. It is also essential to capture the non-utilitarian value of landscape and to assess its social and cultural landscape services, which are less evaluated in many studies.
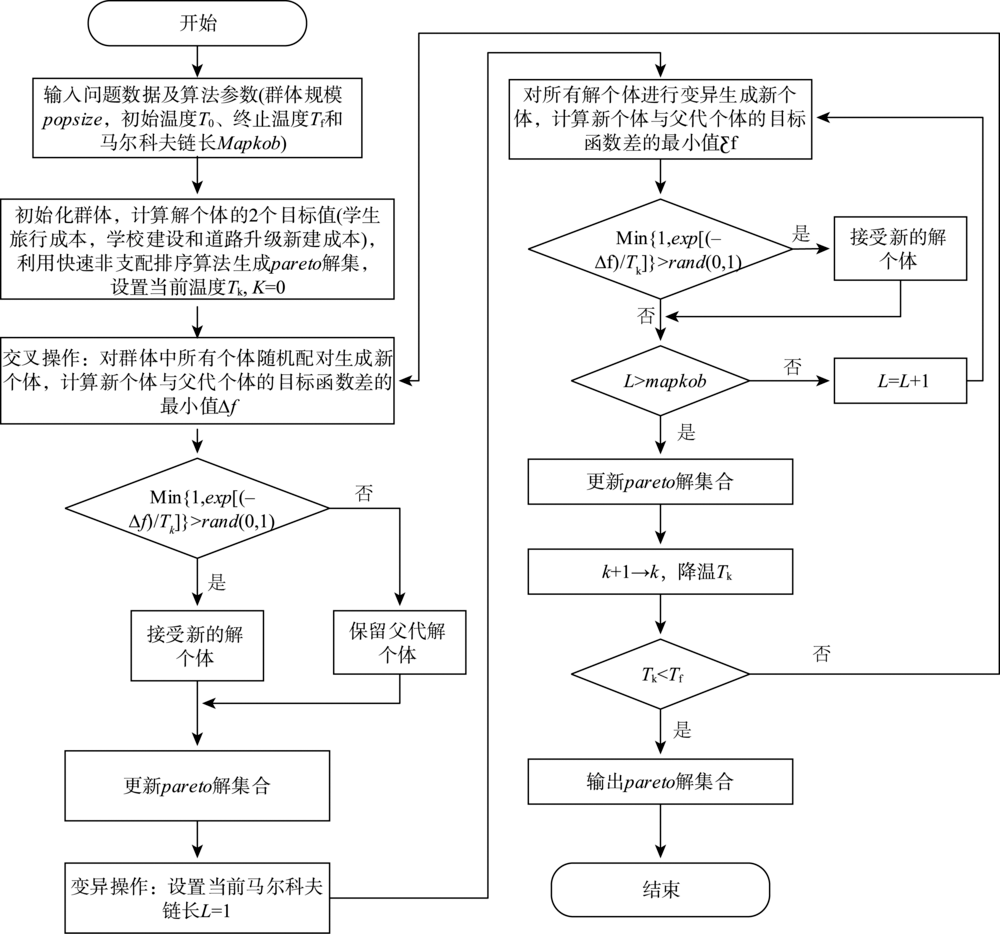
The rational planning of school location is an important way to optimize the allocation of educational resources, improve the efficiency of school running and realize the balanced development of education. The accessibility must be considered in optimizing the location of rural schools, which is an important difference from the location of urban schools. Many scholars have studied the location problem of rural schools, but most of them have neglected the impact of transportation network conditions on the location of schools. On the basis of previous studies, this study will consider the impact of traffic network on the optimization location of primary schools in mountainous environment. The object of this study is to minimize the total transportation costs for students, construction costs for new schools, construction and upgrade costs for roads on a traffic network. We regard a set of villages as demand nodes exists in a geographical region, a set of roads as transfer links. The road links in the network contain existing and new potential road links. A set of schools exists in the region and it is clearly desired to locate a set of new schools, to construct new road links, to improve the existing road links such that the total investment costs (including the travel costs for students, construction costs for school facilities, construction and upgrading costs for roads) are minimized. Thus, a multi-objective optimization model for this problem is proposed. The multi-objective facility location-network design model constructed in this paper is an extension of FLNDP problem, and also belongs to NP-hard problem. In order to facilitate the model application, this study use geographic information science method, take Visual Studio. Net 2010 as the development platform, use C# language, MATLAB language and ArcGIS Engine 10 component library to develop a location optimization system of rural primary and secondary school based on transportation network. Finally, the system is applied to the optimization of the primary school location of a town in Guizhou province. Aiming at the location optimization problem of rural primary, this paper considers three scenarios (only consider the existing road, assume that the road can be upgraded and the road can be built or upgraded) which are different from the problem of urban primary school location. In geographic calculation, this paper explores an improved multi-objective simulated annealing algorithm to determine the best location of new schools, as well as the construction of new roads and the upgrading of existing roads.
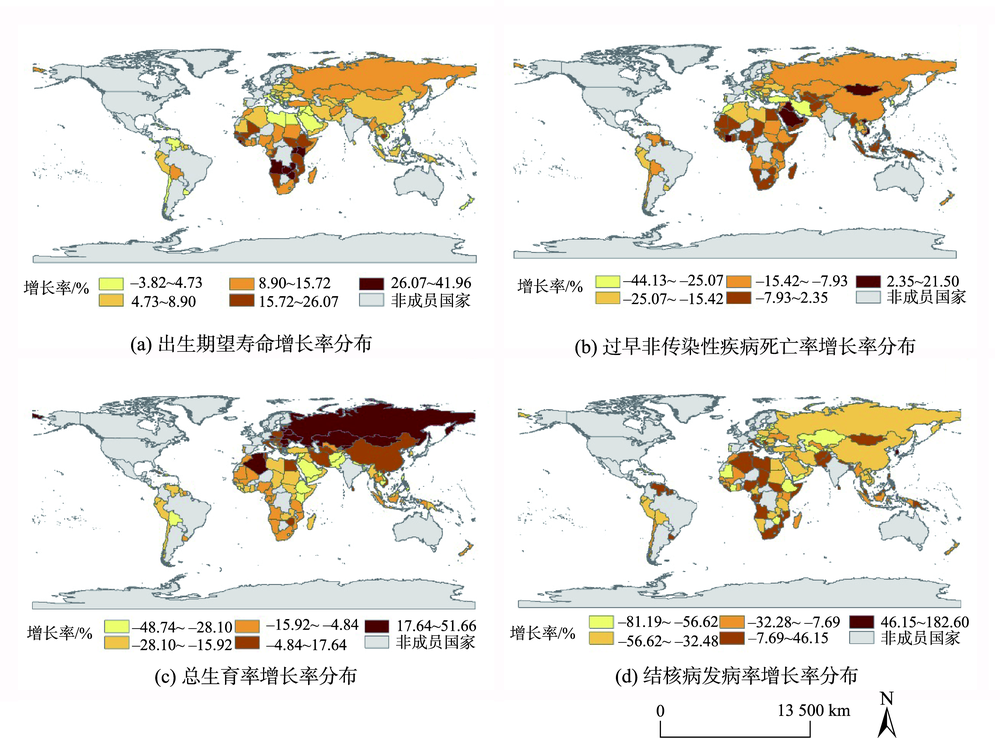
Health is a key factor that affects the development of different countries and regions. It is very important to understand the health status of the residents in the Belt and Road countries to further explore the health cooperation along the Belt and Road. This paper selected four representative health indicators, including life expectancy at birth, premature noncommunicable disease mortality, total fertility, and tuberculosis incidence, and used Moran's I index and Getis-Ord G index to conduct spatial statistics on the health status of 135 countries along the Belt and Road. This paper analyzed the spatial auto correlation of health status and the temporal and spatial patterns of health status. We found that the health indicators of most countries along the Belt and Road showed a trend toward improvement and optimization between 2000 and 2016. Health indicators of Belt and Road countries showed significant positive spatial auto correlation. In general, countries in Europe hadexcellent health condition, countries in South America, North America, and Oceania werein a good health condition, and countries in Asia werein good health condition as well, but the countries in Southeast Asia had high incidence of tuberculosis. The health status of the countries in Africa had improved significantly, but still in a poorhealth condition. Member countries should further strengthen the cooperation in health to promote the development of the Healthy Silk Road.
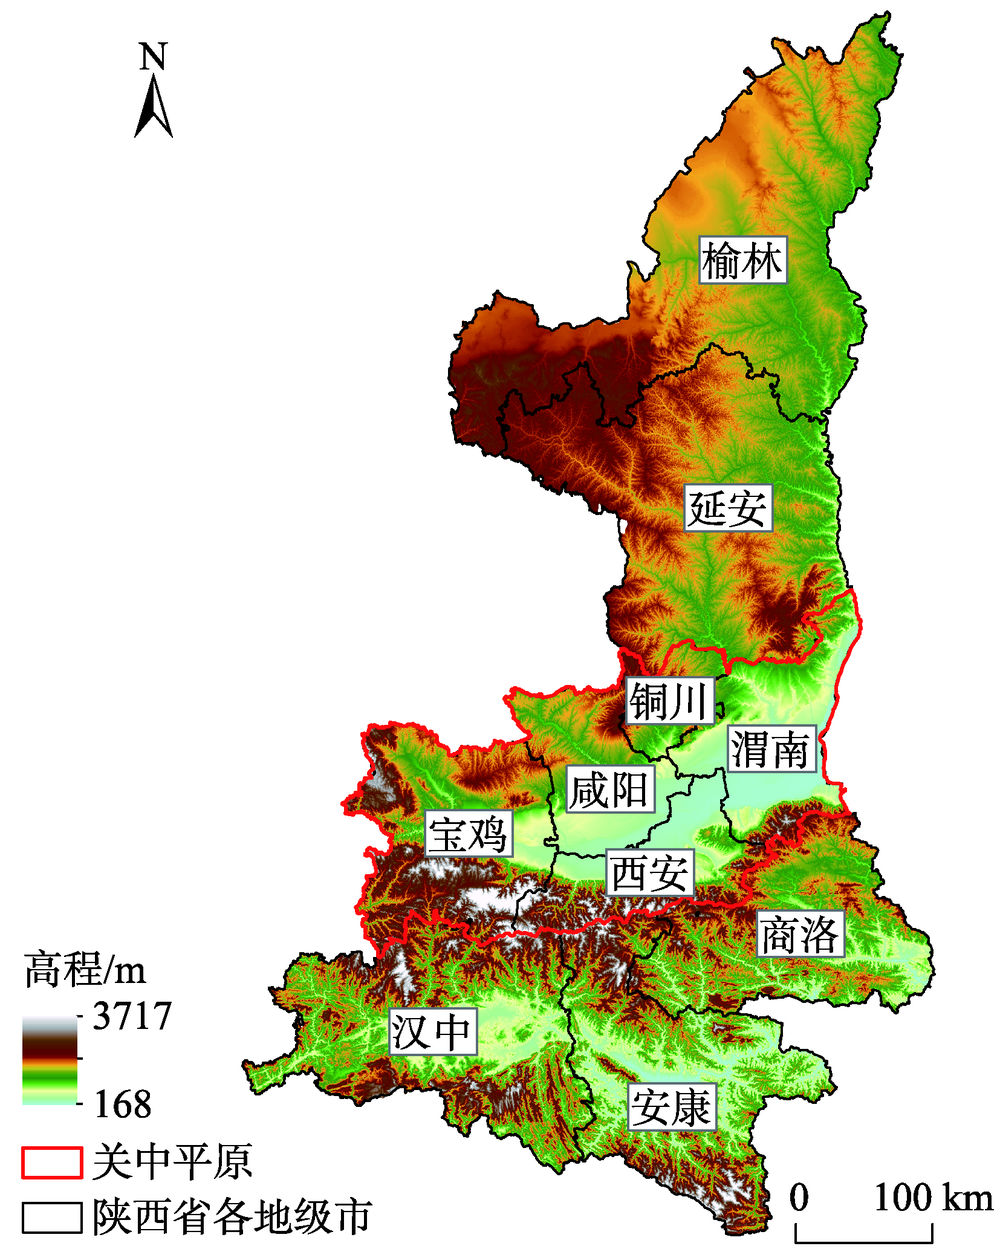
Hemorrhagic Fever with Renal Syndrome (HFRS) is a rodent-borne endemic disease caused by Hantavirus, which poses an increasingly serious threat to public health, especially in China. In this country, Shaanxi Province is one of the top regions with the highest HFRS incidence in the past years. It is of great importance to explore the potential influences on the spatiotemporal variations of HFRS epidemics across this province, which would provide useful clues for local authorities making targeted interventions on this disease.The county-level HFRS incidence rates during 2005-2017, as well as some potential natural and socioeconomic variables, were collected and analyzed by using spatial auto-correlation and hot-spot analysis tools as well as a Geodetector tool to explore the spatiotemporal relationships between the incidence rates and the potential variables. The HFRS epidemics in Shaanxi Province were obviously higher than the national level and presented clear temporal fluctuation and spatial clustering at the county scale. More than 90% of the counties with relatively high HFRS incidence rates concentrated in the Guanzhong Plain where obvious spatial heterogeneity was also observed. Some variables including the percentage of plain area and construction land, and population density separately accounted for about 20% of spatial variations of the county-level epidemic across the whole province. By comparison, the spatial pattern of this epidemic in the Guanzhong Plain with no obvious socioeconomic differences was mainly affected by precipitation, normalized difference vegetation index, and land-use types. Thus, the Guanzhong Plain with both spatially clustering higher incidence rates and obviously differentiated natural and socioeconomic conditions was the crucial region of the HFRS prevalence across Shaanxi Province. We suggest that precipitation, vegetation conditions, and land-use types should be heavily considered by local authorities for making effective interventions on this disease across Shaanxi Province, especially in the Guanzhong Plain with relatively high land urbanization and population density.
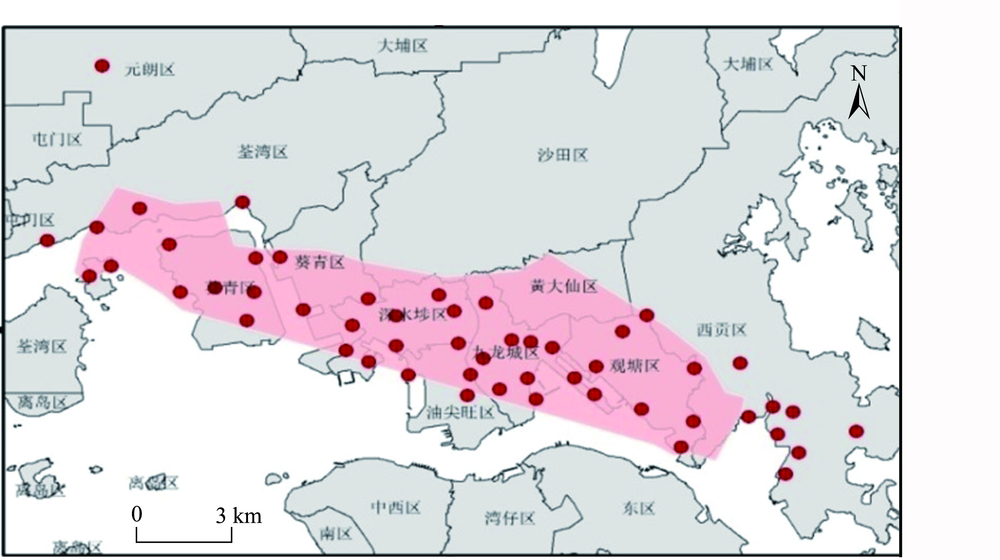
Large-scale sustained demonstrations will seriously affect the stability of social order. Since June 2019, Hong Kong's economy has been affected to some extent by the impact of continuous demonstrations on various industries. Rapid and accurate identification of areas affected by demonstrations plays a very important role in loss assessment, economic recovery, and government governance. In this paper, we proposed a novel method to identify the affected areas using night light remote sensing and VGI data. Firstly, we captured the highly overlapping photographs of the study area by a mobile phone on passenger aircraft on August 28, 2019. Following regular photogrammetry steps, night light remote sensing image was generated. Then we compared it with POI density maps and Luojia-01 night light image, and initially marked the affected areas, which were further validated by VGI photos. We finally confirmed two affected areas in Kwun Tong District. A simple quantitative analysis was performed to assess the influence on affected areas. We conclude that the proposed method can quickly identify the areas where economic activities are affected in Hong Kong. Our method can also be used to study economic changes in other cities, which is of great application value in precise urban governance.
This study took Beijing-Tianjin-Hebei, the Yangtze River Delta, and the Pearl River Delta as study areas. Based on correlation analysis of overlapping years in 2012 and 2013, a power function model was used to transform NPP-VIIRS NTL data(2012—2017) to simulate DMSP-OLS NTL data. We generated a temporally consistent NTL dataset of study areas from 1992 to 2017 (consisting of 1992—2013 DMSP-OLS NTL data and 2014—2017 NPP-VIIRS NTL data). By referring to the statistical data of urban built-up area, the optimal threshold of nighttime light was determined to extract urban scope. Based on this method, urban scope with insufficient economic vitality contained in the statistical data was effectively stripped off, while those low-grade,high-vitality urban areas that did not belong to the statistical scope were identified, which innovated the perspective of data application. Results show that: ① The contribution of county-level towns and cities of the municipal level to the economic vitality in three first-class urban agglomerations was different. The Beijing-Tianjin-Hebei had a vast hinterland, and county-level towns were an important part of the regional economic vitality. As a whole, they had the largest contribution in three first-class urban agglomerations. In the early 1990s, some county-level towns in the Yangtze River Delta had strong economic vitality. After 2005, it was lower than the Beijing-Tianjin-Hebei with the process of transforming county into urban district. Affected by the socioeconomic development and the division of administrative units, the contribution of county-level towns to the urban scope in the Pearl River Delta was always the smallest in three urban agglomerations. ② There were differences in the imbalanced characteristics of urban spatial expansion in three first-class urban agglomerations. The urban spatial expansion of the Beijing-Tianjin-Hebei was led by Beijing and Tianjin, which has formed a "dual-core" model. It has not yet formed a sophisticated urban system. The Yangtze River Delta and the Pearl River Delta had obvious urban agglomeration characteristics and stronger equilibrium. The path, direction, and distance of center of gravity migration reflected the different expansion intensity and behavioral model in three first-class urban agglomerations; ③ On the whole, urban spatial expansion pattern presented the characteristics of continuously expanding hot-spot regions and shrinking cold-spot regions. Specifically, hot-spot regions and cold-spot regions were relatively stable in the Beijing-Tianjin-Hebei, and the hot-spot regions had a strong centripetal agglomeration effect. The spatial patterns of the Yangtze River Delta and the Pearl River Delta has changed greatly and the regional core cities had a stronger driving role.
