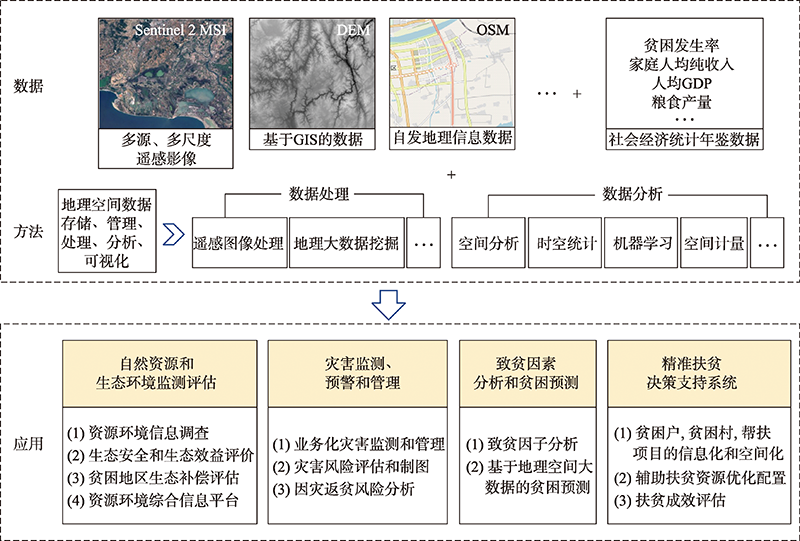
Through various exploration and practice of poverty alleviation, China has embarked on a path of poverty alleviation with Chinese characteristics, which has greatly reduced the number of rural poor people and significantly improved the living standard in poverty-stricken areas. For a long time, the monitoring of socioeconomic and environmental conditions in poverty-stricken areas is based on all kinds of statistical data, reports, paper files, etc., based on administrative units, lacking effective and accurate spatial location information. With the rapid development of geo-information science such as Remote Sensing (RS) and Geographic Information System (GIS), the real-time and efficient capture and calculation ability of spatial information greatly improves the efficiency and decision support level of poverty alleviation. This paper expounds the contributions of geo-information science on China's poverty alleviation from the following aspects:① monitoring and evaluation of natural resources and environment in poverty-stricken areas based on multi-source geospatial data; ② monitoring, early warning, and management of natural disasters in poverty-stricken areas; ③ analysis of poverty causing factors and poverty prediction; ④ decision support system for targeted poverty alleviation based on the mechanism of targeted poverty alleviation. China aims to eradicate absolute poverty in 2020, so the application of geo-information science in poverty alleviation will mainly focus on the establishment of monitoring and assistance mechanism to prevent poverty returning and alleviate the relative poverty. Moreover, under the background of rural revitalization, using geo-information science and technology to promote rural infrastructure information construction will be the focus of the next step.
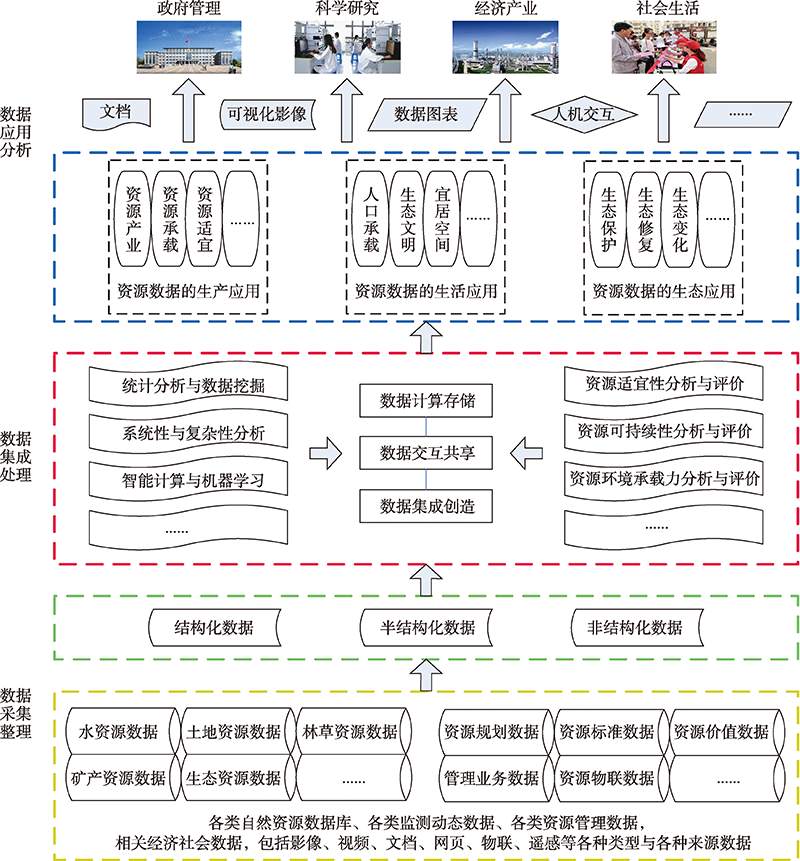
The application of natural resources big data and its processing technology can provide basic support for the research and management of natural resources, especially for revealing the elements, structure, and correlation of natural resources system, and provide new ideas, new methods, and new technologies for the development of resources science. This paper attempts to clarify the concept, main characteristics, and development trend of natural resources big data, and analyzes the practical significance of natural resources big data for national economic and social development. The construction of natural resources big data is not only an important part of natural resources informatization, but also a new way to improve the efficiency of natural resources industry and the whole social economy, and the governance structure of natural resources and the modernization of natural resources governance capacity. In this paper, the knowledge framework of natural resources big data application research is constructed under the earth system science system, based on the structure of "one map, one network, and one platform", this paper proposes to establish a large database of natural resources integrating space, aviation and ground observations and an application framework in terms of production, residential and ecological spaces, and discusses the establishment of a structural system based on data collection, processing, and application of natural resources. The frontier progress and development trend of natural resources big data application research are also analyzed under this technical framework.
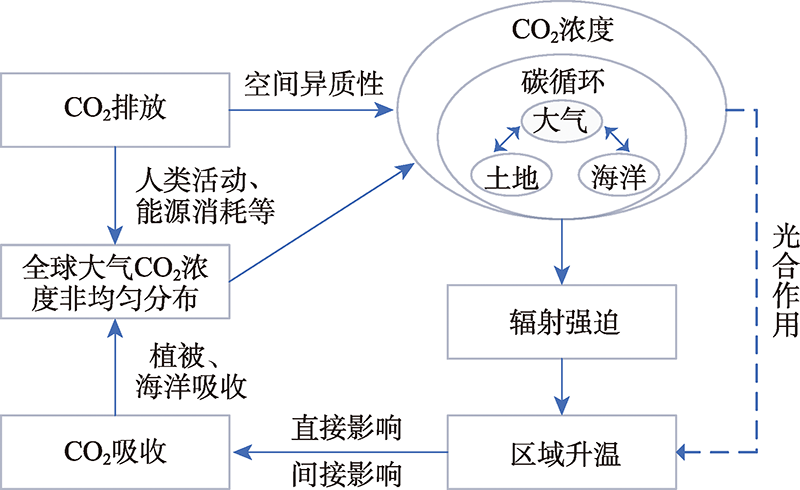
Global climate change is not only the most important environmental problem, but also one of the most complex challenges mankind faces in the 21st century. In the context of the increasing challenges of climate change and global governance, the assessment of CO2 emissions and costs has attracted increasing attention from academia and policy makers. At present, almost all global studies, including the assessment by the Intergovernmental Panel on Climate Change (IPCC), use global average CO2 concentration to drive the climate models. However, there are many controversies on the impact assessment based on the global average distribution of CO2 in academia. To formulate countermeasures to deal with carbon emissions and reduction and enhance China’s international discourse on dealing with climate change, it is of great importance to explore the mutual feedback mechanism between the inhomogeneity of atmospheric CO2 concentration and geophysical processes (e.g. surface temperature rise), and explore the impact mechanism of the inhomogeneous distribution of atmospheric CO2 concentration on global climate change. This paper reviews the research progress of non-uniform distribution of atmospheric CO2 concentration and its effects on surface warming. Firstly, this paper reviews the evidence of non-uniform distribution of atmospheric CO2 concentration from three aspects, ground-based measurement, numerical simulation, and remote sensing. It summarizes the advantages of these three methods and analyzes the discovery process of non-uniform distribution of global atmospheric CO2 concentration. Secondly, this paper explores the mutual feedback between the non-uniform distribution of global atmospheric CO2 concentration and surface temperature rise. The non-uniform distribution of atmospheric CO2 concentration directly affects the radiative forcing or indirectly affects the regional warming through affecting the photosynthesis. Regional warming has a direct or indirect impact on the ability of the ocean and vegetation to absorb CO2, which ultimately affects the non-uniform distribution of global atmospheric CO2 concentration. Finally, this paper reviews the problems of existing studies on non-uniform distribution of atmospheric CO2 and discusses the prospect of future development trends. This study provides a scientific basis for understanding the current situation of global/regional carbon emissions and climate change impacts, and further explores the feedback mechanism among atmospheric CO2 non-uniform distribution, surface temperature rise, and socio-economic system.
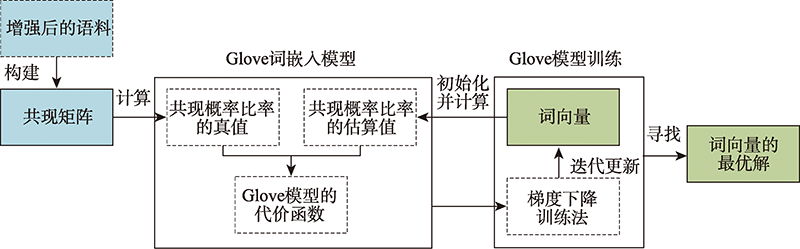
Geographic knowledge base is a collection of geographic entities and the relationships between them, which plays an important role in many applications of knowledge services, such as intelligent search, question answering, and recommendation. However, due to the differences in the data source, data form, and publisher, the existing geographical knowledge bases have the problems of homonym and homographs in the place name, spatial footprint, and feature type. Thus it leads to a barrier of the knowledge sharing and fusion between different geographic knowledge bases. Semantic alignment is an effective way to solve semantic heterogeneity, and the alignment of feature types is very important to further improve the accuracy of the alignments of place names and spatial footprints. The existing methods of feature type alignment mainly rely on the traditional similarity measures of string and structure of feature types that are unable to capture their deep semantic correlation, thereby influencing the alignment accuracy. Therefore, this paper proposes a word embedding based method to align the feature type. The proposed method uses the word embedding model to learn the semantic information of feature type from the corpus and represent the learned information as a vector, so as to capture the deep semantic information of feature type which cannot be obtained by using the existing methods, thereby increasing the alignment accuracy. Meanwhile, this paper enhances the geographic semantics of the corpus by the combination of the corpus of geographic information and the general corpus used in the word embedding model, which can help to more accurately measure the correlation of feature types. In the case study, the method is applied to align the feature types of different geographic knowledge bases. The results show that the averageFl score is up to 0.9568, and indicates the method can effectively capture the deep semantic information of geographic feature types, effectively improving the alignment accuracy of entity categories.
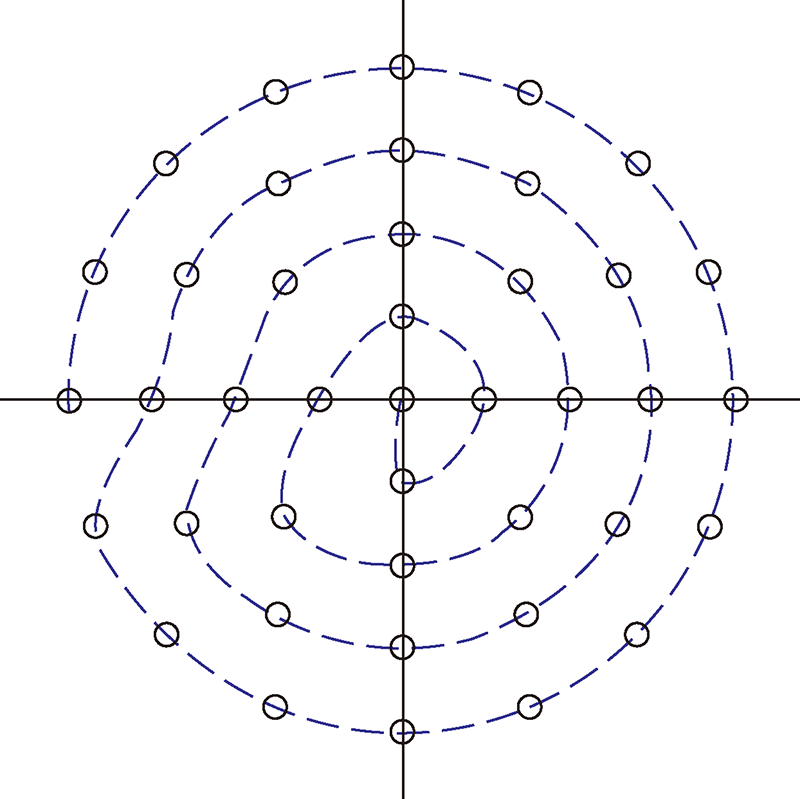
As the supporting technology of the digital Earth platform, the Discrete Global Grid System is a frontier and hotspot in the field of Earth information science and has been the subject of abundant researches. It can subdivide an ellipsoid without changing its grid shape. Each subdivision level has a regular structure, so there are strict transformation relations between grids at different subdivision levels, which provides a unified expression model for the fusion of geographic data with arbitrary distribution and different scales. In Discrete Global Grid System, triangular, diamond, and hexagon grid cells are widely used. Although each grid system has its own characteristics and can meet the application needs in various professional fields, but the differences among different grid systems inevitably hinder cross-field data sharing. Different grid systems have their own advantages and disadvantages in solving different scientific problems, and their corresponding spatial operation and computational analysis also vary in complexity. Furthermore, because the data representation of a single type of grid division is limited in multi-domain scientific problems, the development of an interoperation function of a multi-type Discrete Global Grid System is of great significance. The key to realize the interoperation of heterogeneous grid data sets is to establish a mechanism for the interconversion of different types of grid structure elements. Aiming at this problem, this paper studied the unified characteristics of structural elements in three Discrete Global Grid Systems, the relationships between vertices and grids, as well as the distribution patterns of the arithmetic layer. Secondly, taking the Quaternary Triangular Mesh as an example, the arithmetic layer encoding and generation method of the vertices were established while the uniformity of the vertices was analyzed. Then, according to the relationships between the vertices and grids, this paper proposed a uniform encoding and generation method for Discrete Global Grid System based on the vertices index. Finally, using this method, we generated the vertex model, triangle grid model, diamond grid model, and hexagonal grid model of surface elevation of Henan Province. We further verified the correctness and feasibility of the methods. This study provides a theoretical basis for exchanging, unifying, and standardizing the data in different types of Discrete Global Grid Systems and a new idea for the interoperability mechanism of different Discrete Global Grid Systems.
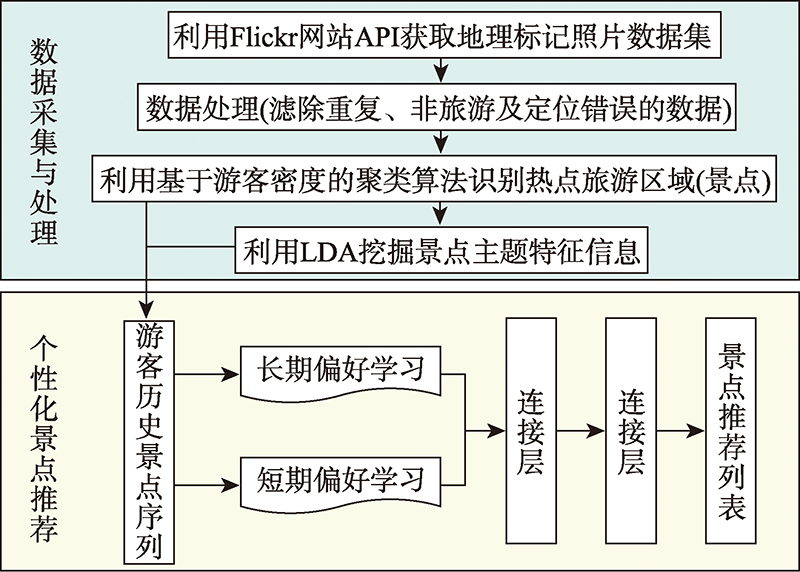
Personalized recommendation of tourist attractions for visitors is useful based on the vast amount of tourism information and data. In this paper, we use Flickr's geotagged photos from 2013 to 2018 in Hong Kong to identify tourist hot spots and reconstruct the tourism trajectory according to the tourist visiting order. On this basis, we propose a personalized recommendation method based on Latent Dirichlet Allocation (LDA) model and User's Long-term and Short-term Preference (L-ULSP) to address the problem that existing methods do not take into account the dynamic changes in visitor preferences during the travel process. In this method, the LDA model is used to obtain the feature information of attractions, and the correlation between attractions is explored. Then, attention mechanism is used to focus on the important information in the long-term sequence to capture the long-term preference of tourists, and LSTM is used to model the short-term sequence information to learn the short-term preference of tourists. Finally, the long-term and short-term preferences are weighted to obtain the final preferences of tourists to capture the dynamic changes of user preferences. The algorithm has the following advantages: (1) By mining the topic feature information of Geotagged photo text, the description information of attractions is added, which can capture users' travel preference more accurately; (2) The algorithm considers both the long-term and short-term preferences of users, and can learn the dynamic changes of users' preferences in the process of travel while modeling the sequence information of attractions. The experimental results show that: (1) The attractions recommended by the L-ULSP method outperform other existing methods in both Hit Rate and Mean Reciprocal Rank, two common evaluation metrics for recommendation algorithms, proving that the proposed method can effectively learn visitor preferences from a sequence of attractions and recommend the next attraction to visitors. It is demonstrated that the method can achieve good recommendation results in travel recommendation scenarios; (2) The comparison experiments between the model using long-term preference as the user's final preference and the model combining user's long-term and short-term preferences as the final preference further validate that considering both the user's long-term and short-term preferences can better learn the user's preference changes and thus improve the accuracy of recommendations; (3) This paper further compares the calculation efficiency of L-ULSP with different deep learning recommendation models based on RNN, and counts the running time of each model. The results show that this method is better than most methods in efficiency.
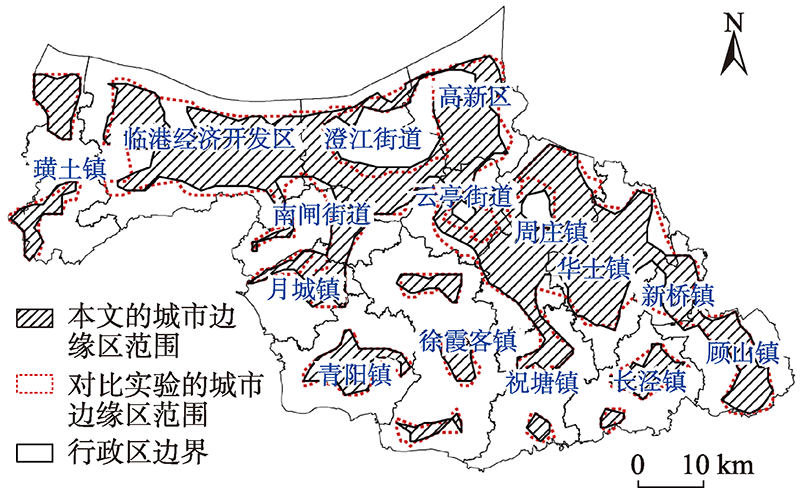
As a transition zone between the city and the countryside, the urban fringe area is not only a geographical space affected by both of the regions, but also an area shrouded in conflicts of interest. The rapid development of urbanization witnesses tremendous changes the urban spatial structure is undergoing. Therefore, studying the spatial scope of the urban fringe area is conducive to the assessment of the current situation of urban development, and is further significant for policy formulation, population management, and resource allocation in the urban fringe area. Thanks to the development of remote sensing and geographic information technology, the types, quality, and accuracy of geospatial data that are applied to depict the characteristics of the urban fringe area have been significantly enhanced. Considering this, this paper takes the spatial mutation characteristics of the urban fringe area as a starting point, and a method for mutation point groups detection, combining multi-indices fusion and wavelet transform, is adopted to distinguish the spatial extent of urban fringe area based on the optimal results by grid-scale evaluation. And then we use the Delaunay triangulation automatic edge length threshold to extract the boundary of the mutation point groups and to obtain the spatial range of the urban fringe area. Empirical analysis is conducted taking Jiangyin City as the research area. The main experimental steps are as follow: firstly, several basic data are selected, containing land use data, road data, night light data, and service-oriented POI data according to the analysis of the characteristics of the urban fringe area. These multi-source data are then standardized based on grids and entropy weighting method for weight determination. In this way, the eigenvalues of the discriminant index of the urban fringe area are calculated. Secondly, based on the spatial mutation characteristics, the wavelet transform is employed to extract the mutation point groups on the eigenvalue sequence, which can effectively improve the discrimination accuracy of the mutation point group. It is suitable for the non-closed circular urban fringe area and for avoiding the influence of human subjective factors. Then, the algorithm based on the Delaunay triangulation automatic edge length threshold is utilized to extract the boundary of the mutation point groups and to obtain the spatial range of the urban fringe area, which can provide a reference for optimizing the urban spatial layout. Finally, the extraction results in this paper are compared with those obtained by the classical methods, like the information entropy model and the comprehensive index model of land use degree. It is apparent to see that the results from classical methods are more chaotic and scattered, while the results in this paper are more complete and objective. Comparing the extraction results of this paper with the extraction results of different index methods employing land use data and administrative division statistical yearbook data to construct urban fringe identification indicators for mutation detection, this study discovers the overlap between them is 88.03%, which testifies the factualness of this method. In terms of the analysis of local details, the results of this paper are more in line with the actual situation. To verify the effectiveness of the method proposed in this paper, the landscape pattern indices are adopted to test the range of urban built-up area, urban fringe area and rural hinterland extracted by the method of this paper and the other different index method respectively. Considering the patch class size landscape pattern indices, the areas delineated by two methods are following the spatial characteristics. Meanwhile, the value of data calculated in the urban fringe area identified in this paper is all higher than the counterpart method given the landscape size landscape pattern indices, the patch density, maximum patch index, landscape separation degree, landscape fragmentation index, and Shannon diversity index. The spread and Shannon uniformity, however, are both lower than the comparison method. It can be indicated that the fragmentation and heterogeneity of the landscape in the urban fringe area identified in this paper is higher, the landscape distribution is uneven, and the socio-economic conditions are more complex, thus proving the effectiveness of this method is especially suitable for the extraction of non-closed circular urban fringe area.
Marine fishery is a high-risk industry with various marine disasters occurring frequently. Furthermore, maritime navigation and operating environment are complicated. Therefore, rapid maritime rescue is of great significance to protect the life and property of fishermen. Based on the grid coding of spatial division, this paper proposes a method to search the neighborhood based on the effective rescue distance and the location of the wrecked ship to find the ships that are adjacent to the wrecked ship and the closest neighbor for rescue. The effective rescue distance is set by the type and speed of the rescue ship. Then, the different code search lengths are set according to the effective rescue distances. In this paper, East Sea is set as the simulation experiment area, within which 10 000 ship locations are randomly generated. In terms of time retrieval efficiency and memory occupation, the experimental results show that, compared with the traditional method of calculating the distances among ships, the memory space occupation by the ship position data after encoding conversion in our proposed method is 56.47% less than that before the encoding conversion. In the meantime, the user retrieval calculation time after encoding is only 17.67% of that before the encoding. Therefore, after the ship position is encoded, the proposed method occupies a smaller memory and has a higher computational efficiency, which can greatly improve the efficiency searching for rescue ships in the vicinity of the wrecked ship.
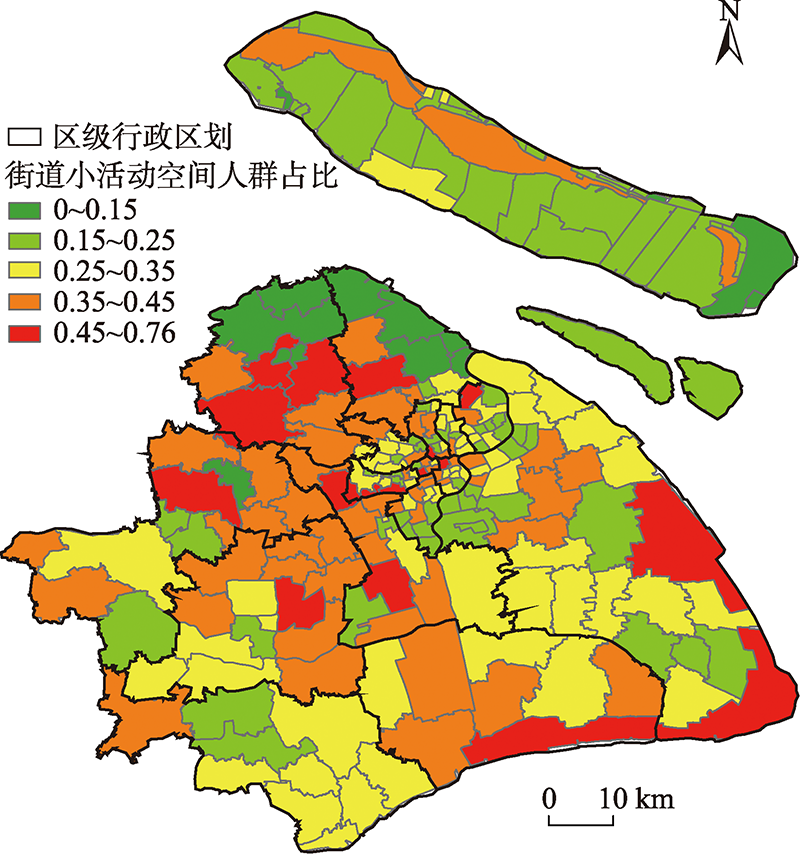
The People with Small Activity Space (PwSAS) refers to the residents with a small range of daily activity locations. Their demand for urban public resources is mainly concentrated in the area around their home. Analyzing the spatial and temporal characteristics of their activities can help to better realize the equalization and precise allocation of urban public resources. However, little attention has been paid to this kind of people in current researches. This study proposed a research method to identify the spatial distribution of PwSAS based on mobile phone signaling data. Firstly, we identified each user's home location and stay location. An indicator of HmaxD, the maximum distance from the home location, was proposed to measure the activity space range centered on the home location. This indicator was also used to filter the PwSAS. Secondly, we transformed the traditional trajectory into a new form in a "time-distance" coordinate based on the distance between the location of each record and the home location. An area-based approach was constructed to measure the similarity between different trajectories. Then an optimized hierarchical clustering algorithm was applied to identify typical activity patterns of PwSAS based on the similarity approach. Finally, the spatial distribution patterns were analyzed based on the home locations of the users belonging to each pattern. A signaling dataset, a typical type of mobile phone location data of Shanghai, was used to test the effectiveness of the method. We found that: (1) the area-based trajectory similarity method constructed based on "time-distance" framework can reflect the spatiotemporal characteristics of users' activities based on home location, and the hierarchical clustering algorithm merged level by level can significantly improve the efficiency of mining typical activity patterns. This means that the proposed method can effectively support the mining of the mobility patterns of urban residents; and (2) in the suburbs, the commercial centers and places with many factories or universities tended to have more PwSAS; While, the transition area in the suburban had less PwSAS. Therefore, the method proposed in this paper can be used to analyze the temporal and spatial distribution characteristics of people in a small activity area in a city and can provide support for the current large cities' decision to build community life circles.
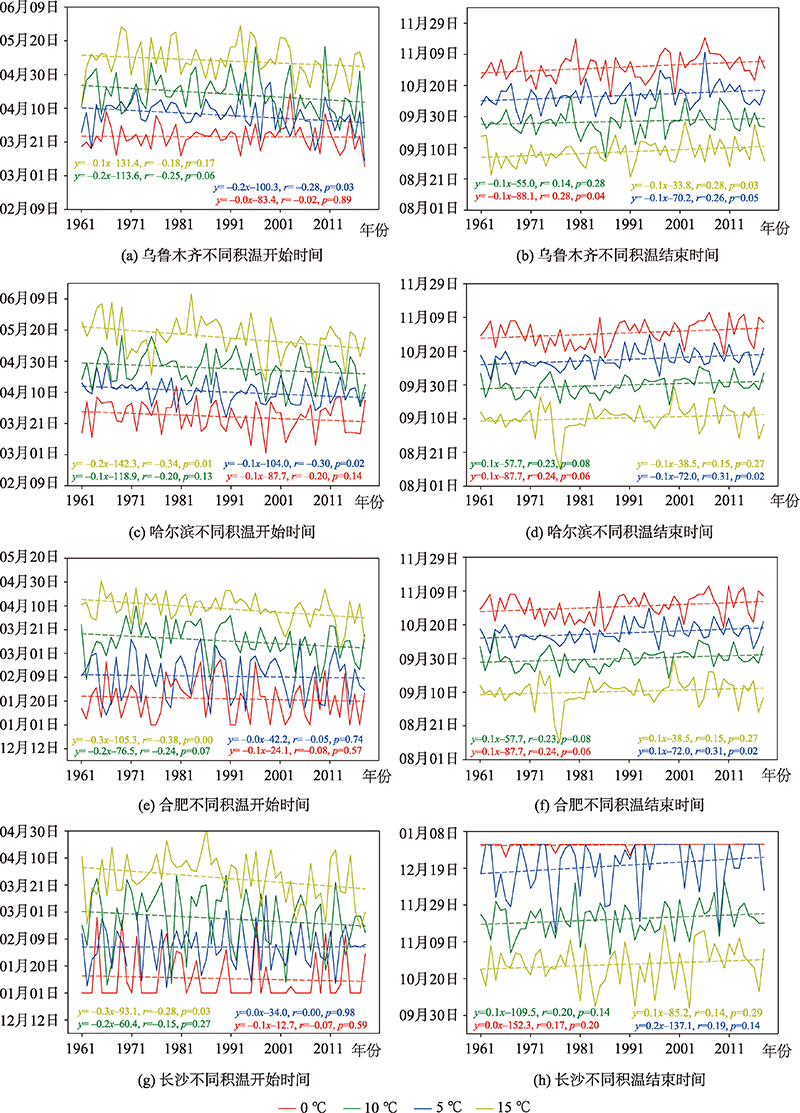
Accumulated Temperature (AT) could affect plants' phonological period and crops' yield and spatial distribution. AT is usually obtained by extrapolation of surface observations. However, AT would have greater spatial uncertainties in regions where the surface observations are sparsely distributed with complex terrain. In recent years, there have been some gridded meteorological data with well spatial representation. If studies used these high spatial resolution gridded meteorological data to directly calculate AT, the problem mentioned above would be solved. This study used the gridded dataset (CN05.1) with high spatial resolution and long term time series from 1961-2018 to analyze the spatiotemporal changes of the four Accumulated Temperatures (ATs) in mainland China with the thresholds of ≥0 ℃, ≥5 ℃, ≥10 ℃, and ≥15 ℃, respectively. The gridded dataset was made using more than 2400 surface meteorological stations across mainland China and was well extrapolated by the plate spline method. The main conclusions are summarized as follows: ① In mainland China, the four ATs (≥0 ℃, ≥5 ℃, ≥10 ℃ and ≥15 ℃) have low-value areas in the Qinghai-Tibet Plateau, Tianshan Mountains in Xinjiang, and Northeast China, but high-value areas in South China. Their spatial patterns are similar to those of the 2-m air temperature. ② All four ATs show significant increasing trends, especially in Inner Mongolia and Northeast China. ③ Due to changes in the AT spatial trends, the area of tropical and subtropical regions, identified by a threshold of 10 ℃, have a significant increase. In contrast, the area of mid-temperate and cold-temperate regions have a significant decrease. ④ During 1961-2018, starting time of four ATs had significantly advanced while the ending time had significantly delayed in both regional and point scales. The interval period of temperature transition ranges of 0~5 ℃, 5~10 ℃, and 10~15 ℃’s starting time has more severe changes in the Loess Plateau and Inner Mongolia. For interval period of ending time, Central China Plain changes greatly. These significant changes would impact the farming plan, crop physiology, plant diseases, and insect pests. In the future, the gridded dataset with more high spatial resolution and longer time series could be used to study the changes of accumulated temperature under climate change.
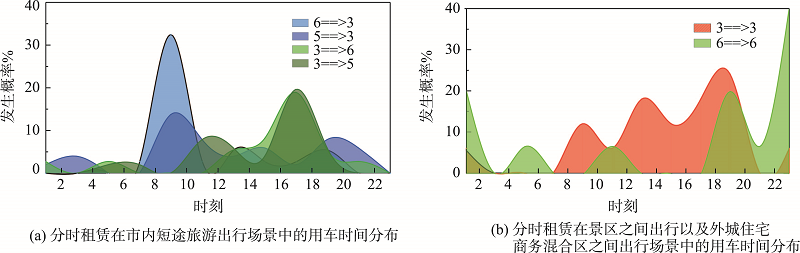
Both time-sharing rental cars and car-hailing are car sharing service, but with different scales. Finding differentiated travel scenes is conducive to time-sharing in seeking a foothold in the car sharing market dominated by car-hailing. This research uses car sharing records data combined with city's points of interest (POI) data to analyze the spatial temporal characteristics, and typical travel scenes of time-sharing and car-hailing in Beijing. Firstly, hierarchical clustering method was used to define the most distinguished clusters of city's grid cells based on POI data. Dunn index examined the optimal cluster number. Secondly, Origin and Destination (OD) locations of each car-sharing trip were labelled by the cluster types. The users' preferences were observed from OD cluster pairs appearing more frequently than others in the records. Thirdly, typical travel scenes were extracted by analyzing association rules of these cluster pairs. In the end, spatiotemporal patterns of typical travel scenes were tested. The findings of this study can be divided into three portions. Firstly, car-hailing mainly serves commuters and travels among business districts within the city. Secondly, time-sharing mainly serves non-commuter travels, and the representative travel scenes are short-distance city travel for tourism and Midnight travel in suburban areas. Many of these observed relationships are interpretable. For example, a short-distance city travel for tourism usually lasts half a day. Renting behaviors avoid the morning and evening rush hours of commuting. A midnight travel in suburban areas happens outside the city center, which usually lasts less than an hour since public transport is not available during that time. Thus, this travel scene seems to be related with urgent travel demands. Thirdly, the cost of time-sharing is far lower than that of other alternative modes and constitutes only 30%~50% cost of others, indicating that car sharing is beneficial when compared with other modes in these scenarios obtained in our research. These findings can serve as references and suggestions for time-sharing's promotion and operation process. The travel scenes mining method proposed in this study can be repeated in other car sharing researches.
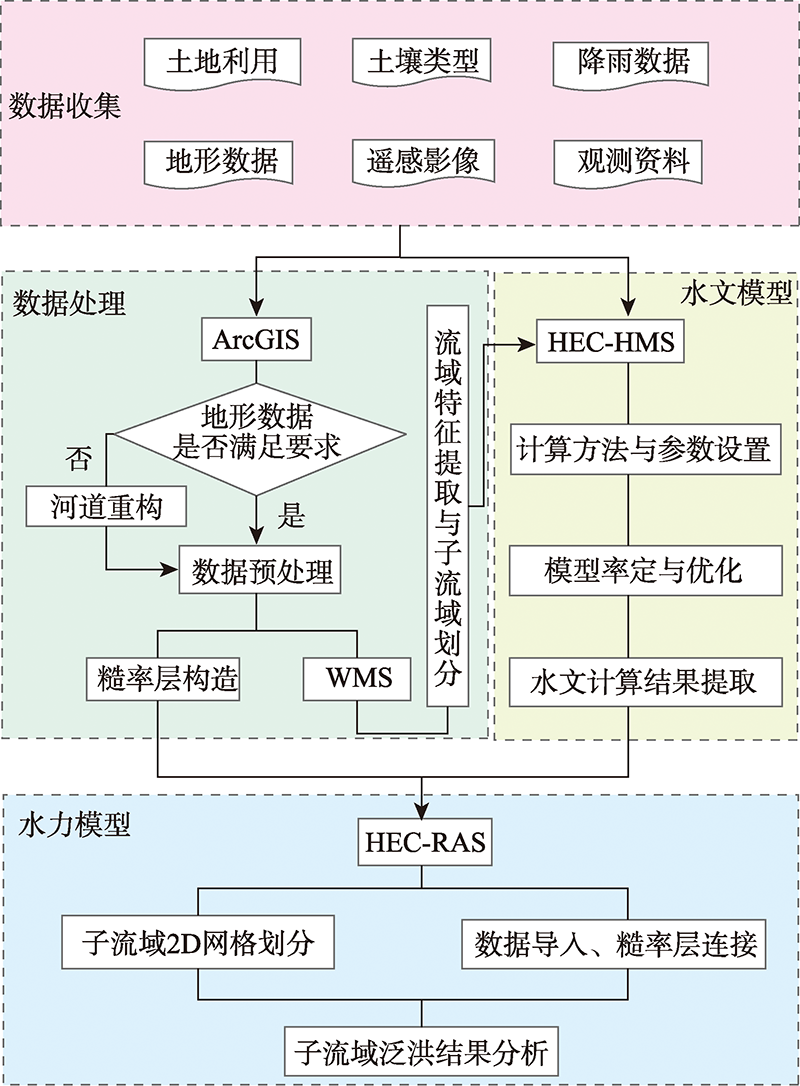
Flood researches include model simulation of runoff and inundation. In order to investigate the rainfall, runoff-producing, flow concentration, and inundation in a basin and to improve the accuracy of flood forecasting, this study established a hydrological hydrodynamic coupling flood forecasting model. Two HEC software modules, HMS and RAS, were used to integrate the two-dimensional hydrodynamic model with the traditional hydrological model. Taking Wende River Basin in Jilin Province as an example, the flooding process of 2017 "7·13" flood in Wende river sub-basin is simulated. Firstly, input data was preprocessed. A HEC-HMS hydrological model was established and optimized by multi-parameter calibration. Then, the hydrographic model output were assigned as the boundary conditions of a new RAS two-dimensional hydrodynamic model, which was used to simulate the inundation of key sub-basins. The hydrological simulation provided an optimal NSE coefficient of 0.988 for the hydrograph while the two-dimensional hydrodynamic analysis provided a maximum inundation depth of 9.3 m with a relative error of -5.2%. The simulated inundation map showed that plenty of cultivated fields in the upstream area were flooded with a water depth ranging from 0.5 to 2 m, and an average flow velocity smaller than 1 m/s. In the downstream area of Kouqian Town, the maximum inundation depth was close to 1 m, and the flow velocity was from 0.2 to 1.5 m/s, which was consistent with the field measurement. The simulated results from our hydrological hydrodynamic coupling model have high accuracy. It provides a meaningful technical method for flood forecasting in basins with complex hydrological and hydraulic conditions.
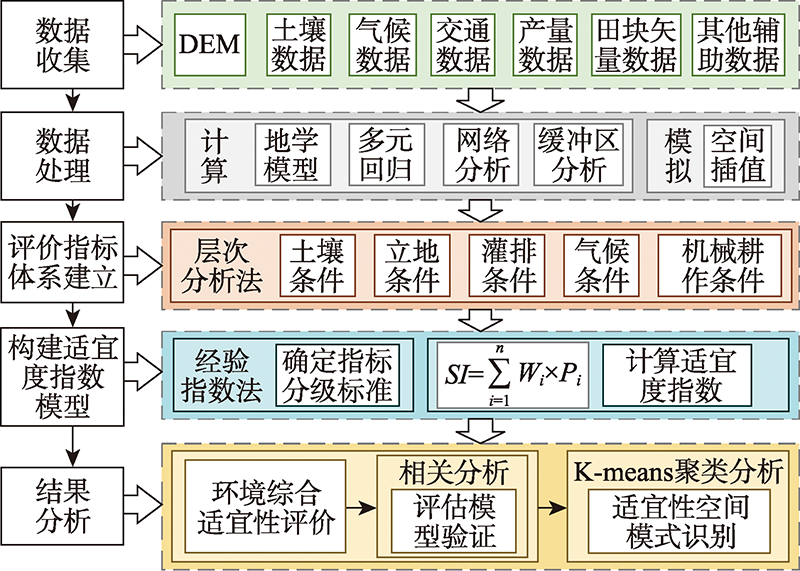
Carrying out the layout of the rice planting industry in a specific area is an important content of scientifically formulating the regional agricultural planting industry plan, and the comprehensive suitability evaluation of rice planting environment is the premise of rice planting industry layout. This paper takes Pucheng County, Fujian Province, a good grain and oil Demonstration County in China as the research area. The Analytic Hierarchy Model was used to construct a rice planting suitability evaluation system with 21 indicators in five categories: soil conditions, site conditions, irrigation and drainage conditions, climate conditions and mechanical farming conditions. The evaluation system uses geological models, regression models and spatial interpolation methods to calculate and simulate the spatial distribution data of evaluation indicators to form a 5 m×5 m resolution evaluation index grid data set. The suitability index model was established by using experience index method to carry out comprehensive suitability evaluation of rice planting environment in fine scale. Analyzing the rice yield of the actual samples and the comprehensive suitability index of the rice planting environment, it was found that the two were significantly positively correlated, which verified the correctness and feasibility of the evaluation work of this study. Finally, the K-means attribute clustering method was used to identify the spatial pattern of multi-dimensional environmental suitability of rice planting in the research area. The results show that: ① The cultivated land area with high, relatively and moderately suitable rice planting in the study area accounted for 84.4% of the cultivated land area of the whole county, and the sub-suitable cultivated land only accounted for 15.6%. The overall suitability of cultivated land was relatively high. ② The comprehensive suitability for rice planting and the suitability of various indicators are higher in the type I cluster area. Type II cluster area have higher comprehensive suitability for rice planting, but the suitability of irrigation and drainage conditions is very low. The comprehensive suitability of rice planting in type III cluster area is relatively high, but the suitability of site conditions and soil conditions are lower. Type IV cluster area have low overall suitability for rice planting, and the lowest suitability for irrigation and drainage conditions. This study can provide a method for the evaluation of the suitability of rice planting, and provide a basis for Pucheng County to carry out agricultural planting planning more rationally and scientifically.
Roof model reconstruction affects the quality of building complete model reconstruction, and the segmentation quality of roof point cloud is of great significance for roof model reconstruction. Aiming at the problems of wrong segmentation and over segmentation in the traditional RANSAC algorithm, this paper proposes an improved RANSAC algorithm to redistribute the point cloud, considering the location information of the point cloud. The algorithm eliminates the non planar points temporarily, and selects three points from the planar points set as the initial samples in the way of R radius neighborhood to fit them. The distance between the remaining points in the neighborhood and the fitting plane is calculated, and the neighborhood meeting the threshold requirements is classified as an effective neighborhood, three points with the minimum standard deviation are selected as the initial model, RANSAC algorithm is used to segment the roof point cloud. Aiming at the misclassification phenomenon in segmentation results, the distance between misclassification points and patches is calculated by k-nearest neighbor algorithm, and then the misclassification points are reclassified, at the same time, the angleθ and the distance d between patches are considered to merge the over segmented patches, the Euclidean distance based clustering segmentation algorithm is used to analyze the connectivity of the merged patches. By using the distance from a point to a plane and the consistency of the normal vectors between the point and the plane, the non planar points are redistributed. In order to verify the effectiveness of the algorithm, three independent roofs of complex buildings in Helsinki area of Finland and six roofs of buildings in a residential area of Shanghai are selected as experimental data. In the first group of experiments data, the average accuracy of the segmentation of roof patch is 92.17%, and the highest accuracy is 93.18%. In the second group of experiments data, the average accuracy of the segmentation of the roof patch is 87.82%, and the highest accuracy is 94.44%. The average standard deviation of the distance between the points on all the segmentation patches and the corresponding best fitting plane is 0.030 m. According to the above two groups of experiments data, 78% of the buildings have no over segmentation, and the average accuracy is 90%. The experimental results show that the algorithm has a high accuracy in extracting the roof plane slice, which can suppress the over segmentation and has a good anti noise ability.
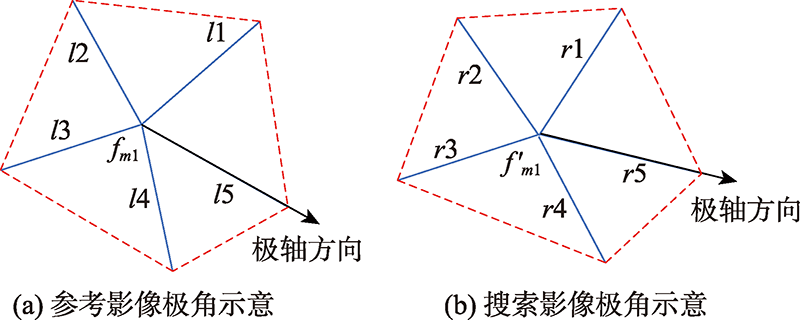
To avoid the problem of mismatches caused by initial matched points that may contain false matches during iterative dense matching based on corresponding points, a dense matching algorithm for remote sensing images based on reliable matched point constraint is presented. Firstly, to increase the number of initial matching points and expand the covering range of initial matching points, the initial set of matched points containing the matched Scale-invariant Feature Transform (SIFT) points and virtual corresponding points is constructed, where the virtual corresponding points are generated from the intersections of corresponding lines obtained by the line matching algorithm based on the matched SIFT points constraint. Secondly, the initial set of matched points is checked to remove the false matches using local image information and local geometry constraints in turn. This process first uses the local texture feature constraint constructed based on fingerprint information and gradient information to eliminate the mismatched points with low similarity, and then uses the local geometric constraint constructed by Delaunay triangulation to remove the false matches generated by similar textures, thereby obtaining the optimized set of reliable matched points. Finally, the Delaunay triangulation is constructed using reliable matched points, and the gravity center of the triangles satisfying the areal threshold is used as the matching primitive during the dense matching process. The matching based on the epipolar constraint and affine transformation constraint is performed iteratively to obtain the dense matching results. This paper used four sets of forward and backward viewing data of ZY-3 to perform parameter analysis experiment and comparative analysis experiment to prove the effectiveness of the proposed dense matching algorithm. The results of parameter analysis experiment show that the reliable matched points can be obtained when the weighted index, texture feature similarity threshold, and local geometric similarity threshold are 0.3, 0.95, and 0.85, respectively. The average matching accuracy of the reliable matched points on the four sets of data is improved by 19% compared with the initial matched point. Meanwhile, the results of comparative analysis experiment show that the dense matching algorithm based on the reliable matched point constraint can effectively avoid the error propagation, which has higher matching accuracy compared with the comparison algorithms selected in this paper. The average matching accuracy of the four sets of data is 95%. Therefore, the algorithm can obtain better dense matching results by effectively eliminating mismatched points.