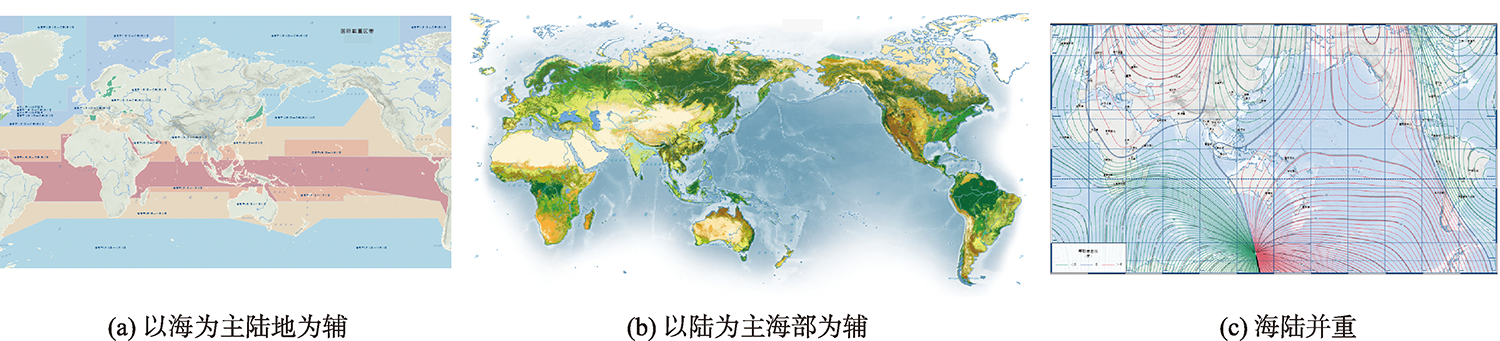
The design and compilation of comprehensive maritime atlas integrating sea and land information serve the national development initiative of "building a marine community with shared future", it is also an important thrust to promote the culture fusion and friendly cooperation between marine and land areas. Therefore, it has attracted widespread attention in the field of cartography. This paper firstly discusses the special characteristics of marine-land integrated atlas through the comparative analysis with nautical charts and land atlas, referring to the thematic topic, map scale, map projection, and geographic subdivision. Then it proposes a top-level design of fundamental geographic framework for the comprehensive maritime atlas from the perspective of marine and land combination, including both the content system and construction strategy. Next, taking "Maritime Atlas of the World" as an instance, the paper puts forward the specific establishment of fundamental geographic framework in details: (1) the coordinate system of WGS84 should be used for medium and small scale maps, while the CGCS2000 should be used for large scale maps; (2) according to the map thematic and content, cartographic area, and deformation needs, mapping units can use various projections such as qual difference latitude parallel polyconic projection, Mercator projection, Goode projection, and so on; (3) six types of geographic base maps are adopted, i.e. typical reginal map, land map, sea map, navigation area map, and port map, their contents are generated in series by further selection and simplification; (4) all the mapping units should be arranged to the north, and map layouts are various with flexible geographic subdivision and map subdivision. The “Maritime Atlas of the world” complication practice shows that this proposed fundamental geographic framework can well support the integration of marine and land information into a cohesive coordinative manner.
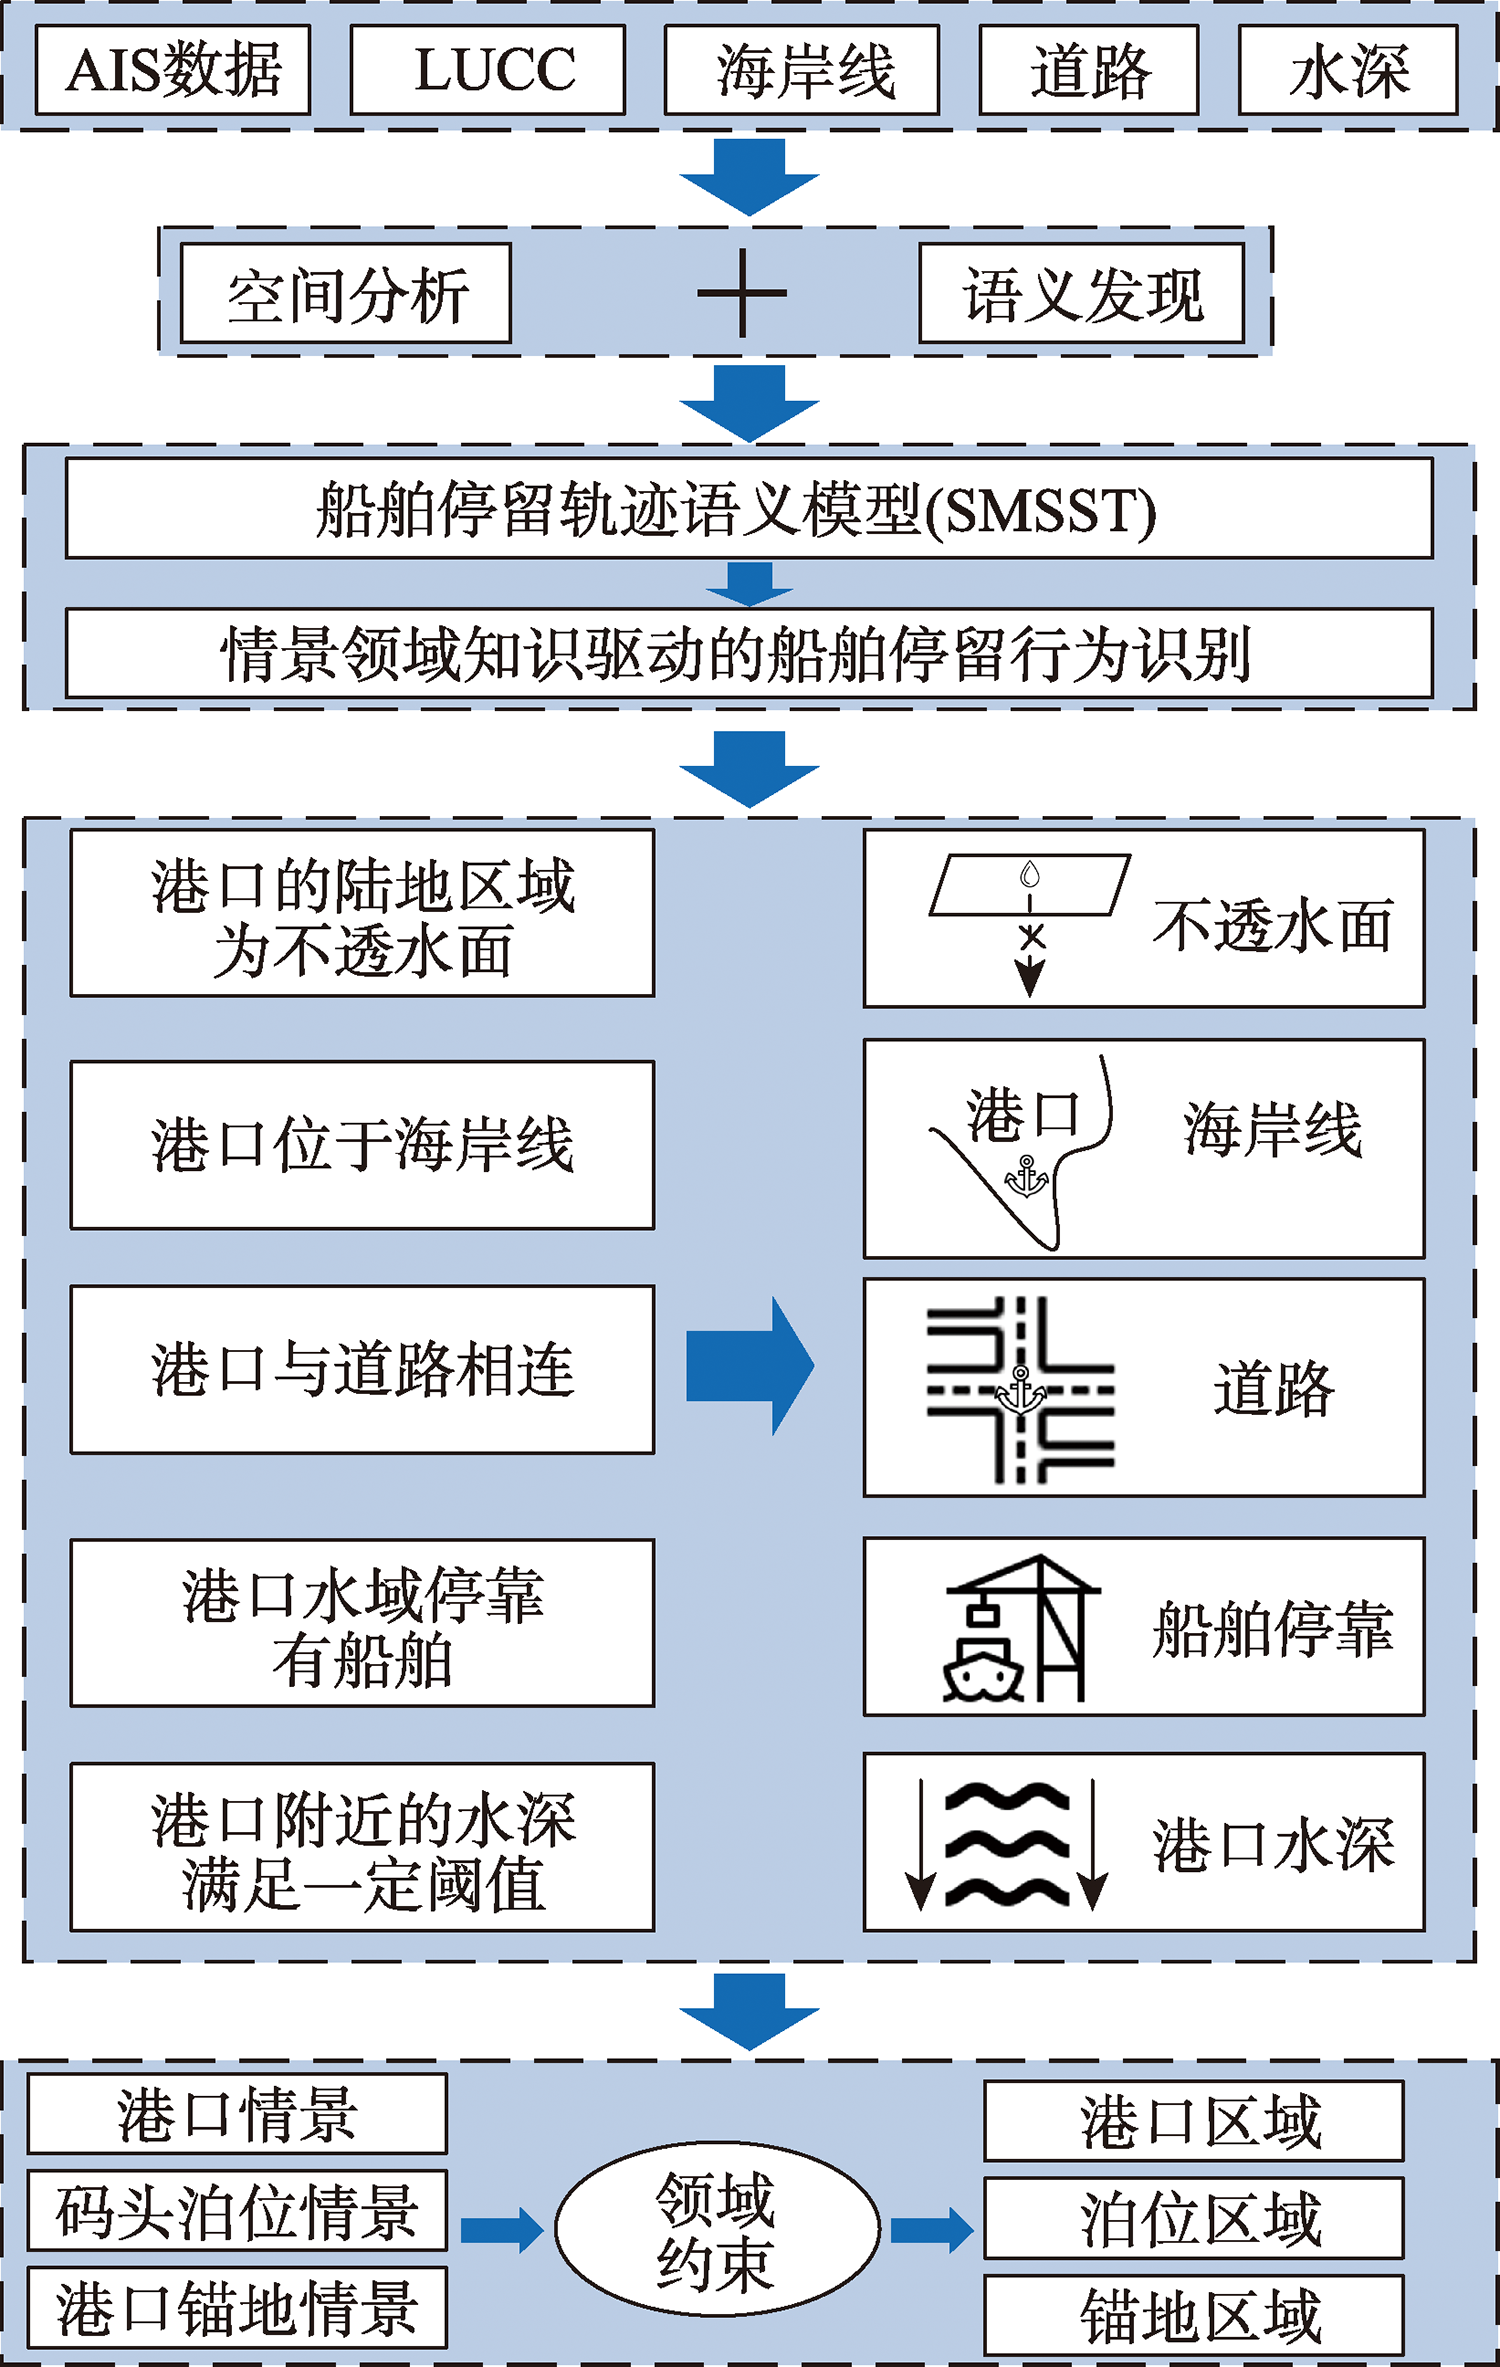
Harbor detection is the top priority of maritime ship supervision, and the ship activity information acquired by Automatic Identification System (AIS) can provide high temporal and spatial accuracy of ship activity information for harbor detection. In order to explore the application of AIS data in harbor detection, a harbor detection method based on multi-source data and semantic modeling of ship stop trajectory is proposed. Firstly, the semantic model of ship stop trajectory is constructed through data mining and semantic information enhancement to identify ship stop trajectory in the harbor area. Secondly, a classification model based on random forest is established to classify ship berthing trajectories and ship anchoring trajectories, and then harbor berths and anchorages are extracted by using spatial step-by-step merging method. Finally, the data of ship berthing trajectories, roads, coastline, bathymetry, and land use and land cover data are integrated to identify harbor objects considering situational-domain knowledge. Based on over 83 million AIS trajectory records of 96,790 ships in 2017, the proposed method is applied to detect harbor object in the South China Sea study area. The experimental results show that the overall classification accuracy of ship stop behavior is 0.9477 and the Kappa coefficient is 0.8948. 447 harbor areas in the South China Sea study area are extracted, and the overlay verification results with Google Earth images show that the extraction results are all located within the real harbor images. In addition, compared with the 24 harbor locations in the South China Sea region contained in the Natural Earth dataset, the integrity of the extraction results is greatly enhanced. Therefore, the harbor detection method based on multi-source data and semantic modeling of ship stop trajectory has high accuracy and completeness for harbor detection. Meanwhile, the harbor areas extracted by this method can provide target areas for harbor identification based on remote sensing images, thus improving the efficiency of dynamic identification of harbor object in a large region or even globally.
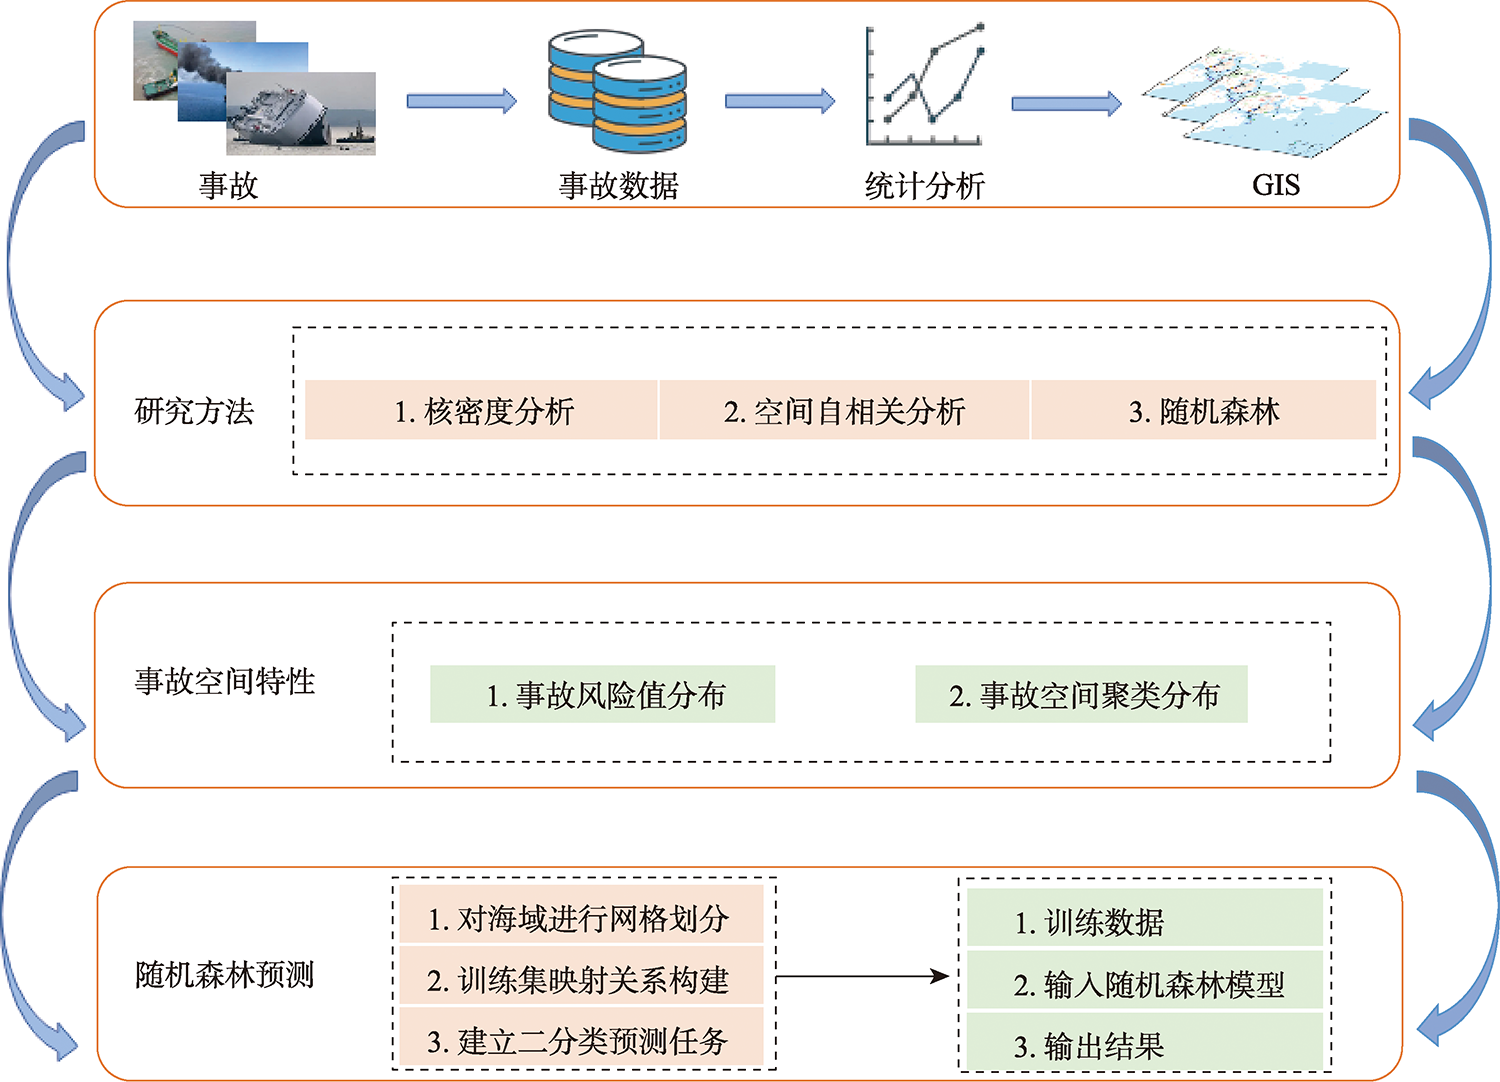
Safety analysis based on the spatial distribution of maritime traffic accidents is of great significance for maritime traffic safety management. In this paper, we obtained the potential risk areas of maritime traffic accidents in Xiamen waters through extraction, analysis, and prediction of spatial distribution of maritime traffic accident data in Xiamen Port from 2008 to 2020. The original accident data were firstly used for spatial orientation in GIS software to form a visualized spatial distribution map of accident points. Then, the areas where maritime traffic accidents frequently occur were identified using the kernel density analysis. In addition, the spatial autocorrelation analysis method was employed to obtain the spatial distribution characteristics and specific gathering points of accidents in this region. Finally, we performed standardized grid segmentation on the data in the target waters based on the spatial distribution characteristics and predicted potential risk areas of maritime traffic accidents using a machine learning algorithm (i.e., random forest). The kernel density analysis results showed that Xiamen Bay and Western Sea were high risk areas in terms of accident frequency. Moreover, the spatial autocorrelation analysis results indicated that in terms of spatial distribution characteristics, the spatial distribution of Xiamen Port showed aggregation characteristics and was positively correlated with time. For specific spatial gathering points of accidents, Xiamen Bay and Western Sea were still the centers with a high incidence of accidents. Furthermore, the risk prediction model of Xiamen Bay and its surrounding waters demonstrated that potential risk areas of maritime traffic accidents were mostly located at the intersection of coastal and estuary areas, because there were frequent crossings of vessels and fishing boats. The results of this study show that based on the distribution characteristics extracted and grid analysis of geospatial data, our proposed method has a good effect in predicting maritime traffic accidents by use of machine learning methods.
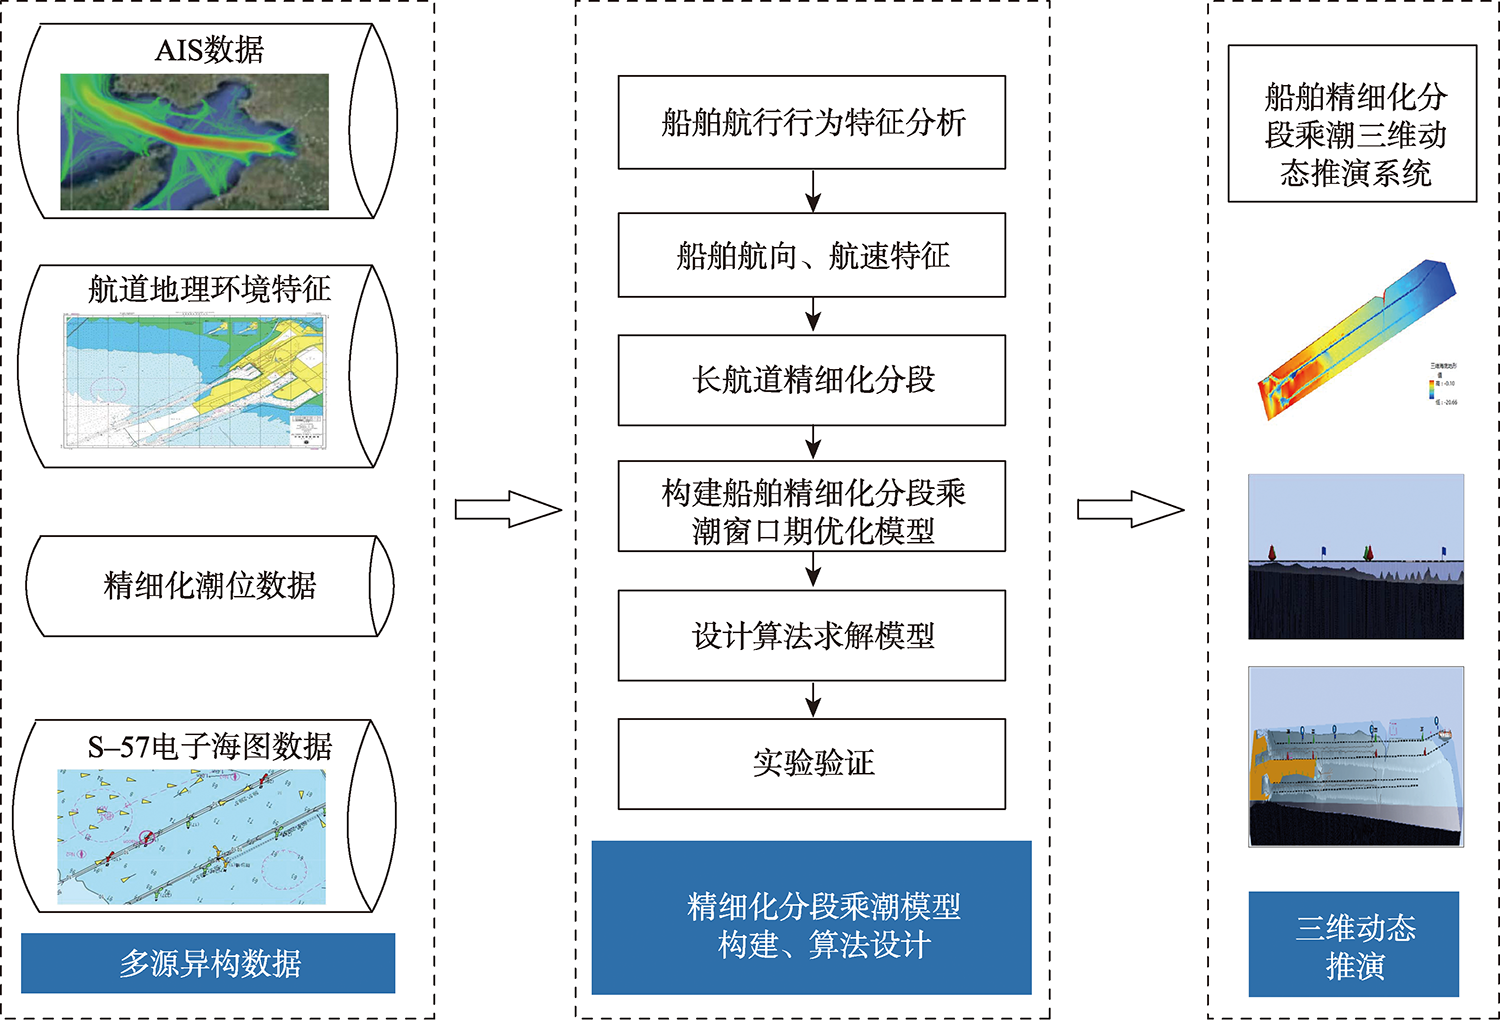
Aiming at the problem of insufficient time for large vessels to enter the port by tide in the long channel, this paper proposed a refined segmented tide riding model for large vessels based on multi-source maritime data such as AIS data, port tide data, electronic chart data, and so on. Firstly, based on the AIS data, the K-medoids algorithm was used to mine the characteristics of the vessel's tide riding behavior, identify the key points of the vessel's tide riding trajectory, and calculate the key vessel position points of the vessel's tide-riding behavior change. Then, combing the geographical environment characteristics of the long channel and the characteristics of the navigation behavior of the vessels, the long channel was refined and segmented. Based on the port tide data, a refined calculation model of the vessel's segmented tide riding window period was constructed. Secondly, we designed an adaptive arrangement algorithm for the tide riding duration to solve the longest window period of the vessel's tide riding. Taking the Huanghua Port integrated port area as an example, the refined segmented tide riding model proposed in this paper was verified. Finally, based on the electronic chart data, the geographic information system platform was used to realize the fine segmented three-dimensional (3D) dynamic deduction of the vessel's tide riding, to further verify the safety of the vessel's tide navigation. The results show that the model can effectively increase the window period for vessels to enter the port by tide and improve the efficiency of ships entering the port by tide. This study can provide theoretical guidance for the port and shipping management departments to formulate vessel entry plans.
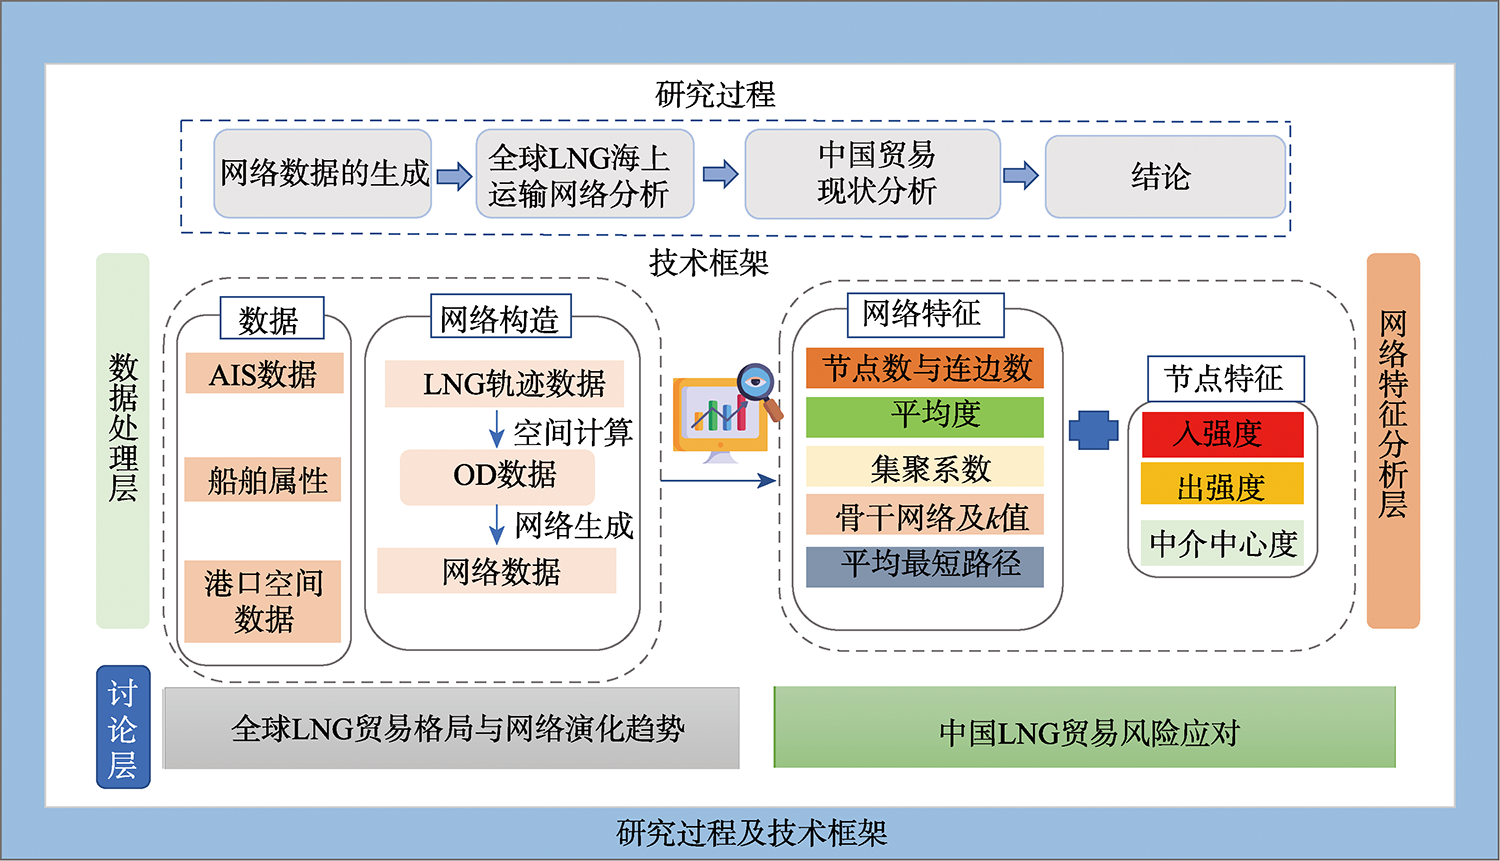
With the proposal of "carbon peak" and "carbon neutralization", Liquefied Natural Gas (LNG) has gradually garnered the attention of energy market as a clean and low-carbon energy. In this context, it is of great significance to analyze the evolution mode of the LNG maritime transport network, so as to master the dynamic of global energy pattern and the status of China's import trade. In this paper, the evolution trend of the global LNG maritime transport network from 2018 to 2020 is explored based on the ship trajectory data and complex network theory. Meanwhile, according to China's trade status, LNG import sources, distribution of main import ports, and the inflow status of the top three import ports in China are analyzed. The results show that: (1) From 2018 to 2020, the global LNG maritime transport network expanded with a “scale-free” characteristic. The "breadth" and "depth" of node connections in the backbone network are increasing, and there is a risk that global LNG trade will become monopolistic; (2) The countries along the "Belt and Road Initiative" actively participated in trade. The numbers of import ports and import voyages in Central and North America, South and Southeast Asia have significantly increased, and in particular, Sabetta and Bonny ranked the top eight globally according to their export volume; (3) The average shortest path length of the network is increasing year by year from 2018 to 2020, and the new mode of "transshipment port" business is gradually emerging. By 2020, 21 transshipment ports have participated in LNG trade, and the United States occupies the dominant position in global transshipment; (4) In recent three years, China's LNG import scale has developed rapidly, and the flow direction of the maritime transport network tends to be diversified. However, Australia is still the main LNG source for China. In terms of import volume, the ports of Tianjin, Shenzhen, and Yung'an rank the top three in China, and the pressure to reduce carbon emissions has prompted the economically developed regions to build terminals and increase imports.
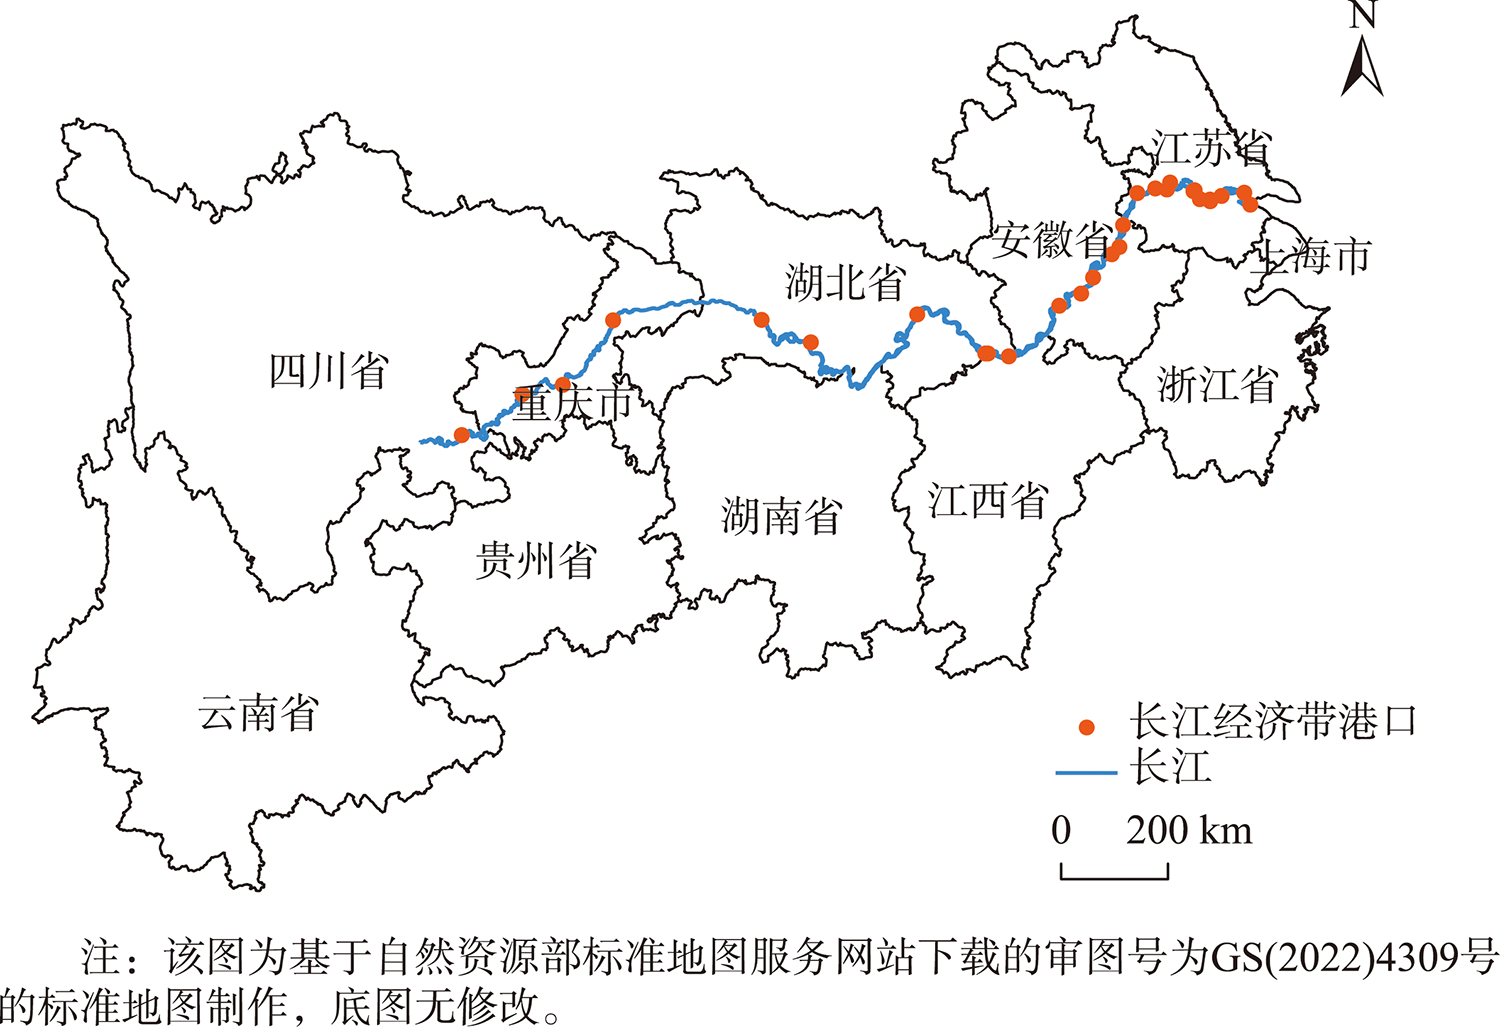
Inland river ports are important nodes of inland river shipping links. Evaluation of the regional advantage of inland river ports is of great significance for port infrastructure construction in the Yangtze River Economic Belt. Taking the inland ports along the Yangtze River in 2021 as the research object, the original model is improved by using multi-source data and combining three indicators within the radiation range of inland ports on the Yangtze River. The AHP-EWM model is used to calculate the location advantage of 28 ports along the Yangtze River in the Yangtze River economic belt. Results show that: (1) except Chongqing and Wuhan, the density of traffic network in the port radiation range beyond Jiangsu province is relatively low. From the perspective of the influence of traffic networks, its distribution is relatively balanced, and the value is relatively similar. The influence of the spatial distribution of urban economics is disordered; (2) The spatial pattern of freight ports in the Yangtze River Economic Belt is characterized by "three centers, one cluster" according to their regional advantages and spatial distribution; (3) By dividing inland ports at the provincial level along the Yangtze River, it is found that the regional difference of dominance between the three ports in Jiangxi Province is the smallest, and the overall degree of dominance is also low. The result of Anhui Province is similar to Jiangxi Province. The overall degree of dominance of ports in Jiangsu Province is high with a small regional difference. The regional dominance of ports in Hubei Province has the largest difference, indicating that there might be issues such as unbalanced infrastructure construction that needs to be improved in future. The research results can provide guidance for infrastructure construction, road traffic planning, and port site selection of various ports in the Yangtze River Economic Belt, and help open up the "last kilometer" of railway and high-grade highway access to ports.
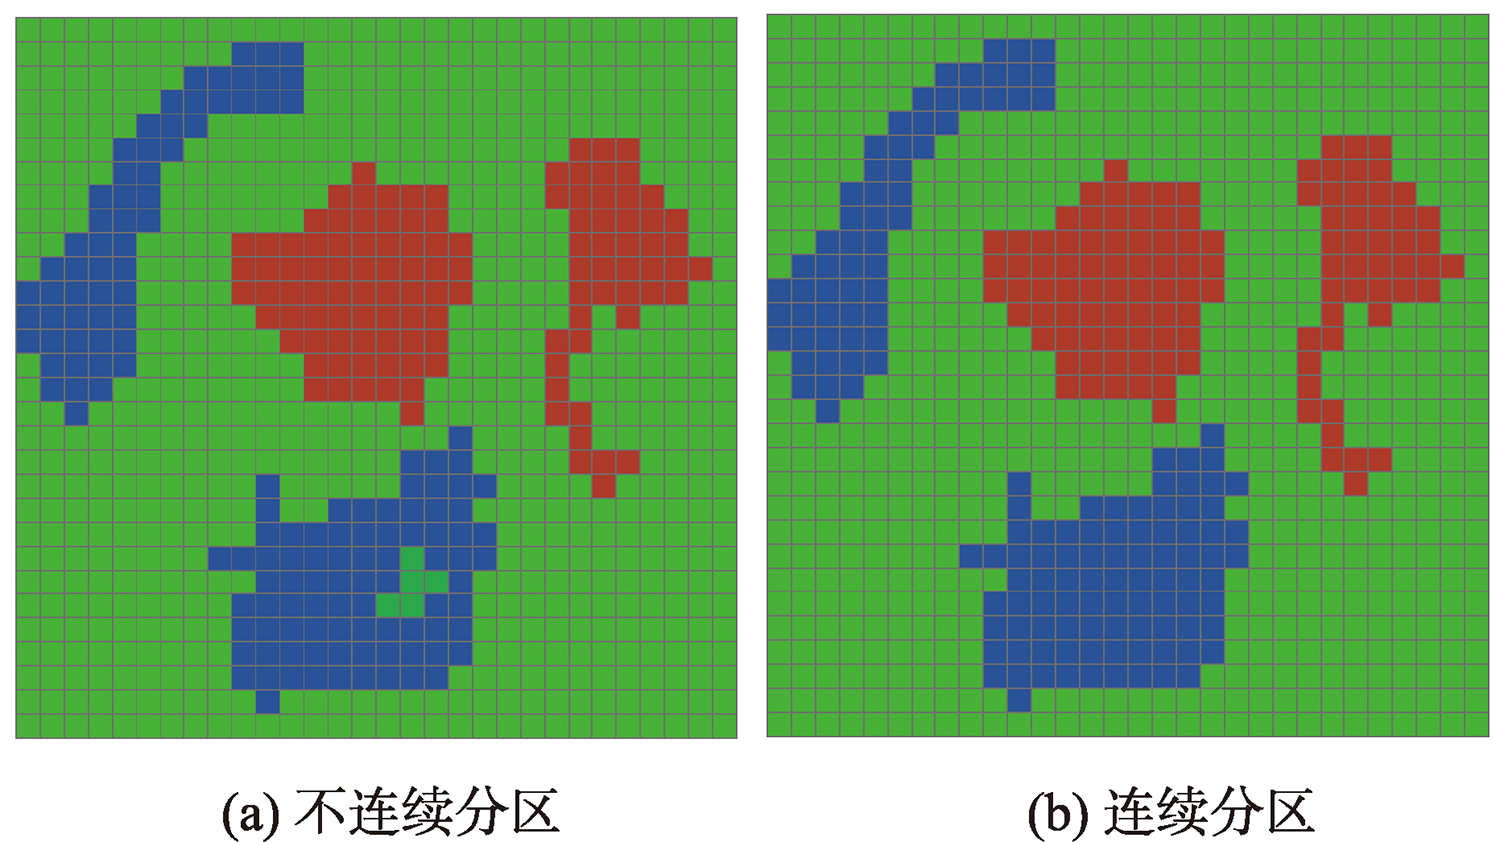
Regionalization is to divide a large geographic area into a number of homogenous and spatially contiguous regions. It has been widely used in fields such as geography, cartography, ecology, environment management, socio-economy, and urban planning. Since the general regionalization problem has been proven to be NP-Hard, various models and solution methods for regionalization have been proposed since 1960s. The regionalization methods can be classified into four categories: exact, clustering-based, heuristic, and tree-based. However, the commonly used regionalization algorithms, such as AZP, AZP-SA, AZP-Tabu, ARISEL, SKATER, and REDCAP, are difficult to solve the problem in an effective and efficient manner simultaneously. An improved iterative local search algorithm is proposed in this paper for the regionalization problem. There are six key mechanisms in the new algorithm: the search of moving boundary units to improve the current solution, the center-based approach to accelerate the computation of solution objective, the solution perturbation to escape from the state of local optimum, the frequent update of regional centers to reevaluate the solution, the population-based search to explore larger solution space, and the region repair to keep spatially contiguous regions. The regionalization experimentations on 55 benchmark instances show that the proposed algorithms outperform ARISEL algorithm and SKATER algorithm in terms of sum-squared errors and adjusted Rand index. A case study of the climate regionalization using 60 attributes illustrates that the improved ILS is effective to delineate climate regions, and outperforms the well-known algorithms such as SKATER, REDCAP, and ARISEL.
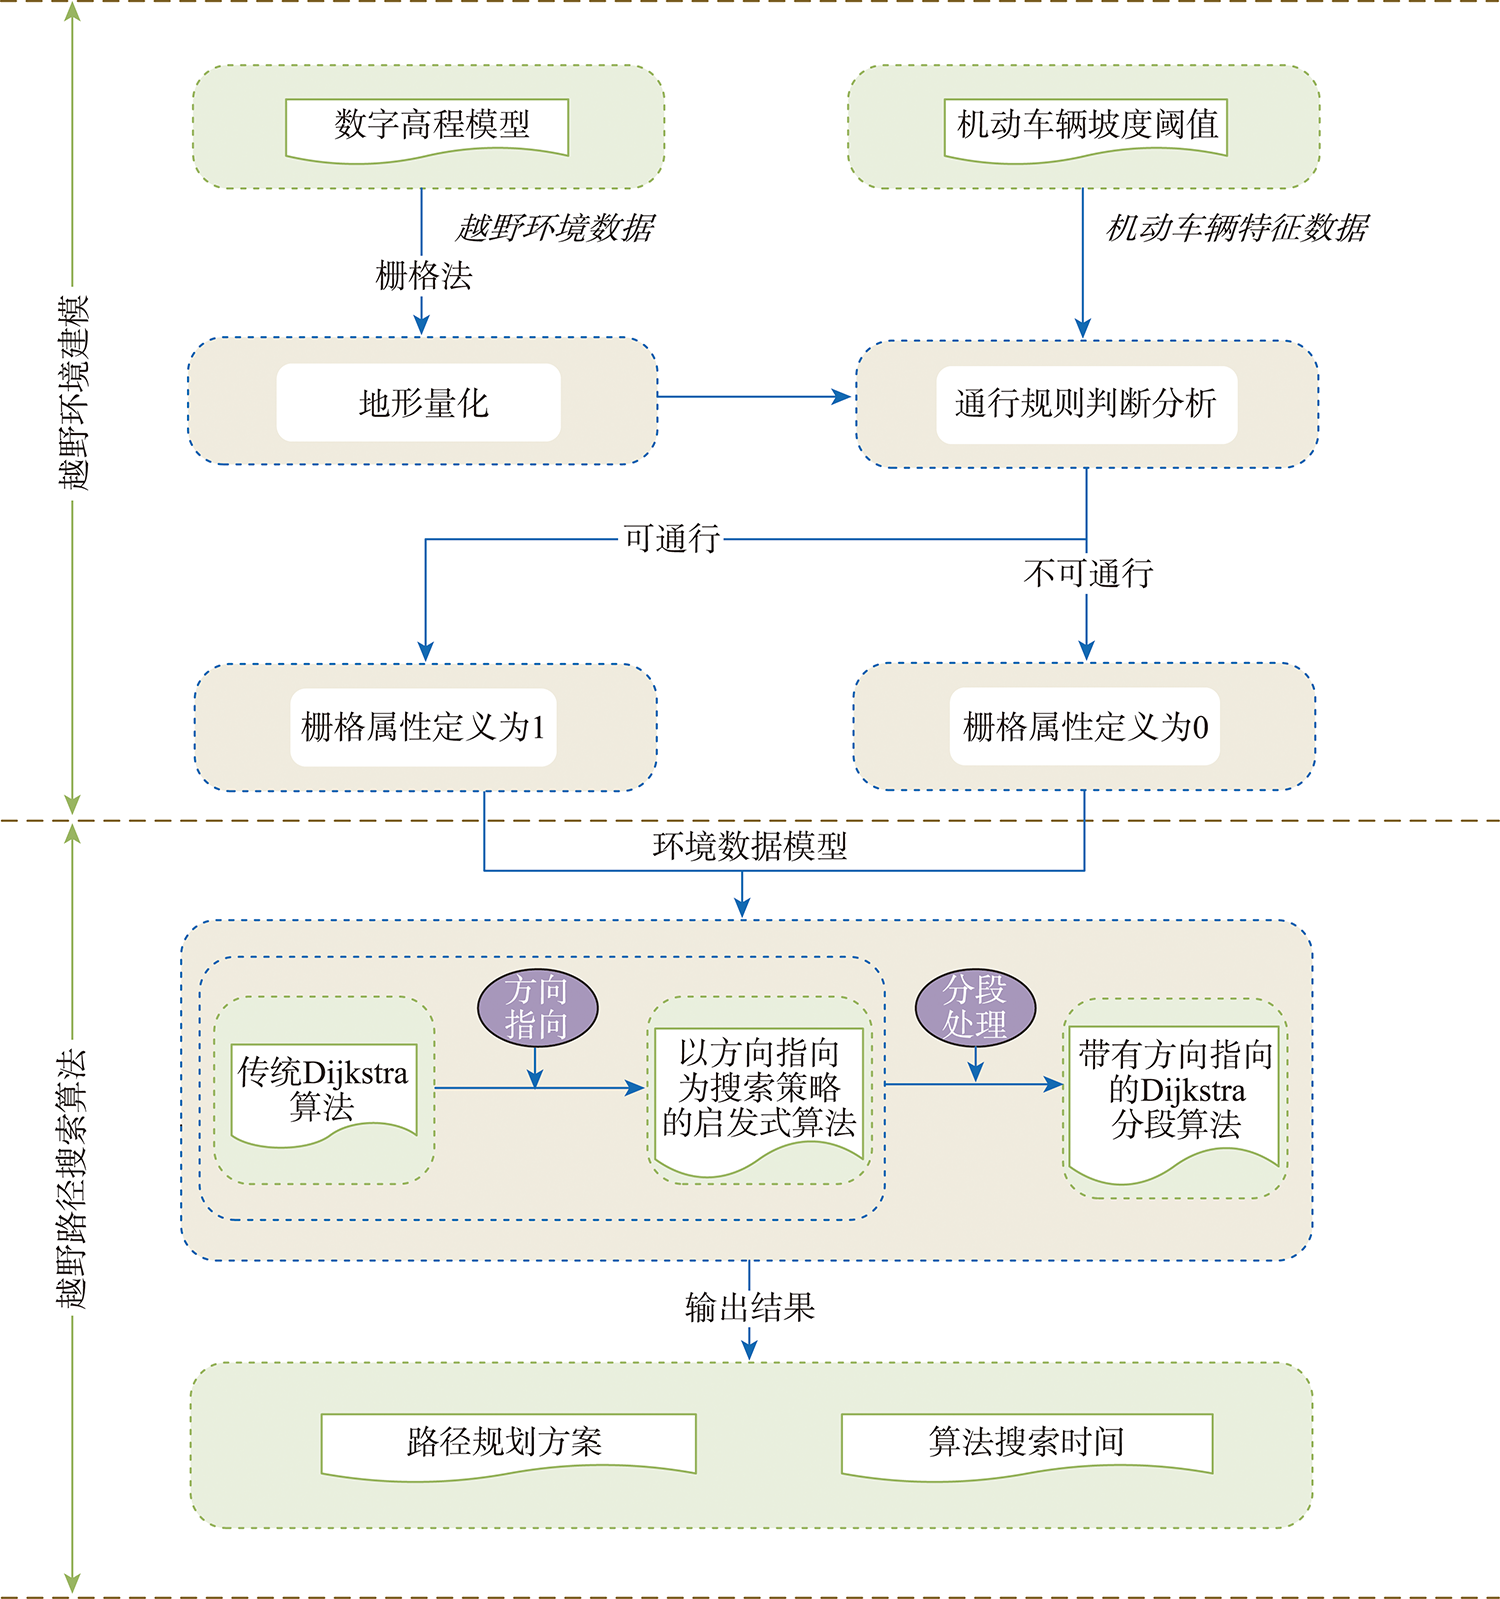
The fast path planning of motor vehicles in the off-road environment is of great significance in the fields of field search and rescue, emergency rescue, and military operations. In the above scenarios, with the increase of spatial dimension, the computational complexity of traditional path search algorithms increases exponentially, and may not be able to be calculated within a given time. To solve the above deficiencies, this paper proposes a heuristic algorithm with directional pointing as a search strategy, combining the characteristics of off-road path planning that is not restricted by road network traffic and the shortest straight line between two points. In order to further improve the solution quality, a Dijkstra segmentation algorithm with directional pointing is proposed. This algorithm finds the optimal path through Dijkstra algorithm in a low-precision environment model and divides the path into segments. Each segment is oriented in a direction. Route search is performed as a search strategy to quickly plan passage schemes in long-distance off-road route planning. In order to verify the effectiveness of the algorithm, this paper uses the digital elevation model data of a city in Shanxi Province to conduct experiments and introduces the window movement method to perform preliminary slope calculation and trafficability analysis of the terrain, build an off-road environment model, and call the path search algorithm to carry out path planning. The experimental results show that the computational efficiency of the algorithm proposed in this paper has been greatly improved compared to the Dijkstra algorithm, and the length of the planned path is close to the optimal solution.
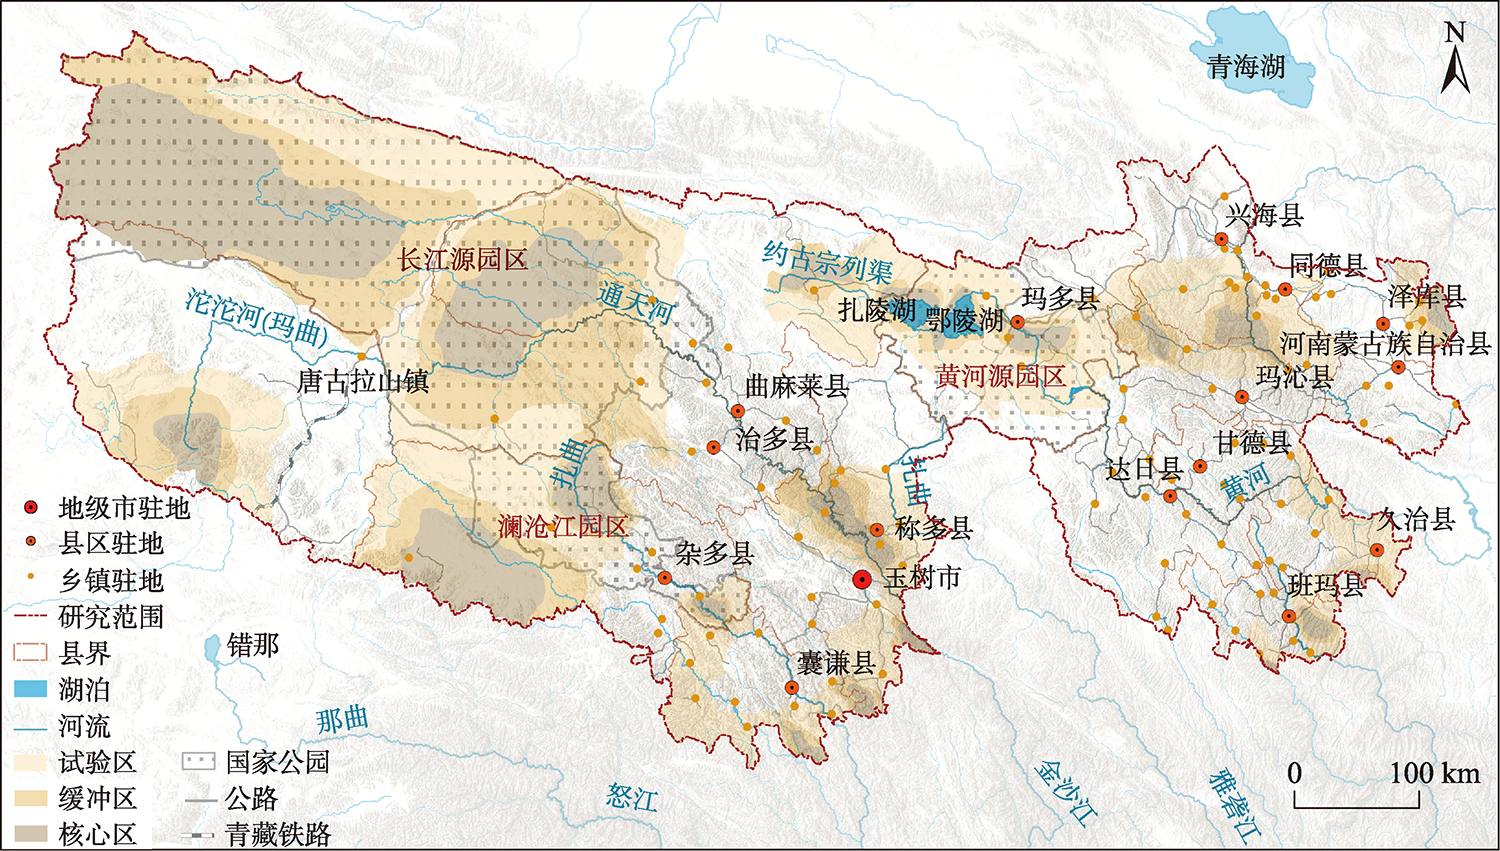
The Three-River Headwaters region is an important national ecological security barrier and ecological civilization demonstration area. It is of great significance to quantify the evolution characteristics and driving mechanism of spatial patterns of the ecological space, agricultural space, and urban space in this area. Firstly, the change characteristics of every single land use type from 1992 to 2020 were analyzed. Secondly, combining with land classification and quantitative evaluation, the agriculture and animal husbandry space was identified, and the " three-function space " was further defined and its evolution characteristics were analyzed. Finally, the geodetector was used to analyze the driving mechanism behind the changes. The results show that: (1) The urban space growth rate in the Three-River Headwaters region was 774.56%. The decrease of ecological space and agricultural space was very small, but the dynamic transformation was obvious. The turning point of ecological space and agricultural space changes is 2005 and 2015, with a u-shaped trend and an inverted U-shaped trend, respectively; (2) There are four types of cross-transformation in the study area. The area of ecological space converted to agricultural space is 1154.1km², and most of the transformation occurred in the dominant climate change zone, with a large amount but a slow rate. The area of agricultural space to ecological space is 1140.8km², which is mainly distributed in areas with climate and human activities, and the transformation speed is obviously faster. The total amount of agricultural space and ecological space converted into urban space is 41.0 km² and 12.3 km², respectively, mostly distributed in central cities and towns. The transformation rate shows a trend of "slow growth, faster growth, and slower growth" in three stages; (3) The basic geographical condition is the primary driving force of the evolution of " three-function space ", which restricts the location and direction of the cross transformation. Social and economic factors are the key driving forces of evolution and have a significant impact on the scale and speed of cross transformation. After 2005, ecological protection policies began to play an important role, especially in the process of "ecology-agriculture" cross transformation. This study provides a new idea for the downscaling of the main function of animal husbandry areas and the control of territorial space usage, which can be applied to the decision-making of ecological environment protection and the formulation of territorial space planning at all levels in the Three-River Headwaters region.
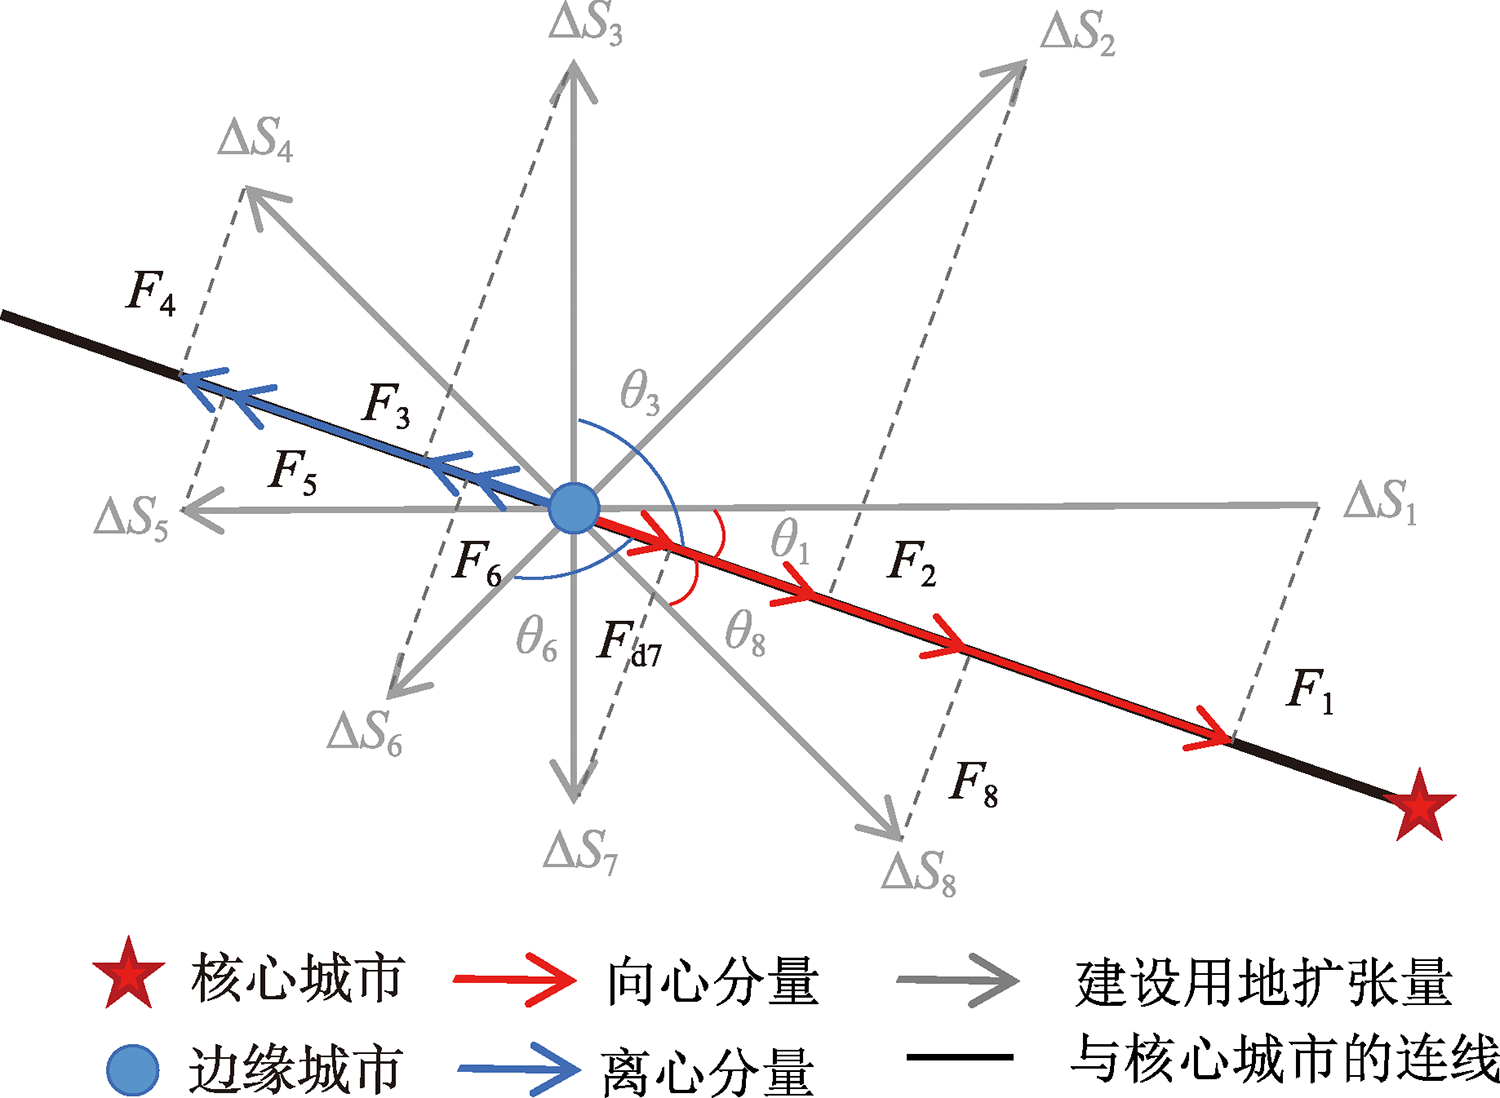
Exploring the urban spatial expansion and temporal change in metropolitan areas can reflect the dynamic spatial relationship between the core city and the peripheral areas. It can provide a scientific basis for formulating guidelines and policies for metropolitan areas. Considering the association between the core city and the peripheral areas in a metropolitan area, the paper constructs the Centripetal Expansion Index (CEI), which includes the expansion intensity and direction. Using the global artificial impervious layer data product (i.e., GAIA), this paper analyzes the expansion characteristics of urban development area of cities and towns in Zhengzhou metropolitan area from 2000 to 2018. And using the multiple logistic regression model, the paper further analyzes the factors that affect the centripetal expansion of cities and towns. The results show that: (1) The CEI provides a method support for revealing the effect of core city on the peripheral areas and measuring the expanding trend of the peripheral areas towards core city in metropolitan areas; (2) The Zhengzhou metropolitan area has experienced rapid spatial expansion in the past 20 years. Though the DEI index and CEI index of the peripheral areas fluctuate over time, Zhengzhou metropolitan area has a core-periphery development pattern. Most of the peripheral areas except the central urban areas of individual prefecture-level cities and their subordinate counties, are significantly centripetal and increase over time. The core city has a significant effect on the peripheral areas; (3) The differences in both per capita GDP and urbanization rate between core city and the peripheral areas are important factors influencing the centripetal expansion of the peripheral areas, while administrative affiliation, administrative rank, and proximity to core city also have influence on centripetal expansion.
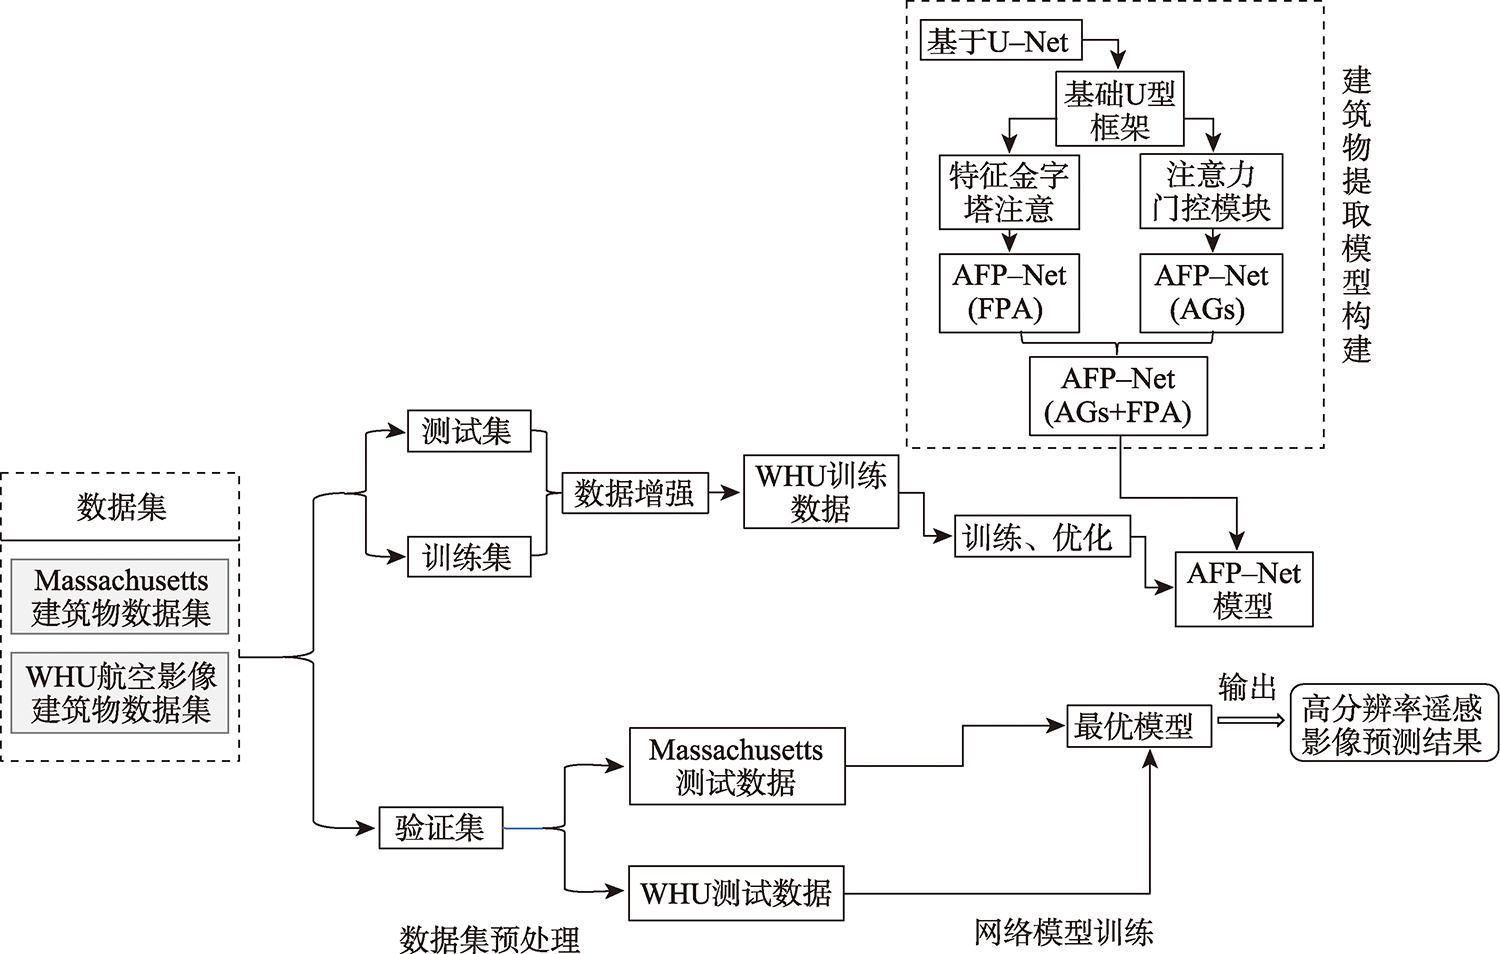
Building extraction from high-resolution remote sensing images is an important task of regional infrastructure information statistics. In recent years, due to the rapid development of aviation and aerospace science and technology, the data availability of fine resolution remote sensing images increases. The traditional methods such as manual visual interpretation or expert feature construction cannot balance the high efficiency and high precision for the results generation using high-resolution images. Nowadays, the adaptive deep learning method has gradually made great progress in the study of building extraction. Typically, the U-shaped U-Net network originated from the semantic segmentation model for medical images has been widely used. Its structure has good computational performance and segmentation accuracy and has been used as the basic structure of semantic segmentation for remote sensing images. However, the use of only the basic network model has limitations on the expression of image features, which could cause blurring of local building contour when extracting buildings from high-resolution remote sensing images. This paper proposes an Attention U Feature Pyramid Network (AFP-Net) that can focus on different forms of building structures in high-resolution remote sensing images to efficiently extract the details of buildings. The AFP-Net model suppresses the irrelevant areas in the input image through the grid-based Attention Gates (AGs) module and highlights the dominant features of buildings in the image. The Feature Pyramid Attention (FPA) module increases the receptive field of high dimensional feature map and reduces the loss of detail in sampling. In this paper, the AFP-Net model is trained and optimized based on WHU building dataset. The test results show that, compared with U-Net, the accuracy and Intersection over Union of the proposed method are improved by 0.67 % and 1.34 %, respectively using the test data of WHU dataset. In addition, this paper compares the detailed features of different models for convex and concave parts of the building contour, and the AFP-Net model can clearly identify the edge of the building. The results demonstrate that the proposed method can effectively improve the prediction accuracy of building detail extraction.
Spatial stratification is the basis and key to accurately measure the uncertainty degree and spatial distribution of remote sensing classification. In this study, a spatial stratification and evaluation method of remote sensing classification was proposed based on uncertainty analysis. Firstly, the pixel posterior probability was obtained based on random forest algorithm, and measurement indices of classification uncertainty were determined. Secondly, spatial stratification was achieved using Fuzzy C-means. Finally, the rationality of the stratification results was qualitatively and quantitatively evaluated and compared with the stratification accuracy assessment results of data products at the same scale and the posterior probability uncertainty stratification method. Taking Landsat 8 OLI images of remote sensing data in Shunyi District of Beijing as an example, the results showed that: (1) The coverage of Shunyi District was divided into three strata including large, medium, and small uncertainties based on the indices of maximum probability, fuzzy confusion index, and probability entropy. The stratum classification accuracy of each stratum of remote sensing data was 62.28%, 74.96%, and 79.31%, respectively; (2) The spatial stratification results of classification uncertainty were basically consistent with the spatial distribution of the size of measurement indices, and the spatial distribution of misclassified stratum was basically consistent with that of large uncertainty stratum; (3) The spatial characteristics and classification accuracy of each stratum for remote sensing data and data products had the same trend. Compared with the overall accuracy of classification, the stratum classification accuracy of the large uncertainty stratum was reduced, and the stratum classification accuracy of the small uncertainty stratum was improved; (4) Compared with the posterior probability uncertainty stratification method, the stratum classification accuracy of the large uncertainty stratum decreased by 1.08%, and those of the middle uncertainty stratum and the small uncertainty stratum increased by 3.58% and 0.16%, respectively, and corresponding q value of the spatial method developed in this study increased from 0.19 to 0.24 with a higher spatial differentiation. This confirmed that the spatial stratification result of remote sensing classification developed in this study was reasonable. This study proposes an uncertainty stratification scheme for remote sensing classification to optimize the spatial layout of training samples for remote sensing classification and validation samples for accuracy evaluation.
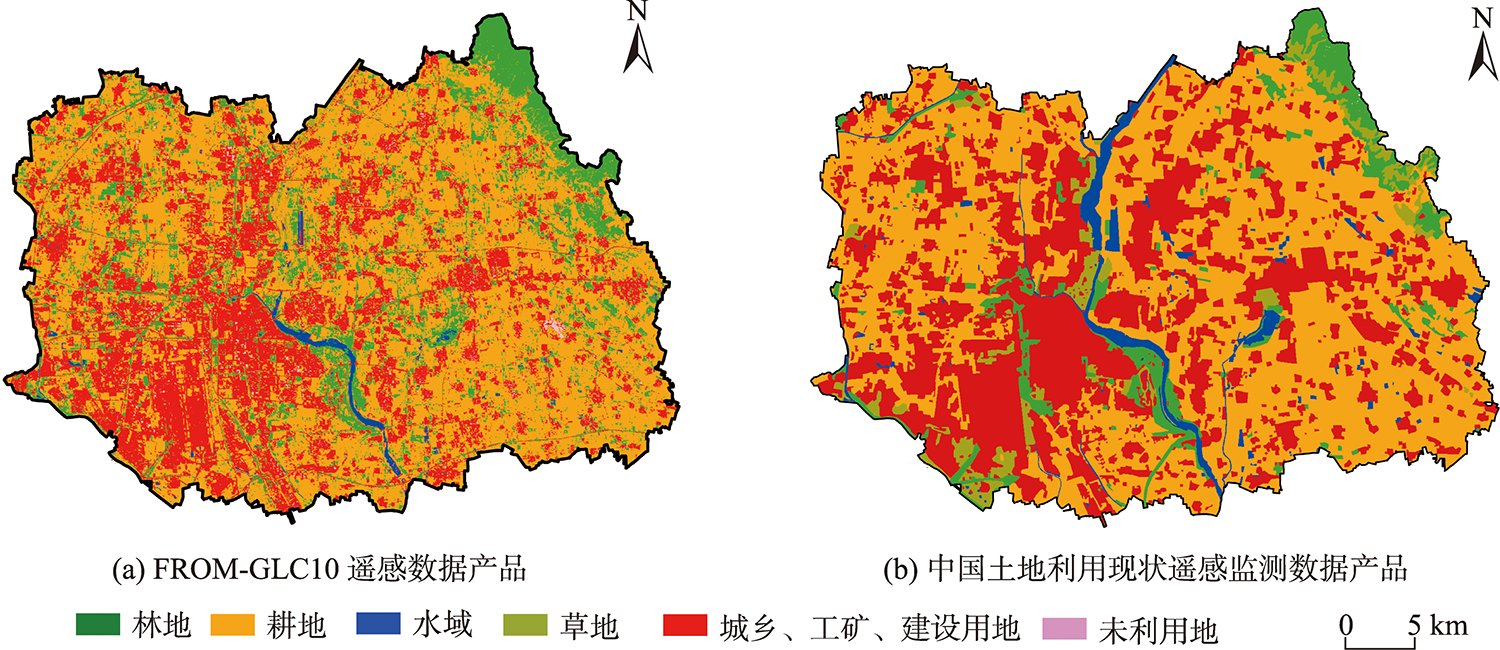
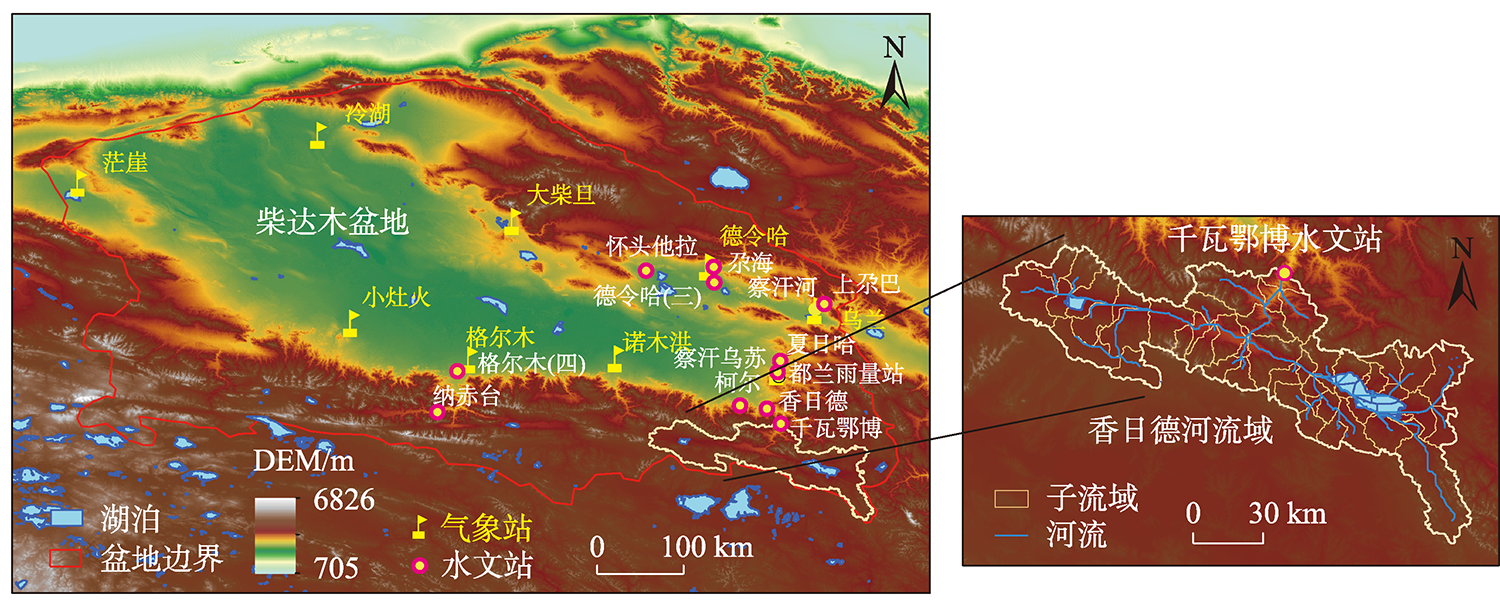
Precipitation is often concentrated in mountainous regions, but rain gauges mostly cluster in flat valleys or populated regions and thus have poor spatial and temporal consistency. Satellite-based and reanalysis precipitation products can provide precipitation data without being restricted by local terrain condition. However, these products are usually subject to systematic errors, which may vary with time and topographic condition. Thus, it is essential to evaluate and analyze the regional applicability of different precipitation products. The Qaidam Basin is one of the typical alpine arid inland basins in China. Its center part belongs to an arid desert region, and water scarcity hampers the socioeconomic development of this region. The Qaidam basin is surrounded by mountainous regions which are the “water tower” in the world with concentrated precipitation but sparse rain gauge networks. The lack of precise precipitation observation in space and time in mountainous regions can result in unreliable hydrologic modeling and unsustainable water management. To obtain accurate precipitation data, this study collected and evaluated four widely used precipitation products with higher spatiotemporal resolution, including CMADS, TRMM, GPM, and MSWEP. First, we evaluated the suitability of these four precipitation products in the Qaidam Basin against gauge-based precipitation data, using monthly precipitation data from nine meteorological stations and 13 hydrological stations. The spatiotemporal characteristics and the site level errors of the four precipitation products were also analyzed. Then, we concentrated on the typically poorly gauged basin, Xiangride River Basin located in the southeastern Qaidam Basin. The Four precipitation products were input to the semi-distributed hydrological model, Soil and Water Assessment Tool (SWAT), to evaluate the simulated streamflow by comparison with observed streamflow from the gauge data at the watershed outlet (Qianwaebo hydrological station). Results show that: (1) At yearly and monthly scales, MSWEP achieved the highest agreement (R ≥ 0.79, PBIAS = 0.5%) against the observed data, followed by GPM and TRMM, while CMADS had the worst performance (R ≥ 0.64, PBIAS = 5.8%); (2) All precipitation products generally overestimated precipitation at lower elevations and underestimated precipitation at higher elevations; (3) At the basin scale, MSWEP performed best (NSE = 0.64 vs. 0.36~0.59 for other datasets) in the baseline period (2009—2012), while CMADS performed best (NSE = 0.75 vs. 0.53~0.68 for other datasets) in the impacted period (2013—2016). This study can provide important support for obtaining accurate precipitation information and improving water resources management in poorly gauged arid mountainous region.
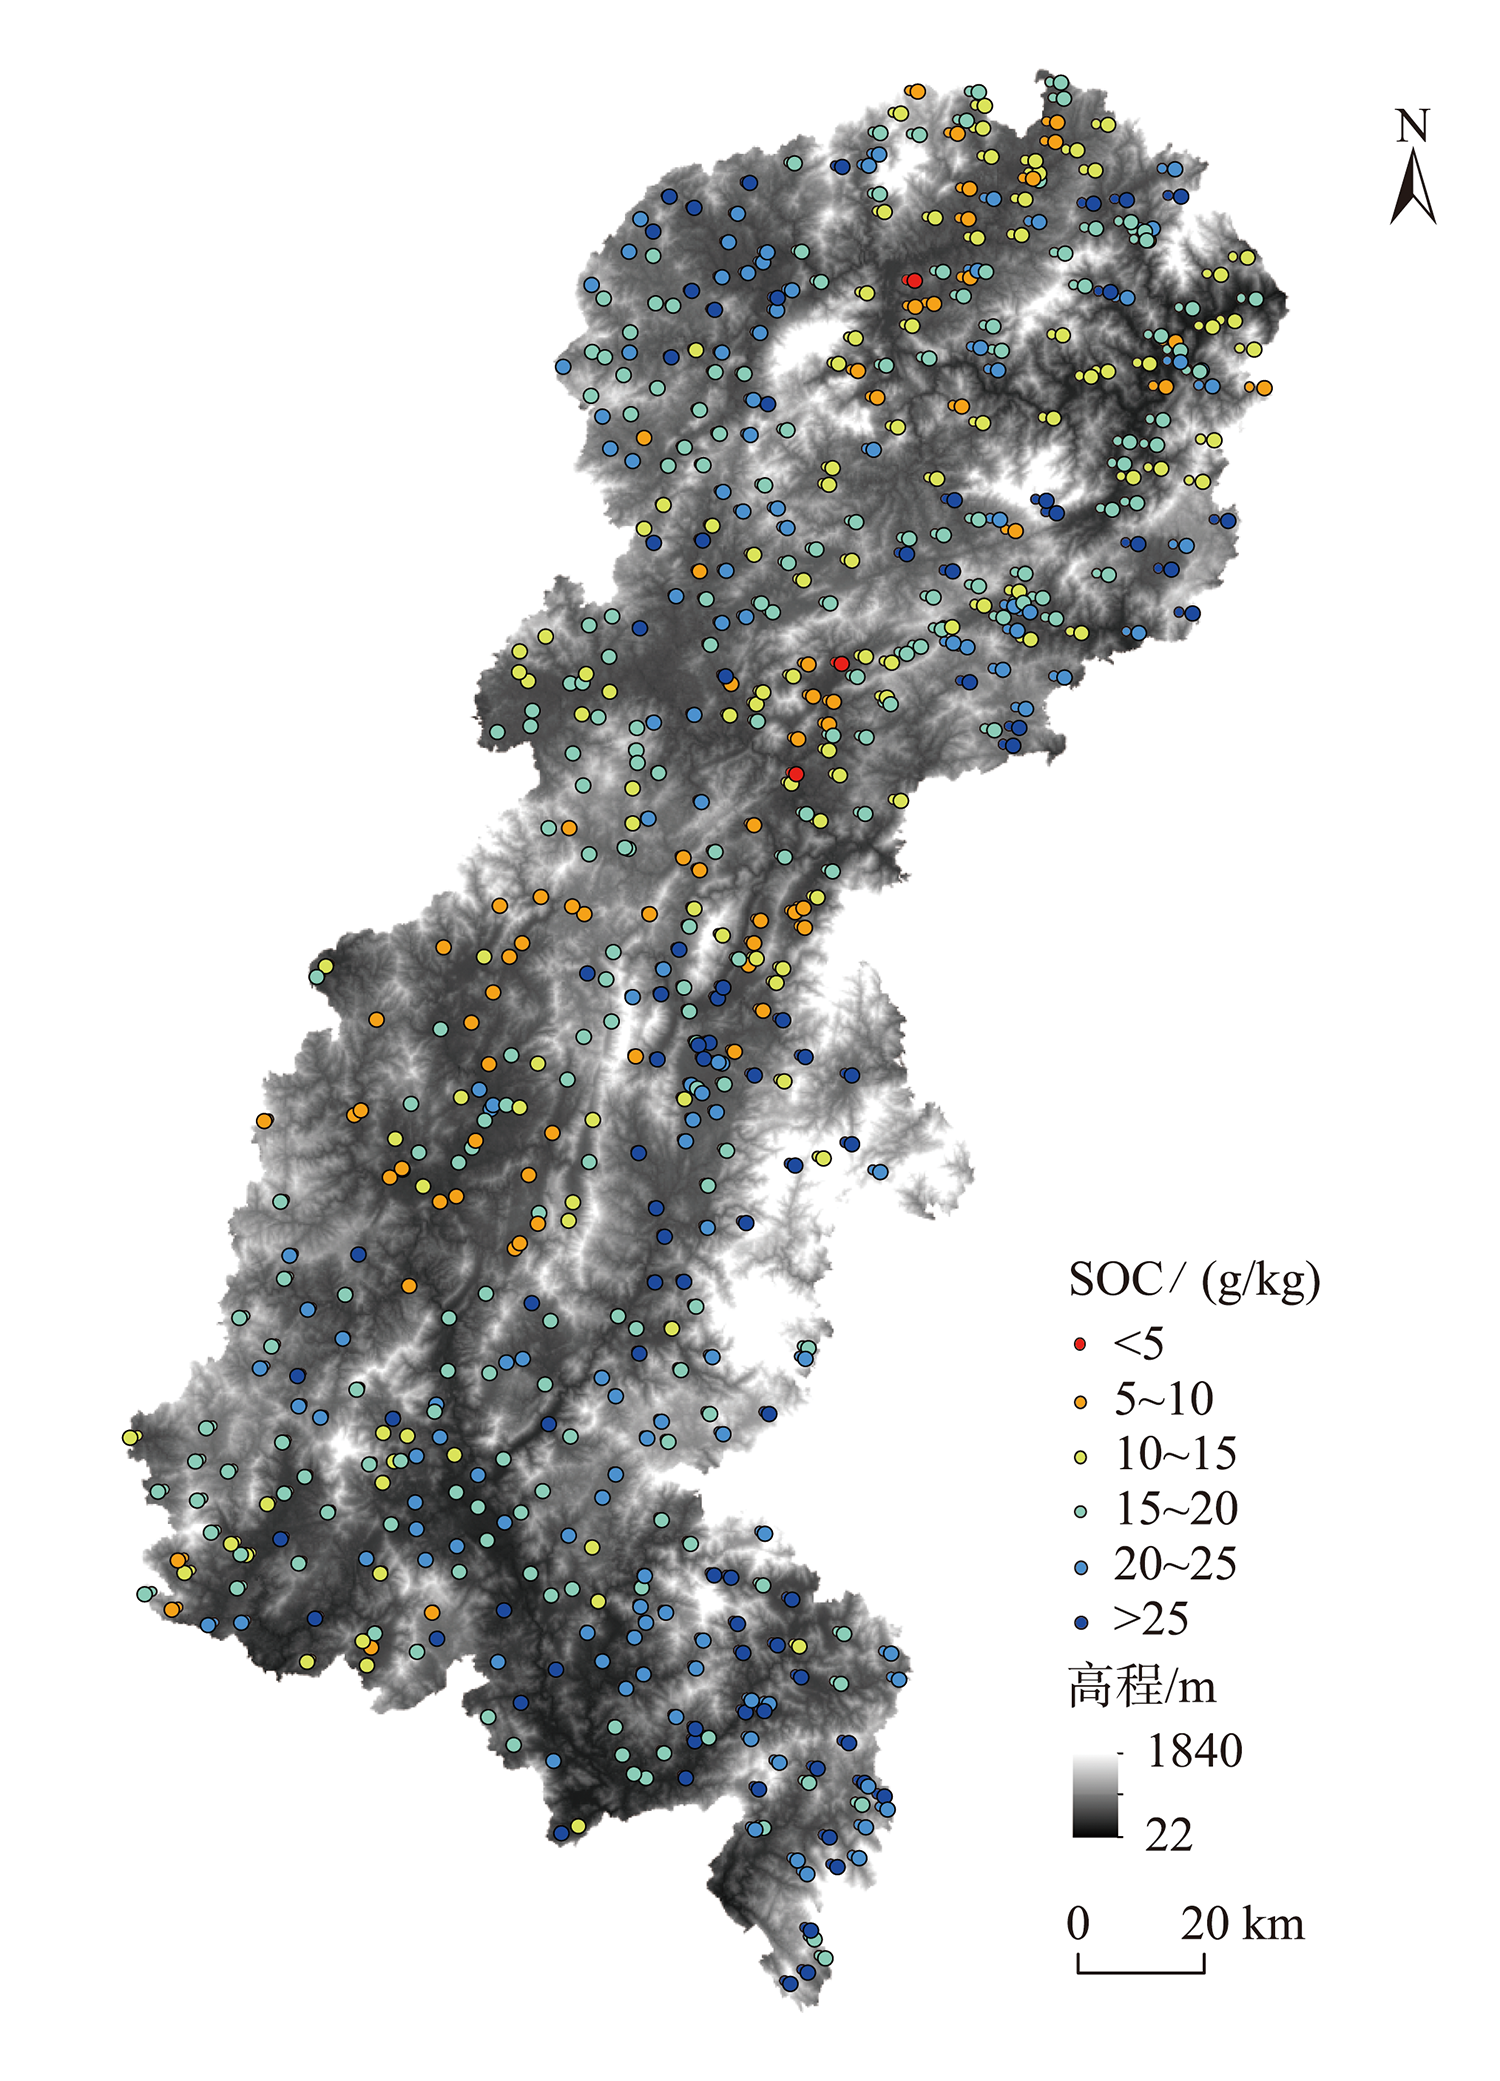
Human activities significantly affect the amount and spatial variation of top Soil Organic Carbon (SOC) in croplands. However, the spatial distribution of agricultural management practices has not been carefully considered in SOC mapping in croplands, especially for croplands in large-scale complex landforms. A case study was conducted in agricultural area in western Fujian Province. Sentinel-2/MSI NDVI time series data were used to derive two types of variables that contains crop rotation information. One is the Crop Rotation (CR) pattern type, which was regarded as qualitative factors of agricultural activities. The other are variables generated using Harmonic Analysis based on sentinel-2 NDVI time series data (HANTS), which were regarded as quantitative factors of agricultural activities. Two types of agricultural activities factors, as well as natural environmental variables were adopted as predictive environmental variables. Four different combinations of above variables according to different categories were formed respectively (i.e., climate factor + terrain factor, climate factor + terrain factor + crop rotation pattern, climate factor + terrain factor + HANTS variables, and climate factor + terrain factor + crop rotation pattern + HANTS variables). Random Forest (RF) models were developed based on four different combinations of above variables for predicting SOC. These RF models were compared to explore whether incorporating agricultural activity factors could improve the SOC mapping accuracy in croplands. Results showed that the combination of natural environment variables with both crop rotation type and variables derived through HANTS yielded the highest accuracy. Compared with the combination of natural environment variables, the prediction accuracy of the optimal model was significantly improved (R2 increased by 89.47%, RMSE and MAE decreased by 10.66% and 12.05%, respectively). Two types of agricultural activity factors were both adopted in optimal model, especially CR significantly affected the SOC in croplands, ranking fourth in the importance of environmental variables of the optimal model. In all RF models, annual rainfall (Rainfall) ranked first in the importance of environmental variables. This indicated that climate factors play a dominant role in soil organic carbon digital soil mapping. The SOC content in croplands of the region predicted from the optimal model was (18.22±2.99) g/kg on average and varied in the range of 8.25~30.69 g/kg. The SOC content in double cropping rice and tobacco-rice planting area were higher than that in rice-vegetable planting area. The results provide a new vision for updating the environmental variables of SOC mapping in complex landform areas.