
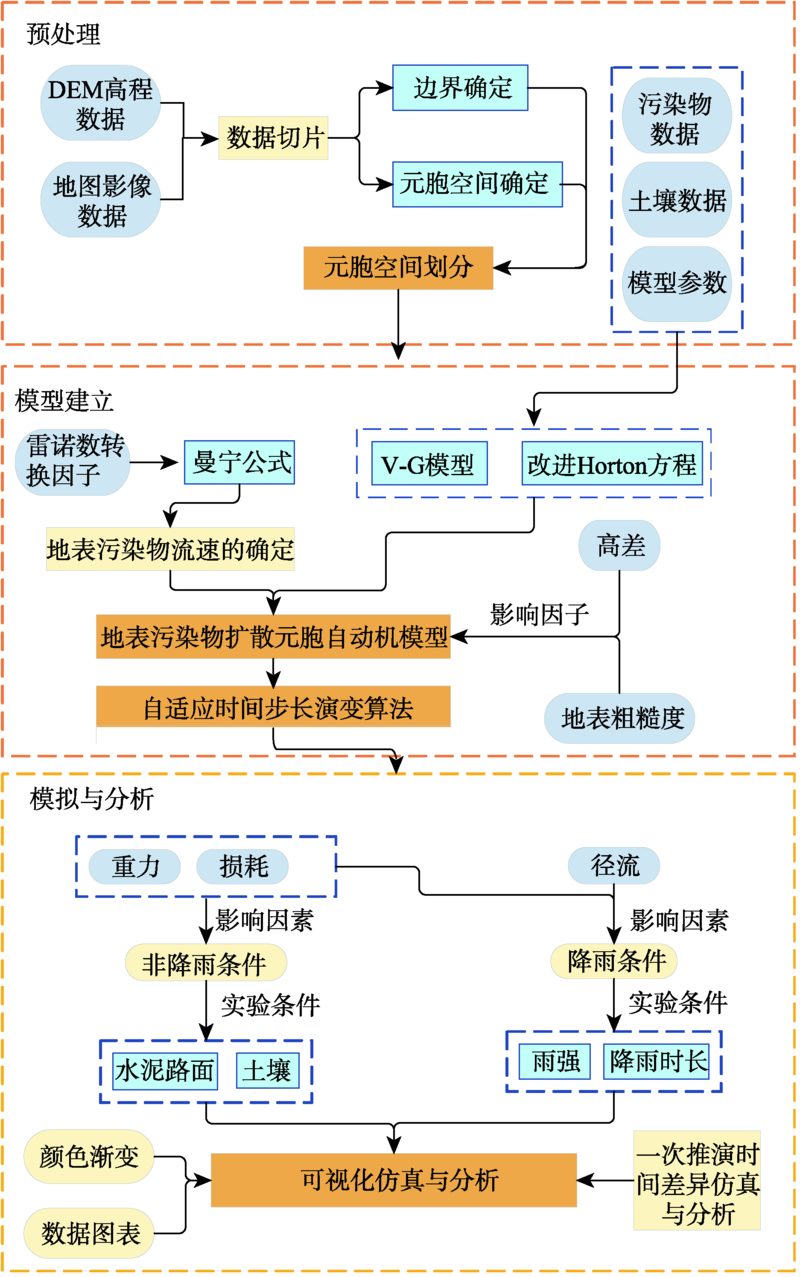
Aiming at the problem that it is difficult for traditional pollution simulation models to simulate the uneven diffusion process of surface pollutants dynamically in time and space, this paper proposes a surface pollutants diffusion simulation model based on cellular automata model. In this paper, surface slope and surface roughness are considered as the main factors affecting the diffusion process of pollutants. Based on the irregular contaminated site area, the boundary conditions of the cell were firstly determined to obtain the whole cell space, and then the whole cell space was divided into regular cells. After that, a method for calculating the diffusion velocity of pollutants under rainfall and non-rainfall conditions was proposed. Finally, based on the molecular diffusion rules, The evolution rules of surface pollutant diffusion model under rainfall and non-rainfall conditions were established. For better simulating surface pollutant diffusion, this paper proposes a cellular adaptive time step adjustment algorithm, in which pollutant quality decay with surface slope and pollutant gravity. This algorithm can adjust the cellular automata time step automatically and dynamically, so as to prevent cellular automata model with fixed time steps from missing details when pollution spread quickly and computing resources wasting when they spread slowly. In this paper, two experiments which consider rainfall and non-rainfall conditions respectively are designed to simulate the diffusion process of pollutants over time. The experimental results show that different underlying layers have a great influence on the diffusion rate of pollutants; the diffusion velocity of pollutants on the cement surface with a roughness of 0.012 is about 2.7 times of that on a general soil surface with a roughness of 0.035; under rainfall conditions, the pollution diffusion velocity increases with the increase of rainfall intensity and duration, the diffusion velocity changes with the change of rainfall curve, and reaches the maximum near the peak of rainfall intensity; the pollution diffusion simulation results obey the slope distribution characteristics of the site; with the change of time, the range of high pollution area gradually decreases, and the difference in pollutant concentration between adjacent locations also gradually decreases, and after a period of time, this change gradually becomes stable; in the process of a model evolution, surface pollutants will have subtle differences in diffusion time in different neighborhood cell directions, and the adaptive time step evolution algorithm can better reflect this difference, so it can better improve the calculation accuracy of spatial and temporal distribution of pollutants.
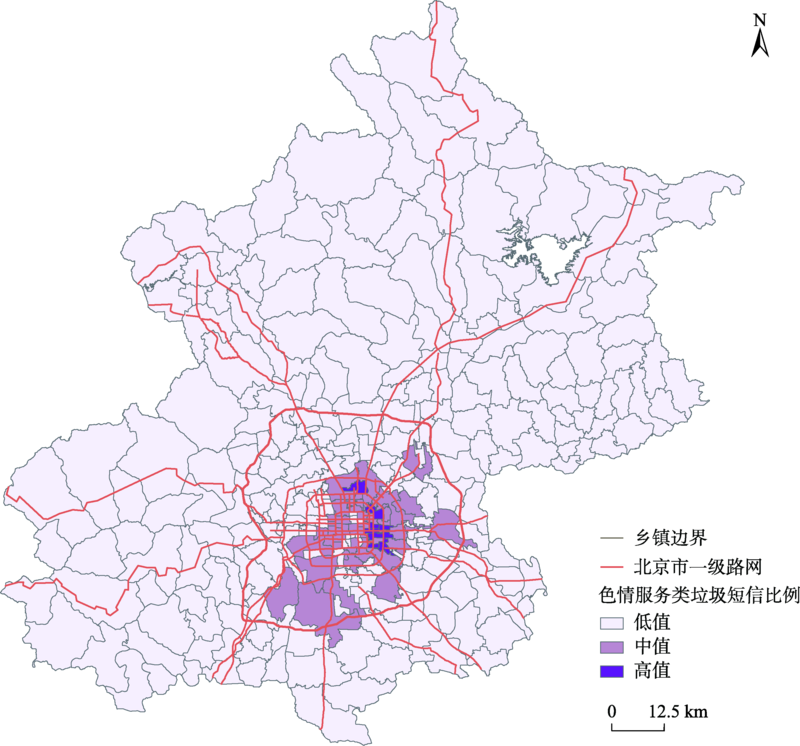
There are significant spatiotemporal autocorrelation and heterogeneity in spam message activities of pseudo base stations. Using spatiotemporal analysis method can accurately grasp the movement law and behavior pattern of pseudo base stations, which provides a scientific basis for relevant departments to formulate comprehensive policies and explore long-term management mechanism. However, the problem of zero inflation caused by excessive zero data in the spam SMS data set at the fine scale makes the spatiotemporal analysis method not applicable. In this paper, using the Beijing municipal erotic service spam message data from February 23 to April 26, 2017 as an example. we constructed the zero inflation Bayesian spatiotemporal model, which can not only solve the problem of zero inflation, but also comprehensively analyze space, time, space and time effect, and external influence factors of pseudo base stations. Based on this, we further identified the high risk areas of pseudo base station activity and explored the influence of urban built environment. The results show that the Bayesian spatiotemporal model based on zero-inflation Poisson distribution has a higher fitting accuracy when the ratio of zero values in the dataset is 83.46%. The high risk areas of pornographic service spam messages are mainly concentrated in the eastern part of the main urban area of Beijing, and the Chaoyang District has the highest risk value. The risk increases relatively on Thursday, Friday, and Saturday, and the high-risk period is from 6 pm one day to 2 pm the next. The pseudo base station generally starts moving from the southwest to the northeast of the main city at 6 pm and gathers in the northwest of Chaoyang District at 1 am. There is a positive correlation between the urban environment of commercial residence and accommodation service and the spam message, while there is a negative correlation between the urban environment of catering service and police stations. The zero-inflation Bayesian spatiotemporal model for analyzing fine scale pseudo base station spam messages can effectively integrate multiple time cross section data, take into account the external factors and the relationship between time and space of pseudo base stations, and solve the problem of too much zero data in the dataset. Our study provides an important analysis method for the development and validation of pseudo base station environmental criminology theory.
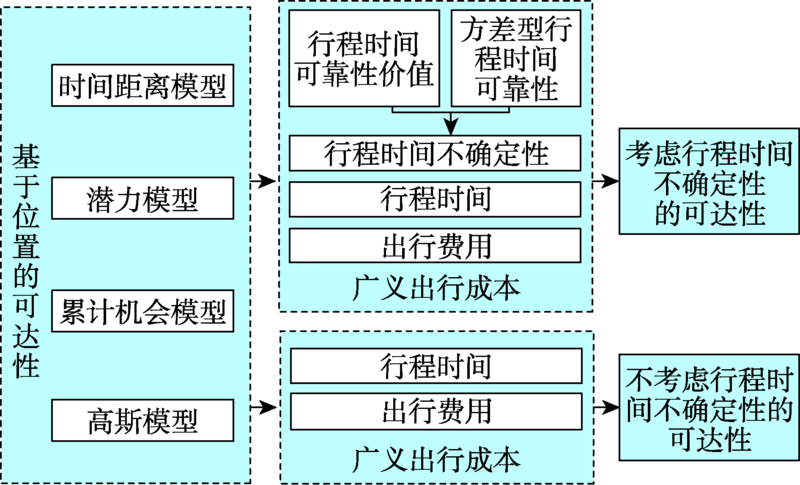
Many scholars have focused on public transit accessibility, as the public transportation system plays more important role in commuting. Travel time uncertainty, which is caused by timetable and traffic condition changes, leads to uncertainty in accessibility. Ignoring travel time uncertainty may cause overestimation of accessibility. This overestimation may bring optimism about travel time to the commuter, and they may not reach their destinations on time. Therefore, it is essential to measure public transit accessibility realistically. Moreover, previous studies often use one measurement to calculate the influence of travel time uncertainty on accessibility and do not consider the differences between measurements. Different measures may be oriented to different infrastructure investment, therefore, understanding the results of different measures is also important. To fill these gaps, we first divided the study area (Shenzhen) into 1854 grids and collected millions of travel dataset and POI dataset from GaoDe Map. Then, this paper developed the travel time reliability by investigating the travel time distribution and standard deviation between OD pairs. We extended the generalized travel cost in accessibility measurements by incorporating travel time reliability. The static accessibility measurements use the generalized travel cost without considering travel time reliability. Furthermore, we developed four types of placed-based accessibility measurements to analyze the differences between accessibility with and without travel time uncertainty. The results in Shenzhen's case showed that travel time uncertainty increased accessibility at least by 5.80%, and at most by 95.04% in the whole area. The order of models from minimum to largest increase was that: the potential model, the time distance model, the cumulative opportunity model, and the Gaussian model. The accessibility of Gaussian model increased by 59%~553%, while the generalized travel cost threshold increased from 45 min to 120 min. Additionally, the impact of travel time uncertainty on accessibility existed threshold effect, the higher threshold, the smaller the degree of reduction. The results indicated that ignoring the travel time uncertainty may underestimate the effect of improving the transit system. From the perspective of spatial patterns, the influence of travel time uncertainty covers the whole region. The value of overestimation was high in the area with a high level of accessibility, the degree of overestimation was high in the area with a low level of accessibility when travel time uncertainty was ignored. The median of overestimation degree can reach 77.1%. The potential model had the minimal variation in accessibility classification and the cumulative model generated the maximum variation. The results provide the insights that users should pay more attention to the impact of travel time uncertainty on accessibility. Additionally, government should take care on the model choice and consider the results of different measurements comprehensively, as different models lead to different decisions.
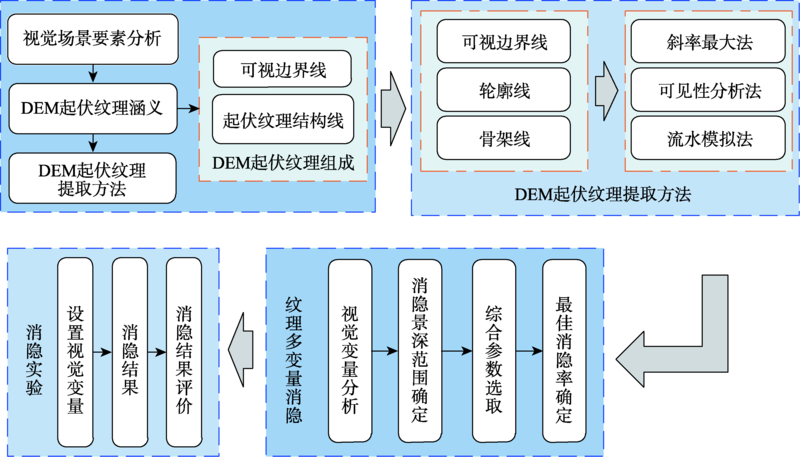
Terrain is formed under the combined action of internal and external forces. Different types of terrain have different morphological characteristics. From the perspective of global or macro-observation, the topographic relief of local terrain and its characteristics can be visually perceived. Texture is a combination of regular lines on the surface of objects. DEM is the digital expression of terrain, and the morphology of different terrain types has a unique representation of texture. At present, the research on DEM texture is mainly from the perspective of DEM image cognition, and corresponding calculation methods of image texture are used to describe the terrain texture objects and extract indexes. Based on the obtained texture objects, the analysis of regional terrain characteristics and the classification of landform types are then carried out. However, DEM relief texture is a combination of terrain elements based on a certain view angle and scale. Firstly, it is necessary to make a systematic visual cognition of DEM relief texture and clarify the composition structure of DEM relief texture based on visual cognition and texture elements controlled by different visual variables. Through the realization of multidimensional visual modeling of DEM relief texture, the abstraction and simplification of DEM digital terrain modeling are achieved. Based on this, this paper takes DEM relief texture as the research target, carries out visual cognition on DEM relief texture, clarifies the meaning of DEM relief texture, and establishes the extraction method. The established method is used to realize the extraction of DEM relief texture, and good extraction results are achieved. Starting from the mechanism of visual perception, the combination of visual variables that determine the results of visual perception is determined. The parameters for visual synthesis including depth of field, length, and neighborhood are determined, and a multivariate DEM relief texture blanking method is designed and established. Finally, the visual variables are set and this method is used to realize the blanking of DEM relief texture. After blanking, the number of DEM relief textures is reduced by 45.2 % and 53.2 %, respectively. The visual results are also ideal, which indicates a certain application value of our methods.
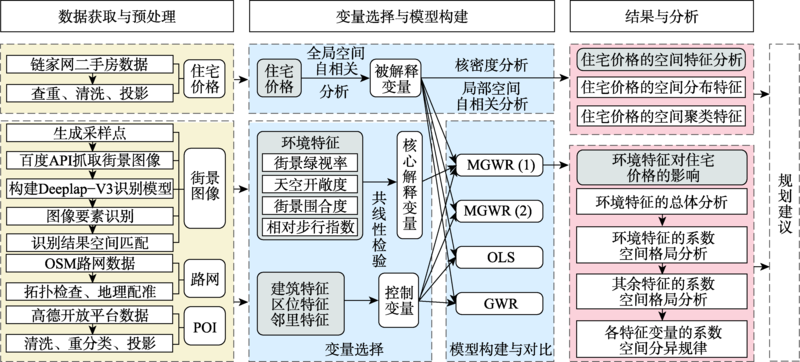
The spatial differentiation of housing price is an external expression of the unbalanced allocation of urban spatial resources. It is of great significance for formulation of residential planning and housing price control policies to understand the leading influencing factors and their spatial differentiation characteristics. Existing studies seldom consider the impact of environmental quality on housing price and the different scale effects of influencing factors. In response to the above problems, the study introduces street view imagery, adds environmental characteristic variables based on the traditional Hedonic price model, and constructs Multiscale Geographically Weighted Regression (MGWR) model to explore the impact of environmental characteristics on housing price. The spatial pattern of coefficients of other control variables are analyzed and the spatial differentiation characteristics of each variable are summarized. The main conclusions are: (1) The environmental characteristics measured by street view imagery are more consistent with people's real perception of the living environment, and the research conclusions can provide more refined strategies for improving the quality of the living environment. The MGWR model has a fitting effect on the spatial differentiation of variables closer to the real value, and it can describe the difference of action scales of different variables, which is helpful to formulate targeted planning strategies for specific regions; (2) The housing prices on Xiamen Island show significant clustering characteristics, and are distributed in a "band" structure along the city’s core development axis; (3) The three environmental characteristics variables have significant positive effects on housing prices, and the effects are close to the global scale. The impact of street view green viewing rate is the strongest, followed by sky openness and relative walkability index; (4) By summarizing the spatial differentiation rules of the coefficients of each variable, it is found that the dominant influencing factors of housing price in different characteristic areas are different. The core areas are mainly affected by traffic and education factors; the old urban areas are mainly affected by environmental quality and building quality factors; the new urban areas are mainly affected by location and living facilities.
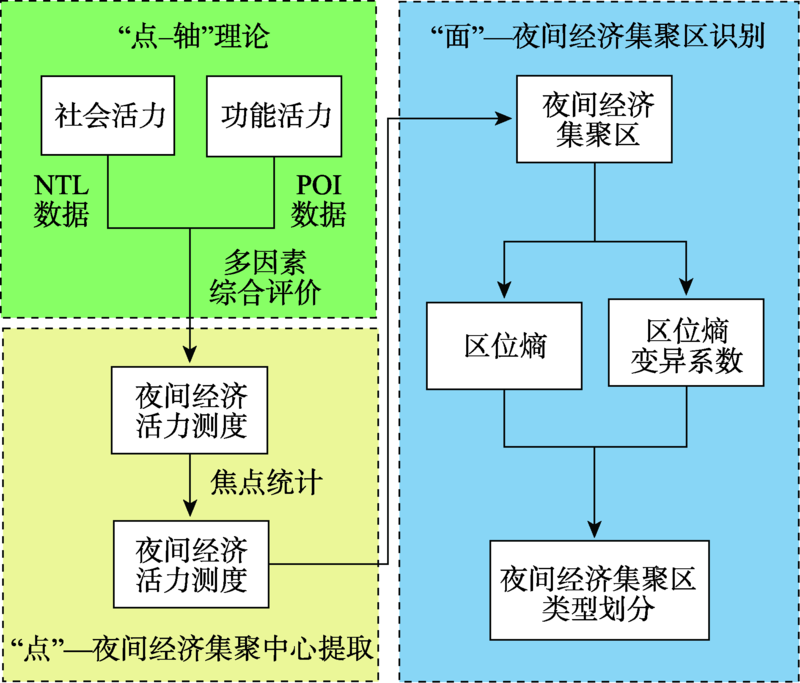
Nighttime economy contains huge consumption potential and market space. As the carrier of nighttime economy, accurate identification, reasonable classification, and scientific layout of nighttime economic agglomeration is important for the sustainable development of nighttime economy. Under the cognitive framework named "point-axis development and quantitative identification", and based on quantification of nighttime economic vitality, focal statistics and ISODATA are used to extract and identify nighttime economic agglomeration centers and agglomeration in this study. According to the location quotient and its coefficient, the nighttime economic agglomeration is classified. This process overcomes the problems of chaotic zoning and classification standards for nighttime economic agglomeration and introduces a new idea for the quantitative research of nighttime economy. The results show that: (1) Compared with DMPS/ OLS and NPP- VIIRS, Luojia1-01 data have high spatial resolution and low spillover effect, which is more suitable for small-scale study of "nighttime economic agglomeration"; (2) Nighttime light and POI data are good representations of nighttime social vitality and functional vitality, and their combined effects can be quantitatively expressed through the night economic vitality; (3) Of the 12 landmark nightlife agglomerations launched in Shanghai, 11 are identified with a recognition rate of 91.7%; (4) According to the functional structure, nighttime agglomerations can be divided into four types: unbalanced developing - start-up type, balanced developing - start-up type, unbalanced developing - maturation type, and balance developing - maturation type. The classification method is universal; (5) In the development stage, shopping and catering are the main functions of the agglomeration area. In the advanced stage, main functions turn to accommodation, sports and fitness, culture and education, and leisure and entertainment. These four types of nighttime agglomerations form an obvious circle structure spatially.
The Three-North Afforestation Program (TNAP) is an important ecological barrier in China, a great green wall has been built to resist sandstorms, conserve water and soil, protect agriculture, and promote animal husbandry in the north of China. In 1978, China began to build the Three-North Afforestation Program. After nearly 40 years of construction, the ecological environment has been greatly improved. However, most areas of the TNAP have sparse vegetation, insufficient annual precipitation, large evaporation, strong wind, serious desertification, and an extremely fragile ecological environment. Therefore, the ecological problems are still very prominent in some areas, and the task of ecological construction still has a long way to go. Analyzing the temporal and spatial changes of vegetation restoration in the TNAP from 2000—2019, determining the contribution of human activities and climate factors to vegetation restoration, exploring the impact of vegetation restoration on soil wind erosion, and evaluating the potential space of vegetation restoration can provide a significant reference for the future planning, management, and scientific implementation of the TNAP. In this paper, we chose the vegetation coverage and vegetation net primary productivity as the index to indicate the vegetation restoration status. Using ground data and model simulation to evaluate the degree of vegetation restoration and its impact on soil wind erosion from 2000—2019. This paper also explored the vegetation restoration potential based on the zonal climax background in the TNAP. The results showed that during 2000-2019: (1) The areas with high and higher degree of vegetation restoration accounted for 35.29% and 13.16% of the TNAP, respectively, which were mainly distributed in the Loess Plateau area, and on the north area of Loess Plateau area, and some areas of the sandstorm area and agricultural area of the Northeast-North China Plain. The vegetation restoration was mainly affected by climate factors in TNAP. The contribution rates of human activities and climate factors to vegetation restoration were 10.45% and 89.55%, respectively; (2) The main soil wind erosion degrees were mild erosion degree and micro erosion degree in the TNAP. The soil wind erosion modulus showed a downward trend year by year. The area of severe erosion has decreased by 66.45%, and the service of wind prevention and sand fixation has been further improved. The degree of vegetation restoration had a negative correlation with soil wind erosion modulus. A better degree of vegetation restoration would be helpful to reduce soil wind erosion modulus and reduce the harm of wind erosion; (3) The forest ecosystem, grassland ecosystem, desert ecosystem still had a restoration potential of 8.16% in the TNAP. Some areas in the north of Inner Mongolia Plateau, the north of Hashun Gobi, the northwest and surrounding areas of Junggar Basin, and the south of Loess Plateau had great restoration potential.

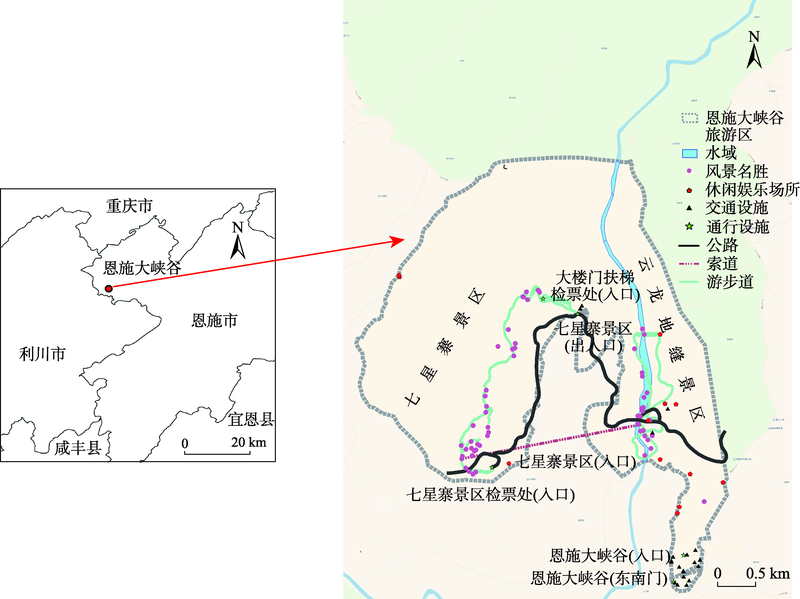
With the increasing demand of tourists for leisure and entertainment tourism, upland tourism area has become one of the most popular tourism destinations. Applying the emerging and efficient track recording method to dig the dynamic spatio-temporal behavior characteristics and constraints of tourists in upland tourism area at a small scale is particularly important for the route design of upland tourism area and the optimization of upland tourism products. It will also provide suggestions for deepening development and scientific management of upland tourism area. Taking Enshi Grand Canyon in Enshi Prefecture, Hubei Province as an example, this study combines GNSS track and location photo data from "six feet" platform with the scenic spot road network drawn by GIS online map and the POI data obtained from BigMap. This paper selects the conceptual model of GNSS track rasterization to express the temporal and spatial behavior characteristics of tourist tracks in Enshi Grand Canyon, attempts to explore the differences of temporal and spatial behavior characteristics between other types of tourism areas, summarizes the behavior characteristics of upland tourism area, and reveals the influencing factors of behavior characteristics through network comments and travel notes. The results show that: ① At the level of month and season, the tourist behavior in Enshi Grand Canyon is at the peak in May. The holiday effect is obvious, and short holiday tour is preferred. The behavior trajectory of tourists in off and peak seasons has no agglomeration, and the number of tourists in peak seasons is unstable which is mainly affected by climate conditions; ② The tourist behavior trajectory reaches the peak at 11 to 14 o'clock, the tour ends earlier than other types of scenic spots, and the interest points of tourists are in the well-known spot; ③ In terms of spatial distribution characteristics, the trajectory concentration of Qixingzhai scenic spot with a single path is strong controlled by temporal and spatial factors, and its behavior trajectory density is higher than that of Yunlong Difeng scenic spot; ④ All the tourists tend to take pictures in high-quality scenic spot, but there are differences in its distribution for men and women. Men's photographing behavior is mostly in polygon and linear distribution, while women’s photographing behavior is mostly in point distribution. This paper tries to explore the temporal and spatial behavior of tourists in upland tourism area with new data and methods, in the hope of promoting high quality and continuous development of upland tourism areas.
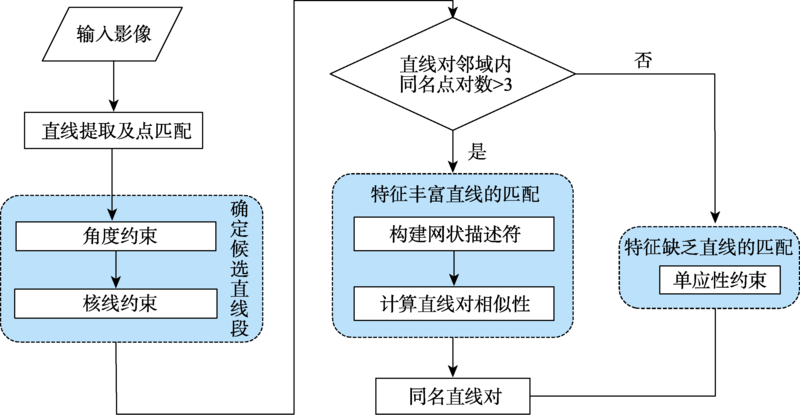
Aiming at the problem that the line descriptor in the existing stereo image line matching methods only depends on local gray features, resulting in weak reliability, a line matching method based on mesh descriptor and homography constraint is proposed in this study. Firstly, we extract line segments and the corresponding point pairs in reference image and search image using the Line Segment Detector (LSD) and Scale-Invariant Feature Transform ( SIFT) algorithms. And line segments that do not satisfy the length requirements to eliminate the noise caused by shadows or other ground objects are deleted. Secondly, after roughly estimating the rotation angle and homography matrix between the two images according to the obtained corresponding point pairs, the candidate lines are determined through the angle constraint and epipolar constraint, which can reduce the line search range in search image and exclude a large number of mismatches. In addition, the overlap between the reference line and the candidate line is calculated to ensure the consistency of the endpoints. Thirdly, a circular neighborhood using the midpoint of the line segment as the center and the length as the radius is constructed. The corresponding point pairs are searched in the neighborhood of the reference line and the candidate line to calculate the mesh descriptor. In order to improve the accuracy of line matching, for the line pairs whose number of corresponding point pairs is greater than three, we arbitrarily select three groups of different corresponding point pairs to calculate the line similarity value and take the maximum value as the final similarity of the line segment, so as to determine the corresponding line pair. Finally, the line segments that are not searched for the corresponding point pairs are mapped into the search image using the homography matrix. Three criteria are established according to the angle difference between the two lines and the vertical distance between the endpoints and the radiation information. Based on this, the final matching result is obtained, which can improve the number of corresponding line pairs. To verify the effectiveness and robustness of our algorithm, this paper selects five groups of close-range images in the international open standard test data set, and compares with three existing representative algorithms. The results show that the accuracy and effectiveness of our algorithm are higher than the other three algorithms. The matching accuracy and operation efficiency are improved by 16.1% and 49 times, respectively, and satisfactory line matching results can be obtained for close-range images under different conditions.
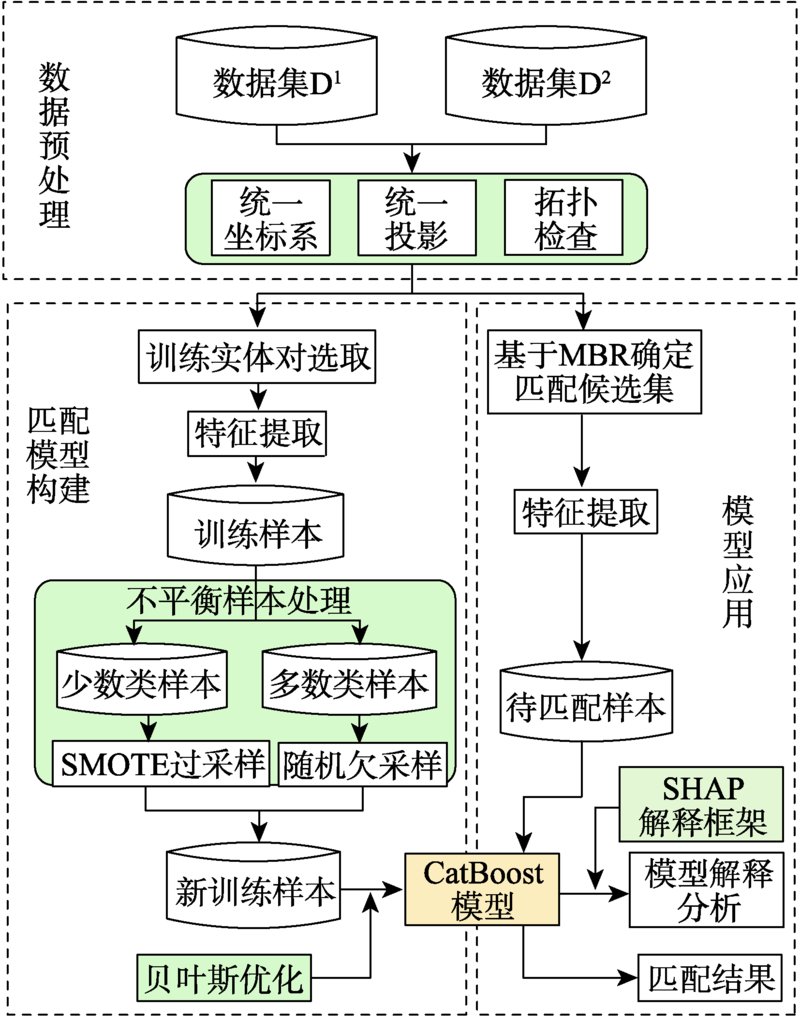
The existing multi-index geometric matching methods for areal entities face the difficulty in scientific quantification of index weights and thresholds when calculating the comprehensive similarity and determining the final matching entity. The ensemble methods in machine learning train multiple base models as ensemble members and combine their predictions into the final output, which have shown excellent performance in solving classification problems. For this purpose, an areal entities matching method based on the CatBoost is proposed in this paper, and this method transforms the matching problem into a classification problem. Firstly, we select four geometric features including shape, area, direction, and position as model classification features. Secondly, to reduce the impact of sample imbalance on model training, we use hybrid resampling combining oversampling and undersampling to alleviate the class imbalance of the original training samples. The Bayesian optimization is used to determine the optimal hyperparameters of the CatBoost model. To improve transparency of ensemble learning models, the SHAP framework in the field of explainable artificial intelligence is introduced to explain the influence of each input feature on the prediction results from both global and local perspectives. Finally, we take the areal lake data of the Qinghai-Tibet Plateau as experimental data to assess the performance of the proposed method. The results demonstrate that the feature with the greatest influence on model prediction is position, followed by area and shape, and the feature with the least influence is direction. The Precision, Recall, and F1-score of this method on the experimental data are 0.9937, 0.9753, and 0.9844, respectively. Hybrid resampling can effectively reduce the impact of unbalanced samples on model training. Compared with the original unbalanced samples for model training, hybrid resampling increases the Precision, Recall, and F1-score by 5.8%, 0.6%, and 3.3%, respectively. Compared with traditional areal entities multi-index bidirectional matching method and conventional machine learning classification algorithms such as logistic regression, K-nearest neighbors, decision trees, and neural networks, the CatBoost performs better and achieves better matching results while avoiding the difficulty of index weights and thresholds setting.
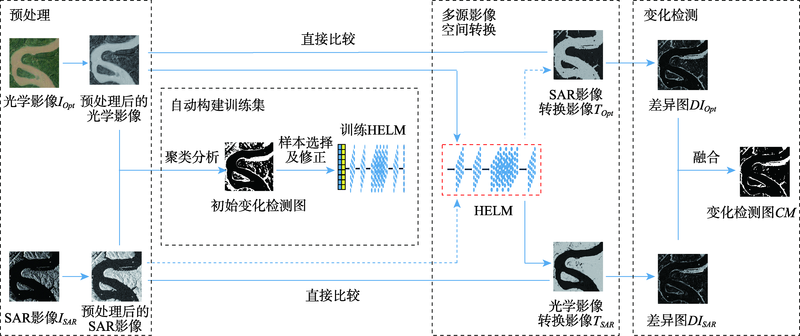
Due to the complementary information between different imaging mechanisms, heterogeneous image change detection is a challenging and hot topic compared to homogeneous image change detection. Its application is widespread, especially in emergency situations caused by natural disasters. To address the limitations of existing methods such as susceptibility to noise, manually selecting samples, and time-consuming computation, we propose a change detection method for heterogeneous images based on image transformation using Hierarchical Extreme Learning Machine (HELM). In our method, a HELM transformation model between heterogeneous images is constructed, which transforms the image features of one image into the feature space of the other one. Consequently, the transformed multi-temporal images could be comparable. Specifically, first, the logarithmic transformation of SAR images is carried out to obtain the same noise distribution model with the optical image. These heterogeneous images are smoothed to reduce the impact of image noise. Then, through image segmentation, the unchanged areas are selected as training samples. And a correction model for training samples is constructed to avoid manual selection of samples and improve the accuracy of image transformation. Subsequently, the corrected training samples are used to train the HELM to obtain the multi-temporal transformation images, which avoids the parameter adjustment of neural networks. Finally, the changes could be extracted by comparing the transformed multi-temporal images. To prove the effectiveness of the method, two sets of heterogeneous images (Google Earth and Sentinel 1 images) are used for experimental validation in this paper. The results show that the kappa coefficients of the method for the two data sets are improved by 6.19% and 8.94%, respectively, compared with the existing methods, which proves the effectiveness of the proposed method.
Current research on the relationship between drought and vegetation has focused on two aspects. One is the correlation analysis between climate factors and spatiotemporal variation of vegetation, and the other is the response of vegetation to climate change. Methods for large-scale plant stress resistance monitoring are still lacking. This study used Normalized Difference Vegetation Index (NDVI), Gross Primary Productivity (GPP), Modified Anthocyanin Content Index (mACI), and Shortwave Infrared Water Stress Index (SIWSI) to monitor vegetation changes under drought stress. A comprehensive monitoring method for plant stress resistance was constructed. This method comprehensively considered the stress resistance process of plants and established four indicators. Correlation analysis was carried out using the comprehensive score of crop stress resistance and the harvestless rate of each province. There was a negative relationship between crop stress resistance and harvestless rate. This method was applied to evaluate the resistance of different types of vegetation to drought stress in China. The results showed that: (1) Plant stress resistance varied greatly in different seasons. It was weakest in summer and strongest in winter. The spatial heterogeneity of plant stress resistance in China was significant. In spring, the regions with comprehensive scores lower than 70 were mainly located in Shanxi and northern Shaanxi. The regions with comprehensive scores higher than 90 were mainly concentrated in northeastern Inner Mongolia and the southern part of Yunnan; (2) There were obvious differences in the stress resistance of different types of vegetation. In summer, deciduous coniferous forest had the strongest stress resistance and the smallest intra-class differences. In spring and fall, grassland had the strongest stress resistance and the greatest intra-class differences. The comprehensive monitoring method of plant stress resistance is helpful to explore the law of plant stress resistance under drought stress, which provides references for helping reduce disaster risks.

Target matching based on morphological characteristics is a key technical method in the fields of spatial cognition of maps and automatic perception of surface locations. However, due to the differences in spatial scale and local morphology of spatial targets extracted from different remote sensing images, it is difficult to use existing shape matching algorithms to obtain high matching accuracy. In this study, based on the equiangular boundary distance coding and similarity algorithm, a method of matching remote sensing image patches is proposed. Specifically, first, from the centroid of a surface target, 36 lines are created in a clockwise direction with intervals (10°) to obtain the boundary points of the surface target, a process referred to as equiangular boundary distance coding. Then, several shape indices are proposed for the boundary points, including the self-similarity, circularity, shape complexity, and centroid offset, based on which a shape similarity algorithm for surface targets is established. Furthermore, based on the shape similarity of neighboring targets, a matching algorithm for remote sensing image patches is proposed. Finally, the lakes at the global scale and in the western China are extracted from online remote sensing images of different data sources to carry out the matching experiments. Based on the experiments, we found that the recall rate of the algorithm proposed in this paper is improved by 13.8% compared to the similarity algorithm sampled by distance. The precision reaches more than 90% when the similarity of the neighbor targets is considered. Through algorithm adaptation analysis, our proposed algorithm can still maintain a reasonable matching accuracy with certain projection deformation. If the overall morphology and spatial distribution of targets and their neighboring targets are similar, the matching accuracy of different spatial scales could be maintained above 80%. This paper provides new ideas and methods for spatial cognition of maps and automatic perception of surface locations.

How to quickly obtain the geographical location of satellite remote sensing images without auxiliary parameters is a key to make full use of remote sensing image information obtained by non-cooperative means. Using the similarity of image features to realize satellite remote sensing image retrieval is an effective means to obtain the geographical location of satellite remote sensing images without auxiliary parameters. In order to explore the feasibility of deep learning derived global features for satellite remote sensing image retrieval and positioning without auxiliary parameters, an evaluation system considering both effectiveness and efficiency is established, which quantifies the Precision@K, average ranking, feature extraction time, feature similarity calculation time, and hardware consumption. Using the image data provided by Google Earth as the reference image, the summer and winter data from ZY-3 as the test datasets, several representative convolution neural network such as AlexNet, VggNet, ResNet, DenseNet, and EfficientNet are trained and used to extract the global features of the reference image and test datasets, respectively. Using multiple indicators of the evaluation system, the image representation capability of these models is comprehensively evaluated and quantitatively analyzed. The results show that: (1) the global features extracted by deep learning models have higher effectiveness in satellite remote sensing image retrieval and positioning. Compared with local features, these models provide a new way for satellite remote sensing image retrieval and positioning; (2) based on the test datasets, the performance of DenseNet, ResNet-18, and VggNet is relatively better, and the precision@K of DenseNet is the highest, indicating the highest success rate. The success rate is also a primary index in satellite remote sensing image retrieval and positioning. The mAR of ResNet-18 is close to that of VggNet and slightly higher than that of DenseNet model. In terms of efficiency, the ResNet-18 model is better among the three models, with less feature extraction time, the least feature similarity calculation time, and the smallest feature file. Its feature vector has only 512 dimensions, but its effectiveness is close to the DenseNet model; (3) The deep learning derived global features have good robustness using different image resolutions. With different resolutions, the corresponding cosine distance and the sorting number of the correct image change little in this study, which can overcome the limitation in existing satellite remote sensing image retrieval and positioning methods with different resolutions; (4) Among these models, the feature extraction of AlexNet takes the least time, and EfficientNet_b7 takes the most time in feature extraction. The image size, feature element type, and texture richness have little impact on the time of feature extraction; (5) For the image representation with poor texture information such as desert, ocean, cloud, and continuous mountain, the representation ability of deep learning models needs to be further improved.
