陈龙彪 , 张大庆
, 张大庆
CHEN Longbiao, ZHANG Daqing
通讯作者:
收稿日期: 2016-07-28
修回日期: 2016-09-22
网络出版日期: 2016-11-20
版权声明: 2016 《地球信息科学学报》编辑部 《地球信息科学学报》编辑部 所有
基金资助:
作者简介:
作者简介:陈龙彪(1987-),男,福建漳州人,博士生,主要从事普适计算和智慧城市感知计算等方面的研究。 E-mail: longbiaochen@zju.edu.cn
展开
摘要
随着港口信息化建设的推进,积累了大量来源多样、结构各异的海事大数据,为了解港口城市的生产力和区域经济发展水平提供了新的契机。本文综合介绍了作者近期关于如何利用海事大数据进行港口感知计算的工作,给出了一个基于海事大数据的港口感知计算框架,利用船舶GPS轨迹、船舶属性、港口地理信息和港口设施参数等多源异构海事大数据,估算出一系列反映港口生产力的指标,从而对港口进行综合评价和比较。首先,利用船舶轨迹和港口地理信息数据,自动检测船舶在港口码头中的靠泊装卸事件;然后,利用船舶属性和港口设施数据,自动估计出每次靠泊装卸事件的货物吞吐量;最后,对各个港口码头的靠泊船数和货物吞吐量进行统计,从而计算出一系列港口生产力指标,包括到港船数、货物吞吐量、码头作业效率和泊位利用率等。在2011年的海事大数据上的实验结果表明,本框架能准确地估算出上述港口生产力指标。同时,以香港为例对上述港口的生产力指标进行分析,探讨基于海事大数据的港口感知计算框架在提高港口生产效率、优化海运航线中的积极作用。
关键词:
Abstract
With the wide applications of information and communication technologies in port infrastructures and operations, huge volumes of maritime sensing data have been generated. These data come from various sources and demonstrate heterogeneous structures, providing us with new opportunities to understand port performance and regional economic development. In this paper, we introduce the recent work on port sensing and computation based on maritime big data. Specifically, by making use of ship GPS trajectories, ship attributes, port geographic information and port facility parameters, we can automatically estimate a set of metrics for the measurement and comparison of port performance. First, we can use ship GPS trajectories and port geographic information to detect the events of ships arriving at different ports and terminals. Second, we can use ship attributes and port facility parameters to estimate the cargo throughput of each arrived ship. Third, we can aggregate the ship arriving events and the cargo throughput in different terminals and ports to derive a set of port performance metrics, including ship traffic, port throughput, terminal productivity and facility utilization rate. Evaluation results using real-world maritime data collected in 2011. Results showed that these methods accurately estimated the port performance metrics. We also presented a case study in port of Hong Kong to showcase the effectiveness of our framework in port performance analysis.
Keywords:
港口是全球航运行业的重要枢纽。目前,全球约有2500多个国际贸易港口[1]。港口不仅是货物水陆空运输的中转地,而且提供了发展转口贸易、自由港和自由贸易区的机会,在现代国际生产、贸易和运输系统中处于十分重要的战略地位,对城市发展和区域经济繁荣具有重要作用[1]。中国作为制造业大国,需要大力发展港口物流在进出口中的作用,加快港口设施建设,提高港口运营效率,建设一批具有国际生产力的贸易口岸。
港口的生产力通常由一系列指标来描述。例如,联合国贸易与发展会议[2]提出了宏观和微观2大类港口运营指标:宏观指标对港口经济活动总量进行量化,而微观指标则关注于港口运营效率;Kemme等[3]则从港口设计规模和运营服务水平2个方面对港口生产力进行评价;Esmer等[4]认为港口生产力应涵盖货物吞吐量、港口运营效率、设施利用率和港口服务水平4个方面。在已有的港口生产力评价标准中,以下4个指标得到了广泛重视:①到港船数,即一段时间内抵达港口进行货物装卸的船舶数量;②货物吞吐量,即一段时间内在港口装卸的货物总量;③码头作业效率,即单位时间内各个码头装卸的货物的能力;④泊位利用率,即港口中各个泊位停靠船舶进行货物装卸的时间比例。这些指标已被广泛应用于港口管理部门和航运公司的统计报告中[5-6],对评价港口的生产力水平和运营状况具有重要的作用。
传统上,统计和发布上述港口生产力指标需要对码头运营作业数据进行现场采集和汇总[4],这一过程往往需要耗费大量人力物力;同时,来自不同港口的指标可能存在时间滞后、粒度不一,甚至数据缺失等问题,影响了港口之间的生产力横向比 较[7]。因此,建立一个自动化、低成本的港口生产力估计平台,可以实现对各个港口的客观评价和综合比较,对促进港口建设和优化航运路线具有重要意义。目前,已有研究人员提出了一些方案来估计港口生产力指标。例如,Peng等[8]利用港口历史统计数据来估计未来的港口货物吞吐量;Shabayek等[9]结合港口泊位信息和船舶到港统计数据来估计泊位利用率;JOC集团的研究人员[10]则利用码头岸吊参数和航运公司航次数据来估算出码头的作业效率。然而,上述研究工作通常依赖于特定港口管理部门和特定航运公司的统计数据,研究结论仍然存在时间滞后、难以跨港口进行横向比较等问题。
近年来,随着港口基础设施建设的完善和航运行业信息化的推进,积累了各种关于港口和船舶的海事大数据[11]。例如,借助船舶自动识别系统(Automatic Identification System, AIS)[12],船舶在港口中的GPS移动轨迹可以被港口基站实时采集和存储。这些海事数据来自港口生产的各个领域,细粒度地描述了港口运营的各个方面,为评价和比较港口的生产力水平提供了新的契机。
本文以集装箱港口为例,介绍了一个基于海事大数据的港口感知计算框架,利用船舶GPS轨迹、船舶属性、港口地理信息和港口设施参数等多源异构海事大数据,估算出一系列反映港口生产力的指标,从而对港口进行综合评价和比较。即首先利用船舶轨迹和港口地理信息数据,自动检测船舶在港口码头中的靠泊装卸事件;然后,利用船舶属性和港口设施数据,自动估计出每次靠泊装卸事件的货物吞吐量;最后,对各个港口码头的靠泊船数和货物吞吐量进行统计,从而计算出一系列港口生产力指标,包括到港船数、货物吞吐量、码头作业效率和泊位利用率等。本文采用了2011年度的海事大数据对该框架进行验证,实验结果表明,本框架能准确地估算出上述港口生产力指标。同时,以香港为例对上述港口的生产力指标进行分析,探讨基于海事大数据的港口感知计算框架在提高港口生产效率、优化海运航线中的积极作用。
(1)船舶GPS轨迹:此类数据主要来源于船舶自动识别系统(AIS)。AIS系统通过在船舶上装载GPS信号接收器和发射器,将船舶的位置、航向、航速等船舶运动信息实时向所在海域进行发布。这些信号能够被港口基站、卫星等接收装置接收和汇总,从而在海事管理终端上实时监测港口和航线上的船舶动态[13]。
(2)船舶属性:通常包括船舶类型、尺寸、吨位等船舶固有信息。例如,根据用途和积载方式不同,可将主要货运船舶分为集装箱船、普通货船、散货船、液化气船等类型[14]。为了对船舶信息进行管理,建立了各大船级社组织,如英国劳氏船级社(http://www.lr.org/)
(3)港口地理信息:船舶进入港口以后,一般需要先在锚地系泊以等待码头和泊位分配,然后再靠泊码头进行货物装卸作业。港口地理信息一般可由2种途径获得。对于部分港口,可以从港口管理部门网站或规划报告中获得详细的码头位置、泊位布局等;对于无公开信息的港口,则可以通过卫星地图进行港口地理信息标注。
(4)港口设施参数:根据用途不同,港口中不同码头、泊位的尺寸、水深等各不相同,不同码头装备的装卸设施(如岸吊)的规格、数量也各有差异。为帮助航运公司进行码头租用和航线规划,港口管理部门一般会将其港口的基础设施参数在其网站或年报上进行公布[3]。例如,新加坡国际港务集团网站(https://www.singaporepsa.com/our-business/terminals)
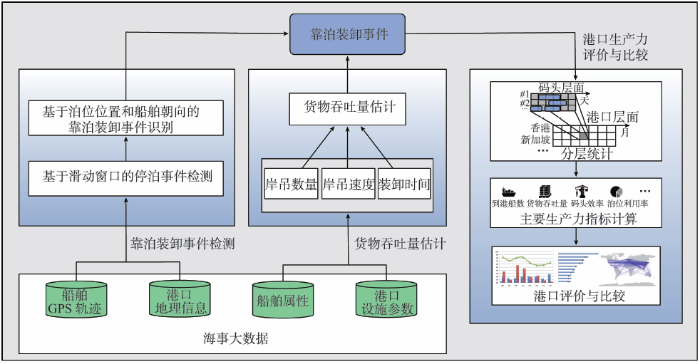
本文介绍了一个基于海事大数据的港口感知计算框架如图1所示。该框架包括靠泊装卸事件检测、货物吞吐量估计、港口生产力评价与比较3个阶段。在不同阶段,对不同的海事大数据进行融合运用。①在靠泊装卸事件检测阶段,从船舶GPS轨迹中检测出船舶静止的事件,然后结合泊位位置和船舶朝向,识别出船舶在码头的靠泊装卸事件;②在货物吞吐量估计阶段,结合船舶属性和港口设施参数,建立货物装卸吞吐量估计的经验公式,从而估计每个靠泊装卸事件的货物吞吐量;③在港口生产力评价与比较阶段,从码头层面和港口层面对不同靠泊卸装事件进行统计,进而计算出不同港口的到港船数、货物吞吐量、码头作业效率和泊位利用率等生产力指标,并基于这些指标对全球主要港口进行评价和排名。本文以集装箱港口为例,分别对这3个步骤进行详细阐述。
图1 基于海事大数据的港口感知计算框架
Fig. 1 Port sensing and computing framework based on maritime big data
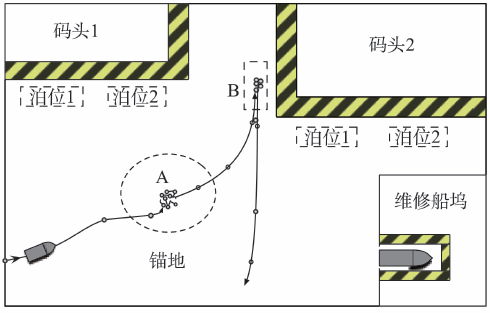
本阶段的目标是从船舶GPS轨迹中抽取船舶在港口中的靠泊装卸事件[7]。如图2所示,集装箱船舶进入港口后,一般需要在锚地(区域A)先进行停泊,以检疫并排队等待集装箱码头泊位;准备就绪后,船舶靠泊于特定码头(区域B),利用码头岸吊进行集装箱装卸。此外,船舶在港口中还会进行补给、维修等活动。因此,需要从船舶在港口中的复杂活动中检测出真正的靠泊装卸事件。通过将船舶GPS位置与泊位区域进行匹配,以直接检测其是否靠泊于码头。但是,由于船舶GPS定位存在误差,且船舶尺寸可能远大于一个泊位大小,故直接利用相对位置判断船舶是否靠泊于泊位内,往往会造成较大误差。因此,本文介绍一个解决这个问题的流程:(1)利用一个滑动窗口方法直接检测船舶轨迹中的各类停泊事件;(2)结合泊位位置和船舶朝向,从这些停泊事件中识别真正的靠泊装卸 事件。
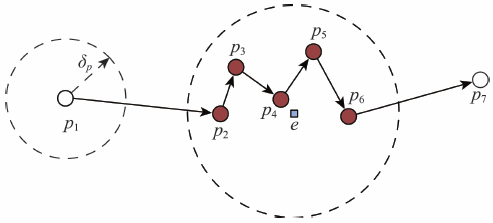
首先定义停泊事件如下:对船舶轨迹p1→p2→…→pn(其中p代表船舶的GPS位置点),如果轨迹片断pm→pm+1→…→pm+k (1≤m<n, 1≤k≤n-m)满足:片断中任意相邻2个点之间的距离(dist)小于阈 值δp(式(11))。则称该轨迹片断为一个停泊事件。使用一个基于滑动窗口的方法来检测这些轨迹片断。如图3所示,对于船舶轨迹p1→ p2→…→p7,先以起始2个点p1, p2作为窗口,判断其距离是否小于阈值δp。由于dist(p1, p2) > δp,丢弃该窗口,并滑动到该窗口尾部。接着,创建一个新的窗口(p2, p3),然后判定dist(p2, p3) < δp,并保留该窗口;而由于dist(p3, p4) < δp,将p4加入该窗口,并重复这一过程,直到下一个点不满足上述距离约束。通过这种方法,得到了一个完整的轨迹片断窗口,即p2→…→p6。为了更方便地描述一个停泊事件,将提取的轨迹片断表示为(ship_id, position, duration),其中ship_id对应该船舶的唯一编号,position对应上述轨迹片断的中心位置,而duration则表示该停泊事件的时间长度,即轨迹片断中最后一个点与第一个点之间的时间差。
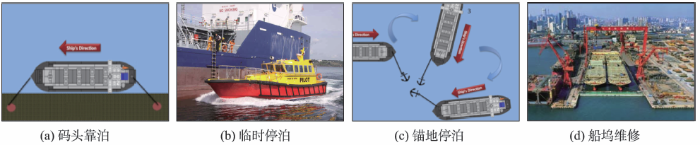
上一步检测出来的停泊事件可能对应着船舶在港口中的等待、装卸、维修等活动(图3),需要从各类停泊事件中识别出真正的船舶在泊位上靠泊装卸的事件。因此,结合泊位地理位置信息和船舶朝向,可以采用以下主要特征来识别船舶靠泊装卸事件。
(1)船舶与泊位中心的距离:借助泊位地图,可以计算出每个停泊事件的中心点与各个泊位中心点的距离,并取最小的距离作为该船舶与泊位的距离。由于船舶GPS定位存在误差,直接判断停泊事件中心点是否位于泊位以内往往会导致较大误差。
(2)船舶朝向:当船舶靠泊在泊位并进行装卸时,由于缆绳和绞链的固定作用,船舶的朝向一般不会发生较大变化;而当船舶通过船锚固定在锚地或临时停泊时,其朝向往往会不断变化(图4)。因此,可借助船舶朝向来区分船舶是否处于靠泊状态。
(3)停泊时间:集装箱船舶靠泊装卸时间一般持续几个小时,而在泊位附近的临时停泊(如引航员登船)则往往只持续几分钟(图4)。
利用以上特征和部分船舶靠泊装卸数据,训练了一个SVM模型来识别靠泊装卸事件。最后,得到每个靠泊事件所对应的船舶编号、码头编号、港口编号和靠泊时间,即b=(ship_id, terminal_id, port_id, duration)。
这一阶段的目标是估算每次靠泊装卸事件中的货物吞吐量。根据文献[15]、[16]可以建立一个基于码头岸吊装卸作业的集装箱吞吐量估计模 型[7]。一次靠泊装卸的集装箱吞吐量主要与以下因素有关:
(1)分配给该船舶的岸吊数量:该数量与船舶的长度呈正相关:船舶长度越长,允许同时作业的岸吊越多,因此可能分配给该船舶的岸吊数量也越多;
(2)单一岸吊装卸集装箱速度:该速度与船舶和岸吊的横向宽度相关:船舶和岸吊宽度越大,运送一个集装箱花费的时间越长,因而装卸速度越慢;
(3)每个岸吊的有效装卸时间:岸吊的有效工作时间比实际靠泊时间短,因为岸吊作业期间需要在集装箱堆栈中移动,这部分时间称为非作业时间,需要从靠泊时间中扣除。
因此,利用船舶属性数据(如船舶长度)和港口设施数据(如岸吊宽度),估计出每个靠泊事件中的岸吊数量、岸吊装卸速度和有效装卸时间,进而估计出集装箱吞吐量。
(1)估算出每个靠泊事件中的岸吊数量。一方面,船舶长度越长,可能分配给该船舶的岸吊数量也越多;另一方面,岸吊作业时需要保持最小安全距离Dq。因此,对长度为Ls的船舶而言,最多允许同时作业的岸吊数量
值得注意的是,在一次靠泊事件中,实际分配给船舶的岸吊数量还取决于当前码头中可用的岸吊数量Nq_avail。因此,最终分配给船舶的岸吊数量Nq由式(3)进行估计。
通过港口设施参数获得每个码头的可用岸吊总数,并结合当前码头的其他靠泊事件对Nq_avail进行更新。
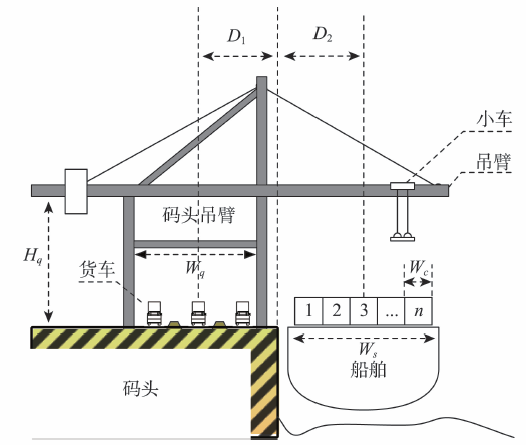
(2)对每个岸吊的装卸速度进行估计。岸吊装卸速度一般以每小时处理集装箱的个数进行衡量,其具体装卸流程如图5所示。从船上卸载集装箱到码头上时,利用小车吊起集装箱,并沿着岸吊运送到码头一侧的卡车上;从码头装载集装箱到船舶上时则顺序相反。假设卡车顺序到来并且没有延迟,根据文献[17]-[18],集装箱装卸时间主要与以下2个因素相关:
①小车抓取和放置集装箱时间。该时间可以由Hq/Vs进行估计,其中Hq是岸吊的高度,而Vs则是小车缆线卷动速度。一般而言,抓取和放置一个集装箱的时间约为30 s。
②小车在岸吊上的运行时间。该时间与船舶和岸吊的宽度有关。如图5所示,运送一个集装箱的平均距离为2(D1+D2)(包括空载距离),其中D1=Wq是岸吊半宽,而D2=Ws是船舶半宽。如果小车运行速度是Vt,则小车在岸吊上的运行时间可估计为 (Wq+Ws)/Vt。
(3)对岸吊的有效装卸时间进行估计。岸吊的非作业时间主要包括:①岸吊准备时间:当船舶进入和离开泊位时,岸吊需要举起以防止碰撞。将这个时间记为∆Tp;②岸吊平移时间:当岸吊处理完一排集装箱以后,需要平移到另一排继续处理,将这个时间记为∆Ts。对一次时长为T的靠泊装卸事件,其实际有效装卸时间如式(4)所示。
结合上述3个因素,估算出一次靠泊事件的吞吐量π(式(15))。
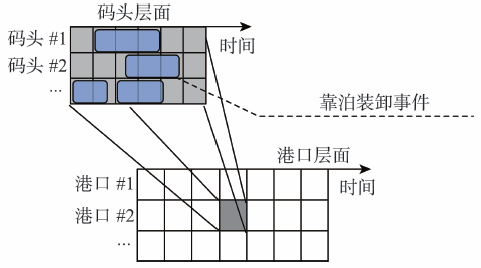
在这一阶段,对各个港口和码头的靠泊船数和货物吞吐量进行统计[25]。如图6所示,首先将识别出来的靠泊装卸事件对应到不同的码头上,统计计算出一段时间内码头层面上的一系列生产力指标;然后,将同一港口各个码头的靠泊装卸事件按时间顺序进行统计,从而得到港口层面上的生产力指标。
图6 码头层面和港口层面的靠泊装卸事件统计示意图
Fig. 6 Illustration of berthing event aggregation interminal and port levels
本文主要计算以下4个港口生产力指标:
(1)到港船数:统计一段时间(如一个月)内到达不同码头或港口的船舶数量。该指标通常被港口管理部门用于评价码头和港口的生产力以及与其他港口的连通便利性[5,19]。
(2)货物吞吐量:统计一段时间内不同码头或港口装卸的集装箱数量。这一指标通常被认为是集装箱港口最重要的生产力指标之一,并常用于港口排名[1]。
(3)码头作业效率:统计一段时间内不同港口和码头装卸集装箱的速度,一般以每小时箱数衡量。因该指标直接反映港口装卸集装箱的效率,成为航运公司衡量港口服务质量的重要指标之一[3]。
(4)泊位利用率:统计一段时间内泊位被占用的时间比例。泊位利用率对港口管理至关重要[20],因为其不仅关系到码头设施的有效利用,也关系到港口中船舶的等待时间。例如,当泊位利用率太高时,船舶进行港口以后往往需要排队等候,间接影响了港口的服务质量。
利用真实的海事数据可以对港口感知计算框架进行验证。具体收集了以下4种海事数据集:
(1)船舶GPS轨迹数据集:由船讯网(http://www.shipfinder.com/)
(2)船舶属性数据集:MarineTraffic API(http://www.marinetraffic.com/en/p/api-services)
(3)港口地理信息数据集:从各大港口的网站上获得了码头和泊位的地理位置数据,并利用Google Earth卫星地图标定了部分没有公开数据的码头和泊位位置;
(4)港口设施数据集:从Marine Cadastre(http://marinecadastre.gov/data/)
首先验证靠泊装卸事件检测方法的准确性。利用香港海事处公布的抵港船只登记表(http://www.mardep.gov.hk/en/pub_services/arridepa.html) 个靠泊装卸事件,包括船舶编号、码头编号、靠泊时间等字段。根据船舶编号,从轨迹数据集中提取对应的船舶轨迹,检测其在香港的靠泊装卸事件。通过比较不同特征组合条件下的检测精确率(Precision)和召回率(Recall)(表1),发现船舶方向对提高检测准确率有显著帮助。在同时使用3 组特征的情况下,识别的精确率和召回率都达到了90%以上,能准确地检测出船舶靠泊装卸事件。
表1 不同特征组合条件下靠泊事件检测的精确率和召回率
Tab.1 Precision and recall of berthing event detection under different feature combinations
| 特征 | 精确率/(%) | 召回率/(%) |
|---|---|---|
| 距离 | 0.671 | 0.721 |
| 距离 +方向 | 0.831 | 0.928 |
| 距离 +方向 +时间 | 0.906 | 0.942 |
在此基础上,利用2011年度香港和新加坡港口的集装箱船舶轨迹进行靠泊事件检测,并与港口管理部门公布的到港船数数据进行比较,其结果如 表2所示。实验结果表明,本文方法可以准确地检测出2个集装箱港口的到港船数。
表2 2011年度香港和新加坡集装箱船舶到港船数检测结果
Tab. 2 Results of berthing event detection inHong Kong and Singapore in 2011
| 港口 | 检测值 | 公布值 | 误差/(%) |
|---|---|---|---|
| 香港 | 13 211 | 13 347 | 1.02 |
| 新加坡 | 18 973 | 19 290 | 1.64 |
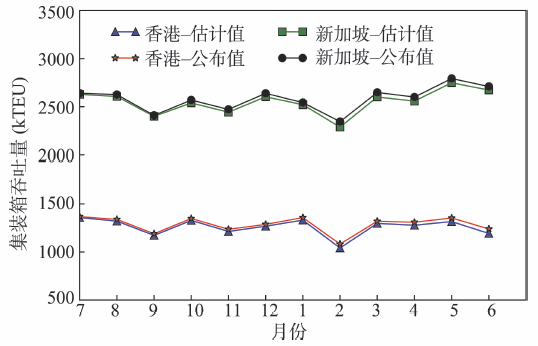
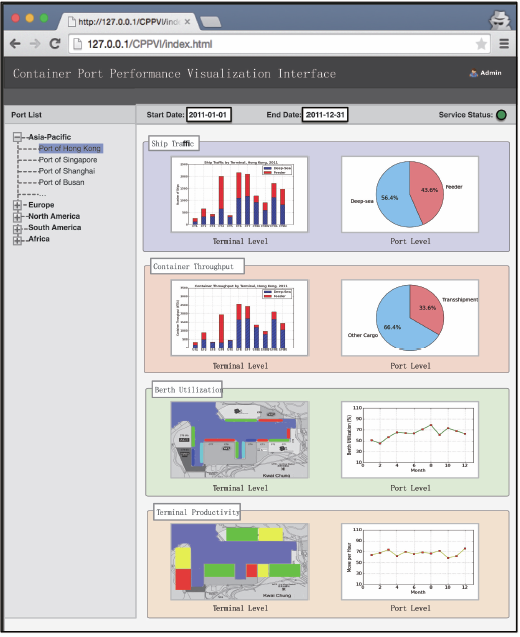
利用2011年香港和新加坡2个港口公布的集装箱吞吐量数据作为真实数据,对船舶吞吐量估计方法进行验证。首先用2011年前6个月的数据来帮助选择式(5)中的参数,即Dq, Hq, Wq, Vs, Vt, ∆Tp, ∆Ts。根据港口设施数据确定这些参数的范围,再从中选择最优参数,使得估计值与真实值最接近。然后,利用这些参数对2011年后6个月和2012年前6个月2个港口的集装箱吞吐量进行估计,并与港口真实数据进行比较。由图7可知,估计值与真实值相吻合,在香港和新加坡的平均绝对百分比误差(MAPE)[21]分别为0.4%和1.0%.最后,计算了全球主要港口的生产力指标,并设计了一套界面对其进行展示,如图8所示。该界面左侧是港口列表,右侧是对应港口和码头层面上的4个生产力指标的展示图表。根据船舶功能和大小等属性,将到港船舶分类为集装箱供应船(Feeder Ship)和远洋船舶(Deep-Sea Ship),并分别显示其到港船数;相应地,将其对应的集装箱吞吐量分为转运货物(Transshipment Cargo)和非转运货物(Other Cargo),如图8所示。
图7 2011年7月至2012年6月期间2个港口的集装箱吞吐量估计结果
Fig. 7 Results of container throughput estimation inboth ports from 2011/07 to 2012/06
图8 港口生产力指标评价与比较框架的界面
Fig. 8 The interface of the port performancemeasurement and comparison framework
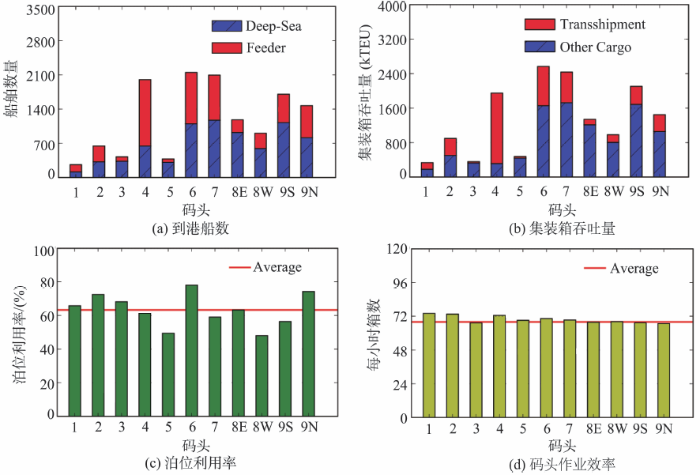
以香港为例,对港口生产力指标的结果进行分析。图9呈现了香港各个集装箱码头2011年的生产力指标。由此可看出,由于不同码头的规模不同、设施各异,其到港船数和集装箱吞吐量也存在较大差异。但是,各个码头之间的泊位利用率和码头作业效率则较为接近。特别地,香港各个泊位的平均利用率达63.28%,比60%的经验最优值[20]高,这说明香港的泊位存在供不应求的状态,可能会出现船舶排除等候的拥堵状态。另外,各个码头的平均效率达67箱/h,比60箱/h的全球码头平均装卸效率[22]高,说明香港的码头作业效率普遍维持在较高水平。
基于港口吞吐量指标,对全球主要集装箱港口进行了排名,并与JOC集团公布的2011年全球前50个集装箱港口排名[23]进行比较。表3列出了前10个港口排名结果,其中有9个港口位于亚洲。然而,本文方法得出的香港排名与JOC公布的排名不一致。其原因在于香港存在特殊的“中流作业”模式[24],即船舶不靠泊码头而利用趸船直接在海面上直接集装箱装卸。本文方法仅统计了靠泊吞吐量,因此对香港的估计比总吞吐量低。
表3 全球前 10 集装箱港口排名(按2011年度吞吐量排序)
Tab.3 Top 10 container ports (ranked bythroughput in 2011)
| 排名 | 本文排名 | JOC 排名 |
|---|---|---|
| 1 | Shanghai | Shanghai |
| 2 | Singapore | Singapore |
| 3 | Shenzhen | Hong Kong |
| 4 | Busan | Shenzhen |
| 5 | Hong Kong | Busan |
| 6 | Ningbo-Zhoushan | Ningbo-Zhoushan |
| 7 | Guangzhou | Guangzhou |
| 8 | Dubai | Qingdao |
| 9 | Qingdao | Dubai |
| 10 | Rotterdam | Rotterdam |
多源异构的海事大数据中蕴含了丰富的海事知识和潜能,能够为港口管理和航运发展提供决策参考。本文介绍了一个基于海事大数据的港口感知与计算框架,利用船舶GPS轨迹、船舶属性、港口地理信息和港口设施参数等多源异构海事大数据,估算出一系列反映港口生产力的指标,从而对港口进行综合评价和比较。利用真实的海事大数据,验证了本框架的准确性和有效性。以此可以帮助港口管理部门和航运公司更好地了解港口运营情况,为提高码头作业效率提高、优化海运航线以及促进区域经济发展提供依据。
The authors have declared that no competing interests exist.
| [1] |
Container shipping and ports: an overview [J]. |
| [2] |
Port marketing and the challenge of the third generation port[R]. |
| [3] |
Container-Terminal Logistics [M]. |
| [4] |
Performance measurements of container terminal operations [J].
ABSTRACT In the world, all ports are unique, and the task of measuring and analyzing performance is not simple and is made more difficult by the failure to establish industry standards on what to measure, how to measure it and how to express the measure in an informative and consistent manner. This difficulty is compounded by the fact that there is no single measure that can sum up all the important aspects of port or terminal performance. This study aims to analyze the existing literature about performance measures of container terminal operations.
|
| [5] |
Port of Hong Kong Statistical Tables[R]. |
| [6] |
MPA annual report 2011[R]. |
| [7] |
|
| [8] |
A comparison of univariate methods for forecasting container throughput volumes [J].https://doi.org/10.1016/j.mcm.2009.05.027 URL [本文引用: 1] 摘要
In this paper, six univariate forecasting models for the container throughput volumes in Taiwan three major ports are presented. The six univariate models include the classical decomposition model, the trigonometric regression model, the regression model with seasonal dummy variables, the grey model, the hybrid grey model, and the SARIMA model. The purpose of this paper is to search for a model that can provide the most accurate prediction of container throughput. By applying monthly data to these models and comparing the prediction results based on mean absolute error, mean absolute percent error and root mean squared error, we find that in general the classical decomposition model appears to be the best model for forecasting container throughput with seasonal variations. The result of this study may be helpful for predicting the short-term variation in demand for the container throughput of other international ports.
|
| [9] |
A simulation model for the Kwai Chung container terminals in Hong Kong [J].https://doi.org/10.1016/S0377-2217(01)00216-8 URL [本文引用: 1] 摘要
Although the trade recession has had a notable impact on Hong Kong's container port business, a positive growth rate could still be achieved. In 1998, Hong Kong handled totally 14.6 million twenty-foot equivalent units (TEUs) of containers, a slight increase of 1.4% over 1997. In 1998, due to Hong Kong's efficient port facilities, it was even selected as the best Asian port by “Cargonews Asia”. Of the total container throughput, container terminals in Kwai Chung handled 66%. As the success of container-handling industry is significant, in this paper, an application of a simulation model (using Witness software) to simulate Kwai Chung container terminals is developed and described. The objective was to investigate to what extent a simulation model could predict the actual container terminal operations with a higher order of accuracy.
|
| [10] |
Quay crane productivity [ |
| [11] |
https://doi.org/10.3969/j.issn.1673-2278.2012.02.005 URL [本文引用: 1] 摘要
“近年来,海事系统一直在加强信息亿建设工作,其实质就是在建设智能海事、构建智慧海事。”2012年直属海事系统工作会议上,部海事局常务副局长陈爱平正式提出了“智慧海事”的概念。
https://doi.org/10.3969/j.issn.1673-2278.2012.02.005 URL [本文引用: 1] 摘要
“近年来,海事系统一直在加强信息亿建设工作,其实质就是在建设智能海事、构建智慧海事。”2012年直属海事系统工作会议上,部海事局常务副局长陈爱平正式提出了“智慧海事”的概念。
|
| [12] |
Use of the Automatic Identification System (AIS) for maritime domain awareness (MDA) [C]. |
| [13] |
et al. Automatic Identification System (AIS): data reliability and human error implications [J]. |
| [14] |
et al. The complex network of global cargo ship movements [J].https://doi.org/10.1098/rsif.2009.0495 URL PMID: 2880080 [本文引用: 1] 摘要
Transportation networks play a crucial role in human mobility, the exchange of goods, and the spread of invasive species. With 90% of world trade carried by sea, the global network of merchant ships provides one of the most important modes of transportation. Here we use information about the itineraries of 16,363 cargo ships during the year 2007 to construct a network of links between ports. We show that the network has several features which set it apart from other transportation networks. In particular, most ships can be classified in three categories: bulk dry carriers, container ships and oil tankers. These three categories do not only differ in the ships' physical characteristics, but also in their mobility patterns and networks. Container ships follow regularly repeating paths whereas bulk dry carriers and oil tankers move less predictably between ports. The network of all ship movements possesses a heavy-tailed distribution for the connectivity of ports and for the loads transported on the links with systematic differences between ship types. The data analyzed in this paper improve current assumptions based on gravity models of ship movements, an important step towards understanding patterns of global trade and bioinvasion.Kaluza, Pablo; K枚lzsch, Andrea; Gastner, Michael T; Blasius, Bernd
|
| [15] |
Transshipment of containers at a container terminal: An overview [J].https://doi.org/10.1016/S0377-2217(02)00293-X URL 摘要
At container terminals, containers are transshipped from one mode of transportation to another. Within a terminal different types of material handling equipment are used to transship containers from ships to barges, trucks and trains and vice versa. Over the past decades, ships have strongly increased in size, up to 8000 TEU (Twenty feet equivalent unit container). In order to use these big ships efficiently, the docking time at the port must be as small as possible. This means that large amounts of containers have to be loaded, unloaded and transshipped in a short time span, with a minimum use of expensive equipment. This paper gives a classification of the decision problems that arise at container terminals. For various decision problems, an overview of relevant literature is presented. Quantitative models from this literature, which try to solve the problems are discussed. Finally, some general conclusions and subjects for further research are given.
|
| [16] |
Container terminal operation and operations research - a classification and literature review [J].https://doi.org/10.1007/s00291-003-0157-z URL Magsci 摘要
<a name="Abs1"></a>In the last four decades the container as an essential part of a unit-load-concept has achieved undoubted importance in international sea freight transportation. With ever increasing containerization the number of seaport container terminals and competition among them have become quite remarkable. Operations are nowadays unthinkable without effective and efficient use of information technology as well as appropriate optimization (operations research) methods. In this paper we describe and classify the main logistics processes and operations in container terminals and present a survey of methods for their optimization.
|
| [17] |
Operations research at container terminals: a literature update [J].https://doi.org/10.1007/s00291-007-0100-9 URL Magsci 摘要
The current decade sees a considerable growth in worldwide container transportation and with it an indispensable need for optimization. Also the interest in and availability of academic literatures as well as case reports are almost exploding. With this paper an earlier survey which proved to be of utmost importance for the community is updated and extended to provide the current state of the art in container terminal operations and operations research.
|
| [18] |
Quay crane scheduling with non-interference constraints in port container terminals [J].https://doi.org/10.1016/j.tre.2006.08.001 URL 摘要
The quay crane scheduling problem studied in this paper is to determine a handling sequence of holds for quay cranes assigned to a container vessel considering interference between quay cranes. This paper provides a mixed integer programming model for the considered quay crane scheduling problem that is NP-complete in nature. A genetic algorithm is proposed to obtain near optimal solutions. Computational experiments are conducted to examine the proposed model and solution algorithm. The computational results show that the proposed genetic algorithm is effective and efficient in solving the considered quay crane scheduling problem.
|
| [19] |
Future of transshipment in Singapore [J].https://doi.org/10.1093/tropej/fmq030 URL [本文引用: 1] 摘要
Purpose ‐ Transshipment points in container transport are a vital part of the functioning and competitiveness of global logistics systems. However, competition between different geographical locations is ongoing and therefore competitive landscape and leading actors are continuously changing. The purpose of this paper is to understand one of world's leading transshipment points, Singapore, and its competitiveness in the future as lower-cost alternative locations try to challenge its position. Design/methodology/approach ‐ Observations are based and mostly drawn upon qualitative case study interviews among 11 key companies involved in Singapore's transshipment business. Along with this, second-hand national statistics are used to support the findings. Findings ‐ As Singapore is the largest container sea port in the world, it has several advantages at its disposal to defend its position against the others. These are mainly due to connectivity around the world, and second, the high frequency of these connections. However, even though the customs procedures are generally argued to be smooth and state of the art, in some comments from real life actors, problematic areas and further room for improvement were inferred. Longitudinal statistics from national consensus also show, for example, that the electronics industry transshipment volumes are on the decline, and the main reason could possibly be due to the relocation of manufacturing sites to China or Vietnam, changing in turn the transshipment point in Asia. For future consideration, Singapore should enhance its capabilities in localization of value-added services or manufacturing while goods are in-transit, and also invest in technologies enabling higher container fill rates for airline shipments. Research limitations/implications ‐ In most qualitative research, amount of observations is always limited and this work is not an exception with this regard. However, reliability caveat is tried to be covered with careful selection of interviewed organizations and using second-hand national statistics to verify the interviewees' inputs. Practical implications ‐ This research has value for all countries with high-cost transshipment points, in building their operations to sustain against new lower-cost entrants. Also, the functioning of global supply chains with respect to cost, lead time and technical capability are better understood through this case study, as all the examples are drawn from real life. Originality/value ‐ The paper shows how global logistics networks have changed significantly in recent decades, and it is increasingly in line with case study findings after major sea ports such as Dubai and Shanghai have grown into leading position throughout the world.
|
| [20] |
Berth Occupancy at Container Terminals: Comparison of Analytical and Empirical Results [J].
The different kinds of container ships with variable numberof containers arrive to porls, each container requiring single service.In this paper, an analytical approach is developed with thehelp of bulk queueing system, to analyze and to plan the berlhoccupancy depending on the number of containers in on boardand on shore and on the average waiting time/average servicetime ratios. The appropriate numerical results and graphs arepresented for direct determination of the berlh occupancies fordifferent number of containers.The arrivals of container ships at container terminal areusually a stochastic process. The number of berths required willdepend on the berth occupancy. In order to determine the numberof berths required, we have to know the distribution of shiparrivals and the distribution of ship service times includingpeak factors or seasonal variations. In this paper, the relationshipbetween berlh occupancy and container ship turnaroundtime at container terminal is based on bulk-arrivals and singleservice queueing models. We have assumed that the inter-arrivaltimes and service times follow appropriate probability distributionswith determined limitations. Howeve1; given resultscan be used with a high degree of confidence for first approximatesolutions and as the control of berth occupancy or wrivalof ship to berlh.
|
| [21] |
Error measures for generalizing about forecasting methods: Empirical comparisons [J].https://doi.org/10.1016/0169-2070(92)90008-W URL [本文引用: 1] 摘要
This study evaluated measures for making comparisons of errors across time series. We analyzed 90 annual and 101 quarterly economic time series. We judged error measures on reliability, construct validity, sensitivity to small changes, protection against outliers, and their relationship to decision making. The results lead us to recommend the Geometric Mean of the Relative Absolute Error (GMRAE) when the task involves calibrating a model for a set of time series. The GMRAE compares the absolute error of a given method to that from the random walk forecast. For selecting the most accurate methods, we recommend the Median RAE (MdRAE)when few series are available and the Median Absolute Percentage Error (MdAPE) otherwise. The Root Mean Square Error (RMSE) is not reliable, and is therefore inappropriate for comparing accuracy across series.
|
| [22] |
|
| [23] |
The JOC Top 50 World Container Ports 2011 [J].
A list of the "Journal of Commerce" (JOC) Top 50 World Container Ports in 2010 is presented which includes Shanghai, China, Singapore, and Hong Kong.
|
| [24] |
A container load center with a developing hinterland: a case study of Hong Kong [J].https://doi.org/10.1016/S0966-6923(98)00011-8 URL [本文引用: 1] 摘要
No abstract provided.
|
| [25] |
et al. "Container Port Performance Measurement and Comparison Leveraging Ship GPS Traces and Maritime Open Data" [J].https://doi.org/10.1109/TITS.2015.2498409 URL [本文引用: 1] 摘要
Container ports are generally measured and compared using performance indicators such as container throughput and facility productivity. Being able to measure the performance of container ports quantitatively is of great importance for researchers to design models for port operation and container logistics. Instead of relying on the manually collected statistical information from different port authorities and shipping companies, we propose to leverage the pervasive ship GPS traces and maritime open data to derive port performance indicators, including ship traffic, container throughput, berth utilization, and terminal productivity. These performance indicators are found to be directly related to the number of container ships arriving at the terminals and the number of containers handled at each ship. Therefore, we propose a framework that takes the ships' container-handling events at terminals as the basis for port performance measurement. With the inferred port performance indicators, we further compare the strengths and weaknesses of different container ports at the terminal level, port level, and region level, which can potentially benefit terminal productivity improvement, liner schedule optimization, and regional economic development planning. In order to evaluate the proposed framework, we conduct extensive studies on large-scale real-world GPS traces of container ships collected from major container ports worldwide through the year, as well as various maritime open data sources concerning ships and ports. Evaluation results confirm that the proposed framework not only can accurately estimate various port performance indicators but also effectively produces port comparison results such as port performance ranking and port region comparison.
|

/
| 〈 |
|
〉 |