刘鹏华 , 姚尧, 梁昊
LIU Penghua, YAO Yao, LIANG Hao
通讯作者:
收稿日期: 2016-07-1
修回日期: 2016-11-1
网络出版日期: 2017-04-20
版权声明: 2017 《地球信息科学学报》编辑部 《地球信息科学学报》编辑部 所有
基金资助:
作者简介:
作者简介:刘鹏华(1995-),男,本科生,研究方向为遥感与地理信息系统。E-mail:liuphhhh@foxmail.com
展开
摘要
近年来,细颗粒物污染尤其是PM2.5受到人们越来越多的关注,研究PM2.5的时空分布规律也具有越来越重大的意义。传统的遥感反演方法模型复杂,且不能揭示近地表面的PM2.5分布规律。地面监测站的建设为PM2.5的研究提供了更实时的观测数据,但由于测量噪声的影响,观测数据存在不准确的极端异常值。为了揭示中国PM2.5的时空分布特征,本研究采用Kalman滤波对2015年中国338个城市的空气质量监测网络大数据进行最佳估计,并分析其时空特征。同时,根据中国各城市的PM2.5浓度的时序分布,采用基于DTW的K-Medoids聚类方法将其分为4个等级,并采用q统计量来评估PM2.5浓度分布的空间分层异质性。结果表明,采用Kalman滤波能有效去除数据噪声,峰值信噪比(PSNR)明显增大。在时空分布上,中国PM2.5时间分布曲线呈现“U”形,冬季PM2.5浓度明显高于夏季,且日变化曲线呈现“W”形;秋冬季PM2.5浓度的空间分层异质性非常显著,且空间分布呈现“双核分布”,重污染区主要分布在华北平原、新疆等地,西藏、广东、云南等地是稳定的空气质量优良区。
关键词:
Abstract
Serious air pollution has recently aroused wide public concerns in China. The traditional method of quantitative remote sensing model is not only sophisticated but also inaccurate to fetch the exact PM2.5 data near the ground. Though the built-up ground monitoring stations can now provide sufficient PM2.5 observation data with high sampling frequency, there still exist many extreme outliers due to inevitable observation noise. Therefore, in this study, we adopted Kalman filter for optimal estimation of time-series of air quality data in 338 cities of China and comprehensively analyzed the spatiotemporal distribution pattern during the period of 2015. In our detailed analysis, we used DTW based K-Medoids clustering to classify cities into 4 levels according to their contamination degree, and utilized q statistic technique to evaluate the spatial stratified heterogeneity of PM2.5. The results show that by using Kalman filter, noise can be effectively reduced and value of PSNR can be significantly improved. In the study of temporal distribution, we found that PM2.5 followed a ‘U’ curve in yearly temporal distributions while daily temporal distributions obeyed a ‘W’ curve. PM2.5 density is much higher in winter than in summer in China, and spatial stratified heterogeneity is even more pronounced during the fall-winter stage. In the study of spatial distribution, it can be clearly seen that PM2.5 appears a ‘Dual-core’ pattern across China where concentration of PM2.5 spiked at Xinjiang and North China plain. In contrast, Xizang, Guangdong and Yunnan are more stable areas with excellent air quality, ranking first-tier nationwide.
Keywords:
近年来,中国频繁发生连续高强度的雾霾天气和大气污染,PM2.5已经成为主要的大气污染物[1]。PM2.5能对可见光产生消光作用,从而使可见度降低,更严重的是它进入人体后沉积在肺泡和支气管,对人体健康造成危害[2-4]。为此,研究PM2.5的分布特征具有重大意义。
传统的PM2.5的研究主要利用卫星观测数据,通过遥感反演气溶胶光学厚度(AOT)来揭示PM2.5的分布规律[5-8]。但是,利用遥感反演方法数据更新周期长,难以揭示不同时间尺度(季节、月、日)的PM2.5浓度变化规律,也难以反映近地面PM2.5浓度的空间分布格局[9]。2012年以来,中国陆续在全国各城市建设了空气质量监测站,并实时监测和发布PM2.5等6项污染物浓度数据。监测站的数据更新周期为1 h,因而能揭示不同时间尺度的PM2.5变化规律。武装[10]等利用监测数据,基于Hadoop平台进行了空气污染时空分布的可视化分析,王振波等[11]基于中国2014年190个城市的945个监测站的PM2.5浓度观测数据,采用空间数据统计模型,揭示了中国PM2.5的时空分布格局。然而,时空维度上的直观统计量只能揭示特定城市的时间变化规律,而不能反映其与其他城市的相关性。而且,由于测量噪声的存在,采用均值滤波处理监测站数据不能反映PM2.5浓度的真实分布。
为了真实反映PM2.5的时空分布特征和城市之间的相关性,本研究采用网络开源大数据,基于一维线性卡尔曼滤波获取PM2.5浓度的最佳估计值,分析和揭示中国PM2.5的时空分布规律;并根据城市PM2.5浓度的月度变化规律采用基于DTW的K-Medoids方法将中国城市聚为4类,通过研究每类城市的特征,进一步揭示了不同城市之间的PM2.5分布的相似性和关联性。
本文的研究区为中国大陆,包括23个省、5个自治区、4个直辖市、2个特别行政区。近年来,中国频繁遭遇严重的雾霾天气和连续高强度的大气污染[12]。随着《环境空气质量标准》的出台,中国陆续建设了一批空气质量监测站,并实时向公众提供空气质量信息。如图1所示,截止2015年12月,研究区内1406个空气质量监测站点分布于全国338个城市。监测站点集中分布在社会经济较发达的京津冀地区和东部沿海省份,其中,京津、山东、江苏、广东的监测站点分布最密集,约占34.47%,而新疆、西藏、青海等西部省份虽然地域宽广,监测站点却极稀疏,仅占5.08%。
本文研究数据来自BestApp工作室从环保部获取监测数据而建立的空气质量数据共享平台(http://pm25.in/),该平台逐小时发布空气质量监测数据,并提供免费的PM2.5数据接口。本文研究数据均从该平台数据接口获取,包括2015年1-12月的1200多万条数据,每条数据包括空气质量指标(AQI),CO、NO2、O3、SO2、颗粒物等浓度,以及站点所在城市、数据发布时间等说明性记录。
由于各个站点投入使用的时间不一致,且监测环境不同,数据存在大量的缺失。一方面,新的监测站点在不断建设和工作,导致不同时间所获取的空气质量监测数据站点数目不一致,新建站点在发布数据之前的数据存在缺失。另一方面,由于不同站点的监测环境差异,部分站点在某些时刻未能及时发布新数据,或发布的数据存在字段缺失。据统计,以2015年12月31日的监测站点记录为标准,研究数据中存在约4.23%的数据缺失和0.76%的零值记录。为此,本研究对缺失数据进行线性内插处理。
在对缺失数据进行线性内插后,数据能保持较高的一致性。然而,在实际测量中,由于气候、自然环境、污染源的差异[13],监测站采用的微量振荡天平法和Beta射线法都存在监测数据偏差太大和不稳定的问题[14]。为此,本研究采用Kalman滤波对观测进行最佳估计,进而对时序数据进行降维处理(图2)。Kalman滤波是Kalman[15-16]提出的一种时域滤波算法,其采用时间递推的方式,考虑了系统的过程噪声和测量噪声[17],是一种对观测值的线性最小方差估计方法[15]。Kalman滤波可以基于系统上一时刻的状态预测下一状态,当获得下一状态的观测值时,根据下一状态的预测结果和观测结果获得下一状态的最优化估计。由于在状态预测和最优估计更新时状态的噪声也被更新,因此Kalman不仅能够处理平稳变化的随机过程,也能处理多维和非平稳的随机过程[18]。
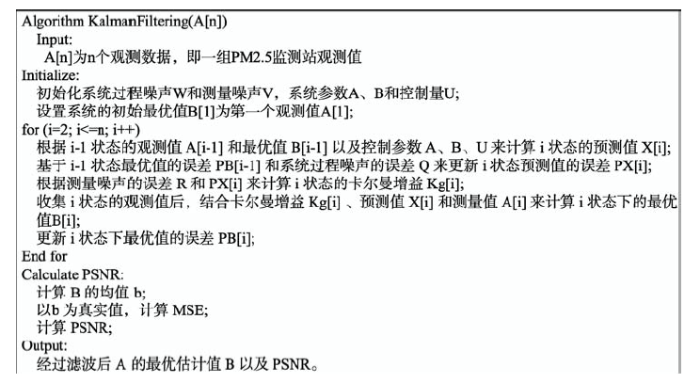
图3给出了基于Kalman滤波对PM2.5时序观测数据进行滤波处理的伪代码。其中,系统参数A为状态转移矩阵,表示后一状态对前一状态的影响;B为控制输入矩阵,描述后一状态驱动因素对后一状态的影响;U为驱动输入向量,即与PM2.5浓度分布相关的因子对其影响;Kg表示卡尔曼增益,它的值越大,表明真实值(即最优值)越接近测量值,反之越接近预测值。按照图3的处理流程,本研究对中国338个城市2015年1-12月的数据进行Kalman滤波,获得了对原始观测数据的最优估计,进而获得每小时、每个月、每个季度、全年平均PM2.5浓度。另外,基于Kalman滤波计算出滤波前后数据集的均值,并将均值分别作为数据的真实参考值,用峰值信号噪声比(PSNR)来评估采用Kalman滤波结果作为数据集代表的有效性。
在Kalman滤波的基础上,本研究获取了中国各城市PM2.5浓度的月度变化。为了有效分析不同地区PM2.5浓度的时间分布差异,本研究采用基于动态时间规整(Dynamic Time Warping, DTW)的K-Medoids聚类方法,对各个城市的PM2.5浓度分布分级划分。
K-Medoids聚类是Kaufman[19-20]提出的一种用数据相似度中心来表示聚类中心的聚类方法。相比于K-Means的最小化数据点之间欧氏距离的目标,K-Medoids的目标是使数据特征之间的相似度最小化,因而它对于噪声和异常值具有较强的稳健性。
为了描述不同城市PM2.5浓度时间序列之间的相似度,常用的方法是通过离散傅里叶变换和离散小波变换进行降维变换[21-22],并采用欧氏距离来评估其相似度,这些方法虽然可以获取时间序列之间的欧氏距离下界,然而,欧氏距离并不总能对数据之间的相似度进行很好的划分[23-25],如比较PM2.5浓度变化的时间序列时,需要特别关注浓度曲线的拐点,以浓度变化的峰值点、谷值点及其关系作为衡量序列之间相似性的重要根据。事实上,DTW可以衡量序列之间灵活的相似性和差异性,常被用于离散时间序列之间相似度的度量,并可在聚类算法中识别发现不同时间序列中的模式[26-28]。
同时,大气污染物的扩散受到地形复杂度、气象条件、大气污染物理化特征、污染源特征等多种因素的影响,其扩散过程十分复杂[29],但通过计算任意2个区域PM2.5浓度时间序列的DTW距离,可以衡量上述2个区域的PM2.5变化模式的相似性。例如,由于大气污染物在从污染源向周围进行扩散时,随着时间推进,距离污染源较远位置的PM2.5浓度峰值在时间轴上迟于距离污染源较近位置的PM2.5浓度峰值,但二者的空气污染程度相似。而DTW可以发掘时间序列中的知识,寻找模式[27],在引入聚类算法之后,具有相似知识模式的区域聚集在相同的簇中[28,30],从而实现研究区域的PM2.5聚类。
假设2个时间序列P和Q,
(1)
(2)
(3)如果wt表示矩阵中的
(4)DTW的路径长度
本研究采用DTW对2个时间序列进行动态规整,并基于DTW路径的长度来衡量2个时间序列之间的相似度。同时,采用AP(Affinity Propagation)[32]算法初始化聚类中心,来减小随机选择对聚类结果的影响。AP算法在初始过程将所有数据点作为潜在的聚类中心,数据点之间通过吸引度和归属度之间的信息传递来竞争聚类中心和选择归属的聚类中心[33-34],以此获得几个具有代表性的聚类中心。另外,为了精确化聚类数目,本研究引入Silhouette来评估聚类结果的合理性。Silhouette是Rousseeuw[35]提出的评价每个数据对象与其所属类别的适宜度的指标,它基于数据点与类内其他数据点和其他类中数据点之间的距离来衡量类内凝聚度和类间离散度[36],从而确定最适宜的聚类数目[37]。对于Y类中的某个数据对象
式中:
PM2.5的观测值存在时间差异性,而且由于不同城市监测环境和设备条件、自然社会环境、PM2.5浓度分布不同,城市观测值的空间分布具有较大差异性。本研究基于Kalman滤波进行观测数据的最佳估计,为了评估Kalman滤波最佳估计与观测值的优劣,本研究选取北京、上海、广州、南京的24 h的PM2.5浓度分析发现(表1),滤波后数据PSNR明显提高,信号失真度明显降低。因此,采用Kalman滤波对数据进行滤波处理能有效地去除噪声,更好地反映数据真实分布。
表1 Kalman滤波前后PSNR值对比表
Tab.1 PSNR value before and after Kalman filtering
| 地区 | 滤波前 | 滤波后 |
|---|---|---|
| 北京 | 12.8132 | 21.0545 |
| 上海 | 9.7523 | 14.9660 |
| 广州 | 13.2474 | 19.1636 |
| 南京 | 17.9053 | 27.0554 |
在采用Kalman滤波对数据进行最佳估计的基础上,本研究对缺失的数据进行线性内插,分别获取了中国各城市年度、季度、月度和逐小时的PM2.5平均浓度,并采用Kriging插值法模拟中国12个月的PM2.5空间分布,对中国的PM2.5时空分布进行分析。
4.1.1 时间分布分析
(1)季度PM2.5分布
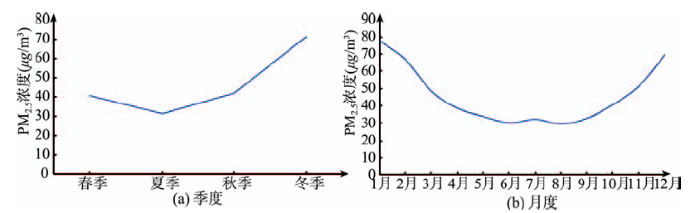
2015年1-12月中国PM2.5平均浓度为49 μg/m3,按照中国环境空气质量(GB 3095-2012)PM2.5浓度年、日均限值为15 μg/m3和35 μg/m3的标准,中国超过一半(51.95%)的城市空气质量不达标,而且PM2.5浓度呈现明显的“冬高夏低”分布模式(图4(a))。研究发现[11,38],原因主要是冬季土壤干燥,地表植被覆盖少,地面扬尘容易进入空气中,且冬季中国北部大范围地区供暖燃烧产生大量污染性气体[39],因此冬季PM2.5浓度最高,达到了71.02 μg/m3。夏季降雨量最大,天气系统变化较强,PM2.5浓度最低[40],为31.02 μg/m3。春秋季由于天气系统转换,常伴随着不稳定的天气系统变化,气候扩散条件较好[41],PM2.5浓度分别为40.42 μg/m3和41.79 μg/m3。
图4 中国PM2.5季度和月度平均浓度
Fig.4 Quarterly and monthly average concentrations of PM2.5 in China
(2)月度PM2.5分布
中国的PM2.5浓度月度变化曲线呈“U”形 (图4(b)),2-5月PM2.5浓度呈快速下降趋势,6-9月PM2.5浓度维持在较平稳水平,7月天气炎热,扬尘严重,因而PM2.5浓度略微上升。10-12月PM2.5呈现明显的上升趋势。1月PM2.5浓度最高,达到77.31 μg/m3,超过75 μg/m3的浓度标准。2月、3月和10-12月的PM2.5浓度在35 μg/m3和75 μg/m3之间。5月PM2.5浓度下降为34.14 μg/m3,8月浓度最低,为29.93 μg/m3,5-9月PM2.5浓度均在35 μg/m3以下。
(3)逐小时PM2.5分布
中国的PM2.5逐小时浓度呈双峰变化(图5),双峰分布在上午10-12时和夜间21-22时,PM2.5浓度分别达到了45.78 μg/m3和44.86 μg/m3。研究发现[39],10时开始地表太阳辐射增强,人群活动频率逐渐增加,污染排放开始积累,从而导致PM2.5含量升高。另外,20时下班晚高峰和人群夜生活的影响致使夜间20-22时PM2.5含量达到峰值。而下午由于温度升高,局部地表差异较大,空气对流增强,使得颗粒物浓度有所降低,最低为34.73 μg/m3。3-6时,人类活动对空气质量的影响最弱,PM2.5含量稳定并轻微降低。
4.1.2 空间分布分析
(1)中国PM2.5空间分布分析
从本文基于一维线性Kalman的PM2.5时空分布分析模型的的实验结果来看,中国PM2.5的分布呈现明显的空间异质性[42]。从PM2.5浓度年均值来看,中国PM2.5浓度分布呈现以“新疆-华北平原”为中心的双核分布特征,这与王振波的结论[11]基本符合。如图6所示,作为双核分布的核心,新疆喀什地区以及华北平原的河北南部、山东西部、河南北部和山西东南部PM2.5浓度高达70~80 μg/m3,并向四周扩散衰减。研究表明,河北、河南、山东等区域的常年PM2.5高浓度分布主要来源于人为污染,重工企业高源排放产生大量大气污染物[43],加之地形和气象要素的影响[39],形成相互输送的重污染区[44]。核中心附近的新疆大部、辽宁、湖北、山西、安徽、江苏PM2.5浓度达到了50~60 μg/m3,吉林、陕西、宁夏、四川、重庆、湖南、浙江等地PM2.5年均浓度为40~50 μg/m3,青海、甘肃北部、内蒙古北部、黑龙江北部及广西、广东、江西等地区PM2.5年均浓度维持在30~40 μg/m3,西藏、云南、海南、珠江三角洲地区、福建、空气质量良好,年均浓度为20~30 μg/m3,低于GB 3095-2012年均限值35 μg/m3。西藏、云南人口稀疏,开发强度不大,且植被覆盖度高,因此PM2.5含量很低,空气质量高。海南、福建为沿海省份,由于空气强对流和海水的吸收作用,可吸入颗粒物含量极低。
图6 2015年中国PM2.5平均浓度空间分布图
Fig.6 Spatial distribution of average PM2.5 concentration in China in 2015
同时,中国的PM2.5浓度空间分布的分界线与以“黑河-腾冲”为界的胡焕庸线吻合度极高。在胡焕庸线东南的地区集中了中国绝大部分人口,同时,该地区的PM2.5浓度也比胡焕庸线西北的青海、西藏等地区高。
(2)中国PM2.5月度空间分布分析
图7表现了中国PM2.5空间分布的月度变化特征。1月,中国超过50%的地区PM2.5浓度超过 75 μg/m3,尤其是华北平原和湖北,其月均PM2.5浓度超过了100 μg/m3,部分城市超过120 μg/m3。2月全国PM2.5浓度有所下降,但以湖北和华北平原为中心的地区空气中颗粒物月均浓度依旧在75 μg/m3以上。3-9月中国大部分地区空气质量较良好,而从4月开始新疆西北部的喀什地区出现较严重的颗粒物污染现象,且其浓度超过了125 μg/m3。薛江丽等[44]研究发现新疆在春季沙尘暴期间(3-5月)PM2.5浓度明显上升,而且春季天气交替造成沙尘天气频繁,因此春季新疆PM2.5浓度较高。10月开始,华北平原和新疆地区空气状况开始变差。11月,以吉林、辽宁为中心的东北地区空气中颗粒物含量急剧上升,超过了100 μg/m3。12月,重度污染区开始南移,甘肃以东、长江以北的地区几乎都受重度污染影响,而西北的新疆地区也维持较高的PM2.5浓度。
图7 中国2015年1-12月PM2.5浓度空间分布图
Fig.7 Spatial distribution of PM2.5 concentration in China in 2015
本研究采用Kriging模拟出中国PM2.5的月度空间分布差异,并通过地统计的方法获取每个城市的PM2.5月度浓度。基于12个月的时序数据,本研究在地市级尺度上采用K-Medoids聚类方法对中国各城市进行PM2.5浓度的时序聚类,来识别PM2.5浓度变化具有相似时间分布特征的城市群。
本研究首先采用Silhouette指标来最优化聚类数目,在类间差异最大的情况下使类内数据具有最高的相似度。基于Silhouette指标的聚类数目选择结果如图8所示,在聚类数目为4时,Silhouette值达到峰值0.3256,表明将城市群聚集为4类能最大程度上划分其时间分布差异。因此,本研究选取中国各城市12个月的PM2.5平均浓度作为特征,采用AP初始化聚类中心,并以DTW路径长度为特征距离,将城市群划分为4类。
图8 Silhouette值随类别数目变化图
Fig.8 The variation of Silhouette values with the changes in number of categories
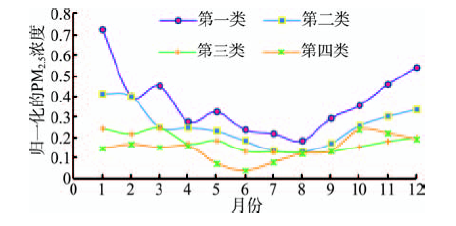
图9反映了采用K-Medoids进行城市聚类后, 4个类别的聚类中心。从图9可以明显地看出,第 1类城市的月度PM2.5浓度变化最大,且平均浓度最高,污染最严重,PM2.5浓度除了在3月和5月存在小型的上升趋势,其一年的变化趋势基本符合“U”型分布。第2类城市的PM2.5平均浓度低于第1类,且月度变化不大,均处于15~50 μg/m3之间。第3类和第4类分布规律近似,且平均浓度最低,但第4类在1-8月浓度均低于第3类,而进入10月之后PM2.5浓度反而高于第3类。
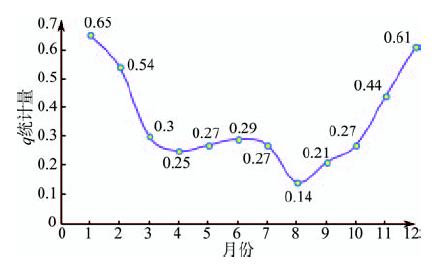
为了检验采用12个月PM2.5浓度值作为特征的空间聚类结果,本研究采用q统计量[45-46]来评估PM2.5的空间分异性。q统计量的计算公式为:
式中:N为研究单元数目,此处为研究区内城市数目;h为分层数,此处为聚类类别数;SSW为层内方差,SST为总方差。结果表明(图10),1-12月q统计量呈现先减小后增大的趋势,其中8月q统计值达到最低值0.137,而1月达到最大值0.645,这说明夏季尤其是8月PM2.5的空间分异性不明显,而秋冬季PM2.5的空间分异特性非常显著。
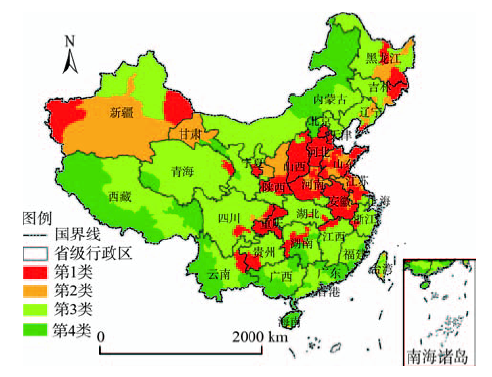
从图11可看出,PM2.5的分布具有极大的集聚性,相同类别的城市分布具有较大的空间相关性。结合图7和图9可知,中国绝大部分城市PM2.5超标严重,热点区域(第1类)主要集中在华北平原、江淮、重庆、贵州南部、新疆西部和东北,该地区城市的PM2.5浓度最高,污染最严重,且月度PM2.5浓度变化大,浮动剧烈;空气质量相对最好的地区(第4类)主要分布在内蒙古北部、西藏南部、云南、广西、广东、福建,这些地区要么城市化程度不高,要么地理气象条件利于颗粒物扩散和吸收,因此PM2.5浓度最低。此外,PM2.5浓度次级高的地区(第2类)主要包括新疆大部、甘肃北部、陕西北部,以及华北平原重污染地区外围。前者虽然不是重工企业密集区,但植被覆盖度低,沙尘天气多,降雨量少,颗粒物扩散困难,因此PM2.5浓度较高;而后者作为重污染区的缓冲地带,在大气系统的扩散和交换作用下,该地区空气质量受重污染区污染物的影响,PM2.5浓度常年较高。第3类地区占据中国大半部分区域,PM2.5浓度较良好,但在冬春季仍存在较频繁的污染情况。
图11 基于K-Medoids的城市PM2.5浓度聚类结果图
Fig.11 Clustering results of PM2.5 concentrations of cities based on K-Medoids
本研究利用网络大数据深度发掘出了PM2.5的时空变化规律在数据量大、数据繁杂的情况下,用Kalman滤波对观测数据进行最佳估计和降维清洗,并利用空间Kriging插值和地统计方法模拟中国的PM2.5时空分布,探讨其时空变异规律。此外,本研究基于DTW的K-Medoids聚类分析,探讨了中国各类城市PM2.5的时空分布规律。
从时间维度分析,中国PM2.5浓度呈现出春夏低、秋冬高的变化模式,冬季远远高于夏季,部分地区浓度超过200 μg/m3;日均PM2.5浓度呈现以10-12时和21-22时为峰值的“W”形分布。从空间维度分析,中国超过半数地区的PM2.5浓度超过国家标准(年度平均浓度不超过35 μg/m3),且严重超标的地区主要分布在以华北、江淮平原和塔里木盆地为核心的地区,PM2.5浓度以这些核心区域为中心向四周减弱分布,青藏高原、云贵、广西、广东、福建以及内蒙古东北部等地区的空气质量相对良好。
基于中国城市月度PM2.5浓度的K-Medoids聚类结果表明,中国城市的PM2.5时序分布具有较大的空间相关性,地理环境相似、经济发展产业结构相似的地区PM2.5浓度具有较相似的时间分布特征,研究表明[47-48],PM2.5的空间分布与地域、气象等因素密不可分,从城市尺度研究发现PM2.5的分布与工商业发达程度、人口聚集程度有较大相关性[49]。聚类结果还显示重污染区主要集中在华北平原、江淮以及东北、新疆部分地区,空气质量最佳区主要分布在东南沿海和西南、内蒙古部分地区。
在今后的研究中,将耦合卫星遥感数据进行PM2.5的地面观测值纠正,同时通过积累更多的数据进行不同尺度的研究,结合气象、地貌、社会经济结构等要素分析重污染区PM2.5的成因,以提出科学的治理对策。
The authors have declared that no competing interests exist.
| [1] |
基于MODIS数据的PM2.5反演在大气污染监测中的应用 [J].https://doi.org/10.16251/j.cnki.1009-2307.2016.09.010 URL [本文引用: 1] 摘要
针对基于传统10 km气溶胶光学厚度产品计算PM2.5无法获得更为精细的PM2.5空间分布特征的问题,提出采用6S模型计算获得不同气溶胶光学厚度条件下辐射传输模型方程参数查找表,该查找表可以采用原始光谱波段信息进行数据反演,并结合暗像元法计算得到的地表反射率信息,在辐射传输模型方程计算结果的基础上进行线性插值获得1 km气溶胶光学厚度,再利用地面实测PM2.5浓度数据,通过回归分析的方法,获得1 km的PM2.5监测数据.以西安市为例,1 km分辨率的PM2.5更进一步表现了西安市域内PM2.5的空间分布特征,具有明显的地形分异特征,而且呈现出从城区向郊区逐渐衰减的趋势.研究结果为小区域的PM2.5来源和变化分析提供了一种有效的技术途径.
Application of high spatial resolution PM2.5 retrieval in air pollution monitor [J].https://doi.org/10.16251/j.cnki.1009-2307.2016.09.010 URL [本文引用: 1] 摘要
针对基于传统10 km气溶胶光学厚度产品计算PM2.5无法获得更为精细的PM2.5空间分布特征的问题,提出采用6S模型计算获得不同气溶胶光学厚度条件下辐射传输模型方程参数查找表,该查找表可以采用原始光谱波段信息进行数据反演,并结合暗像元法计算得到的地表反射率信息,在辐射传输模型方程计算结果的基础上进行线性插值获得1 km气溶胶光学厚度,再利用地面实测PM2.5浓度数据,通过回归分析的方法,获得1 km的PM2.5监测数据.以西安市为例,1 km分辨率的PM2.5更进一步表现了西安市域内PM2.5的空间分布特征,具有明显的地形分异特征,而且呈现出从城区向郊区逐渐衰减的趋势.研究结果为小区域的PM2.5来源和变化分析提供了一种有效的技术途径.
|
| [2] |
Lung cancer, cardiopulmonary mortality, and long-term exposure to fine particulate air pollution [J].https://doi.org/10.1001/jama.287.9.1132. URL PMID: 11879110 [本文引用: 1] 摘要
Associations have been found between day-to-day particulate air pollution and increased risk of various adverse health outcomes, including cardiopulmonary mortality. However, studies of health effects of long-term particulate air pollution have been less conclusive.To assess the relationship between long-term exposure to fine particulate air pollution and all-cause, lung cancer, and cardiopulmonary mortality.Vital status and cause of death data were collected by the American Cancer Society as part of the Cancer Prevention II study, an ongoing prospective mortality study, which enrolled approximately 1.2 million adults in 1982. Participants completed a questionnaire detailing individual risk factor data (age, sex, race, weight, height, smoking history, education, marital status, diet, alcohol consumption, and occupational exposures). The risk factor data for approximately 500 000 adults were linked with air pollution data for metropolitan areas throughout the United States and combined with vital status and cause of death data through December 31, 1998.All-cause, lung cancer, and cardiopulmonary mortality.Fine particulate and sulfur oxide--related pollution were associated with all-cause, lung cancer, and cardiopulmonary mortality. Each 10-microg/m(3) elevation in fine particulate air pollution was associated with approximately a 4%, 6%, and 8% increased risk of all-cause, cardiopulmonary, and lung cancer mortality, respectively. Measures of coarse particle fraction and total suspended particles were not consistently associated with mortality.Long-term exposure to combustion-related fine particulate air pollution is an important environmental risk factor for cardiopulmonary and lung cancer mortality.
|
| [3] |
Health effects of particles in ambient air [J].https://doi.org/10.1078/1438-4639-00306 URL PMID: 15471105 摘要
ABSTRACT A summary of a critical review by a working group of the German commission on Air Pollution Prevention of VDI and DIN of the actual data on exposure and health effects (excluding cancer) of fine particulate air pollution is presented. EXPOSURE: Typical ambient particle concentrations for PM10 (PM2.5) in Germany are in the range of 10-45 (10-30) microg/m3 as annual mean and 50-200 (40-150) microg/m3 as maximum daily mean. The ratio of PM2.5/PM10 generally amounts between 0.7 and 0.9. HEALTH EFFECTS: During the past 10 years many new epidemiological and toxicological studies on health effects of particulate matter (PM) have been published. In summary, long-term exposure against PM for years or decades is associated with elevated total, cardiovascular, and infant mortality. With respect to morbidity, respiratory symptoms, lung growth, and function of the immune system are affected. Short-term studies show consistant associations of exposure to daily concentrations of PM with mortality and morbidity on the same day or the subsequent days. Patients with asthma, COPD, pneumonia, and other respiratory diseases as well as patients with cardio-vascular diseases and diabetes are especially affected. The strongest associations are found for PM2.5 followed by PM10, with no indication of a threshold value for the health effects. The data base for ultra fine particles is too small for final conclusions. The available toxicological data support the epidemiological findings and give hints as to the mechanisms of the effects. CONCLUSION: The working group concludes that a further reduction of the limit values proposed for 2005 will substantially reduce health risks due to particulate air pollution. Because of the strong correlation of PM10 with PM2.5 at most German sites there is no specific need for limit values of PM2.5 for Germany in addition to those of PM10.
|
| [4] |
Potential toxicological and cardiopulmonary effects of PM2.5 exposure and related mortality: Findings of recent studies published during 2003-2013 [J].https://doi.org/10.3967/bes2016.007 URL PMID: 26822514 [本文引用: 1] 摘要
正INTRODUCTION Air pollution has become a serious environmental issue owing to its diverse harmful effects on the physical and biological environment.According to the Environmental Protection Agency(EPA)and the World Health Organization(WHO)[1-2],air pollution affects millions of people worldwide.Hundreds of thousands of deaths each year and a range of diseases,
|
| [5] |
Estimating regional spatial and temporal variability of PM2.5 concentrations using satellite data, meteorology, and land use information [J].https://doi.org/10.1289/ehp.0800123 URL PMID: 19590678 [本文引用: 1] 摘要
Studies of chronic health effects due to exposures to particulate matter with aerodynamic diameters
|
| [6] |
A novel calibration approach of MODIS AOD data to predict PM2.5 concentrations [J].https://doi.org/10.5194/acp-11-7991-2011 URL 摘要
Epidemiological studies investigating the human health effects of PM2.5 are susceptible to exposure measurement errors, a form of bias in exposure estimates, since they rely on data from a limited number of PM2.5 monitors within their study area. Satellite data can be used to expand spatial coverage, potentially enhancing our ability to estimate location- or subject-specific exposures to PM2.5, but some have reported poor predictive power. A new methodology was developed to calibrate aerosol optical depth (AOD) data obtained from the Moderate Resolution Imaging Spectroradiometer (MODIS). Subsequently, this method was used to predict ground daily PM2.5 concentrations in the New England region. 2003 MODIS AOD data corresponding to the New England region were retrieved, and PM2.5 concentrations measured at 26 US Environmental Protection Agency (EPA) PM2.5 monitoring sites were used to calibrate the AOD data. A mixed effects model which allows day-to-day variability in daily PM2.5-AOD relationships was used to predict location-specific PM2.5 levels. PM2.5 concentrations measured at the monitoring sites were compared to those predicted for the corresponding grid cells. Both cross-sectional and longitudinal comparisons between the observed and predicted concentrations suggested that the proposed new calibration approach renders MODIS AOD data a potentially useful predictor of PM2.5 concentrations. Furthermore, the estimated PM2.5 levels within the study domain were examined in relation to air pollution sources. Our approach made it possible to investigate the spatial patterns of PM2.5 concentrations within the study domain.
|
| [7] |
Estimating ground-level PM2.5 using aerosol optical depth determined from satellite remote sensing [J].https://doi.org/10.1029/2005JD006996 URL 摘要
We assess the relationship of ground-level fine particulate matter (PM) concentrations for 2000-2001 measured as part of the Canadian National Air Pollution Surveillance (NAPS) network and the U.S. Air Quality System (AQS), versus remote-sensed PMdetermined from aerosol optical depths (AOD) measured by the Moderate Resolution Imaging Spectroradiometer (MODIS) and the Multiangle Imaging Spectroradiometer (MISR) satellite instruments. A global chemical transport model (GEOS-CHEM) is used to simulate the factors affecting the relation between AOD and PM. AERONET AOD is used to evaluate the method (r = 0.71, N = 48, slope = 0.69). We find significant spatial variation of the annual mean ground-based measurements with PMdetermined from MODIS (r = 0.69, N = 199, slope = 0.82) and MISR (r = 0.58, N = 199, slope = 0.57). Excluding California significantly increases the respective slopes and correlations. The relative vertical profile of aerosol extinction is the most important factor affecting the spatial relationship between satellite and surface measurements of PM; neglecting this parameter would reduce the spatial correlation to 0.36. In contrast, temporal variation in AOD is the most influential parameter affecting the temporal relationship between satellite and surface measurements of PM; neglecting daily variation in this parameter would decrease the correlation in eastern North America from 0.5-0.8 to less than 0.2. Other simulated aerosol properties, such as effective radius and extinction efficiency have a minor role temporally, but do influence the spatial correlation. Global mapping of PMfrom both MODIS and MISR reveals annual mean concentrations of 40-50 ug/mover northern India and China.
|
| [8] |
Satellite-based spatiotemporal trends in PM2.5 concentrations: China, 2004-2013 [J]. |
| [9] |
Limitations of Remotelysensed Aerosol as a Spatial Proxy for Fine Particulate Matter [R]. |
| [10] |
基于大数据的空气质量数据可视化 [J].https://doi.org/10.3969/j.issn.1000-8772.2015.03.174 URL [本文引用: 1] 摘要
近一个世纪以来,由于工业化、城市化的飞速发展、人类活动的加剧造成了世界性的能源、交通规模的持续扩大,城市人口的急剧膨胀,各类生产活动和生活中所产生的大量有害物质被排放到空气中,改变了空气的组成成分,形成了空气污染。空气污染是世界和中国大多数工业城市所面临的最为严重的环境问题。开展空气质量监测、数据分析与可视化的研究可以全面掌握城市空气污染源的排放数据和各种空气污染物在不同空间区域内的浓度数据,可以对影响城市空气质量的因素有所了解和把握。本文提出了利用空气污染观测资料和先进的大数据Hadoop平台,对空气监测数据进行数据挖掘和分析的思路,依据逐年逐日的天气现象数据,针对地区空气污染状况以及时间分布特征的影响进行研究,并以可视化的方法对空气污染物的时空分布特征与预测进行探讨。
Air quality data visualization based on big data [J].https://doi.org/10.3969/j.issn.1000-8772.2015.03.174 URL [本文引用: 1] 摘要
近一个世纪以来,由于工业化、城市化的飞速发展、人类活动的加剧造成了世界性的能源、交通规模的持续扩大,城市人口的急剧膨胀,各类生产活动和生活中所产生的大量有害物质被排放到空气中,改变了空气的组成成分,形成了空气污染。空气污染是世界和中国大多数工业城市所面临的最为严重的环境问题。开展空气质量监测、数据分析与可视化的研究可以全面掌握城市空气污染源的排放数据和各种空气污染物在不同空间区域内的浓度数据,可以对影响城市空气质量的因素有所了解和把握。本文提出了利用空气污染观测资料和先进的大数据Hadoop平台,对空气监测数据进行数据挖掘和分析的思路,依据逐年逐日的天气现象数据,针对地区空气污染状况以及时间分布特征的影响进行研究,并以可视化的方法对空气污染物的时空分布特征与预测进行探讨。
|
| [11] |
2014年中国城市PM_(2.5)浓度的时空变化规律 [J].https://doi.org/10.11821/dlxb201511003 URL [本文引用: 3] 摘要
大气霾污染因其对人体健康、生态环境和气候变化的影响而成为全球关注的严重环境问题,PM2.5是中国霾污染频繁的主要原因.过去对国家尺度上PM2.5时空分布的认识主要基于卫星观测,因其反演方法的局限性,卫星资料难以真实反映近地面PM25浓度的时空变化规律.本文基于中国2014年190个城市中的945个监测站的PM2.5浓度观测数据,采用空间数据统计模型,揭示了中国PM25的时空格局.结果显示,2014年中国城市PM25平均浓度61 gg/m3,具有显著的冬秋高、春夏低的"U"型逐月变化规律和周期性U-脉冲型逐日变化规律;中国城市PM2.5浓度呈现显著的空间分异与集聚规律,以及两次南北进退的空间循环周期;胡焕庸线和长江是中国PM25浓度高值区和低值区的东西和南北分界线,胡焕庸线以东和长江以北的环渤海城市群、中原城市群、长三角城市群、长江中游城市群和哈长城市群等地区是2014年PM25的高污染城市聚集地,京津冀城市群是全年污染核心区;以珠三角为核心的东南沿海地区是稳定的空气质量优良区.
Spatial-temporal characteristics of the PM2.5 in China in 2014 [J].https://doi.org/10.11821/dlxb201511003 URL [本文引用: 3] 摘要
大气霾污染因其对人体健康、生态环境和气候变化的影响而成为全球关注的严重环境问题,PM2.5是中国霾污染频繁的主要原因.过去对国家尺度上PM2.5时空分布的认识主要基于卫星观测,因其反演方法的局限性,卫星资料难以真实反映近地面PM25浓度的时空变化规律.本文基于中国2014年190个城市中的945个监测站的PM2.5浓度观测数据,采用空间数据统计模型,揭示了中国PM25的时空格局.结果显示,2014年中国城市PM25平均浓度61 gg/m3,具有显著的冬秋高、春夏低的"U"型逐月变化规律和周期性U-脉冲型逐日变化规律;中国城市PM2.5浓度呈现显著的空间分异与集聚规律,以及两次南北进退的空间循环周期;胡焕庸线和长江是中国PM25浓度高值区和低值区的东西和南北分界线,胡焕庸线以东和长江以北的环渤海城市群、中原城市群、长三角城市群、长江中游城市群和哈长城市群等地区是2014年PM25的高污染城市聚集地,京津冀城市群是全年污染核心区;以珠三角为核心的东南沿海地区是稳定的空气质量优良区.
|
| [12] |
中国重度雾霾时空分布特征及影响因子分析[D] .Time and space distribution characteristics of the severe fog and haze of China and the influence factor analysis[D]. |
| [13] |
PM2.5自动监测仪器第一阶段测试报告和技术指标要求[R] .PM2.5 automatic monitoring instrument in the first stage test report and technical index requirements[R]. |
| [14] |
PM2.5监测技术及其比对测试研究进展 [J].https://doi.org/10.3969/j.issn.1674-5795.2013.04.002 URL [本文引用: 1] 摘要
PM2.5作为对人体健康危害最严重的大气污染物之一,其科学监测技术备受关注。文章阐述了国内外PM2.5监测的现状,重点分析滤膜称重法、Beta射线法、微量振荡天平法等5种常用的PM2.5监测技术的工作原理及特点。在此基础上,介绍了国内开展不同PM2.5监测技术比对测试研究的进展,探讨符合我国国情的监测技术和设备,并提出了提高国内PM2.5监测水平的几点建议。
Advances in monitoring technologies and its comparison research for PM2.5 [J].https://doi.org/10.3969/j.issn.1674-5795.2013.04.002 URL [本文引用: 1] 摘要
PM2.5作为对人体健康危害最严重的大气污染物之一,其科学监测技术备受关注。文章阐述了国内外PM2.5监测的现状,重点分析滤膜称重法、Beta射线法、微量振荡天平法等5种常用的PM2.5监测技术的工作原理及特点。在此基础上,介绍了国内开展不同PM2.5监测技术比对测试研究的进展,探讨符合我国国情的监测技术和设备,并提出了提高国内PM2.5监测水平的几点建议。
|
| [15] |
A new approach to linear filtering and prediction problems [J]. |
| [16] |
New results in linear filtering and prediction theory [J]. |
| [17] |
基于kalman滤波的近实时电离层TEC监测与反演[D] .Near real-time monitoring and inverting TEC of ionosphere based on kalman filter [D]. |
| [18] |
Kalman滤波理论及其在通信与信号处理中的应用[D] .Kalman filtering with its application to communication and signal processing[D]. |
| [19] |
Clustering by means of medoids [M]. |
| [20] |
Finding groups in data: An introduction to cluster analysis [M]. |
| [21] |
Efficient similarity search in sequence databases [M]. |
| [22] |
Efficient time series matching by wavelets [Z]. |
| [23] |
A multiresolution symbolic representation of time series[Z]. |
| [24] |
Landmarks: A new model for similarity-based pattern querying in time series databases[Z].
|
| [25] |
A fast and robust method for pattern matching in time series databases [J].https://doi.org/10.1109/TAI.1997.632306 URL [本文引用: 1] 摘要
Abstract: The problem of finding patterns of interest in time series databases (query by content) is an important one, with applications in virtually every field of science. A variety of approaches have been suggested. These approaches are robust to noise, offset translation, and amplitude scaling to varying degrees. However, they are all extremely sensitive to scaling in the time axis (longitudinal scaling). We present a method for similarity search that is robust to scaling in the time axis, in addition to noise, offset translation, and amplitude scaling. The method has been tested on medical, financial, space telemetry and artificial data. Furthermore the method is exceptionally fast, with the predicted 2 to 4 orders of magnitude speedup actually observed. The method uses a piecewise linear representation of the original data. We also introduce a new algorithm which both decides the optimal number of linear segments to use, and produces the actual linear representation.
|
| [26] |
A review on time series data mining [J].https://doi.org/10.1016/j.engappai.2010.09.007 URL [本文引用: 1] 摘要
Time series is an important class of temporal data objects and it can be easily obtained from scientific and financial applications. A time series is a collection of observations made chronologically. The nature of time series data includes: large in data size, high dimensionality and necessary to update continuously. Moreover time series data, which is characterized by its numerical and continuous nature, is always considered as a whole instead of individual numerical field. The increasing use of time series data has initiated a great deal of research and development attempts in the field of data mining. The abundant research on time series data mining in the last decade could hamper the entry of interested researchers, due to its complexity. In this paper, a comprehensive revision on the existing time series data mining research is given. They are generally categorized into representation and indexing, similarity measure, segmentation, visualization and mining. Moreover state-of-the-art research issues are also highlighted. The primary objective of this paper is to serve as a glossary for interested researchers to have an overall picture on the current time series data mining development and identify their potential research direction to further investigation.
|
| [27] |
Using dynamic time warping to find patterns in Time Series [Z]. |
| [28] |
Clustering of time series data-a survey [J].https://doi.org/10.1016/j.patcog.2005.01.025 URL [本文引用: 2] 摘要
ABSTRACT Time series clustering has been shown effective in providing useful information in various domains. There seems to be an increased interest in time series clustering as part of the effort in temporal data mining research. To provide an overview, this paper surveys and summarizes previous works that investigated the clustering of time series data in various application domains. The basics of time series clustering are presented, including general-purpose clustering algorithms commonly used in time series clustering studies, the criteria for evaluating the performance of the clustering results, and the measures to determine the similarity/dissimilarity between two time series being compared, either in the forms of raw data, extracted features, or some model parameters. The past researchs are organized into three groups depending upon whether they work directly with the raw data either in the time or frequency domain, indirectly with features extracted from the raw data, or indirectly with models built from the raw data. The uniqueness and limitation of previous research are discussed and several possible topics for future research are identified. Moreover, the areas that time series clustering have been applied to are also summarized, including the sources of data used. It is hoped that this review will serve as the steppingstone for those interested in advancing this area of research.
|
| [29] |
大气污染物扩散模式的应用研究综述 [J].https://doi.org/10.3969/j.issn.1001-3865.2007.05.015 URL [本文引用: 1] 摘要
应用大气污染物扩散模式可以模拟不同尺度、气象、地形条件下工业污染物在大气中的输送与扩散特征,为大气监测、城市环境规划和空气质量预报等工作提供科学依据。归纳了目前广泛应用于模拟工业污染物扩散的模式,着重介绍了近年来国内外对这些模式的主要应用研究进展,比较了各模式在应用上的优缺点,并对大气污染物扩散模式的应用研究前景进行了讨论。
A review of the development and application of air pollutant dispersion models [J].https://doi.org/10.3969/j.issn.1001-3865.2007.05.015 URL [本文引用: 1] 摘要
应用大气污染物扩散模式可以模拟不同尺度、气象、地形条件下工业污染物在大气中的输送与扩散特征,为大气监测、城市环境规划和空气质量预报等工作提供科学依据。归纳了目前广泛应用于模拟工业污染物扩散的模式,着重介绍了近年来国内外对这些模式的主要应用研究进展,比较了各模式在应用上的优缺点,并对大气污染物扩散模式的应用研究前景进行了讨论。
|
| [30] |
A novel clustering method on time series data [J].https://doi.org/10.1016/j.eswa.2011.03.081 URL [本文引用: 1] 摘要
Time series is a very popular type of data which exists in many domains. Clustering time series data has a wide range of applications and has attracted researchers from a wide range of discipline. In this paper a novel algorithm for shape based time series clustering is proposed. It can reduce the size of data, improve the efficiency and not reduce the effects by using the principle of complex network. Firstly, one-nearest neighbor network is built based on the similarity of time series objects. In this step, triangle distance is used to measure the similarity. Of the neighbor network each node represents one time series object and each link denotes neighbor relationship between nodes. Secondly, the nodes with high degrees are chosen and used to cluster. In clustering process, dynamic time warping distance function and hierarchical clustering algorithm are applied. Thirdly, some experiments are executed on synthetic and real data. The results show that the proposed algorithm has good performance on efficiency and effectiveness.
|
| [31] |
基于优化的DTW算法的人体运动数据检索 [J].https://doi.org/10.3969/j.issn.1003-6059.2012.02.025 URL [本文引用: 1] 摘要
随着大量三维人体运动数据库的建立,使得在数据库中实现基于内容的三维人体运动检索面临着诸多困难,文中提出一种分阶段的动态时间变形(DTW)优化算法的人体运动数据检索技术,可有效检索出逻辑上相似的运动。该算法首先对齐两个运动序列的坐标位置,基于窗口距离构造距离矩阵。其次采用基于全局和局部约束的DTW优化算法进行相似度匹配,得到两个运动间的对应关系。最后通过归一化相似度和DTW平均距离分阶段判断运动的相似性。实验结果表明,分阶段的DTW优化算法在提高效率的同时对长度不等的运动能取得较好的检索结果。
Human motion data retrieval based on dynamic time warping optimization algorithm [J].https://doi.org/10.3969/j.issn.1003-6059.2012.02.025 URL [本文引用: 1] 摘要
随着大量三维人体运动数据库的建立,使得在数据库中实现基于内容的三维人体运动检索面临着诸多困难,文中提出一种分阶段的动态时间变形(DTW)优化算法的人体运动数据检索技术,可有效检索出逻辑上相似的运动。该算法首先对齐两个运动序列的坐标位置,基于窗口距离构造距离矩阵。其次采用基于全局和局部约束的DTW优化算法进行相似度匹配,得到两个运动间的对应关系。最后通过归一化相似度和DTW平均距离分阶段判断运动的相似性。实验结果表明,分阶段的DTW优化算法在提高效率的同时对长度不等的运动能取得较好的检索结果。
|
| [32] |
Clustering by passing messages between data points [J]. |
| [33] |
Affinity propagation: Clustering data by passing messages[D]. |
| [34] |
AP算法在图像聚类中的应用研究 [J].
文章提出采用分块加权颜色直方图作为图像特征,将Affinity Propagation(AP)聚类算法应用到图像聚类中,并将该算法加以实现,进行算法性能研究,实验结果表明AP聚类算法应用于图像聚类能够取得较好的效果。
Research on application of algorithm AP in images clustering [J].
文章提出采用分块加权颜色直方图作为图像特征,将Affinity Propagation(AP)聚类算法应用到图像聚类中,并将该算法加以实现,进行算法性能研究,实验结果表明AP聚类算法应用于图像聚类能够取得较好的效果。
|
| [35] |
Silhouettes: A graphical aid to the interpretation and validation of cluster analysis [J].https://doi.org/10.1016/0377-0427(87)90125-7 URL [本文引用: 1] 摘要
ABSTRACT A new graphical display is proposed for partitioning techniques. Each cluster is represented by a so-called silhouette, which is based on the comparison of its tightness and separation. This silhouette shows which objects lie well within their cluster, and which ones are merely somewhere in between clusters. The entire clustering is displayed by combining the silhouettes into a single plot, allowing an appreciation of the relative quality of the clusters and an overview of the data configuration. The average silhouette width provides an evaluation of clustering validity, and might be used to select an ‘appropriate’ number of clusters.
|
| [36] |
Recovering the number of clusters in data sets with noise features using feature rescaling factors [J].https://doi.org/10.1016/j.ins.2015.06.039 URL [本文引用: 1] 摘要
In this paper we introduce three methods for re-scaling data sets aiming at improving the likelihood of clustering validity indexes to return the true number of spherical Gaussian clusters with additional noise features. Our method obtains feature re-scaling factors taking into account the structure of a given data set and the intuitive idea that different features may have different degrees of relevance at different clusters. We experiment with the Silhouette (using squared Euclidean, Manhattan, and the p$^{th}$ power of the Minkowski distance), Dunn's, Calinski-Harabasz and Hartigan indexes on data sets with spherical Gaussian clusters with and without noise features. We conclude that our methods indeed increase the chances of estimating the true number of clusters in a data set.
|
| [37] |
Selecting variables for k-means cluster analysis by using a genetic algorithm that optimises the silhouettes [J]. |
| [38] |
北京地区冬春PM2.5和PM10污染水平时空分布及其与气象条件的关系 [J].
北京2012~2013年的冬春多次出现雾霾天气,可吸入颗粒物(PM10)污染严重.而PM2.5作为PM10中粒径较小的部分,在PM10中所占比重越高,污染越严重.因此,本研究选取了能够覆盖北京所有区县的30个PM2.5和PM10的质量浓度监测点,对该地区的PM2.5和PM10污染特征进行分析,确定其空间差异特征和时间性变化特征.普通克里格插值(Original Kriging)法得到的北京地区冬、春季颗粒物浓度分布图显示,颗粒物浓度从北部山区到南部地区逐渐递增,在中心城区处,西部高于东部,且局部地区存在一定的城乡差异.颗粒物浓度月变化曲线呈单峰单谷型,1月最高,4月最低;逐日变化反映了PM2.5和PM10浓度具有较好的相关性,且受气象条件影响显著;日变化呈双峰趋势.本文选取日平均气温(℃)、相对湿度(%)、风速(风级)、降水量(mm)等气象因子,利用Spearman秩相关分析研究各个气象因子对大气PM2.5和PM10浓度的影响.北京冬季PM2.5和PM10的质量浓度分别与气温、相对湿度正相关,与风速负相关,风速和相对湿度是影响污染物质量浓度分布的主要因素.
Temporal and spatial distribution of PM2.5 and PM10 pollution status and the correlation of particulate matters and meteorological factors during winter and spring in Beijing [J].
北京2012~2013年的冬春多次出现雾霾天气,可吸入颗粒物(PM10)污染严重.而PM2.5作为PM10中粒径较小的部分,在PM10中所占比重越高,污染越严重.因此,本研究选取了能够覆盖北京所有区县的30个PM2.5和PM10的质量浓度监测点,对该地区的PM2.5和PM10污染特征进行分析,确定其空间差异特征和时间性变化特征.普通克里格插值(Original Kriging)法得到的北京地区冬、春季颗粒物浓度分布图显示,颗粒物浓度从北部山区到南部地区逐渐递增,在中心城区处,西部高于东部,且局部地区存在一定的城乡差异.颗粒物浓度月变化曲线呈单峰单谷型,1月最高,4月最低;逐日变化反映了PM2.5和PM10浓度具有较好的相关性,且受气象条件影响显著;日变化呈双峰趋势.本文选取日平均气温(℃)、相对湿度(%)、风速(风级)、降水量(mm)等气象因子,利用Spearman秩相关分析研究各个气象因子对大气PM2.5和PM10浓度的影响.北京冬季PM2.5和PM10的质量浓度分别与气温、相对湿度正相关,与风速负相关,风速和相对湿度是影响污染物质量浓度分布的主要因素.
|
| [39] |
2014年华北地区PM2.5数值模拟研究: 2015年中国环境科学学会学术年会[Z] .Numerical simulation research of PM2.5 in north China in 2014[Z]. |
| [40] |
2013年1月大气环流和天气分析 [J].https://doi.org/10.7519/j.issn.1000-0526.2013.04.017 URL [本文引用: 1] 摘要
2013年1月大气环流特征为:北半球极涡呈偶极型,极涡范围及 强度较常年偏弱,中高纬环流呈三波型,欧亚大陆槽位于西西伯利亚,位置偏北,引导多股冷空气影响我国北方,月内中高纬环流形势调整较大,上旬以经向型环流 为主,中下旬则转为纬向型环流;西太平洋副热带高压接近常年同期,东亚大槽位于西北太平洋西岸,较常年偏强,南支槽位于90°E附近,较常年略偏 弱.2013年1月,全国平均气温为-5.2℃,略低于常年同期(-5.0℃).月内气温阶段性调整明显,上旬,较同期偏低3℃,下旬,较同期偏高 1.7℃.全国平均降水量为6.5 mm,较常年同期(13.2 mm)偏少50.8%.月内出现一次强冷空气过程,雾霾天气频繁,共出现3次较大范围雾霾过程.南方部分地区遭受低温雨雪冰冻灾害,北方局地遭受雪灾,云 南大部、贵州西部及四川南部等地气象干旱持续.
Analysis of January 2013 atmosphere circulation and weather [J].https://doi.org/10.7519/j.issn.1000-0526.2013.04.017 URL [本文引用: 1] 摘要
2013年1月大气环流特征为:北半球极涡呈偶极型,极涡范围及 强度较常年偏弱,中高纬环流呈三波型,欧亚大陆槽位于西西伯利亚,位置偏北,引导多股冷空气影响我国北方,月内中高纬环流形势调整较大,上旬以经向型环流 为主,中下旬则转为纬向型环流;西太平洋副热带高压接近常年同期,东亚大槽位于西北太平洋西岸,较常年偏强,南支槽位于90°E附近,较常年略偏 弱.2013年1月,全国平均气温为-5.2℃,略低于常年同期(-5.0℃).月内气温阶段性调整明显,上旬,较同期偏低3℃,下旬,较同期偏高 1.7℃.全国平均降水量为6.5 mm,较常年同期(13.2 mm)偏少50.8%.月内出现一次强冷空气过程,雾霾天气频繁,共出现3次较大范围雾霾过程.南方部分地区遭受低温雨雪冰冻灾害,北方局地遭受雪灾,云 南大部、贵州西部及四川南部等地气象干旱持续.
|
| [41] |
Characteristics of PM2.5 speciation in representative megacities and across China [J].https://doi.org/10.5194/acpd-11-1025-2011 URL [本文引用: 1] 摘要
Based on PM2.5 chemical data sets from literature and from our surface observations, chemical species and reconstructed speciation of PM2.5 in representative Chinese megacities and across China were compared to draw insights into the characteristics of PM2.5 speciation. PM2.5 mass concentrations and speciation compositions varied substantially over geographical regions in China. Near six-fold variations in average PM2.5 concentrations (34.0–193.4 μg m 3) across China were found with high PM2.5 levels (>100 μg m 3) appearing in the cities in the northern and western regions and low levels (<40 μg m 3) in the remote forest area (Changbai Mountain) and in Hong Kong. The percentages of the sum of sulfate, nitrate and ammonium, organic matter, crustal material, and elemental carbon in PM2.5 mass ranged 7.1–57 %, 17.7–53 %, 7.1–43 %, and 1.3–12.8 %, respectively. At both urban and rural sites in the eastern region, the sum of sulfate, nitrate and ammonia typically constituted much higher fractions (40–57 %) of PM2.5 mass, indicative of more local formation/production and regional transport of the secondary aerosols, thus more intensive characteristic of "complex atmospheric pollution" compared to the western region. Organic matter had significant contribution to PM2.5 over all the sites. Organic matter plus sulfate, nitrate, and ammonia accounted for 53–90 % of PM2.5 mass across China. PM2.5 speciation across China was also characterized by high content of crustal material, which was usually at more than ~10 μg m 3 level or shared ~10 % of PM2.5 mass in urban areas, due to transported desert dust and locally induced dust. In four representative megacities (i.e. Beijing, Chongqing, Shanghai, and Guangzhou), PM2.5 mass and major components (except sulfate) were at higher levels than those in US continental east by one order of magnitude. Distinct differences in nitrate and sulfate levels and their mass ratio [NO3 ]/[SO42 ] imply that mobile sources are likely more important in Guangzhou, whereas in Chongqing it is stationary (coal combustion) sources. The observed intra-city variations in PM2.5 mass and speciation indicate that both local emissions and regional transportation contributed significantly to high fine particle loadings in Beijing, while local contribution likely played a predominant role in Chongqing. During the ten-year period from 1999 through 2008 in urban Beijing, both the sum of sulfate, nitrate, and ammonia and [NO3 ]/[SO42 ] ratio exhibited steadily increasing trends, implying that the characteristic of "complex atmospheric pollution" and the contribution from mobile sources were being enhanced.
|
| [42] |
中国PM2.5来源解析方法综述 [J].https://doi.org/10.13209/j.0479-8023.2014.068 URL [本文引用: 1] 摘要
首次对中国目前开展的PM2.5源解析方法学和技术思路进行总结,从PM2.5采样前的准备、采样器的选择、化学物种分析方法、源解析手段等方面综述我国PM2.5来源解析的方法和进展,提出未来颗粒物源解析研究的发展方向,对今后在全国各地即将大范围开展的PM2.5源解析工作和法律标准的制定具有重要的科学借鉴意义和参考价值。
Review of PM2.5 source apportionment methods in China [J].https://doi.org/10.13209/j.0479-8023.2014.068 URL [本文引用: 1] 摘要
首次对中国目前开展的PM2.5源解析方法学和技术思路进行总结,从PM2.5采样前的准备、采样器的选择、化学物种分析方法、源解析手段等方面综述我国PM2.5来源解析的方法和进展,提出未来颗粒物源解析研究的发展方向,对今后在全国各地即将大范围开展的PM2.5源解析工作和法律标准的制定具有重要的科学借鉴意义和参考价值。
|
| [43] |
年京津冀地区PM2.5浓度时空分布及来源模拟 [J].Spatial and temporal distrubions and source simulation of PM2.5 in Beijing-Tianjin-Hebei region in 2014 [J]. |
| [44] |
新疆春季两次沙尘暴过程中大气PM2.5元素组成特征分析 [J].
目的 研究新疆沙尘天气发生频次最高的中心区和田市和沙尘天气发生频次较低的地区库尔勒市大气PM2.5表面和整体元素组成特征.方法 于2008年4-5月对和田、库尔勒市的大气PM2.5进行同时段采样,分别用X射线光电子能谱(XPS)分析两城市大气PM2.5表面元素组成及价态特 征,用X-射线荧光法(XRF)分析两城市大气PM2.5整体各元素的质量分数.结果 和田大气PM2.5整体5种元素(Si、Al、Na、Ca、Mg)的质量分数超过1%,库尔勒大气PM2.5整体3种元素(Si、Al、Na)的质量分数 超过1%,两城市大气PM2.5整体元素质量分数的差异均没有统计学意义;库尔勒市大气PM2.5表面Zn、S的质量分数较高,和田市大气PM2.5表面 K、Al、Mg的质量分数较高,其差异有统计学意义(P<0.05).在两城市大气PM2.5整体和表面都检测到的元素中,元素Fe、Mg、K在 PM2.5表面发生了富集.沙尘天气发生时,大气PM2.5整体元素,除Si外,其他元素的质量分数均升高;大气PM2.5表面元素Na、Ca、K、 Al、Mg、Fe的质量分数升高,脂肪族碳、和氮结合的碳、羰基碳、铵盐、硫酸盐、Cl的质量分数降低.结论 和田大气PM2.5整体主要由5种元素(Si、Al、Na、Ca、Mg)组成,库尔勒大气PM2.5整体主要由3种元素(Si、Al、Na)组成.两城市 大气PM2.5表面的主要元素相同,均为O、C、N、Si、Al、Mg.沙尘天气多发区和田市大气PM2.5整体和表面的自然源的元素质量分数较高;沙尘 天气发生频次较低的库尔勒大气PM2.5整体和表面来自污染源的元素质量分数较高.沙尘天气时,大气PM2.5整体和表面的自然源元素质量分数升高;大气 PM2.5表面污染元素(脂肪族碳、和氮结合的碳、羰基碳、铵盐、S、Cl)质量分数降低.
Characteristics of elemental compositions of ambient PM2.5 during sandstorm in spring in Xinjiang [J].
目的 研究新疆沙尘天气发生频次最高的中心区和田市和沙尘天气发生频次较低的地区库尔勒市大气PM2.5表面和整体元素组成特征.方法 于2008年4-5月对和田、库尔勒市的大气PM2.5进行同时段采样,分别用X射线光电子能谱(XPS)分析两城市大气PM2.5表面元素组成及价态特 征,用X-射线荧光法(XRF)分析两城市大气PM2.5整体各元素的质量分数.结果 和田大气PM2.5整体5种元素(Si、Al、Na、Ca、Mg)的质量分数超过1%,库尔勒大气PM2.5整体3种元素(Si、Al、Na)的质量分数 超过1%,两城市大气PM2.5整体元素质量分数的差异均没有统计学意义;库尔勒市大气PM2.5表面Zn、S的质量分数较高,和田市大气PM2.5表面 K、Al、Mg的质量分数较高,其差异有统计学意义(P<0.05).在两城市大气PM2.5整体和表面都检测到的元素中,元素Fe、Mg、K在 PM2.5表面发生了富集.沙尘天气发生时,大气PM2.5整体元素,除Si外,其他元素的质量分数均升高;大气PM2.5表面元素Na、Ca、K、 Al、Mg、Fe的质量分数升高,脂肪族碳、和氮结合的碳、羰基碳、铵盐、硫酸盐、Cl的质量分数降低.结论 和田大气PM2.5整体主要由5种元素(Si、Al、Na、Ca、Mg)组成,库尔勒大气PM2.5整体主要由3种元素(Si、Al、Na)组成.两城市 大气PM2.5表面的主要元素相同,均为O、C、N、Si、Al、Mg.沙尘天气多发区和田市大气PM2.5整体和表面的自然源的元素质量分数较高;沙尘 天气发生频次较低的库尔勒大气PM2.5整体和表面来自污染源的元素质量分数较高.沙尘天气时,大气PM2.5整体和表面的自然源元素质量分数升高;大气 PM2.5表面污染元素(脂肪族碳、和氮结合的碳、羰基碳、铵盐、S、Cl)质量分数降低.
|
| [45] |
Geographical detectors-based health risk assessment and its application in the neural tube defects study of the Heshun Region, China [J].https://doi.org/10.1080/13658810802443457 URL [本文引用: 1] 摘要
Physical environment, man-made pollution, nutrition and their mutual interactions can be major causes of human diseases. These disease determinants have distinct spatial distributions across geographical units, so that their adequate study involves the investigation of the associated geographical strata. We propose four geographical detectors based on spatial variation analysis of the geographical strata to assess the environmental risks of health: the risk detector indicates where the risk areas are; the factor detector identifies factors that are responsible for the risk; the ecological detector discloses relative importance between the factors; and the interaction detector reveals whether the risk factors interact or lead to disease independently. In a real-world study, the primary physical environment (watershed, lithozone and soil) was found to strongly control the neural tube defects (NTD) occurrences in the Heshun region (China). Basic nutrition (food) was found to be more important than man-made pollution (chemical fertilizer) in the control of the spatial NTD pattern. Ancient materials released from geological faults and subsequently spread along slopes dramatically increase the NTD risk. These findings constitute valuable input to disease intervention strategies in the region of interest.
|
| [46] |
A measure of spatial stratified heterogeneity [J].https://doi.org/10.1016/j.ecolind.2016.02.052 URL [本文引用: 1] 摘要
Abstract Spatial stratified heterogeneity, referring to the within-strata variance less than the between strata-variance, is ubiquitous in ecological phenomena, such as ecological zones and many ecological variables. Spatial stratified heterogeneity reflects the essence of nature, implies potential distinct mechanisms by strata, suggests possible determinants of the observed process, allows the representativeness of observations of the earth, and enforces the applicability of statistical inferences. In this paper, we propose a q-statistic method to measure the degree of spatial stratified heterogeneity and to test its significance. The q value is within [0,1] (0 if a spatial stratification of heterogeneity is not significant, and 1 if there is a perfect spatial stratification of heterogeneity). The exact probability density function is derived. The q-statistic is illustrated by two examples, wherein we assess the spatial stratified heterogeneities of a hand map and the distribution of the annual NDVI in China.
|
| [47] |
PM2.5污染特征研究综述:2014中国环境科学学会学术年会[Z] .A review on PM2.5 pollution characteristic research[Z]. |
| [48] |
河北省霾日变化及成因 [J].https://doi.org/10.3969/j.issn.1673-503X.2014.01.008 URL [本文引用: 1] 摘要
利用1981-2010年河北省142个气象站地面观测资料,按照霾的观测和预报等级行业标准,分析河北省霾日空间分布特征,以石家庄为例对多霾日成因进行探讨。结果表明:河北省霾日主要分布在太行山东麓地区,霾日大值中心随时间范围扩大,日数呈增加趋势;典型代表站霾日随时间呈增加、减少和平稳变化3种趋势,单站变化差异明显;河北省霾日主要以能见度大于5 km轻微霾为主,代表站中度和重度霾日季节变化显著,64%以上出现在秋冬季节;霾的形成是多种因素综合作用的结果,区域霾日分布主要与地理环境有关,逆温层、风速、相对湿度、年降水日数与霾的形成有关。此外,地方经济发展和人类社会活动对大气污染物的排放起一定作用。
Change of haze day and its forming reason in Hebei province [J].https://doi.org/10.3969/j.issn.1673-503X.2014.01.008 URL [本文引用: 1] 摘要
利用1981-2010年河北省142个气象站地面观测资料,按照霾的观测和预报等级行业标准,分析河北省霾日空间分布特征,以石家庄为例对多霾日成因进行探讨。结果表明:河北省霾日主要分布在太行山东麓地区,霾日大值中心随时间范围扩大,日数呈增加趋势;典型代表站霾日随时间呈增加、减少和平稳变化3种趋势,单站变化差异明显;河北省霾日主要以能见度大于5 km轻微霾为主,代表站中度和重度霾日季节变化显著,64%以上出现在秋冬季节;霾的形成是多种因素综合作用的结果,区域霾日分布主要与地理环境有关,逆温层、风速、相对湿度、年降水日数与霾的形成有关。此外,地方经济发展和人类社会活动对大气污染物的排放起一定作用。
|
| [49] |
区域大气环境中PM2.5/PM10空间分布研究 [J].
提出了一种利用移动监测技术研究区域大气环境中PM2.5/PM10空间分布的方法,并在2004年12月进行了宁波市全市域PM2.5/PM10空间分布的研究.数据显示:相同路径所代表的地区PM2.5和PM10具有很好的相关性,多数路径上PM2.5与PM10数据的相关系数平方在0.95以上,而不同路径上PM2.5与PM10的比值不同.文中给出了宁波市PM2.5/PM10污染的空间分布图,直观地显示出PM2.5/PM10污染的空间分布情况,突出了污染的重点点位和地区.
Study on spatial distributions of PM2.5/PM10 in regional atmospheric environment [J].
提出了一种利用移动监测技术研究区域大气环境中PM2.5/PM10空间分布的方法,并在2004年12月进行了宁波市全市域PM2.5/PM10空间分布的研究.数据显示:相同路径所代表的地区PM2.5和PM10具有很好的相关性,多数路径上PM2.5与PM10数据的相关系数平方在0.95以上,而不同路径上PM2.5与PM10的比值不同.文中给出了宁波市PM2.5/PM10污染的空间分布图,直观地显示出PM2.5/PM10污染的空间分布情况,突出了污染的重点点位和地区.
|

/
| 〈 |
|
〉 |


