邵哲平 , 周田瑞, 潘家财, 张智铭
集美大学航海学院,厦门 361021
SHAO Zheping, ZHOU Tianrui, PAN Jiacai, ZHANG Zhiming
通讯作者:
收稿日期: 2018-04-1
修回日期: 2018-04-28
网络出版日期: 2018-05-20
版权声明: 2018 《地球信息科学学报》编辑部 《地球信息科学学报》编辑部 所有
基金资助:
作者简介:
作者简介:邵哲平(1964-),男,博士,教授,主要从事海上交通工程研究。E-mail: zpshao@jmu.edu.cn
展开
摘要
考虑到受限水域船舶类型、船舶长度以及速度对船舶领域的影响,本文基于船舶自动识别系统(Automatic Identification Systen, AIS)数据,建立受限水域内船舶动态领域模型。通过求取每一时刻目标船到本船的距离和相对方位,获得单船船位分布图,然后对本船和目标船按船舶类型、船舶长度和船速进行分类,对同一类型单船船位分布图进行叠加,获得特定类型的船位分布图,采用数理统计方法确定船舶领域的边界,最终建立受限水域船舶动态领域模型。选用舟山港螺头水道AIS数据对该方法进行验证,共挖掘出19种不同类型的船舶动态领域模型。分析结果表明:货船对货船的船舶领域最小,油船对油船的船舶领域最大;船舶领域的长度随着船长,船速的增加而增加,且在长轴方向上增加的幅度要大于短轴方向;船舶领域长度与船舶长度的比值并非为定值,而是随着船长,船速的增加而递减,船速越大,递减的幅度越大。
关键词:
Abstract
Considering the influence of ship type, ship length and speed on ship domain, this paper established a dynamic domain model in restricted waters based on Automatic Identification System (AIS) data. Firstly, the distance and relative orientation between the target ship and own ship at each moment were calculated to obtain the single ship position’s distribution diagram, then the target ship and own ship were classified based on the ship type, ship length and speed, thus to obtain the position distribution diagram of specific type of ships by combining position distribution diagram of the same type of ships. Then the boundary of ship's domain could be determined by mathematical statistics. finally, the dynamic domain model of restricted waters can be established. Taking the zhoushan luotou water area as an example, 19 different types of ship dynamic domain models are excavated. The results show that when both the type of own ship and target ship are cargo ship, the length of domain is the smallest, and when both the own ship and target ship are oil ship, the length of domain is the largest. The size of ship domain increases with the increases of ship length and speed, and the magnitude of the increase in the long axis is greater than those in the short axis. The ratio of ship domain length to ship length is not fixed, but decreases with the increase of ship length and speed, the greater the speed of the ship, the greater the decline of the ratio.
Keywords:
船舶领域一直被认为是研究船舶交通和船舶行为的最有效理论之一,是中外学者研究的热点。自从船舶领域在20世纪60年代提出以来一直被用于海上交通安全危险评判[1]。Goodwin[2]考虑了国际海上避碰规则构建了开阔水域的船舶领域,其模型由船舶右舷部分、左舷部分以及后方部分的3个扇形组成,同时提出了目标船位于船舶领域模型中心的左下方;Pietrzykowski等[3]通过统计数据方式,建立了开阔水域的船舶领域。齐乐[4]通过获取琼州海峡的船舶自动识别系统(Automatic Identification System, AIS)数据,利用传统的DCPA,TCPA并结合模糊理论,建立了琼州海峡的船舶领域模型。丁法[5]通过选取成山头水域的AIS信息,考虑了船舶类型和船舶尺度对船舶领域的影响,建立了不同类型的船舶领域。
上述船舶领域的研究水域都是在开阔水域,对受限水域的船舶领域研究较少,向哲等[6]考虑到船舶长度对船舶领域的影响,建立了受限水域的船舶领域模型,席朝阳等[7]通过借助可视化技术和网格技术,获得能见度不良的情况下受限水域内船长80~100 m的船舶领域模型,但向哲和席朝阳等[8,9,10]都未考虑到在受限水域内船舶速度对船舶领域的影响,而在受限水域内由于航道宽度,船舶性能等的影响,船舶长度和船速对船舶领域的尺度和形状影响很大。因此为了准确建立受限水域的船舶领域,应考虑到船舶类型、船舶长度以及船速对船舶领域的影响。通过求取每一时刻目标船到本船的距离和相对方位,获得单船船位分布图,然后按照船舶的类型、船舶长度、船速进行分类,对同一类型的单船船位分布图进行叠加得到特定类型的船位分布图,将船位分布图划分为若干个区域,求取每个区域的船舶点数,采用文献[11]“将某一比率船舶距离排除在外”的方法来确定船舶领域边界,从而建立不同类型的船舶领域边界。
受限水域中的船舶领域由处于该水域中的众多船舶之间的相对位置决定。该相对位置由目标船与本船的距离和相对方位组成,可以利用AIS数据计算船舶间的相对位置,并将不同空间、不同时间的相对位置信息进行叠加计算,将目标船的船位表示在本船周围,以此反映船舶之间的安全领域范围。由于单一时刻目标船的位置分布包含的数据量有限,这就需要将本船不同时刻的目标船的位置分布信息进行叠加。此外,考虑到一艘船舶出现在该水域内的时间有限,其目标船的分布情况不完整,不能真实反映目标船与本船的位置分布规律,因此需要将同一类型的船舶位置分布数据进行叠加,通过对本船和目标船设置不同的条件,进而得到不同类型的船舶领域模型。本文使用的术语如下:
AIS 数据:接受船舶自动识别系统,包含连续时间内船舶的位置,航行状态和船舶尺寸等信息。
本船:以所选船舶为中心,在研究区域航行超过一段时间的船舶,即所要研究船舶领域的船舶。
目标船:以本船为中心,半径3 n mile以内的圆形区域航行超过一段时间的船舶,需要分析其与本船相对位置分布关系的船舶。
单船叠加图:随着船舶航行时间的变化,将获得大量单一时刻本船周围目标船的位置分布数据,将其位置分布数据进行叠加可得到单船叠加图。
多船叠加图:多条单船叠加图叠加。
特定类型船位分布图:对选取的本船和目标船按照某种标准进行分类(本文按照船舶的船舶类型、船舶尺度、船舶船速进行分类),将同一类型的本船周围符合要求的所有目标船的位置分布情况进行叠加,从而获得特定类型的船位分布图。
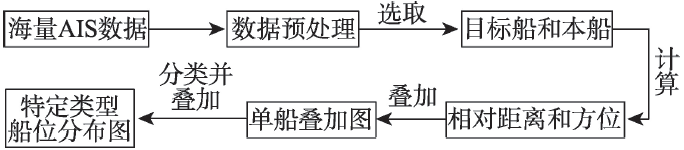
算法原理:对AIS数据信息进行预处理(删除MMSI为零的记录、删除船长、船宽明显不符合要求的船舶等)。选取本船时刻,计算与本船同时刻的目标船相对于本船的距离和相对方位,获取单一时刻目标船位置分布图。随着时间的变化,将获得大量单一时刻目标船位置分布图,将这些位置分布数据进行叠加,获得单船叠加图。制定本船和目标船的分类标准,对同一类型的单船叠加图进行叠加,从而获得特定类型船位分布图。具体算法流程如图1所示。
船舶相对位置由船舶之间的距离和相对方位组成,其距离为目标船到本船的距离,其相对方位为目标船相对本船的方位,即以本船的船首向为基准,顺时针旋转到目标船与本船的连线的夹角。
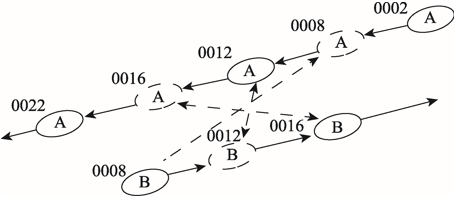
在求取本船与目标船之间的相对位置时,由于AIS数据包含的船舶动态信息在时间上是离散的,每艘船舶播发的AIS数据时间可能不一致,为了减少时间间隔引起的船位误差,因此在计算船间运动关系时需要将目标船时刻的位置换算到与本船同一时刻的位置。设船A和船B在研究区域内航行,其AIS数据如图2所示,在时刻0002、0012、0022 接收到船A动态信息,在时刻0008、0016接收到船B动态信息。根据船A和船B的动态信息可以解算2个船在时刻0008、0012、0016的运动关系。解算原理如下:
图2 基于AIS数据的船间运动关系
Fig. 2 The dynamic relationship between ships based on AIS data
设t1=0002、t2=0008、t3=0012、t4=0016。t2时刻船B的动态信息是确定的:坐标B2(xB2, yB2)、船速VB2、航向DB2。船A在t2时刻前后最近的2个时刻为t1和t3。t1时刻船A动态信息为:坐标A1(xA1, yA1)、船速VA1、航向CA1,t3时刻船A动态信息为:坐标A3(xA3, yA3),船速VA3、航向CA3。设船A在t2时刻动态信息为:坐标A2(xA2, yA2)、船速VA2、航向CA2。其中,坐标A(x, y)代表船A的经度和纬度,坐标B(x, y)代表船B的经度和纬度。
船舶动态信息2个时刻之间发生的改变量主要有经纬度、船速、航向。由于在航船舶发射信息频率较高,短时间内船舶的转向幅度和船舶速度的变化较小,因此船舶航向可以用最近2个时刻的船位点连线方向近似代替,船速变化可以近似为线性变化,船位变化也可以近似为与船速有关的线性变化。
在t2时刻船A的经纬度坐标以及船速可以根据式(1)和(2)求解。
于是,可以得到船A和船B在时刻0008的经纬度、航向、船速。同理,船A和船B在时刻0012和时刻0016的动态信息通过同样的方法可以确定,运用同样的方法就能将不同时刻的船舶动态信息换算到同一时刻的船舶动态信息。
设点A(ϕ1,λ1)为目标船船位,B点(ϕ2,λ2)为本船船位,λ1,ϕ1分别为目标船的经度和纬度,λ2,ϕ2为本船的经度和纬度,HDG为本船的船首向。
A、B点的距离r可按球面三角公式计算。
式中:S为目标船到本船的距离/ n mile;r为船舶A,B两点的距离/ n mile;Dλ为A、B两点的经度差。
目标船相对本船的方位θ可根据式(5)-(7)求出。
式中:TB为目标船的真方位,也就是式(5)求取的C(换算为圆周法之后的值);TC为本船的真航向,采用AIS数据库当中的船首向(HDG)代替。Q取正值则表明目标船在本船的右舷,Q取负值则表明目标船在本船的左舷;θ表示目标船与本船的相对方位(换算为圆周法之后的值)。
舟山港南部海域的螺头水道是舟山南部水域船舶航道的重要组成部分,航道宽1.2 n mile,航道全长8 n mile[12],本文选取舟山螺头水道作为研究区域,其螺头水道区域为图3中标识的黑色多边形区域。考虑到AIS信息发送间隔问题,为尽量不遗漏船舶AIS信息且保证AIS数据量足够多,选取的研究区域范围为:29°55′ ~29°57′ N,121°59′ ~122°7′ E,选取的数据时间段为该海区范围2016年1月、3月、5月、7月、9月、11月,共6个月的AIS数据。
经过筛选、剔除AIS数据中的不完整信息和错误信息数据之后,建立成螺头水域SQL数据库,对AIS信息进行统计分析,可得到螺头水域的船舶类型、船舶长度以及船舶船速分布情况。
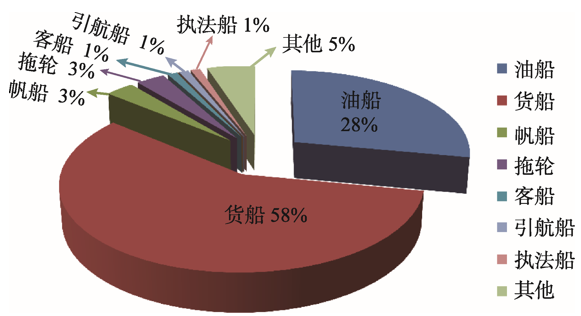
(1)船舶类型分布
图4是研究区域的船舶类型分布图,由图中统计结果可知:其中货船的比例最高为58%,其次为油船占比28%,客船、高速船等其它类型的船舶数量较少。由于船舶类型的不同其设计结构会有所不同,不同类型的船舶操纵性有很大差异,如油轮和集装箱船。由于AIS数据并没有对集装箱船进行单独标注,所以本文研究的货船包含集装箱船舶。客船、高速船等其他类型的船舶由于船舶数量太少,无法通过获取船舶位置分布情况得到船舶领域,因此本文只对货船和油船这2种船舶类型的船舶领域进行研究。
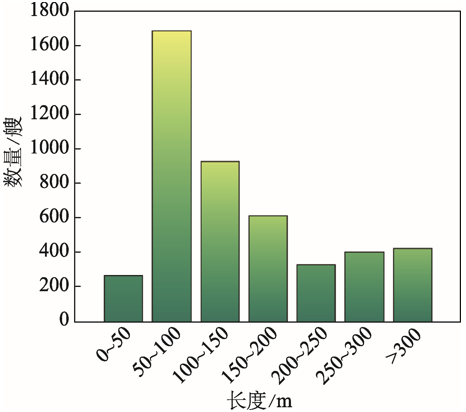
(2)船舶长度分布
图5表示螺头水域的船长分布,船舶长度在一定程度上直接反映了船舶吨位的大小,而海船的设备标准与船舶吨位的大小有关,一般来说大型船舶的配置设备更为齐全,相应船员素质要求也会更高。由图5可知,大部分船舶长度分布在50~200 m之间,50 m以下的小型船舶和200 m以上的大型船舶相对较少。在对船舶长度进行分类时,主要考虑到船舶操纵性和船舶的助航设备配置情况,因此本文将船舶长度划分为3个等级,分别为0~100 m、100~200 m和200 m以上的船舶。
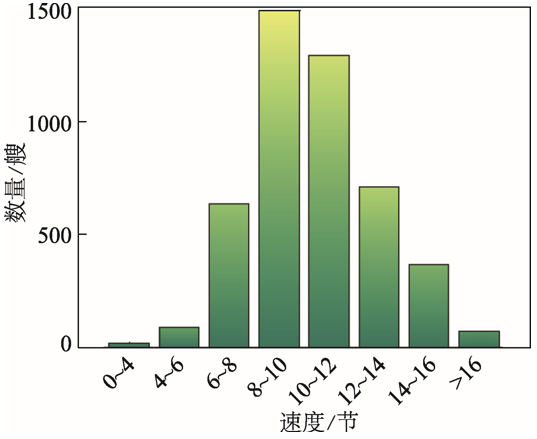
(3)船舶船速分布
图6是研究区域的船速分布图,由图可知船速大于16节和小于6节的船舶较少,大部分的船舶船速集中在6~16节之间。因此将船舶船速划分为6~8节、8~10节、10~12节、12~14节以及14~16节,本文只对这5种类型的船速进行研究,小于6节和大于16节的船舶船速由于船舶数量太少,无法通过获取船舶位置分布情况得到船舶领域模型,故本文不对其进行研究。
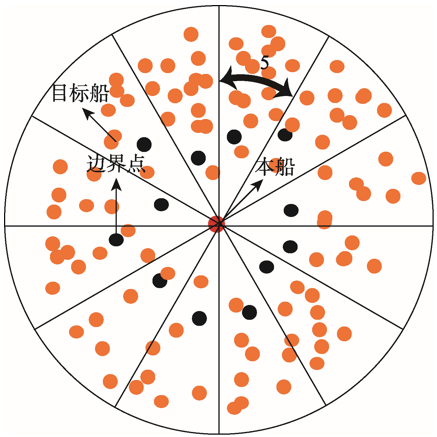
本研究采用Erwin等基于统计的思想,“将某一比率船舶距离排除在外”的方法确定船舶领域边界。具体步骤为:首先,以本船为中心获取3 n mile为半径圆形区域内目标船舶的分布情况,以5度为间隔将本船的坐标系均分为72个扇形;然后,对每个扇形区域的船舶点数按照距离本船的距离大小进行排序;接着,根据距离的大小,找出每个扇形区域的第5%的点作为临界点(如第1个扇区有200个船舶点数,对船舶点数按照离本船的距离大小进行排序,距离本船最近的那个点为第1个点,依次类推,则第10个点就是临界点,不足为整的取整(如有101个船舶点数,则选第5个点为临界点),其示意图为图7;最后,利用Matlab软件将这72个临界点采用最小二乘法拟合成椭圆,其拟合公式如式(8)所示[43]:
图7 船舶领域边界确定示意图
Fig. 7 Schematic diagram of boundary determination of ship domain
4.4.1 不同类型船舶间的船舶领域模型
将本船和目标船分别设置成货船、油船,根据船舶领域的算法,即可得到不同类型船舶间的船舶领域模型。
(1)货船对不同类型船舶的船舶领域模型结果统计分析
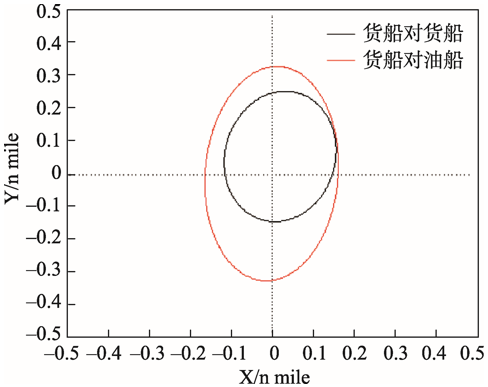
货船对货船、货船对油船的船舶领域长度数据统计成表1所示,货船对货船、货船对油船的船舶领域统计结果如图8所示。
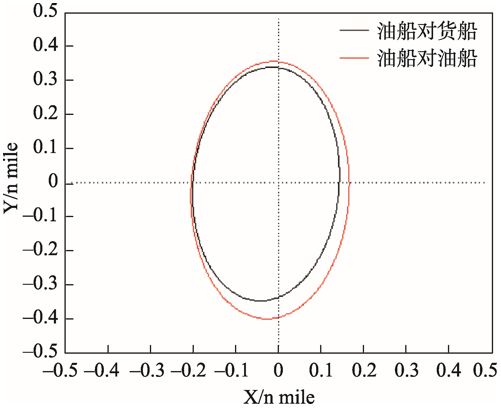
表2 油船对货船、油船对油船的船舶领域长度
Tab. 2 The length of ship domain between oil and cargo ships, and between oil ships
| 本船 | 目标船 | 长轴长/n mile | 短轴长/n mile | 长轴与L的比值 | 短轴与L的比值 |
|---|---|---|---|---|---|
| 油船 | 货船 | 0.6877 | 0.3410 | 7.2778 | 3.6088 |
| 油船 | 0.7564 | 0.3686 | 8.0049 | 3.9008 | |
| 差值 | 0.0687 | 0.0276 | 0.7271 | 0.2920 |
由表1和图8可知,当本船的船舶类型为货船时,其目标船的船舶种类对本船的船舶领域有影响,货船对油船的船舶领域要比货船对货船的船舶领域大,长轴大0.2557 n mile,短轴大0.0536 n mile。
图8 货船对货船、货船对油船的船舶领域
Fig. 8 The length of ship domain between cargo ships, and between cargo and oil ships
(2)油船对不同类型船舶的船舶领域模型结果统计分析
油船对货船、油船对油船的船舶领域长度数据统计成表2所示,油船对货船、油船对油船的船舶领域统计结果如图9所示。
表1 货船对货船、货船对油船的船舶领域长度
Tab. 1 The length of ship domain between cargo ships and between cargo and oil ships
| 本船 | 目标船 | 长轴长/n mile | 短轴长/n mile | 长轴与L的比值 | 短轴与L的比值 |
|---|---|---|---|---|---|
| 货船 | 货船 | 0.4004 | 0.2704 | 4.2374 | 2.8616 |
| 油船 | 0.6561 | 0.3240 | 6.9434 | 3.4288 | |
| 差值 | 0.2557 | 0.0536 | 2.7060 | 0.5672 |
由表2和图9可知,本船的船舶类型为油船时,其目标船的船舶种类对本船的船舶领域有影响,油船对油船的船舶领域要比油船对货船的船舶领域大,长轴大0.0687 n mile,短轴大0.0276 n mile。
图9 油船对货船、油船对油船的船舶领域
Fig. 9 The length of ship domain between oil and cargo ships, and between oil ships
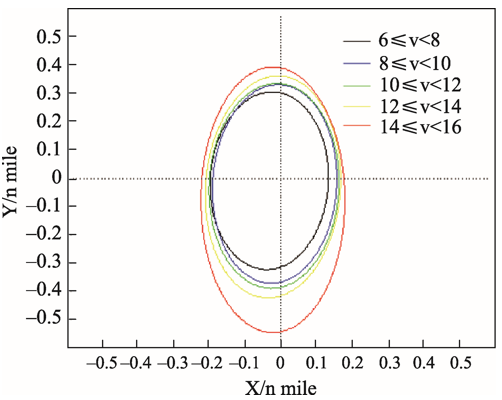
图10 不同船速船长L≥200 m的船舶领域
Fig. 10 The length of ship domain when ship's length is more than 200 meters
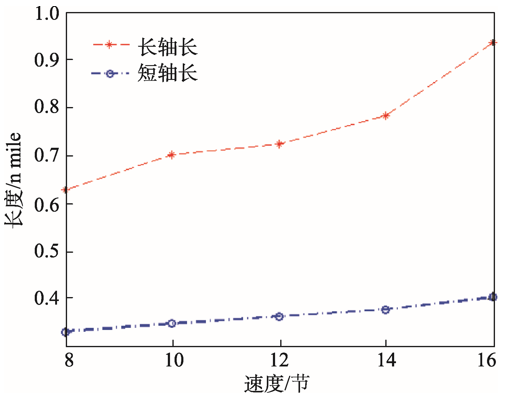
图11 不同船速船长L≥200 m的船舶领域长短轴数值变化
Fig. 11 The variation of domain in long and short axes at different speeds and ship length more than 200 meters
综上所述,船舶类型对船舶领域的大小有影响,货船对货船的船舶领域长度最小,油船对油船的船舶领域长度最大,货船对油船以及油船对货船的船舶领域长度相差不太。
4.4.2 不同船速不同尺度船舶的船舶领域模型
为了研究方便,本文选择船长L≥200 m,船速分别为6 kn≤V<8 kn、8 kn≤V<10 kn、10 kn≤V<12、12 kn≤V<14 kn、14 kn≤V<16 kn共5档作为案例进行分析,对于其他类型的船舶领域本文在此不再进行陈述。表3为不同船速的船舶领域长度,图10为不同船速的船舶领域边界,图11为不同船速的船舶领域长短轴数值变化。
表3 不同船速船长L≥200 的船舶领域长短轴数值(n mile)
Tab. 3 The length of long and short axes at different speeds for ships with length longer than 200 meters
| 船速范围 | [6, 8) | [8, 10) | [10, 12) | [12, 14) | [14,16) |
|---|---|---|---|---|---|
| 长轴长 | 0.6288 | 0.7023 | 0.7244 | 0.7850 | 0.9379 |
| 短轴长 | 0.3307 | 0.3471 | 0.3776 | 0.3776 | 0.4030 |
从表3、图10、图11可以得出:随着船速的增加,本船船舶领域长度也随之增加,船速每增加2 kn,船舶领域长轴长增大约0.0221~0.1529 n mile,短轴长增大约0.0143~0.0254 n mile,船舶领域在长轴方向随船速的增大幅度大于短轴的增大幅度。
藤井认为船舶领域的形状为椭圆,其长轴长为7 L(L代表船舶长度),追越时为8 L;Goodwin将船舶领域按船舶的号灯范围分成3个扇形区域,船舶左右弦部分的扇形区域半径分别为0.70 n mile、0.85 n mile,船尾部分的扇区半径为0.45 n mile;Hansen等[13]认为船舶领域的长度为8.3 L,船首方向为 4.68 L,船尾方向为3.62 L:陈厚忠等[14]在研究内河水域时将船舶种类分为进江船舶,顶推船队以及喷水推进高速双体船,其船舶领域的长轴长分别为3~4 L、2~3 L、1.5~2 L,短轴长分别为0.5~0.8 L、0.4 L、1 L。以上这些传统的计算方法得出的船舶领域长度与船舶长度的比值为一个定值,即船舶领域的长度可以表示成nL(n为定值)。
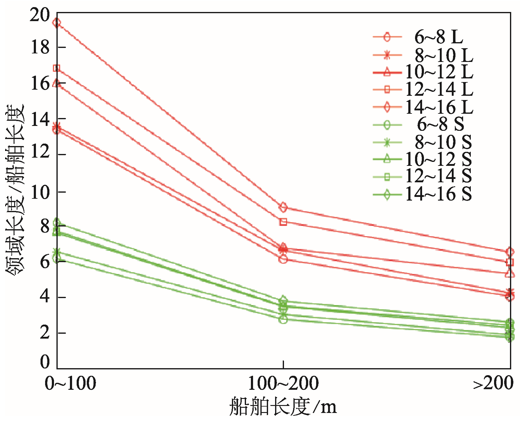
本文的船舶领域长度与船舶长度的比值如图12所示,图中的L、S分别代表椭圆的长轴长、短轴长。从图12可以看出,该比值并不是一个定值,而是随着船舶长度和船速的增加而递减,当船舶船速相等时,该比值随着船舶长度的增加而递减,且船速越大,递减的幅度也越大。这与传统的计算方法得出的船舶领域长度与船长之比的定值不相符,这是因为本文考虑到船舶长度和船速的影响。
图12 船舶领域长度与船舶长度比值的变化规律
Fig. 12 The variation of ratio of domain length to ship length
本文的船舶领域研究是建立在AIS数据基础上建立的,考虑到在受限水域内船舶类型、船舶长度以及速度对船舶领域的影响。以舟山港螺头水道为例,共挖掘出19种不同类型的船舶动态领域模型,结果表明:货船对货船的船舶领域长度最小,油船对油船的船舶领域最大,货船对油船和油船对货船的船舶领域长度相差不太;船舶领域的长度随着船长,船速的增加而增加,当船舶长度相等时,船舶速度越大,船舶领域增加的幅度越大;船舶领域长度与船舶长度的比值并非为定值,而是随着船长,船速的增加而递减,船速越大,递减的幅度越大。
本文仅讨论了船舶类型、船舶长度和速度对船舶领域的影响,船舶所处的航行环境以及人为因素的影响将是下一步要研究的方向。
The authors have declared that no competing interests exist.
| [1] |
Traffic capacity [J]. |
| [2] |
A statistical study of ship domains [J].https://doi.org/10.1017/S0373463300041230 URL [本文引用: 1] |
| [3] |
Ship's fuzzy domain: A criterion for navigational safety assessment in an open sea Area [J].https://doi.org/10.1017/S0373463308005018 URL [本文引用: 1] 摘要
One of the basic tasks in shipping is to ensure safe navigation of vessels. The concept of the ship domain is of major importance in the assessment of a navigational situation and the avoidance of ship collisions. It is difficult to determine a ship domain as its shape and size depend on a number of factors. One question to be answered before the determination of the ship domain is which method to use: statistical, analytic, or expert method using artificial intelligence tools; other questions are connected with domain interpretation. The authors have analyzed the ship domain as a criterion for the assessment of ship navigational safety in an encounter situation in the open sea. The research results are used to answer some of the questions.Part 2 includes definitions of the ship domain and ship fuzzy domain. Part 3, in turn, presents methods of their determination as well as relevant questions. The results of the authors' research, described in Part 4, make up a basis for the determination of the domain and ship fuzzy domain. These have been determined with the so-called dynamic domains as a point of departure. The criteria of ship domain and closest point of approach are compared and discussed. Encounters of various size ships are considered in Part 5. The research and its results are described. Both ship domains and ship fuzzy domains of encountering ships are analyzed. Then, conclusions have been formulated in relation to the effect of the sizes of encountering ships on the shapes and sizes of their domains. Final conclusions are given in Part 6.
|
| [4] |
基于AIS数据的船舶领域研究 [D].Research on the ship domain based on AIS data[D] . |
| [5] |
基于AIS数据的开阔水域船舶领域分析研究 [D].Research on the ship domain in open water areas based on AIS data[D] . |
| [6] |
基于AIS数据的受限水域船舶领域计算方法 [J].
为获取受限水域船舶领域,提出一种利用海量AIS数据建立模型的方法。选取目标船舶的AIS数据,将其附近水域网格化,考虑了船舶尺寸,计算了他船船体出现在每一个网格中的频数,提取单船网格频数图,将同一类型的目标船舶网格频数图叠加,形成了特定类型船舶的网格频数图。将网格频数图按频数填充颜色,可清晰地显示船舶领域的形状,利用断面分析测量船舶领域长度。选用上海港南槽水域的AIS数据对方法进行验证,统计了60~79、80~99、100~119、120~139、140~159m共5类不同长度船舶的船舶领域。分析结果表明:由于考虑了船舶尺寸,5类船舶的领域在长轴方向较船首向存在向左舷偏转的夹角,角度分别为3.37°、9.46°、17.53°、10.78°、8.13°;船舶领域长度与船舶长度的比值依次递减,比值分别为6.00、5.80、5.67、5.43、5.13。可见受限水域内船舶领域形状为不规则椭圆,且船舶领域长度与船舶长度的比值并非为定值。
A method of ship domain calculation in restricted water areas based on AIS data [J].
为获取受限水域船舶领域,提出一种利用海量AIS数据建立模型的方法。选取目标船舶的AIS数据,将其附近水域网格化,考虑了船舶尺寸,计算了他船船体出现在每一个网格中的频数,提取单船网格频数图,将同一类型的目标船舶网格频数图叠加,形成了特定类型船舶的网格频数图。将网格频数图按频数填充颜色,可清晰地显示船舶领域的形状,利用断面分析测量船舶领域长度。选用上海港南槽水域的AIS数据对方法进行验证,统计了60~79、80~99、100~119、120~139、140~159m共5类不同长度船舶的船舶领域。分析结果表明:由于考虑了船舶尺寸,5类船舶的领域在长轴方向较船首向存在向左舷偏转的夹角,角度分别为3.37°、9.46°、17.53°、10.78°、8.13°;船舶领域长度与船舶长度的比值依次递减,比值分别为6.00、5.80、5.67、5.43、5.13。可见受限水域内船舶领域形状为不规则椭圆,且船舶领域长度与船舶长度的比值并非为定值。
|
| [7] |
能见度不良情况下受限水域船舶的领域 [J].https://doi.org/10.13340/j.jsmu.2016.03.004 URL [本文引用: 1] 摘要
为研究在能见度不良情况下受限水域内的常见船型的船舶领域,对船舶自动识别系统(Automatic Identification System,AIS)数据进行分析建立船舶领域.该方法借助可视化技术和网格技术,结合研究水域能见度信息,分析南槽水道内符合要求的2 000万个左右AIS数据,还原航迹分布图约50 000张,获得在受限水域内能见度不良情况下船长80~100 m的船舶领域模型.客观精确的船舶领域模型能够提升能见度不良天气下交通流的预测精确度,同时丰富基于智能技术研究的船舶领域模型库.
Ship domain in restricted waters under restricted visibility [J].https://doi.org/10.13340/j.jsmu.2016.03.004 URL [本文引用: 1] 摘要
为研究在能见度不良情况下受限水域内的常见船型的船舶领域,对船舶自动识别系统(Automatic Identification System,AIS)数据进行分析建立船舶领域.该方法借助可视化技术和网格技术,结合研究水域能见度信息,分析南槽水道内符合要求的2 000万个左右AIS数据,还原航迹分布图约50 000张,获得在受限水域内能见度不良情况下船长80~100 m的船舶领域模型.客观精确的船舶领域模型能够提升能见度不良天气下交通流的预测精确度,同时丰富基于智能技术研究的船舶领域模型库.
|
| [8] |
拥挤水域内船舶领域的探讨 [J].Discussion on the ship domain in crowded waters [J]. |
| [9] |
Marine traffic behaviour in restricted waters [J].https://doi.org/10.1017/S0373463300039783 URL [本文引用: 1] 摘要
This paper, which was presented at an Ordinary Meeting of the Institute held in London on 26 January 1983, outlines the development and analysis of the ship domain in restricted waters and illustrates some of its uses in a buoyed channel. The analysis of marine casualties raises the question of how casualties occur, and may indicate the circumstances most likely to lead to a casualty. In addition, information may be gained as a basis for estimating the risk of a casualty and for assessing the effectiveness of proposals for improving the safety and efficiency of navigation in the area. The use of casualty statistics as a measure of marine risk has distinct limitations. In most areas a casualty is a reasonably rare occurrence, so that any systematic analysis of casualties will normally have to take place over a period of a few years; and, if improvements are made, a further period of time is necessary to measure their effectiveness.
|
| [10] |
An empirically-calibrated ship domain as a safety criterion for navigation in confined waters [J].https://doi.org/10.1017/S0373463315000533 URL [本文引用: 1] 摘要
There are limited studies on the use of ship domain as the safety criterion for ship navigation within confined waters. In this paper, a free-form ship domain has been developed empirically for navigation in confined waters. Two individual domains of an asymmetrical polygonal shape have been assumed around the own ship and target ship, and the size of the ship domains is assumed to be dynamically enlarged with increased ship speeds. The required safe distance modelled using the proposed ship domain takes into account dynamic changes in relative bearing and heading. The model is calibrated using the data of vessel movements in Singapore Strait and Singapore Port. An innovative process has been adopted that iteratively adjusts the parameters in the basic ship domain of a stationary ship; a speed function as well as a weight function to maximise the usage of the dataset. The resulting ship domain model compares well with existing ship domains for typical encounters, such as those of Fujii and Coldwell but represents non-typical encounters more effectively than existing models.
|
| [11] |
Detection of Hazardous Encounters at the North Sea from AIS Data [C]// |
| [12] |
舟山港域通航安全风险评价研究 [D].Study on risk assessment of navigation safety in Zhoushan Port[D] . |
| [13] |
Empirical ship domain based on AIS data [J].https://doi.org/10.1017/S0373463313000489 URL [本文引用: 1] 摘要
In this paper the minimum ship domain in which a navigator feels comfortable is estimated. That is, we estimate the free space surrounding a ship into which no other ship or object should enter. This is very useful when estimating the maximum flow through a channel or a bridge span. The paper benefits from the introduction of Automatic Identification System (AIS) data as it is now much easier to conduct studies involving a large number of observations. Our observations are based on ships sailing in southern Danish waters during a four year period, and from the observations we estimate how closely ships pass each other and fixed objects in open sea navigation. The main result is the establishment of an empirical minimum ship domain related to a comfortable navigational distance.
|
| [14] |
内河并列桥梁桥区水域船舶领域模型与通过能力研究 [J].https://doi.org/10.3963/j.issn.1671-7953.2008.05.032 URL [本文引用: 1] 摘要
在现有船舶领域模型的基础上,根据内河并列跨河桥梁通航孔布置的特点,提出了适用于该桥区水域的船舶领域模型.利用该船舶领域模型,可计算得到代表船型船舶的通过能力,从而为桥梁建设、通航安全管理及海事纠纷处理提供依据.
Study on ship domain model and passing capacity in parallel bridge area of inland river [J].https://doi.org/10.3963/j.issn.1671-7953.2008.05.032 URL [本文引用: 1] 摘要
在现有船舶领域模型的基础上,根据内河并列跨河桥梁通航孔布置的特点,提出了适用于该桥区水域的船舶领域模型.利用该船舶领域模型,可计算得到代表船型船舶的通过能力,从而为桥梁建设、通航安全管理及海事纠纷处理提供依据.
|

/
| 〈 |
|
〉 |
