苏亚丽 , 郭旭东, 雷莉萍
SU Yali, GUO Xudong, LEI Liping
通讯作者:
收稿日期: 2018-01-22
修回日期: 2018-03-23
网络出版日期: 2018-07-20
版权声明: 2018 《地球信息科学学报》编辑部 《地球信息科学学报》编辑部 所有
基金资助:
作者简介:
作者简介:苏亚丽(1994-),女,硕士生,研究方向耕地暴雨洪水灾害多源卫星遥感监测方法研究。E-mail:syl1501235615@163.com
展开
摘要
强暴雨淹没耕地形成灾害的同时,对耕地作物的生长也产生着极大的影响,而暴雨灾害对耕地作物生长的影响是一个渐变过程,需要由时空动态的观测进行监测。多源卫星遥感观测技术具有捕捉地面瞬间状态和刻画过程的优势。论文利用Terra/MODIS、Landsat和Sentinel卫星观测数据,挖掘多源卫星遥感观测数据,提出了一种利用NDVI变化的特征值进行灾情动态信息提取方法;并以2016年发生暴雨灾害的巢湖地区为实验区进行了方法的应用和讨论。结果表明,基于MODIS多时相NDVI变化结果提取的信息能够获得受灾害影响开始时期和持续时长等丰富的时空动态信息,根据这些信息可以统计得出大范围区域中受灾害影响的面积。另外,结合利用30 m和10 m的Landsat和Sentinel观测数据提取的水淹区,可为在暴雨致灾范围方面提供准确的参考信息。多源遥感作为评估灾情信息的依据之一,其获取的灾情动态信息能够为灾后耕地的恢复情况以及国家灾后损失评估和救助决策提供科学的数据依据。
关键词:
Abstract
The heavy rain may induce flood disaster inundating crop lands while the long period of the continues heavy rainfall may strongly affect the growth of crops even not evolving into a flood disaster. The impact of heavy rainfall on the growth of crops is a gradual process due to the long period of time needed for soil to become saturated. Multi-satellites remote sensing observations can capture and characterize the ground conditions over large area in multiply time. To develop the potential applications of the multi-satellites remote sensing observations, this paper proposes a method of extracting dynamic information of heavy rain disaster and its impacts on the growth of crops using multi-satellites data including Terra/MODIS, Landsat and Sentinel. We implemented the application of the proposed method in the studying area around Chaohu lake, where the heavy rainfall started from the end of June and continued to August in 2016, and a heavier rain in July brought about the flood in large crop areas. The beginning period and the duration of the heavy rainfall, leading to the impacts on the growth of crops, were identified using a dynamic threshold method of multi-temporal NDVI derived from MODIS. Based on this information, the area with crop fields impacted by heavy rainfall and flooded were obtained. On the other hand, the dynamic information of flooded lands was extracted by using Landsat observing data in July and Sentinel observation data in August, respectively. These results provide more accurate area of flooded crop fields, and can be used to modify the area derived from MODIS although they have only few temporal data available. In conclusion, multi-satellites remote sensing, as one of the tools for monitoring and assessing the influences of heavy rainfall, can obtain the dynamic information of the heavy rainfall impacts on the growth of crops in addition to flooded land area and the recovery of the farmland, which provide the supporting scientific data for the assessment of the loss caused by the disaster and making the disaster relief policy.
Keywords:
自然灾害的发生、发展乃至演变成灾难,一直在不同程度地损害人类的生产和生活。从科学的意义上认识这些灾害的发生、发展以及尽可能减小它们所造成的危害,已是社会的一个共同主题。能够客观准确地获取地面真实状况的卫星遥感观测技术已经是自然灾害监测的重要手段之一,它可以为我们获取自然灾害具有的广泛性、区域性、时间动态性以及严重性等特点的灾情信息。特别是多源卫星遥感观测的协同应用已经成为灾害监测技术发展的重要趋势[1]。在多种灾害种类中,本研究拟以强暴雨的气象灾害为对象,研究多源卫星遥感观测在暴雨天气灾害的发生、发展以及严重性的应用。
每年全球各地均会频繁地发生持续暴雨、洪水等气象灾害。一方面,由于连续的强降水或短时的强暴雨在地势低洼和地形闭塞地区雨水不能迅速宣泄而造成土壤水分过度饱和地面积水,长期土壤水分的饱和也必然影响农作物的生长;另一方面,强暴雨导致河流湖泊水位漫堤泛滥成洪水淹没农田和人类居住地,造成人类正常生产和财产经济的损失。在进行此类灾害损失评估和灾害救助时,不但需要获取区域受害范围、程度及灾后农作物恢复情况等空间上的信息,而且也需要这些灾情随时间变化的动态信息。
受卫星重返周期长加之天气条件的影响,仅应用单颗卫星遥感获取灾情信息受到了极大的限制[2,3],很难满足灾害时空信息获取的需求[4,5]。随着在轨观测卫星的增加,通过多颗卫星观测各自拥有的空间和时间优势的互补,提取地表过程信息。通过对这些地表过程信息的分析和处理,可以获取更为准确的暴雨洪水引起的灾害范围、程度、退水恢复以及随时间变化的灾情动态信息。在多源卫星数据的应用上,更多的研究主要集中于灾害空间信息的获取如受淹区域的提取等[6,7,8,9],缺乏灾害发展过程的信息提取。在不同卫星的优势应用上,许多研究更多地利用了空间分辨率的互补,提高洪涝受灾区域的空间信息及地面类型信息的提取精度和效率[10,11,12];一些研究利用MODIS多时相的优势评估了洪水灾害对作物产量的影响[13,14]。在融合应用多源卫星数据的处理中,主要是将Landsat与多时相MODIS数据通过如STARFM等方法进行融合处理后得到有30 m的多时相数据[15,16]。但该方法有两点很大的局限性,① 需要有一定时相数且均匀分布于各季节的Landsat卫星数据才能保证数据的有效性和可靠性[17];②该方法仅适用于那些常规地面未发生异常变化的年份,不能有效地应用于获取到如暴雨洪水淹没等灾害发生导致的异常变化数据。
针对灾害发生后数据的特殊性和融合处理的问题,本论文采取对各个卫星处理首先面向需求进行信息提取处理,然后由各卫星结果信息的综合分析和统计,从空间上和时间上获取准确的灾情动态信息。利用已经在轨运行多年的Landsat 8和Terra/MODIS(moderate-resolution imaging spectroradiometer)以及最新发射的Sentinel卫星遥感提供的多期观测数据,针对暴雨灾害所导致的灾情动态信息如灾害范围、受灾程度及其发展、以及灾后恢复状况等,以MODIS时序变化特征为基础,建立一种多源遥感的灾害动态信息提取方法。该方法利用Landsat和Sentinel的空间分辨率优势辅助于MODIS多时相优势,一方面提取受灾区域范围、类型以及恢复的灾情空间信息,另一方面提取灾情恢复随时间变化的动态特征信息,为作物灾后损失评估和灾害救助决策提供有效准确的基础信息。
本文以2016年夏季持续强降水导致暴雨灾害的长江中下游流域安徽省巢湖地区为研究区。研究区在2016年6月底开始降雨,在7月1日发生了超出100 mm的强暴雨,大范围区域被淹,对后期农作物的生长和种植产生很大影响。本文收集了巢湖地区受灾年2016年陆地卫星8号(Landsat-8) OLI(Operational Land Imager),Sentinel(Sentinel-2A)多光谱仪和Terra/MODIS的观测数据;同时,为获取研究区灾前背景信息,收集了未受灾年(2015年)观测数据,分别为Landsat-8 OLI观测的3个时相、Sentinel-2A光学观测数据2个时相。为了获取耕地农作物的多时相连续变化特征,研究利用了MODIS观测的2015年和2016年45个时相数据,各数据获取时间及其特征见表1。
表1 多颗卫星遥感观测数据产品信息
Tab. 1 Specification of Multi-satellites remote sensing observation data product
| 卫星/传感器 | 时间(覆盖景数) | 产品级别 | 数据源 |
|---|---|---|---|
| Landsat-8/OLI | 2015-10-11(2景) 2016-01-15(2景) 2016-07-25(2景) | L1T | http://glovis.usgs.gov/ |
| Sentinel-2A/MSI | 2016-08-15(6景) | Level-1C | https://scihub.copernicus.eu/ |
| Terra/MODIS | 2015年1-12月45个时相(1景) 2016年1-12月45个时相(1景) | MOD13Q1 | http://ladsweb.nascom.nasa.gov/ |
Landsat-8 OLI数据来自于美国地质勘查局 (U.S. Geological Survey-USGS)网站发布的经辐射校正和地形几何校正处理后的L1T数据产品;其多光谱空间分辨率为30 m,全色波段空间分辨率为15 m。
Sentinel-2A是2015年发射的一颗新型高分辨率多光谱成像卫星,在可见光和近红外(VNIR)和短波红外(SWIR)光谱波段上设置有13个光谱波段(4个10 m波段,6个20 m波段,3个60 m波段),主要用于陆地植被、土壤及水资源等在内的全球陆地观测[18]。Sentinel-2A多光谱数据产品来自于欧空局发布的Level-1C级产品;数据为经辐射校正和正射校正处理后具有亚像元精度的100 km2×100 km2正射影像[18]。
Terra/MODIS数据来源于美国NASA的EOS系列卫星Terra观测获取的植被指数产品MODIS/Terra Vegetation Indices 16-Day L3 Global 250 m SIN Grid (MOD13Q1)[19]。该数据为16 d合成的NDVI植被指数数据产品,数据的空间分辨率为250 m,时间分辨率为16 d,1年共有23幅时相数据。16 d合成的NDVI数据是由最佳像元合成算法处理得到的数据产品。该算法以16 d为单位,在一定传感器观测角范围内选出具有最大NDVI值的像元作为最佳像元选出,通过逐像元16 d的最佳像元选择处理,合成得到一幅无云或受云影响最小、星下点最近的NDVI数据[20]。在研究区收集了2015年23个时相和2016年22个时相(年末最后一个时相缺失)NDVI数据。
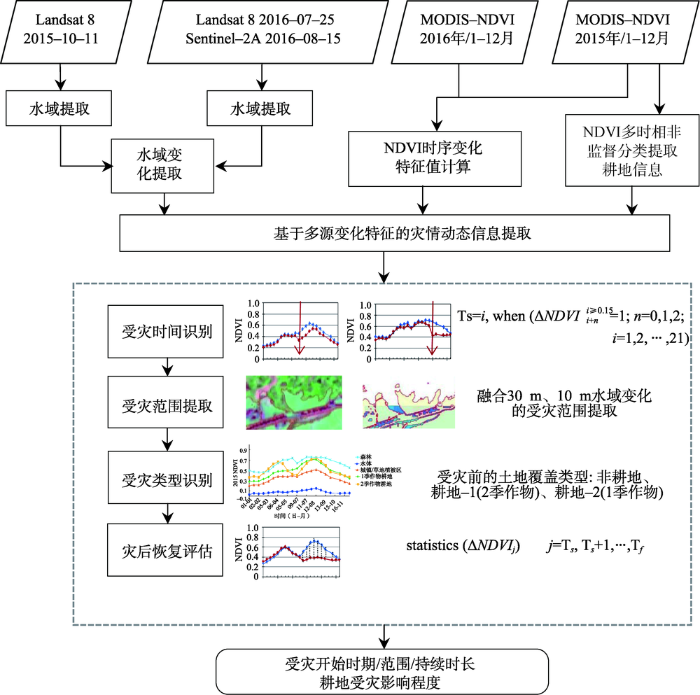
利用250 m多时相MODIS数据提取暴雨导致作物受灾开始的时间、范围及其发展的变化。另一方面,利用30 m的Landsat和10 m的Sentinel观测数据,提取受暴雨灾害淹没的准确区域,修正空间分辨率较低的MODIS提取结果。最终通过多源卫星遥感观测数据的应用处理,提取受灾区域的受灾时间和程度、土地覆盖类型、以及灾后恢复情况信息,具体的技术方法流程如图1所示。
图1 基于多源卫星遥感的暴雨灾情动态信息提取方法流程
Fig. 1 Method of extracting dynamic information about rainstorm disaster based on Multi -Satellites Remote Sensing
2.2.1 基于MODIS-NDVI时序变化的灾害特征值提取
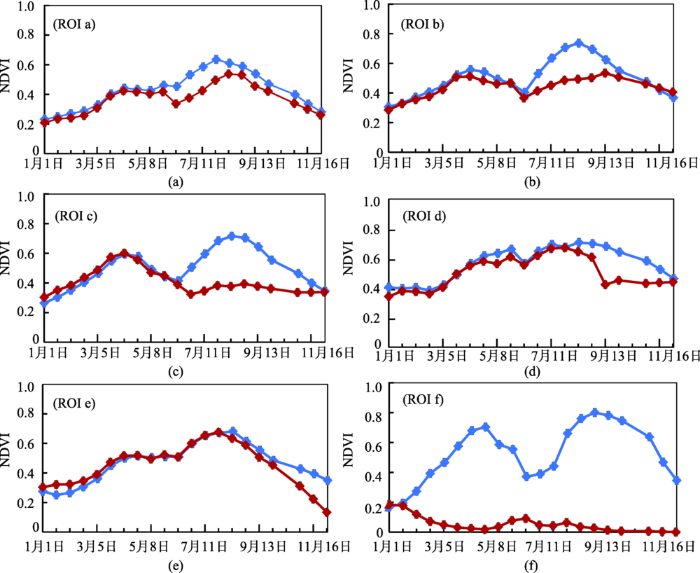
耕地作物在受到连续暴雨降水导致的土壤水分饱和或强暴雨淹没后的影响,作物的生长和长势必然受到影响,其NDVI值必然比正常年份减小,如果作物的生长持续受到了影响,时间上的NDVI将会持续保持低值,因此利用NDVI多时相的变化特征(图2)可以进行暴雨对耕地作物影响程度的识别。
图2 受灾年(红色)和未受灾年(蓝色)的NDVI多时相变化特征
注:红色表示受灾年2016年;蓝色代表未受灾年2015年
Fig. 2 Characteristics of NDVI multi-temporal changes in affected years (red) contrast with unaffected years (blue)
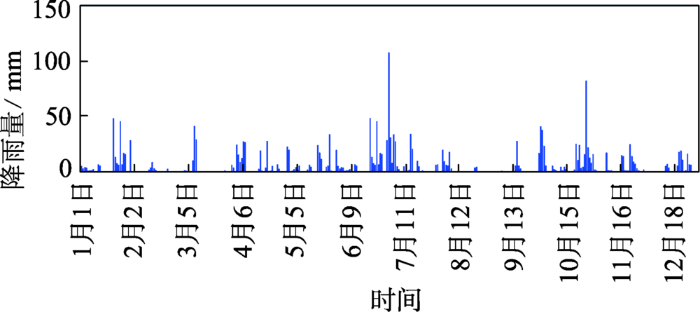
图2给出了受淹区域受灾年2016年和未受灾年2015年NDVI多时相变化特征;为分析NDVI季节变化受强降水的影响,图3给出了研究区合肥市气象观测站2016年降水量的日变化。其中,图2(a)-(f)表示均一耕地类型不同ROI样本区2015年与2016年的NDVI均值时间序列曲线变化特征。对比分析图2和图3可发现,图2(a)-(c)显示了2016年6月的NDVI值(红色)比2015年6月明显下降的特征,对应了图3中6月的连续强降雨和7月初的强暴雨,表明在7月强暴雨之前的连续降水已经导致土壤水分饱和而影响了农作物的生长。同时,图2(a)-(b)显示了2016年NDVI在不同时相开始降低并持续一段时间后重新达到未受灾年2015年的NDVI水平。图2(f)显示2016年从年初开始减小,一直明显低于2015年各时相的NDVI值,经地面调查核实该区域的土地利用由2015年的耕地在2016年更改为养殖田。
图3 研究区合肥市气象站2016年的降水量
Fig. 3 Precipitation in 2016 measured in Hefei meteorological station in the study area
上述2年NDVI同时相的变化差值结果的分析表明,2016年受灾后的NDVI值比2015年同时相基本小于0.15。以此0.15为阈值,进行NDVI开始减小的时相识别,并累计差值连续低于0.15值的时相数即持续时长,根据这些特征可以评估作物受暴雨降水灾害的影响程度以及受灾后作物恢复情况。在提取这些特征值之前,首先对MODIS-NDVI数据存在的部分异常进行剔除和插补。
MODIS-16天NDVI产品数据虽然由最佳像元合成方法很大程度上减小了云的影响,由于中国南方地区天气多云,研究区域NDVI数据里还会有一些受到云影响的数据。根据NDVI值的正常多时相变化特征,当像元NDVI值与前后两个时相的绝对差值均大于0.15时判断为异常值,并利用前后时相NDVI值进行线性插值替代,由此减小异常值对多时相变化特征分析的影响。2016年第19个时相的NDVI数据由于大范围的云影响未实施处理,最终经异常剔除和插补处理后得到2015年和2016年分别21个时相的NDVI数据集。
考虑耕地作物NDVI随时间变化的特性,以连续有3个时相的受灾年NDVI小于同期未受灾年为判断作物生长受到灾害影响的依据;利用3个连续时相可以避免仅用单个时相判断时由于数据噪音或异常产生的误判。首先,由式(1)逐像元统计计算每个时相未受灾年2015年的NDVI值(
为检测2016年NDVI值比2015年减小的幅度,进一步计算从Ts开始到(Ts+Tf)时期内∆NDVI均值和标准偏差,由NDVI降低大小评估受灾害影响的程度。
2.2.2 各个时期受暴雨影响的范围
根据暴雨洪水灾害的特点,由以下方法获取由于不同时期的强降水对农作物生长影响的范围及其发展变化等信息。
连续强降水造成土壤水分过度饱和地面积水逐渐影响农作物生长的过程,是一个渐变的过程,利用MODIS多时相数据由式(1)-(3)求算的Ts,表征了强降水和暴雨对农作物生长产生影响的开始时间,根据Ts可以获取各个时期受到暴雨影响的空间范围。进一步利用受灾期间Landsat和Sentinel观测时期获取的受灾范围,对MODIS相近时期的结果进行比较核对,通过多种数据源获取受灾范围,为区域灾情分析提供参考。
在卫星观测获取地物反射特征中,水体具有很强的光谱吸收特征,特别在近红外光谱,使其反射率明显低于其他地物的反射率[21]。因此在卫星遥感数据中水体是最为容易提取的地物信息。这其中虽然受云、地形、建筑物等造成的阴影等低反射率的影响,但充分利用地物光谱反射和指数特征,可以比较准确地提取水体信息。本文利用水体在绿波段、红波段、近红外波段、归一化差异水体指数NDWI和改进型水体指数MNDWI的特征值,针对不同时期的卫星数据选择不同的阈值,利用阈值决策树方法分别进行了2015年10月11日(Landsat-8)和2016年7月25日(Landsat-8)和8月15日(Sentinel-2A)影像的水域提取。
利用各卫星观测时期的水域提取结果,以未受灾年2015年10月11日(Landsat-8)为对比数据,分别进行水域变化提取,识别2016年7月25日(Landsat-8)和8月15日(Sentinel-2A)时期水域增加信息,获取2016年受强暴雨影响导致的水淹区域。
在利用受灾年和未受灾年2期卫星观测数据进行水域变化提取时,地表覆盖的其他变化如受灾年土地利用转变为养殖田或水田等,使得水体变化信息提取结果里包含一些伪变化信息。对于这些伪变化,可以利用MODIS-NDVI的时序变化特征如图2(f)所示,以变化区域为对象,根据上述Ts和Tf的特征值即Ts开始于3月之前且时相数Tf大于15时表明,该区域2016年全年基本为水覆盖,剔除由上述土地利用变化产生的非受灾像元。
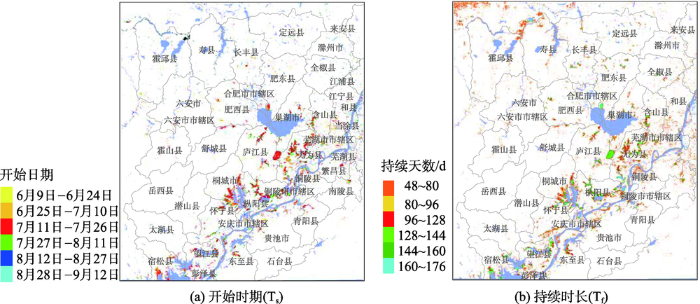
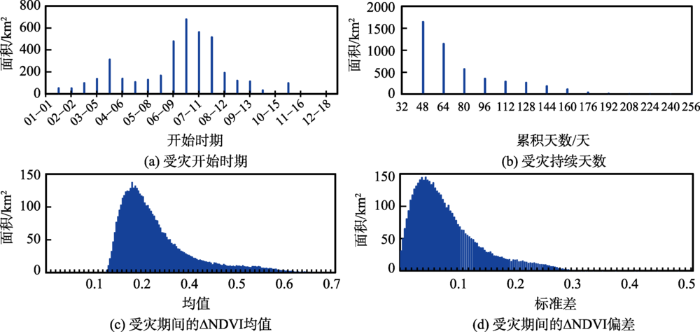
图4为按照上述图1的方法流程得到的2016年耕地区域受暴雨灾害影响的开始时期和持续时长的结果。图中的耕地区域由2015年多时相NDVI数据的非监督分类获取。图中的日期是根据NDVI数据的每个时相间隔16 d,由开始时相Ts换算的日期和天数。图5为对应耕地区域的Ts、Tf以及从Ts到(Ts+Tf)时期内∆NDVI均值和标准偏差统计的直方图。
图4 2016年受暴雨灾害影响的开始时期和持续天数
Fig. 4 The beginning period and the duration in the year of 2016 affected by heavy rainfall
图5 研究区受暴雨灾害影响的直方图
Fig. 5 Histograms of △NDVI affected by heavy rainfell in study areas
图4结果表明受暴雨灾害影响区域主要分布在巢湖东南部与长江之间;受灾害影响的时期基本开始在7月初时相。由图5(a)可发现,开始受到灾害影响的各个Ts的范围大小对应了2016年降水量的时间变化(图3);受7月初强暴雨的影响,7月灾害影响的面积最大;6月开始灾害影响面积开始明显增大,这与6月持续强降水(图3)引起土壤水分饱或积水进而影响了作物生长有关。大范围的区域受灾害影响持续了48 ~64 d(图5(b)),且多在6-8月(图5(a))。另一方面,受灾年NDVI相比未受灾年降低幅度主要在0.2以上,按照植被指数与作物生长特征[22],这个差值指出作物长势已经受到灾害很大的影响。研究区耕地主要为水稻种植区,4-11月种植早稻,5-11月晚稻种植与早期冬小麦轮作。在此耕种规律下,图5显示的6月初开始灾害影响面积明显增大的结果指出了持续降水已经很大地影响了作物的耕种和生长。
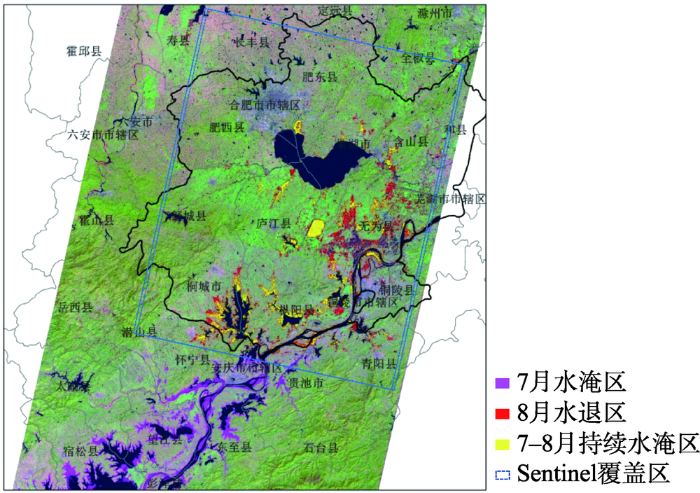
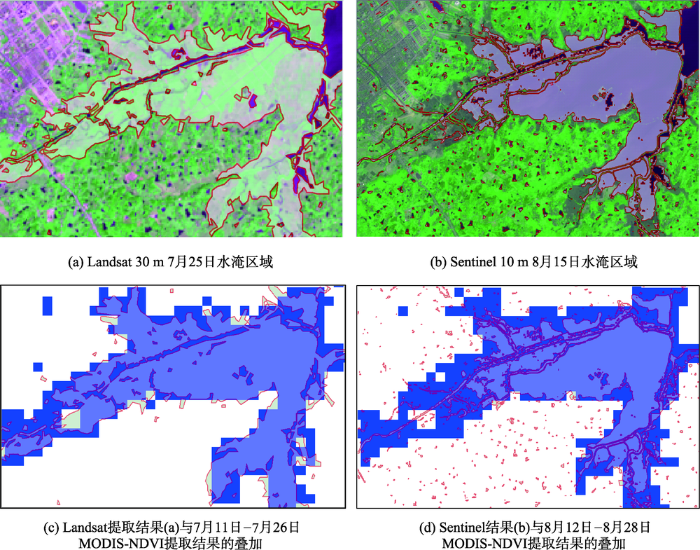
图6为利用Landsat和Sentinel数据提取的7月25日和8月15日区域被水淹的空间分布。为比较不同卫星数据的提取结果,图7给出了各卫星数据提取的同时期结果的叠加样例。
图6 应用Landsat和Sentinel数据提取的7月25日和8月15日水淹区的空间分布
注:底图为由Landsat8-OLI波段6、5、和4合成的彩色影像(R:G:B=6:5:4)
Fig. 6 Spatial distribution of flooded areas on July 25 and August 15 derived from Landsat and Sentinel data
图7 Landsat 30 m以及Sentinel 10 m的水淹区域提取结果的样例
注:红色边界和透明色为Landsat和Sentinel提取结果的图斑;蓝色为对应时期MODIS提取的受灾影响区域
Fig. 7 Examples of the extraction results of flooded area from Landsat-30m and Sentinel 10 m data
由灾后和灾前MODIS同时相NDVI变化特征提取的结果包含了暴雨和持续降水对耕地作物生长产生影响的信息,同时也包含了耕地水淹信息;而由Landsat和Sentinel水体变化提取的结果仅是耕地被水淹没的信息。图6显示的Landsat和Sentinel水淹空间分布基本相似于图4中MODIS的结果,但它们之间的结果存在一些细微的差异(图1)。图6中的MODIS结果是对应于7月25日(Landsat)和8月15日(Sentinel)MODIS时相提取的2016年与2015年的NDVI差值从该时相开始连续3个时相小于0.15时提取的像元。如图7所示,MODIS提取的灾害影响范围比Landsat和Sentinel提取的水淹区域范围大。另外,不同卫星空间分辨率提出的结果差异也很明显,Landsat和Sentinel的结果中分布有大量零碎像似噪音的图斑。对照灾前和灾后卫星影像的水体时,发现研究区内大小池塘类的水域很多,受灾年的持续降水使池塘水域范围扩大,由此2015年和2016年的水体变化里包含了大量这些水面扩大的变化区,且空间分辨率略高的Sentinel结果中的零碎图斑多于30 m的Landsat的结果(图7(d))。同时,8月12-8月20日MODIS的提取结果面积要大于Sentinel数据的结果,主要原因在于基于NDVI时序数据提取灾害范围包括已退水但作物无法恢复到正常年份生长状态的此类情况的受灾区域。而由于MODIS较粗250 m的空间分辨率,不敏感那些面积微小的水体信息,因此平滑了那些小面积的水体变化信息。
表2给出了以巢湖流域为受灾中心范围的10个县市(无为、庐江、巢湖、桐城、肥东、肥西、舒城、枞阳、和县)为统计范围(图6中黑色粗线内区域),统计的各卫星提取的变化面积,包括由MODIS-NDVI提取的各个时期灾害影响增加的面积、在各个时期灾害影响的总面积以及Landsat和Sentinel提取的水淹面积。表中各个时期灾害影响的总面积是由灾害影响开始时期及其持续时长统计计算的结果。比较表2所示Landsat提取的7月25日水淹面积为1233.9 km2略大于对应的MODIS提取的灾害影响面积1198 km2,这个时期的水淹区域应该是7月1日的强大暴雨所导致水淹区。8月15日Sentinel卫星提取的结果面积为751.1 km2,与7月25日水淹区进行叠加交集运算结果指出,比较于 7月基本没有水淹增加区,到8月时7月水淹区的水退面积约为647 km2。
表2 各卫星观测提取的变化面积统计(km2)
Tab. 2 Area affected and flooded by heavy rainfall extracted by different satellite observations
| 类型 | 日期 | |||||||
|---|---|---|---|---|---|---|---|---|
| 5月24日-6月8日 | 6月9日-6月24日 | 6月25日-7月10日 | 7月11日-7月26日 | 7月27日-8月11日 | 8月12日-8月27日 | 8月28日-9月12日 | ||
| MODIS提取的 灾害影响面积 | 新增 | 111.6 | 338.7 | 565.7 | 293.6 | 206.0 | 107.5 | 65.5 |
| 实际 | 318.6 | 528.0 | 1016.0 | 1198.0 | 1328.4 | 1344.8 | 1230.0 | |
| Landsat/Sentinel 提取的水淹面积 | - | - | - | 1233.9 | - | 751.1 | - | |
利用MODIS提取的灾害影响结果数据,累计开始时期在5-9月(图5(a))且持续时长达60 d以上(图5(b))的像元数,转换为面积则为2144.7 km2,非常接近于民政部统计发布的受灾面积2377 km2。由此结果表明,上述基于MODIS多时相NDVI变化结果提取的灾害影响面积可以作为区域政府评估灾情的参考依据。
暴雨灾害对耕地农作物除了淹没耕地形成灾害之外,其对作物生长产生的影响也是不容忽略的。而暴雨灾害对作物生长影响是一个渐变过程,需要时间动态的变化来评估灾害的影响。多源卫星遥感观测可以获取具有时空动态变化特征的信息,实现对地面进行更详尽的动态监测。本文面向暴雨灾害灾情评估需求,利用Terra/MODIS观测获取的多时相NDVI数据,挖掘高时间分辨率卫星观测数据的应用,提出了一种利用NDVI变化的特征值进行灾情动态信息提取方法,该方法可以快速地提取大范围区域由持续强降水和暴雨天气灾害导致的作物生长情况出现的变化信息,包括耕地受灾开始时期和灾害影响的持续时长。另外,分别利用30 m和10 m的Landsat和Sentinel观测数据,进行受淹耕地提取,解析高空间分辨率在灾害信息提取中的应用效果。结果表明,基于MODIS多时相NDVI变化结果提取信息包含着受灾害影响开始时期和持续时长等丰富的时空动态信息,且覆盖范围大,对于大范围区域灾情评估具有很大的参考价值;Landsat和Sentinel提取的水淹区,可为暴雨致灾范围的获取提供准确的参考信息。作为评估灾情信息的依据之一,这些灾情动态信息能够更好地为灾后耕地的恢复情况以及国家灾后损失评估和救助决策提供科学的数据依据。
本文研究为利用多源卫星遥感获取暴雨灾情动态信息提供了一个方法应用研究案例。随着未来雷达和光学等多颗卫星的增加,多源卫星遥感观测将更加准确的获取灾情时空动态信息。
The authors have declared that no competing interests exist.
| [1] |
中国灾害遥感研究进展 [J].https://doi.org/10.11834/jrs.20166171 URL [本文引用: 1] 摘要
随着灾害系统理论的深化和遥感技术的快速发展,中国灾害遥感研究与应用服务取得了丰硕成果。本文以灾害系统理论为基础,从"天—空—地—现场"一体化灾害立体监测体系、灾害要素分类体系、灾害遥感服务体系和标准规范建设等方面,总结了灾害遥感理论研究进展。分析了洪涝、干旱、地震、地质灾害等主要灾害遥感监测评估方法,并对应用研究热点和存在的问题进行了讨论。分3个阶段阐述了中国灾害遥感系统的发展历程,基于业务应用需求介绍了灾害遥感业务系统的体系架构。按照灾害遥感日常监测业务、应急监测业务和特别重大自然灾害损失评估等3个方面介绍了业务应用模式,并从时效性、评估精度和业务流程等方面对业务应用进展水平进行了评述。分析了当前灾害遥感研究与应用工作面临的机遇与挑战,对今后发展提出了加强灾害遥感应用机理研究、加快防灾减灾空间基础设施建设、加强灾害监测评估方法研究、提升综合减灾空间信息服务能力和加强软环境建设等对策建议。
Research progress of disaster remote sensing in China [J].https://doi.org/10.11834/jrs.20166171 URL [本文引用: 1] 摘要
随着灾害系统理论的深化和遥感技术的快速发展,中国灾害遥感研究与应用服务取得了丰硕成果。本文以灾害系统理论为基础,从"天—空—地—现场"一体化灾害立体监测体系、灾害要素分类体系、灾害遥感服务体系和标准规范建设等方面,总结了灾害遥感理论研究进展。分析了洪涝、干旱、地震、地质灾害等主要灾害遥感监测评估方法,并对应用研究热点和存在的问题进行了讨论。分3个阶段阐述了中国灾害遥感系统的发展历程,基于业务应用需求介绍了灾害遥感业务系统的体系架构。按照灾害遥感日常监测业务、应急监测业务和特别重大自然灾害损失评估等3个方面介绍了业务应用模式,并从时效性、评估精度和业务流程等方面对业务应用进展水平进行了评述。分析了当前灾害遥感研究与应用工作面临的机遇与挑战,对今后发展提出了加强灾害遥感应用机理研究、加快防灾减灾空间基础设施建设、加强灾害监测评估方法研究、提升综合减灾空间信息服务能力和加强软环境建设等对策建议。
|
| [2] |
基于环境减灾卫星CCD数据的海南岛洪涝灾害监测 [J].https://doi.org/10.11975/j.issn.1002-6819.2015.17.025 URL Magsci [本文引用: 1] 摘要
洪涝灾害监测是农情监测的主要任务之一,遥感监测可以弥补地面观测耗人、耗财、信息滞后等诸多不足,已成为洪涝灾害研究领域的重要发展方向。该文基于HJ-1A/1B-CCD数据,以海南岛为研究区,选取研究区内400个训练样本,利用区分度(division degree,DD)对归一化差异水体指数(normalized difference water index, NDWI)、基于蓝光的归一化差异水体指数(normalized difference water index based on blue light, NDWI-B)和混合水体指数(combined index of NDVI and NIR for water body identification, CIWI)3种水体指数进行比较分析。分析结果显示,在应用HJ-1CCD数据进行纯水体、湿地识别时,NDWI-B模型效果最好(综合区分度分别为31.30%、28.13%),是海南岛洪涝灾害监测的最优模型。经验证,NDWI-B模型的水体识别总体精度达91.50%。通过对采样点的水体指数值与地物类型的反复对比确定NDWI-B模型的水体识别阈值为-0.015。利用NDWI-B模型对海南岛2010年9月25日至10月25日的洪涝灾情进行监测。结果表明,10月12日的灾情最为严重,全岛洪水淹没面积达到监测期内最高值,为120.22km2,除东方、昌江、乐东外所有市县均出现新增水体,新增水体主要分布于村庄、耕地、道路、城镇居民地等。从区域上看,东部的文昌、琼海、海口、定安为洪涝重灾区,西部的东方、昌江、乐东为洪涝轻灾区。全岛洪涝影响最大的土地利用类型为水田,其次为旱地。10月12日,水田、旱地的淹没面积分别为61.46和29.59 km2,耕地(水田和旱地)淹没面积占总淹没面积的比例为75.73%。NDWI-B模型具有水陆区分度较大和水体面积提取精度较高的优点外,还能够识别小范围水体和湿地,是海南岛洪涝灾害监测较为理想的模型。该文为海南岛水资源管理、洪涝灾害动态监测及防灾减灾提供参考。
Flood monitoring in Hainan Island based on HJ-CCD data [J].https://doi.org/10.11975/j.issn.1002-6819.2015.17.025 URL Magsci [本文引用: 1] 摘要
洪涝灾害监测是农情监测的主要任务之一,遥感监测可以弥补地面观测耗人、耗财、信息滞后等诸多不足,已成为洪涝灾害研究领域的重要发展方向。该文基于HJ-1A/1B-CCD数据,以海南岛为研究区,选取研究区内400个训练样本,利用区分度(division degree,DD)对归一化差异水体指数(normalized difference water index, NDWI)、基于蓝光的归一化差异水体指数(normalized difference water index based on blue light, NDWI-B)和混合水体指数(combined index of NDVI and NIR for water body identification, CIWI)3种水体指数进行比较分析。分析结果显示,在应用HJ-1CCD数据进行纯水体、湿地识别时,NDWI-B模型效果最好(综合区分度分别为31.30%、28.13%),是海南岛洪涝灾害监测的最优模型。经验证,NDWI-B模型的水体识别总体精度达91.50%。通过对采样点的水体指数值与地物类型的反复对比确定NDWI-B模型的水体识别阈值为-0.015。利用NDWI-B模型对海南岛2010年9月25日至10月25日的洪涝灾情进行监测。结果表明,10月12日的灾情最为严重,全岛洪水淹没面积达到监测期内最高值,为120.22km2,除东方、昌江、乐东外所有市县均出现新增水体,新增水体主要分布于村庄、耕地、道路、城镇居民地等。从区域上看,东部的文昌、琼海、海口、定安为洪涝重灾区,西部的东方、昌江、乐东为洪涝轻灾区。全岛洪涝影响最大的土地利用类型为水田,其次为旱地。10月12日,水田、旱地的淹没面积分别为61.46和29.59 km2,耕地(水田和旱地)淹没面积占总淹没面积的比例为75.73%。NDWI-B模型具有水陆区分度较大和水体面积提取精度较高的优点外,还能够识别小范围水体和湿地,是海南岛洪涝灾害监测较为理想的模型。该文为海南岛水资源管理、洪涝灾害动态监测及防灾减灾提供参考。
|
| [3] |
Fast flooding information extraction in emergency response of flood disaster [J].
ABSTRACT Flood disaster is one of the natural disasters those have the highest occurrence frequency. Remote sensing plays an active and important role in the flood disaster management such as monitoring, evaluation, emergency response and so on. Affected by the characteristics of flood disaster, emergency response for flood disaster must be guaranteed by a high quality and speedy remote sensing data resources. It has a special requirement to the speed of flood disaster information extraction and updating. In operational works, not same as other ordinary scientific research, "data-information" flow is always a process need to be accomplished automatically. Considering that the ability of extracting flood information will definitively affect the following operational work such as disaster situation analysis, loss evaluation, decision-making support for salvations and so on, it is need to make a father research on the technology of fast automatic flooding information extraction. According to the water characteristics that reflect on the remote sensing images (including optical sensor and microwave radar), the method of extracting flooded area from remote sensing images that can be used currently was analyzed. It includes threshold method, NWDI method, NDVI method, and so on. In the aspect of implementation and application, the automatic abilities of these methods were discussed and they are all thought having some automation ability. Based on this discussion, two automatic/semi-automatic methods of extracting flooded area information fast from remote sensing images were designed: decision tree model method and programming method. Being affected by spectrums of objects, these two methods are all disturbed badly by mountain shadow. By researching on the model encapsulate technology and combining the terrain analysis function of GIS spatial analysis, affection of mountain shadow can be mitigated and the result data can be updated automatically. All the methods reported in this article integrated in a case-study system. They were thought having some good effect. Under the situation not having human-intervention, the flooded area can be extracted from remote sensing images directly.
|
| [4] |
Monitoring of the Spatio-temporal dynamics of the floods in the Guayas Watershed (Ecuadorian Pacific Coast) using global monitoring ENVISAT ASAR images and rainfall data [J].https://doi.org/10.3390/w9010012 URL [本文引用: 1] 摘要
The floods are an annual phenomenon on the Pacific Coast of Ecuador and can become devastating during El Ni09o years, especially in the Guayas watershed (32,300 km05), the largest drainage basin of the South American western side of the Andes. As limited information on flood extent in this basin is available, this study presents a monitoring of the spatio-temporal dynamics of floods in the Guayas Basin, between 2005 and 2008, using a change detection method applied to ENVISAT ASAR Global Monitoring SAR images acquired at a spatial resolution of 1 km. The method is composed of three steps. First, a supervised classification was performed to identify pixels of open water present in the Guayas Basin. Then, the separability of their radar signature from signatures of other classes was determined during the four dry seasons from 2005 to 2008. In the end, standardized anomalies of backscattering coefficient were computed during the four wet seasons of the study period to detect changes between dry and wet seasons. Different thresholds were tested to identify the flooded areas in the watershed using external information from the Dartmouth Flood Observatory. A value of 612.30 ± 0.05 was found suitable to estimate the number of inundated pixels and limit the number of false detection (below 10%). Using this threshold, monthly maps of inundation were estimated during the wet season (December to May) from 2004 to 2008. The most frequently inundated areas were found to be located along the Babahoyo River, a tributary in the east of the basin. Large interannual variability in the flood extent is observed at the flood peak (from 50 to 580 km05), consistent with the rainfall in the Guayas watershed during the study period.
|
| [5] |
基于MODIS时间序列数据的洞庭湖区洪水淹没频率研究 [J].Research of flood submerged frequency in Dongting lake region based on time series dataset of MODIS [J]. |
| [6] |
基于COMO-SkyMed和SPOT-5的城镇洪水淹没信息快速提取研究 [J].https://doi.org/10.11873/j.issn.1004-0323.2016.3.0564 URL Magsci [本文引用: 1] 摘要
<p>洪水是我国最为频繁的自然灾害之一,如何快速准确地获取洪水淹没范围在救灾减灾工作中具有重要意义.目前,卫星遥感技术已广泛应用于洪水信息提取的研究中.不同的遥感数据源在洪水信息提取中各有利弊,综合研究雷达影像和可见光影像的优缺点,建立了基于多源遥感数据的洪水淹没信息快速提取模型.首先,利用灾中第一时间获取的COSMOGSkyMed雷达影像,采用面向对象的方法提取出洪灾发生时的水域空间信息;其次,利用灾前SPOTG5高分辨率光学影像,采用多光谱影像波段运算和决策树分类的思想提取出常态下的水域空间信息;最后,对灾中雷达影像COSMOGSkyMed提取的水体和灾前光学影像SPOTG5提取的水体进行空间差值运算,得到洪水淹没范围信息,并利用洪水当天拍摄的无人机遥感影像对结果进行精度评价.将该模型应用于2013年浙江余姚水灾,监测结果表明:在洪水发生后,能够快速获取淹没范围空间信息,并且提取精度达到93.7%,为洪灾的防治以及抗洪抢险救灾工作提供强有力的技术支撑和基础数据信息.</p>
A Research on town flood information rapid extraction based on COSMO-SkyMed and SPOT-5 [J].https://doi.org/10.11873/j.issn.1004-0323.2016.3.0564 URL Magsci [本文引用: 1] 摘要
<p>洪水是我国最为频繁的自然灾害之一,如何快速准确地获取洪水淹没范围在救灾减灾工作中具有重要意义.目前,卫星遥感技术已广泛应用于洪水信息提取的研究中.不同的遥感数据源在洪水信息提取中各有利弊,综合研究雷达影像和可见光影像的优缺点,建立了基于多源遥感数据的洪水淹没信息快速提取模型.首先,利用灾中第一时间获取的COSMOGSkyMed雷达影像,采用面向对象的方法提取出洪灾发生时的水域空间信息;其次,利用灾前SPOTG5高分辨率光学影像,采用多光谱影像波段运算和决策树分类的思想提取出常态下的水域空间信息;最后,对灾中雷达影像COSMOGSkyMed提取的水体和灾前光学影像SPOTG5提取的水体进行空间差值运算,得到洪水淹没范围信息,并利用洪水当天拍摄的无人机遥感影像对结果进行精度评价.将该模型应用于2013年浙江余姚水灾,监测结果表明:在洪水发生后,能够快速获取淹没范围空间信息,并且提取精度达到93.7%,为洪灾的防治以及抗洪抢险救灾工作提供强有力的技术支撑和基础数据信息.</p>
|
| [7] |
2013年黑龙江大洪水遥感监测分析 [J].https://doi.org/10.3969/j.issn.1000-0852.2014.05.006 URL [本文引用: 1] 摘要
2013年汛期,黑龙江流域发生自1984年以来最大洪水,下游发生超100年一遇特大洪水,干流萝北至同江河段多处堤防出现险情。利用多源卫星遥感数据,对2013年黑龙江大洪水汛情和灾情进行了持续动态监测和分析评估,准确、及时、全面地跟踪了整个流域洪水的演进过程及发展变化趋势,特别是解决了无观测资料情况下对洪灾的监测预测难题。
Satellite remote sensing monitoring and analysis of heilongjiang river flood in 2013 [J].https://doi.org/10.3969/j.issn.1000-0852.2014.05.006 URL [本文引用: 1] 摘要
2013年汛期,黑龙江流域发生自1984年以来最大洪水,下游发生超100年一遇特大洪水,干流萝北至同江河段多处堤防出现险情。利用多源卫星遥感数据,对2013年黑龙江大洪水汛情和灾情进行了持续动态监测和分析评估,准确、及时、全面地跟踪了整个流域洪水的演进过程及发展变化趋势,特别是解决了无观测资料情况下对洪灾的监测预测难题。
|
| [8] |
2013年松花江与嫩江交汇段洪水遥感监测 [J].
2013年夏季,东北地区降雨频繁,松花江、嫩江、黑龙江等江河水位暴涨,遭遇继1998年以来最为严重洪水灾害。应用遥感和地理信息系统技术,利用中国环境与灾害监测预报小卫星(简称HJ-1卫星)和Landsat 8卫星影像(HJ-1卫星影像可以弥补Landsat 8卫星重访周期较长、在洪水发生期间可用影像较少的缺陷),对松花江和嫩江交汇段水情进行实时监测,构建洪水监测遥感影像集;利用两种影像确定不同时相的洪水淹没范围,掌握洪水发展的过程,对淹没区的灾情进行快速评估。遥感监测结果表明,2013年6月17日至7月26日,洪水主要使主河道展宽,镇赉县局部河漫滩和低洼地被洪水淹没;7月26日至8月20日,洪水主要淹没了河漫滩和低洼地;8月20至9月8日,河流总体变化不大。截至9月8日,松花江、嫩江交汇段淹没面积为1 170.2 km2,其中吉林省境内的淹没面积为622.58 km2,黑龙江省境内的淹没面积为547.62 km2;淹没的土地覆盖类型以耕地和沼泽为主,其淹没面积分别为759.58 km2和348.25 km2,两者面积共占总淹没面积的94.67%;居住地淹没较为严重的为杜尔伯特蒙古族自治县和肇源县,两县淹没面积分别为0.43 km2和0.30 km2,其中,杜尔伯特他拉哈镇安平村、肇源县四合村受洪灾较重。
Flood monitoring on the confluence of nenjiang river and songhua river in 2013 by multi-source, multi-temporal remote sensing imagery [J].
2013年夏季,东北地区降雨频繁,松花江、嫩江、黑龙江等江河水位暴涨,遭遇继1998年以来最为严重洪水灾害。应用遥感和地理信息系统技术,利用中国环境与灾害监测预报小卫星(简称HJ-1卫星)和Landsat 8卫星影像(HJ-1卫星影像可以弥补Landsat 8卫星重访周期较长、在洪水发生期间可用影像较少的缺陷),对松花江和嫩江交汇段水情进行实时监测,构建洪水监测遥感影像集;利用两种影像确定不同时相的洪水淹没范围,掌握洪水发展的过程,对淹没区的灾情进行快速评估。遥感监测结果表明,2013年6月17日至7月26日,洪水主要使主河道展宽,镇赉县局部河漫滩和低洼地被洪水淹没;7月26日至8月20日,洪水主要淹没了河漫滩和低洼地;8月20至9月8日,河流总体变化不大。截至9月8日,松花江、嫩江交汇段淹没面积为1 170.2 km2,其中吉林省境内的淹没面积为622.58 km2,黑龙江省境内的淹没面积为547.62 km2;淹没的土地覆盖类型以耕地和沼泽为主,其淹没面积分别为759.58 km2和348.25 km2,两者面积共占总淹没面积的94.67%;居住地淹没较为严重的为杜尔伯特蒙古族自治县和肇源县,两县淹没面积分别为0.43 km2和0.30 km2,其中,杜尔伯特他拉哈镇安平村、肇源县四合村受洪灾较重。
|
| [9] |
flood mapping inferred from remote sensing data [J].
In ungauged basin, space-based information is essential for the monitoring of hydrological water cycle, in particular in regions undergoing large flood events where satellite data may be used as input to hydrodynamic models. A method for near 3D flood monitoring has been developed which uses synergies between radar altimetry and high temporal resolution multi-spectral satellite. Surface Reflectance from the MODIS Terra instrument are used to map areas of open water as well as aquatic vegetation on a weekly basis, while water level variations in the inundated areas are provided by the radar altimetry from the Topex / Poseidon (T/P) and Envisat satellites. We present this synergistic approach to three different regions: Niger Inner delta and Lake Tchad in Africa, and Ganga river delta in Asia. Based mainly on visible and Near Infra Red (NIR) imagery is suitable to the observation of inundation extent. This method is well adapted for arid and semi arid regions, but less for equatorial or boreal ones due to cloud coverage. This work emphasizes the limitations of current remote sensing techniques for full 3Ddescription of water storage variability in ungauged basins, and provides a good introduction to the need and the potential use of the future SWOT (Surface Water and Ocean Topography) satellite mission.
|
| [10] |
Modelling the impact of flooding using geographic information system and remote sensing [J].
Abstract- Flooding is one of the most devastating natural disasters in Nigeria. The impact of flooding on human activities cannot be overemphasized. It can threaten human lives, their property, environment and the economy. Different techniques exist to manage and analyze the impact of flooding. Some of these techniques have not been effective in management of flood disaster. Remote sensing technique presents itself as an effective and efficient means of managing flood disaster. In this study, SPOT-10 image was used to perform land cover/ land use classification of the study area. Advanced Space borne Thermal Emission and Reflection Radiometer (ASTER) image of 2010 was used to generate the Digital Elevation Model (DEM). The image focal statistics were generated using the Spatial Analyst/ Neighborhood/Focal Statistics Tool in ArcMap. The contour map was produced using the Spatial Analyst/ Surface/ Contour Tools. The DEM generated from the focal statistics was reclassified into different risk levels based on variation of elevation values. The depression in the DEM was filled and used to create the flow direction map. The flow accumulation map was produced using the flow direction data as input image. The stream network and watershed were equally generated and the stream vectorized. The reclassified DEM, stream network and vectorized land cover classes were integrated and used to analyze the impact of flood on the classes. The result shows that 27.86% of the area studied will be affected at very high risk flood level, 35.63% at high risk, 17.90% at moderate risk, 10.72% at low risk, and 7.89% at no risk flood level. Built up area class will be mostly affected at very high risk flood level while farmland will be affected at high risk flood level. Oshoro, Imhekpeme, and Weppa communities will be affected at very high risk flood inundation while Ivighe, Uneme, Igoide and Iviari communities will be at risk at high risk flood inundation level. It is recommended among others that buildings that fall within the "Very High Risk" area should be identified and occupants possibly relocated to other areas such as the "No Risk" area.Keyword- Flooding, Remote sensing, GIS, RiskI. INTRODUCTIONOver the past decades, the pattern of floods across all continents has been changing, becoming more frequent, intense and unpredictable for local communities, particularly as issues of development and poverty have led more people to live in areas vulnerable to flooding [1]. Flood by nature are complex events caused by a range of human vulnerabilities, inappropriate development planning and climate variability [2]. A UN HABITAT Report in 2010 predicted that "more than 25% of Africa's population living within 100km from the coast will be at risk from sea level rise and coastal flooding within the next decade 2010-2020" and recommended immediate adoption of mitigation measures to reduce vulnerability [3]. It has been reported that developing
|
| [11] |
Extraction of flood areas due to the 2011 central Thailand flood using Aster and Terrasar-x data [C]. |
| [12] |
Dellepiane S, Boin G, et al. Information extraction from remote sensing images for flood monitoring and damage evaluation [C]. |
| [13] |
Detection of flood and its impact on crops using NDVI-Corn case [C]. |
| [14] |
Remote sensing based flood damage estimation using crop condition profiles [C]. |
| [15] |
Schwaller M, etal. On the Blending of the Landsat and MODIS SurfaceReflectance: Predicting Daily Landsat Surface Reflectance [J].https://doi.org/10.1109/TGRS.2006.872081 URL [本文引用: 1] 摘要
The 16-day revisit cycle of Landsat has long limited its use for studying global biophysical processes, which evolve rapidly during the growing season. In cloudy areas of the Earth, the problem is compounded, and researchers are fortunate to get two to three clear images per year. At the same time, the coarse resolution of sensors such as the Advanced Very High Resolution Radiometer and Moderate Resolution Imaging Spectroradiometer (MODIS) limits the sensors' ability to quantify biophysical processes in heterogeneous landscapes. In this paper, the authors present a new spatial and temporal adaptive reflectance fusion model (STARFM) algorithm to blend Landsat and MODIS surface reflectance. Using this approach, high-frequency temporal information from MODIS and high-resolution spatial information from Landsat can be blended for applications that require high resolution in both time and space. The MODIS daily 500-m surface reflectance and the 16-day repeat cycle Landsat Enhanced Thematic Mapper Plus (ETM+) 30-m surface reflectance are used to produce a synthetic "daily" surface reflectance product at ETM+ spatial resolution. The authors present results both with simulated (model) data and actual Landsat/MODIS acquisitions. In general, the STARFM accurately predicts surface reflectance at an effective resolution close to that of the ETM+. However, the performance depends on the characteristic patch size of the landscape and degrades somewhat when used on extremely heterogeneous fine-grained landscapes.
|
| [16] |
融合MODIS与Landsat 数据生成高时间分辨率Landsat数据 [J].
遥感数据时空融合技术是一种低空间分辨率影像与中空间分辨率影像在时间域和空间域的融合技术,利用遥感数据时空融合技术获得的融合影像既具备低空间分辨率影像的高时间分辨率特征,又具备中空间分辨率影像的高空间分辨率特征.提出了一种新的遥感数据时空融合方法(STDFA).该方法从时序MODIS数据中提取地物的时间变化信息,结合早期Landsat-TM影像的纹理信息,融合出具有MODIS时间分辨率和TM空间分辨率的影像.以江苏省南京市江宁区为研究区,以Landsat红波段和近红外波段为融合波段,对该方法进行了测试.结果显示,该方法能够产生高精度的中空间分辨率影像,融合影像与真实影像间的相关系数达到0.939.融合影像计算的NDVI与真实中空间分辨率影像计算的NDVI间的相关性达到0.938.
W J, Niu Z, et al. A model for spatial and temporal data fusion [J].
遥感数据时空融合技术是一种低空间分辨率影像与中空间分辨率影像在时间域和空间域的融合技术,利用遥感数据时空融合技术获得的融合影像既具备低空间分辨率影像的高时间分辨率特征,又具备中空间分辨率影像的高空间分辨率特征.提出了一种新的遥感数据时空融合方法(STDFA).该方法从时序MODIS数据中提取地物的时间变化信息,结合早期Landsat-TM影像的纹理信息,融合出具有MODIS时间分辨率和TM空间分辨率的影像.以江苏省南京市江宁区为研究区,以Landsat红波段和近红外波段为融合波段,对该方法进行了测试.结果显示,该方法能够产生高精度的中空间分辨率影像,融合影像与真实影像间的相关系数达到0.939.融合影像计算的NDVI与真实中空间分辨率影像计算的NDVI间的相关性达到0.938.
|
| [17] |
Method to construct high spatial and temporal resolution DataSet-StAVFM [J].https://doi.org/10.3724/SP.J.1146.2010.00112 URL [本文引用: 1] 摘要
To combine the high spatial resolution of Landsat and high temporal resolution of MODIS data,We selected an 18 km 18 km study area in upper reaches of Guanting reservoir.A new method patial and Temporal Adaptive vegetation index Fusion Model(STAVFM) for blending NDVI of different spatial and temporal resolutions to produce high temporal-spatial resolution NDVI dataset has been developed based on STARFM(Spatial and Temporal Adaptive Reflectance Fusion Model). STAVFM defined a time window according to the temporal variation of vegetation,put the vegetation phenophase into consideration and improve the temporal weighting algorithm.The result shows that the new method can combine the temporal information of MODIS NDVI and spatial difference information of ETM NDVI and can predict the missed ETM NDVI with a high accuracy(the correlation coefficients of three pairs of observed and predicted ETM NDVI are 0.82,0.90 and 0.91).A high temporal and high spatial resolution NDVI dataset is constructed,which maintains the temporal trend of high temporal resolution data and the detailed spatial difference information of high spatial resolution data.
|
| [18] |
Copernicus sentinel-2A calibration and products validation status [J].https://doi.org/10.3390/rs9060584 URL [本文引用: 2] 摘要
As part of the Copernicus programme of the European Commission (EC), the European Space Agency (ESA) has developed and is currently operating the Sentinel-2 mission that is acquiring high spatial resolution optical imagery. This article provides a description of the calibration activities and the status of the mission products validation activities after one year in orbit. Measured performances, from the validation activities, cover both Top-Of-Atmosphere (TOA) and Bottom-Of-Atmosphere (BOA) products. The presented results show the good quality of the mission products both in terms of radiometry and geometry and provide an overview on next mission steps related to data quality aspects.
|
| [19] |
MODIS/Terra Vegetation Indices 16-Day L3 Global 250m SIN Grid [EB/OL]. [ |
| [20] |
MODIS Vegetation Index User's Guide(MOD13 Series) [EB/OL].[2015-06-03]. . |
| [21] |
利用改进的归一化差异水体指数(MNDWI)提取水体信息的研究 [J].https://doi.org/10.3321/j.issn:1007-4619.2005.05.012 URL Magsci [本文引用: 1] 摘要
在对M cfeeters提出的归一化差异水体指数(NDWI)分析的基础上,对构成该指数的波长组合进行了修改,提出了改进的归一化差异水体指数MNDWI(M odified NDWI),并分别将该指数在含不同水体类型的遥感影像进行了实验,大部分获得了比NDWI好的效果,特别是提取城镇范围内的水体。NDWI指数影像因往往混有城镇建筑用地信息而使得提取的水体范围和面积有所扩大。实验还发现MNDWI比NDWI更能够揭示水体微细特征,如悬浮沉积物的分布、水质的变化。另外,MNDWI可以很容易地区分阴影和水体,解决了水体提取中难于消除阴影的难题。
A study on information extraction of water body with the modified normalized difference water index(MNDWI) [J].https://doi.org/10.3321/j.issn:1007-4619.2005.05.012 URL Magsci [本文引用: 1] 摘要
在对M cfeeters提出的归一化差异水体指数(NDWI)分析的基础上,对构成该指数的波长组合进行了修改,提出了改进的归一化差异水体指数MNDWI(M odified NDWI),并分别将该指数在含不同水体类型的遥感影像进行了实验,大部分获得了比NDWI好的效果,特别是提取城镇范围内的水体。NDWI指数影像因往往混有城镇建筑用地信息而使得提取的水体范围和面积有所扩大。实验还发现MNDWI比NDWI更能够揭示水体微细特征,如悬浮沉积物的分布、水质的变化。另外,MNDWI可以很容易地区分阴影和水体,解决了水体提取中难于消除阴影的难题。
|
| [22] |
Study on the interaction between NDVI profile and the growing status of crops [J].https://doi.org/10.1007/s11769-003-0086-4 URL [本文引用: 1] 摘要
)of crops were retrieved from meteorological satellite NOAA AVHRR images. The temporal variations of the were analyzed during the whole growing season, and thus the principle of the interaction between profile and the growing status of crops was discussed. As a case in point, the relationship between integral and winter wheat yield of Henan Province in 1999 had been analyzed. By putting integral values of 60 sample counties into the winter wheat yield-integral coordination, scattering map was plotted. It demonstrated that integral had a close relation with winter wheat yield. These relation could be described with linear, cubic polynomial, and exponential regression, and the cubic polynomial regression was the best way. In general, reflects growing status of green vegetation, so crop monitoring and crop yield estimation could be realized by using remote sensing technique on the basis of time serial data together with agriculture calendars.
|

/
| 〈 |
|
〉 |