孟伟 , 李润奎
, 李润奎
MENG Wei, LI Runkui
通讯作者:
收稿日期: 2017-11-21
修回日期: 2018-02-6
网络出版日期: 2018-07-20
版权声明: 2018 《地球信息科学学报》编辑部 《地球信息科学学报》编辑部 所有
基金资助:
作者简介:
作者简介:孟 伟(1994-),男,硕士生,研究方向为空间数据挖掘。E-mail:18811152566@163.com
展开
摘要
数字高程模型(Digital Elevation Model, DEM)是一种至关重要的空间信息,广泛应用于各行各业。其中,ASTER GDEM与SRTM几乎覆盖了全球陆域,为地学研究提供了非常实用的高程数据支撑,但是由于二者传感器采集数据原理的不同,使得高程数据在不同地貌条件下的高程精度亦存在程度不一的误差。本文提出了一种新型的基于地貌特征的DEM融合方法,使得融合GDEM与SRTM后的DEM数据,消除了地貌特征的影响、显著地提高了DEM质量。该方法主要分为地理配准和高程融合2个步骤:①基于河流线对等线性地貌特征的位置数据,构建了GDEM与SRTM的水平偏移相关的误差评价函数,采用多级网格搜索法求得DEM间的水平偏移距离,实现对DEM的配准;②按照DEM高程值在不同地貌单元及边界线附近的高程变化特征,建立地貌分区的高程融合模型来融合两种地理配准后的DEM高程,尤其是实现了地貌单元边界线附近的高程平滑过渡。本文以怀柔北部地区为实验区,以1:5万地形图为参考,对2种DEM数据进行融合,统计结果表明:① 融合DEM在各地貌单元的误差均显著下降,地形表达较之融合前更加精确;② 高程差呈现正态分布,明显区别于融合前DEM不对称的多峰分布形态,说明地貌影响被有效地剔除;③ GDEM和SRTM数据的精度对坡度有较大依赖性,融合后DEM的精度在不同坡度范围下均优于GDEM和SRTM,显著降低了融合前DEM对坡度的依赖程度;④ 在不同坡向下,GDEM和SRTM的RMSE取值波动较大,融合DEM的RMSE取值在各方向表现稳定,高程精度较GDEM和SRTM有显著提高。
关键词:
Abstract
The digital elevation model (DEM) is considered as a source of vital spatial information and is widely used in many fields. The ASTER GDEM and SRTM provide almost global coverage and offer practical elevation data for geography research. However, due to the differences of remote sensing mechanism, GDEM and SRTM datasets present different accuracies on same landform units. A novel elevation data fusion approach is proposed in this paper, which eliminates the impact of landform characteristics on two DEMs and significantly improves the quality of fused DEM. This method focuses on two steps, geo-referencing and elevation fusion. An objective function of errors representing the summary of horizontal shifts between two DEMs by referring to stream link pair is first proposed, and correspondingly a multilevel grid search method is suggested to calculate the optimal horizontal offsets between DEMs. Two geo-referenced DEMs are then fused using regression models over different landform units and moreover the elevations nearby the boundaries of two units are specifically treated using a weighed non-linear regression method. This approach was tested in the area of northern Huairou using a 1: 50 000 topographic map. The statistics show that: (1) the RMSE of fused DEM decreases significantly in all landform units, and the representation of terrain is more accurate than GDEM and SRTM; (2) The difference of the elevation points between fused DEM and referenced topographic map also illustrates a normal distribution, which is obviously different from the asymmetric multi-peak distributions of two raw DEMs, indicating that the topographic effects have been effectively eliminated; (3) The accuracy of fused DEM is superior to that of GDEM and SRTM under different slope ranges, meanwhile, the influence of slope factor on the elevation accuracy of DEM is obviously reduced after fusion; (4) The RMSEs of GDEM and SRTM vary greatly with different aspects, while the RMSE of fused DEM keeps homogenous in almost all aspects, and the elevation accuracy of the fused DEM is also significantly improved in comparison with GDEM and SRTM.
Keywords:
全球数字高程模型ASTER GDEM和SRTM DEM是2种广泛使用的开放数据。其中,光学GDEM分辨率较高,但云层覆盖、薄雾遮挡等天气因素对其数据精度造成较大影响;雷达SRTM穿透能力强、受天气影响较小,但也存在雷达阴影、镜面反射、相位解缠误差等问题[1]。因此,整合二者优势生成高更精度、更可靠的DEM,对其在地貌学、水文模拟、冰川变化等领域的应用具有重要的参考价值[2]。
目前,关于GDEM和SRTM数据精度的研究已经取得不少成果,主要通过与高精度的高程控制点或高精度DEM数据进行比较,实现对DEM的精度评价。如与GPS实测高程点[3]、地形图提取的高程控制点[4]、ICESat雷达测高数据[5,6]、大比例尺地形图生成的DEM[7]进行对比,或利用各种统计方法分析DEM精度与地形参数、植被覆盖度等因素之间的关系[8,9,10];研究内容多集中在高程误差评价方面,评估指标常采用中误差、平均误差、标准差等[7,11],以及地形地貌特征对DEM精度的影响[4,6]。
由于GDEM与SRTM数据的获取方式与处理方法的差别,2种高程模型在同一地区表现出不同的数据精度。相关研究表明,两种数据呈现出的误差分布与地形地貌特征以及地表覆盖类型等因素密切有关[6,8,12-15]。基于GDEM和SRTM的数据特征,常见的DEM融合方法,如加权平均法[16,17]、稀疏表示法[18]、快速傅里叶变换[19]等,尽管融合后DEM的精度有所提高,但是由于融合方法缺乏对地形、地貌、植被等因素的考虑,限制了融合DEM质量的更高提升,地表形态变化因素对DEM融合的影响仍是一个亟待解决的问题[20]。
为了提高GDEM与SRTM的融合质量,本文利用DEM提取的地貌特征,从DEM的地理配准和按照地貌单元融合高程2个重要环节进行建模分析,尤其是对地貌单元之间过渡区高程融合建模,显著地降低了2种DEM融合过程的误差。采用地形图的参考高程数据进行验证,结果表明融合后的DEM结果有效地剔除了地貌对2种DEM高程精度的影响,提高了融合质量。
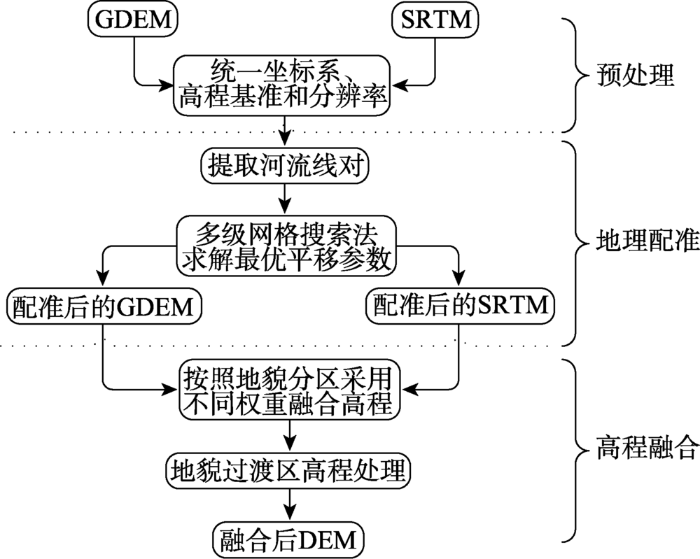
本文提出了基于地貌特征的DEM融合方法,主要解决了融合过程中的2个难点问题:① 针对缺乏地物标识(同名点)的DEM灰度图像,利用河流线对等线性地貌要素进行DEM的地理配准,提高了DEM水平方向的配准精度;② 针对地貌单元边界附近位置的高程受邻近不同类型单元的影响问题,提出了面向地貌单元过渡区的高程融合优化模型方法,而不是简单地按地貌单元的特有参数融合,从而降低地表形态变化对融合高程质量的影响。以GDEM和SRTM为例,基于地貌特征的DEM融合方法流程如图1所示。
GDEM与SRTM之间存在着水平方向的偏移[21,22],甚至在局部地区还比较严重,因此融合不同来源的DEM前必须对其进行地理配准[23]。地理配准需要同名点(或控制点)用于几何变换建模。DEM是表示地形起伏的灰度图像,没有遥感图像上常见的道路交点、桥梁、建筑物等特征点。 Karkee等[24]利用DEM提取的河网交叉点、流域边界线交叉点等作为控制点(同名点)匹配DEM,但是DEM本身存在的高程误差,尤其是在平原地区,DEM的水流方向深受高程精度影响,使得提取出的河流或分水岭等交叉点与真实位置往往存在较大的偏差。
本文提出了一种基于河流线对的DEM地理配准算法。河流线对(同名线对)是指在按照同一流域面积阈值从2个DEM中所提取水系制作的线性地貌特征图上,将2个图中位于同一位置的河段作为同名线。河流线对避免了同名点数量少、分布不均匀的问题,有效地削弱了个别粗差点带来的位置偏差,提高了匹配可靠性。另外,注意在平原地区剔除差异显著的线对。该算法旨在求解一组待变换DEM的水平偏移值使得各河流线对的误差和最小,具体如下:
假设
式中:
GDEM与SRTM的高程精度在不同地区随地形、地貌单元的变化存在较大的差异。为此在DEM融合时,应避免简单地将DEM数据做整体地融合,需要考虑不同地区的地形、地貌的影响,按照地貌分区采用不同权重进行高程融合[17]。本文对地理配准后的GDEM与SRTM按照地貌单元类型分别进行高程融合,采用了多元线性回归模型,其高程值的回归公式如下:
式中:
DEM高程值通常是在两类地貌单元之间平滑过渡的,如果在地貌分界线两侧采用截然不同的两组回归模型参数(式(2)),容易导致融合的高程值在分界线两侧产生较大的突变。针对这个问题,本文提出了一个地貌过渡区的概念,在地貌分界线附近的高程值,受两类地貌单元的影响随着距离变化此消彼长,直到过渡区边缘处完全消失。地貌缓冲区内高程值的估算公式如下:
式中:
DEM精度评价方法主要有检查点法、剖面法、等高线套和分析法等[14,25]。本文以从地形图等高线解译的采样点高程作为高程真值,采用检查点法对融合前后DEM数据的垂直精度进行评价,具体评估统计量如下:
均方根误差:$RMSE=\sqrt{\frac{\sum\limits_{i=1}^{n}(h_{i}-h_{i}^{'})^{2}}{n}}$ (8)
式中:
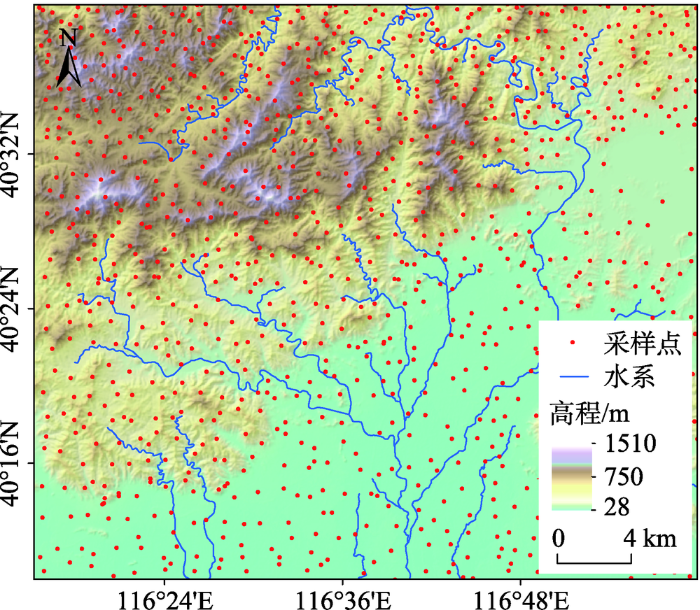
本文所选研究区为怀柔北部地区,经度范围115°15′~117° E,纬度范围40°10′~40°40′ N之间,海拔范围28~1510 m。该区地貌类型较为复杂,中部和南部地势平坦,西部、北部地势较高,多为丘陵和中低山脉,山脊、山谷线性地貌特征明显(图2)。
图2 怀柔北部地区的地面高程、样本点和水系
Fig. 2 DEM, elevation points and stream networks in northern Huairou
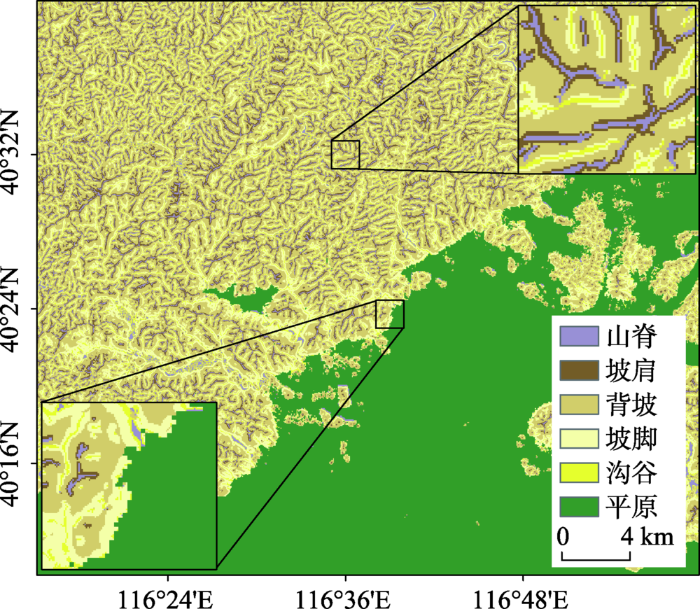
ASTER GDEM(v2)和SRTM数据(v4)来源于中国科学院计算机网络信息中心地理空间数据云平台(http://www.gscloud.cn),为UTM(WGS-84球体)投影坐标系统、EGM96高程基准。为便于DEM融合与精度评价,将SRTM重采样为30 m分辨率,同时采用基于典型位置相似度的模糊推理方法,将研究区划分为山脊、坡肩、背坡、坡脚、沟谷和平原 6种地貌单元[28],如图3所示。此外,以1:5万地形图为参照数据,其精度满足1993年《工程测量规范》,按照分层策略法在各地貌单元随机生成了1100个样本点并根据等高线人工解译出高程值,同时还数字化了该区的河流水系(图2)。地形图为1954北京坐标系、1956黄海高程基准,各数据集一并转为UTM系统和EGM96高程基准。
(1)GDEM、SRTM的水平偏移量
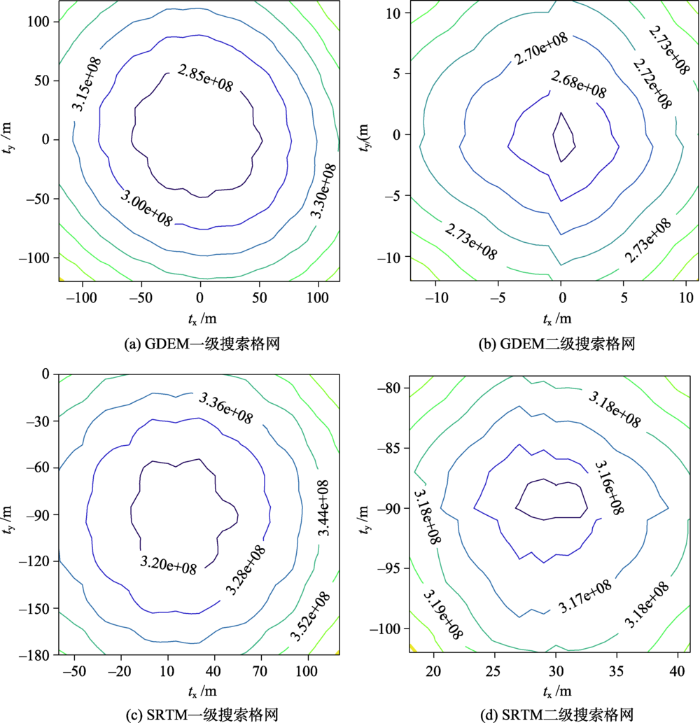
基于河流线对等线状地貌特征的地理配准方法的目标函数难以直接解算,本文采用了多级网格搜索法间接求解。首先,将待搜索的平移参数
图4 GDEM、SRTM的河流线对误差累计和等值线图
Fig. 4 Error accumulation contour of river line pairs of GDEM and SRTM
同其他DEM配准实验相比,Varga等[3]在巴尔干半岛西北部的实验发现,GDEM相对于基准点向北水平偏移48 m、向东12 m,SRTM不存在偏移;Mukherjee等[14]以Cartosat DEM为参照,亦发现在北方向和东方向上,GDEM平移60 m和40 m,SRTM平移250 m和200 m。2种DEM在本地区的水平偏移都比较小。
(2)河流线对等线状地貌较之河流交叉点在地理配准中的优势
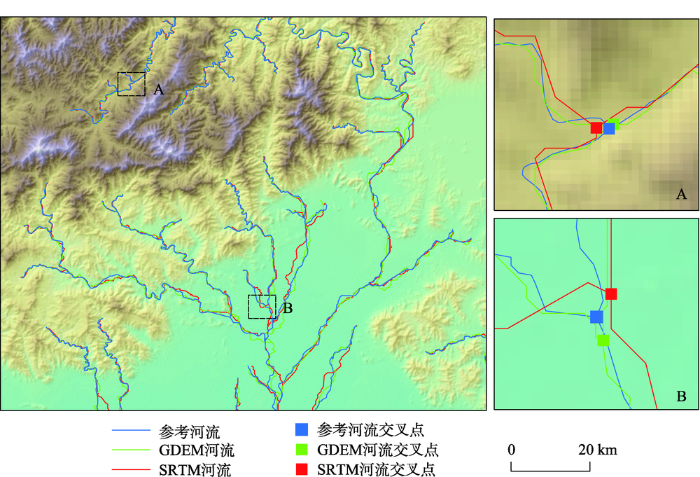
表1以河流线对和河流交叉点分别作为控制点对GDEM和SRTM进行地理配准,计算配准后所有河流交叉点到地形图河流交叉点之间的平均距离。结果表明,采用河流线对法, SRTM水平精度提高约30 m,GDEM精度较高、没有大幅提升;传统的基于河流交叉点的DEM配准结果水平精度较配准前反而下降,这是由于配准方法精度依赖于所选控制点的质量和空间分布位置。受DEM高程误差的影响,GDEM、SRTM和地形图上的河流交叉点之间存在着程度不一的水平偏差,存在较多的粗差点,尤其是在平原地区,无论是河流还是交叉点偏移更为严重(图5),这导致研究区内水平精度较高的河流交叉点数量较少,且分布不均匀,无法保证DEM的整体配准精度。而河流线对法能够引入大量的同名线状地貌,降低了个别粗差点对配准结果的影响,能够显著地提高DEM的地理配准精度。
表1 DEM配准前后的河流交叉点的距离
Tab. 1 Average distances between pour points before and after geo-referencing
| DEM类型 | 配准前/m | 配准后/m | ||||||||
|---|---|---|---|---|---|---|---|---|---|---|
| 河流线对法 | 交叉点法 | |||||||||
| 总体 | 山区 | 平原 | 总体 | 山区 | 平原 | 总体 | 山区 | 平原 | ||
| GDEM | 129.05 | 104.31 | 203.97 | 129.02 | 104.27 | 203.96 | 160.18 | 103.21 | 236.81 | |
| SRTM | 161.28 | 129.17 | 197.11 | 137.93 | 107.05 | 194.71 | 168.45 | 132.05 | 202.71 | |
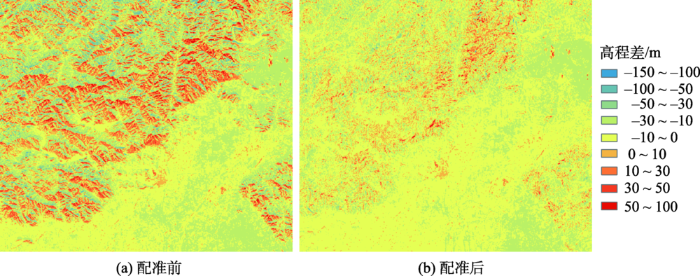
(3)GDEM与SRTM在配准前后的高程差变化
利用河流线对法实现DEM的地理配准后,将GDEM与SRTM逐像元做差,得到高程互差结果(图6)。从图中可以看出,配准前后的DEM高程差图在空间分布上具有明显的差异:配准前DEM高程互差值波动幅度大,波及范围也非常广,尤其在地形复杂的山区,由于高程起伏变化剧烈,2个DEM的水平位置差异对高程值影响表现的异常显著;而配准后的DEM高程互差值变化幅度和分布范围明显减小,因水平位置偏差变小,两者高程值趋向吻合,不但平原地区高程差变化变小,山区也显著降低,但仍大于平原地区。
(1)DEM值随不同类型地貌单元的变化特征
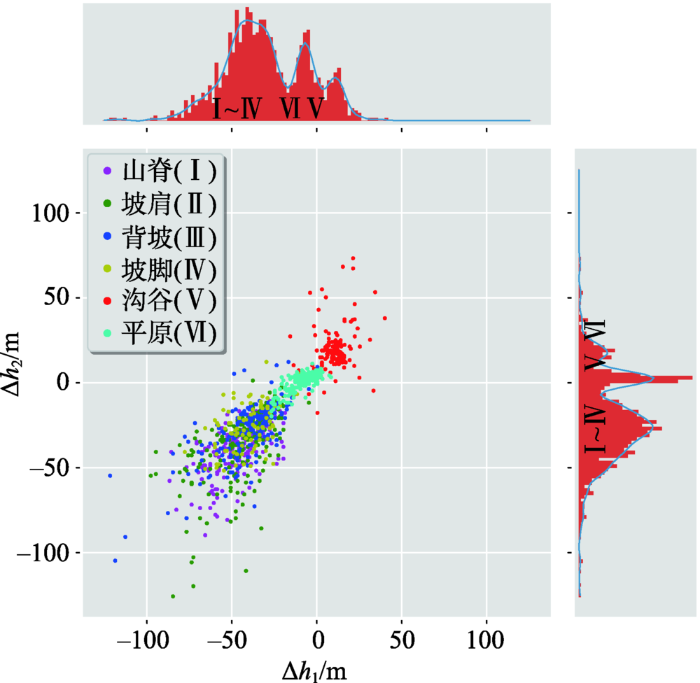
研究区1100个高程样本点分属6种地貌单元,分别统计GDEM、SRTM与这些高程样本点的高程差,绘制高程差散点图、直方图,并采用核密度函数获得核密度平滑曲线,如图7所示。其中,
图7 GDEM、SRTM与高程样本点的高程差散点分类图
Fig. 7 Classification of sample points by scatter plots
组1为山脊(I)、坡肩(II)、背坡(III)和坡脚(IV),4种地貌的高程差绝大多数呈现为负值,表明GDEM、SRTM所测高程均低于实际高程值;组2为沟谷地貌(V),GDEM、SRTM所测高程值均偏高;组3为平原地貌(VI),SRTM高程误差比较低、GDEM所测高程整体偏低。GDEM和SRTM的高程差直方图呈现3个峰值,主要由 I-IV、VI和V共3类点组成。不同地貌单元对应的数字编号见表2。
表2 不同地貌单元的DEM高程差中位数
Tab. 2 Median of DEM elevation differences in landform units
| 高程差 中位数/m | 山脊 (I) | 坡肩 (II) | 背坡 (III) | 坡脚 (IV) | 沟谷 (V) | 平原 (VI) |
|---|---|---|---|---|---|---|
| GDEM | -42.68 | -40.68 | -38.68 | -39.84 | 9.68 | -8.68 |
| SRTM | -35.18 | -31.34 | -25.68 | -26.68 | 15.68 | 0.32 |
统计GDEM、SRTM在不同地貌单元的高程差中位数(表2)。其中,GDEM在I-IV地区位于 -42.68~-39.84 m,SRTM位于-35.18~-26.68 m;GDEM和SRTM在V地区的高程差中位数为9.68 m和15.68 m;在VI地区GDEM偏低8.68 m、SRTM仅稍高参考高程0.32 m。GDEM和SRTM在山谷的高程值都明显偏高,除了DEM数据采集方式以及生产方法,可能还受到如下影响:① 通常山谷形状狭窄、呈长条状,尤其是V型山谷,DEM与地形图只要存在稍微水平偏移,谷底样本点的采样高程就有较大变化;② 山谷一般湿度较大、温度较高,利于树木等植被生长,DEM高程测量受到了植被影响。
与其他实验数据相比,Hu等[13]在湖北地区的实验表明,发现SRTM与GDEM与在平原地区的高程差均值分别为2.6 m和2.9 m,在丘陵地区高程差均值为2.6 m和-0.4 m,在山区高程差均值为1.1 m和4.7 m。Zhao等[4]也发现在黄土高原区域GDEM和SRTM高程均值分别低于控制点高程均值0.25 m和0.75 m;在华北平原GDEM、SRTM高程均值分别比控制点高程均值低6.49 m和1.59 m。由此看出,2种DEM高程的变化在不同地区呈现不同的特征,应用需要视研究区的实际情况而定。
(2)地貌过渡区边界的确定
利用分属三大类地貌单元的1100个高程样本点,以两种DEM高程为自变量、以样本点实际高程为因变量,构建线性回归模型,通过最小二乘法获得回归方程的系数(表3)。表3中
表3 融合DEM的回归方程参数
Tab. 3 Regression equation parameters of fused DEM
| 地貌分类 | |||
|---|---|---|---|
| 组1(I-IV) | 28.6760 | 0.4984 | 0.5277 |
| 组2(V) | -8.4269 | 0.6537 | 0.3269 |
| 组3(VI) | 0.7575 | 0.3109 | 0.7557 |
研究区的地貌过渡区存在3种情况:组1(I-IV)与组2(V)、组1与组3(VI)、组2(V)与组3(VI)。本文采用网格搜索法遍历求解地貌边界线两侧的最优宽度值
表4 高程缓冲区宽度(m)
Tab. 4 Buffer size nearby landform boundaries
| 高程缓冲区(A-B) | A侧缓冲宽度b1 | B侧缓冲宽度b2 |
|---|---|---|
| 组1-组2 | 90 | 0 |
| 组1-组3 | 390 | 510 |
| 组2-组3 | 0 | 60 |
面向地貌缓冲区的高程融合处理,实现了高程预测值在2种地貌之间的平滑过渡。表4中组3为沟谷地貌(V),不存在缓冲范围,这是因为沟谷呈狭窄的条状分布,宽度仅有1~2个像元。山区与平原的交界处的缓冲范围最为明显,平原侧缓冲范围约17个像元,大于山区侧的13个像元。
(3)融合DEM的精度评估
DEM之间的高程精度对比,是以地形图的高程采样点作为参照数据的。利用地理配准后的单一数据源与参考高程做回归获得的校正后的高程值,与2种数据源融合后的DEM进行对比,并统计1100个样本点的DEM高程值与高程参考值的均方根误差、高程差均值以及高程平均绝对值误差,分别获得表5-7。无论是均方根误差、高程差均值还是平均绝对值误差,2种数据源融合后的DEM在各类地貌单元的误差指标都显著小于融合前的GDEM和SRTM,也明显小于回归后的单一数据源。其中,利用单一数据源得到的DEM总体精度较融合前的GDEM和SRTM有显著提升,但在各地貌单元的精度波动很大,这间接说明了地貌特征对两种DEM高程值的影响,并且其高程差均值在全区优于融合后DEM,这是将各地貌单元正负误差相抵消的缘故,实际上融合后DEM误差在各地貌单元均大幅小于单一数据源。融合前的SRTM与GDEM在山坡和沟谷的高程精度远低于平原区的高程精度,但二者融合后的DEM在各地貌单元的高程精度彼此基本相当。
表5 DEM均方根误差(m)
Tab. 5 RMSE of DEMs
| DEM 类型 | 整个 地区 | 地貌分组1 (I-IV) | 地貌分组2(V) | 地貌分组3(VI) | |
|---|---|---|---|---|---|
| 融合前 | GDEM | 40.89 | 44.96 | 19.35 | 13.84 |
| SRTM | 34.64 | 38.64 | 26.65 | 7.59 | |
| 回归后 | GDEM | 18.38 | 17.13 | 45.01 | 10.39 |
| SRTM | 20.44 | 19.15 | 51.94 | 8.43 | |
| 融合后 | GDEM+SRTM | 14.74 | 16.25 | 17.69 | 7.54 |
表6 DEM高程差均值(m)
Tab. 6 Mean of the differences between DEMs and referenced samples
| DEM 类型 | 整个 地区 | 地貌分组1 (I-IV) | 地貌分组2 (V) | 地貌分组3 (VI) | |
|---|---|---|---|---|---|
| 融合前 | GDEM | -35.33 | -42.28 | 10.05 | -10.76 |
| SRTM | -26.73 | -34.38 | 17.68 | -1.29 | |
| 回归后 | GDEM | -0.57 | -4.38 | 37.57 | 6.58 |
| SRTM | -0.94 | -5.12 | 43.52 | 6.28 | |
| 融合后 | GDEM+SRTM | -1.56 | -1.67 | 1.75 | -0.87 |
表7 DEM高程平均绝对值误差(m)
Tab. 7 Mean absolute error of DEMs and referenced samples
| DEM 类型 | 整个 地区 | 地貌分组1 (I-IV) | 地貌分组2(V) | 地貌分组3(VI) | |
|---|---|---|---|---|---|
| 融合前 | GDEM | 36.26 | 42.35 | 13.97 | 9.28 |
| SRTM | 28.62 | 33.49 | 21.14 | 4.04 | |
| 回归后 | GDEM | 13.75 | 13.39 | 38.64 | 9.07 |
| SRTM | 14.23 | 14.26 | 44.22 | 7.68 | |
| 融合后 | GDEM+SRTM | 10.19 | 11.32 | 12.24 | 3.91 |
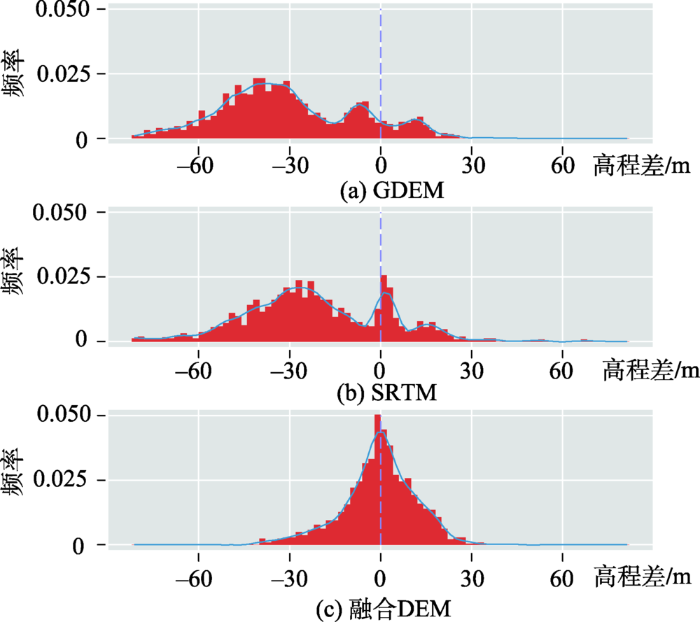
对融合前的GDEM、SRTM和融合后的DEM做高程差指标的直方图(图8),统计结果显示GDEM和SRTM的高程差直方图呈现3个峰值且图形不对称,依次对应着3个地貌分组大类,而融合后DEM的高程差直方图呈现沿零值对称的正态分布,高程差均值仅为-1.56 m,标准差为12.16 m。这说明本文提出的DEM融合方法,有效地剔除了地貌特征对DEM的影响。
图8 DEM高程差直方图
Fig. 8 Histogram of the differences between DEM and referenced samples
将样本点按其实测高程值降序排列并依次编号,依次绘制出样本点在GDEM、SRTM和融合DEM上的高程折线图(图9)。从图9可看出,SRTM与GDEM高程值整体上低于实测高程值,随着地表高程的增加,SRTM与GDEM的高程误差逐渐增大,二者在低海拔地区的高程精度均优于高海拔地区。相比而言,融合DEM高程值紧紧围绕着参考高程值小幅度地上下波动,其精度明显优于融合前的GDEM与SRTM。
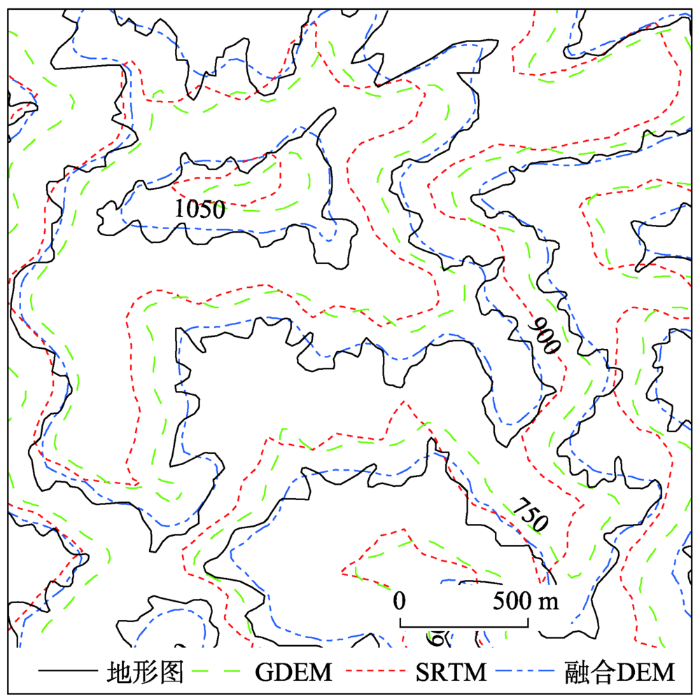
将1:5万地形图数字化的等高线作为实际地形的等高线,并提取融合前后DEM的等高线,选取局部地区进行放大,以更好地显示对比效果。由图10可以看出,配准后的GDEM和SRTM在山峰山脊等处所测高程偏低,在山谷地区所测高程偏高,这说明两种DEM数据的精度受到了地貌特征的影响,而融合后DEM的高程在山峰山脊等处得到了升高,在山谷地区得到了降低,融合DEM与地形图等高线之间的差距大幅减小,表明地貌特征对DEM高程造成的误差得到了相应的改正。此外,融合DEM相当于1:25万地形数据、其等高线较为平滑,用于验证的1:5万地形图等高线细节更为明显,但是二者趋势基本一致,后者的波动变化总是围绕着前者,说明融合后DEM的高程精度是可靠的。
图10 融合前后的DEM等高线套和效果图(局部)
Fig. 10 The contours of DEM before and after fusion in local area
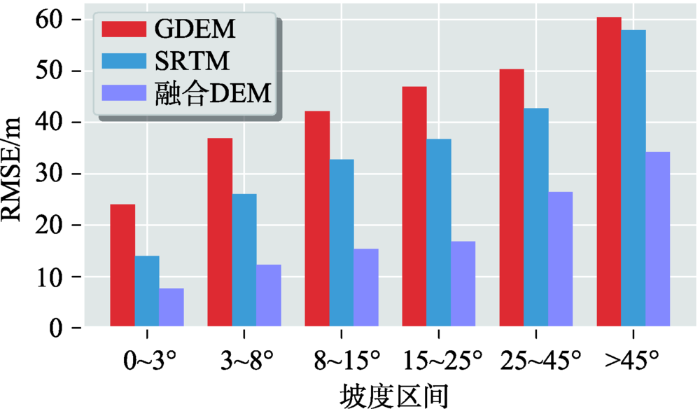
对GDEM、SRTM和融合后的DEM提取坡度并进行重分类,以高程样本点为参照,分别计算不同坡度区间中GDEM、SRTM和融合DEM的高程均方根误差,结果如图11所示[29]。从图11可看出,在各坡度区间中都是GDEM精度最差,融合DEM精度最优,SRTM居中。3种DEM的RMSE值均随着坡度的增大而增大,整体上与坡度呈正相关。融合DEM的RMSE值在各坡度区间均低于GDEM和SRTM,且增加趋势较为平稳,说明坡度对DEM高程精度的影响在融合后得到了降低。
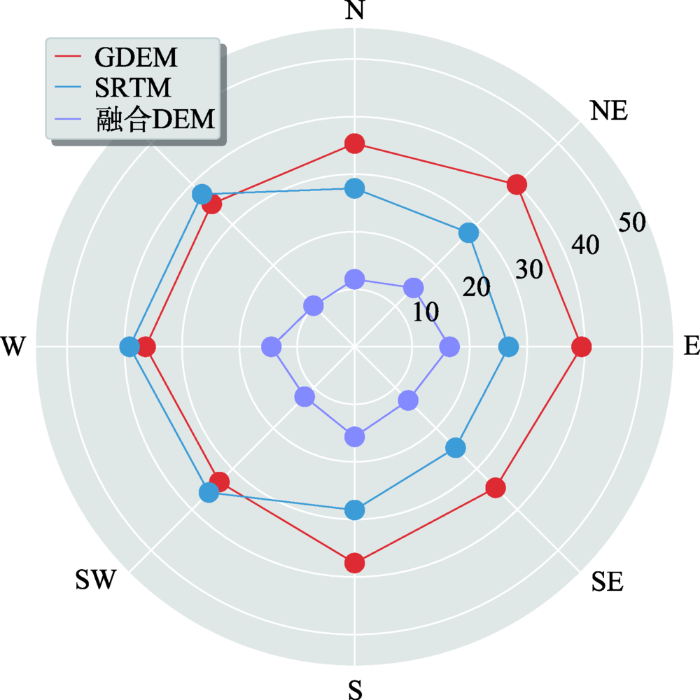
不同坡向范围下的GDEM、SRTM、融合DEM与高程样本点之间的RMSE值如图12所示。在北坡、东北坡、东坡、东南坡和南坡,GDEM高程精度明显低于SRTM;在西南坡、西坡和西北坡,GDEM与SRTM高程精度相近,GDEM略优于SRTM;在8个不同坡向下,融合后的DEM高程精度得到了显著提高,其中北坡、西北坡、西坡和西南坡,融合后DEM较融合前精度提升最为明显。GDEM和SRTM的RMSE取值波动较大,范围约为24~40 m,融合后的DEM精度受坡向影响较小,RMSE取值在各方向表现稳定,约在10~16 m范围内变化。
ASTER GDEM与SRTM在不同地区受地形、地貌以及植被的影响,DEM在水平和高程两方面都存在着程度不一的误差。本文采用线状地貌特征(河流线对)替代传统的同名点(河流交叉点)进行地理配准,消除了个别粗差点的影响,大幅度地提高了DEM地理配准精度;更重要的是,基于地貌单元的高程融合方法不但剔除了不同地貌类型对高程的影响,而且提出适合地貌过渡区的高程融合优化算法,实现了融合后的高程在不同地貌单元之间的平滑过渡。同1:5万地形图样本数据比较,结果表明在研究区内,GDEM向北偏移1 m,SRTM向西偏移30 m并向北偏移90 m。地理配准后的DEM融合结果,其高程差整体上呈正态分布,消除了地貌单元之间的差异,整体精度相对于GDEM和SRTM分别提高63.95%、57.45%。
GDEM与SRTM数据质量不但受地貌因素影响,还受地表植被、地形(坡度、坡向)的影响。此外,GDEM与SRTM数据分别采用立体像对和 InSAR方法获取,数据获取方法、处理过程、遥感设备特性等因素会对DEM数据精度产生重要影响[30],如遥感平台飞行方向、传感器成像角度与山脉走向之间的角度是否会造成2种DEM产生高程差异。这些因素对DEM质量和DEM数据融合的影响还有待深入研究。
The authors have declared that no competing interests exist.
| [1] |
SRTM 3与ASTER GDEM数据处理及应用进展 [J].
从SRTM 3与ASTER GDEM的版本演化、质量评价、插补方法和数据应用现状等方面系统介绍了两种重要地形数据源。SRTM 3从2003年6月公开发布至今共4个重要版本,ASTER GDEM自2009年6月公开发布至今共两个重要版本;考虑数据源和数据处理技术,并辅以等高线分析、地形属性可视化、地形属性频率直方图分析等技术,认为SRTM 3和ASTER GDEM数据质量较高,在许多领域的应用中SRTM 3优于1∶25万地形图、ASTERGDEM则堪比1∶5万地形图数据。目前,SRTM 3与ASTER GDEM数据空洞及异常区域插补方法可以相互借鉴,其方法主要有两种:一是利用空缺区域周围数据直接插值;二是借助辅助数据填补空缺区域,并对接边处平滑处理。SRTM 3与ASTER GDEM目前已成功应用于水文学、工程开发、地质与灾害评估等诸多领域,提出了对两种数据进一步研究的工作展望。
Data processing and application progress of SRTM 3 and ASTER GDEM [J].
从SRTM 3与ASTER GDEM的版本演化、质量评价、插补方法和数据应用现状等方面系统介绍了两种重要地形数据源。SRTM 3从2003年6月公开发布至今共4个重要版本,ASTER GDEM自2009年6月公开发布至今共两个重要版本;考虑数据源和数据处理技术,并辅以等高线分析、地形属性可视化、地形属性频率直方图分析等技术,认为SRTM 3和ASTER GDEM数据质量较高,在许多领域的应用中SRTM 3优于1∶25万地形图、ASTERGDEM则堪比1∶5万地形图数据。目前,SRTM 3与ASTER GDEM数据空洞及异常区域插补方法可以相互借鉴,其方法主要有两种:一是利用空缺区域周围数据直接插值;二是借助辅助数据填补空缺区域,并对接边处平滑处理。SRTM 3与ASTER GDEM目前已成功应用于水文学、工程开发、地质与灾害评估等诸多领域,提出了对两种数据进一步研究的工作展望。
|
| [2] |
Applications of shuttle radar topography mission elevation data [J].https://doi.org/10.1111/j.1749-8198.2008.00154.x URL [本文引用: 1] 摘要
The Shuttle Radar Topography Mission (SRTM) was flown in February 2000 and collected the first ever high-resolution near-global digital elevation data. The final SRTM data have become widely available at 1 arc-second resolution for the United States and 3 arc-second resolution for other areas. This article reviews the background of the SRTM mission, the data quality characteristics of the SRTM elevation data, and the many applications of SRTM elevation data that have emerged in recent years, including forest ecology, volcanology, glaciology, geomorphology, and hydrology. SRTM data have been particularly useful for areas where previously limited topographic data were available, but results from STRM data also compare reasonably well with those obtained from other high-resolution digital elevation models.
|
| [3] |
Accuracy validation and comparison of global digital elevation models over Croatia [J].https://doi.org/10.1080/01431161.2014.994720 URL [本文引用: 2] 摘要
Accuracy assessment of digital elevation models (DEMs) plays an important role in facing their use in geoscience applications. This study investigates the vertical accuracy of most recently published versions of global DEMs over Croatia: 1 arc-minute global relief model (ETOPO1), Global 30 Arc-Second Elevation (GTOPO30), SRTM30+, Global Multi-resolution Terrain Elevation Data 2010 (GMTED2010), Altimeter Corrected Elevations 2 DEM (ACE2 DEM), Shuttle Radar Topography Mission GDEM (SRTM GDEM), and Advanced Spaceborne Thermal Emission and Reflection GDEM (ASTER GDEM). Geodetic ground control points (benchmarks) allowed the comparison in terms of vertical accuracy. Additionally, the differences between models in the identical points were determined and analysed after adjusting the models to the same resolution. The results have yielded information about the overall accuracy of models; the accuracy depending on height, land cover, and slope; presence of large and systematic errors; and mutual agreement between the models. Overall vertical accuracies according to the root mean square error over Croatia are: ETOPO1 27.602m, GTOPO30 21.602m, SRTM30+ 21.302m, GMTED2010 7.402m, ACE2 DEM 4.502m, SRTM GDEM 3.802m, and ASTER GDEM 7.102m. The highest accuracy was shown by SRTM GDEM version 3, which is far better than the previously released versions. All models have proved to be worse in the rough and forest areas, whereas in flat and barelands, new-generation global DEMs SRTM GDEM, and ASTER GDEM are highly accurate.
|
| [4] |
Accuracy assessment of the ASTER GDEM and SRTM3 DEM: An example in the Loess Plateau and North China Plain of China [J].https://doi.org/10.1080/01431161.2010.532176 URL [本文引用: 3] 摘要
The digital elevation model (DEM) produced by the Shuttle Radar Topographic Mission (SRTM) has provided important fundamental data for topographic analysis in many fields. The recently released global digital elevation model (GDEM) produced by the Advanced Spaceborne Thermal Emission and Reflection Radiometer (ASTER) has higher spatial resolution and wider coverage than the SRTM3 DEM, and thus may be of more value to researchers. Taking two typical study areas—the Loess Plateau and the North China Plain of China—as an example, this article assesses the accuracy of the SRTM3 DEM and ASTER GDEM by collecting ground control points from topographical maps. It is found that both the SRTM3 DEM and the ASTER GDEM are far more accurate for the North China Plain than for the Loess Plateau. For the Loess Plateau, the accuracy of the ASTER GDEM is similar to that of the SRTM3 DEM; whereas for the North China Plain, it is much worse than that of the SRTM3 DEM. Considering the negative bias of the ASTER GDEM for flat or gentle regions, we improve its accuracy by adding the difference of the mean value between the SRTM3 DEM and ASTER GDEM for the North China Plain; then, the root mean square error (RMSE) of ±7.9502m from the original ASTER GDEM is improved to ±5.26 m, which demonstrates that it is a simple but useful way to improve the accuracy of the ASTER GDEM in flat or gentle regions.
|
| [5] |
中国区域SRTM DEM与ASTER GDEM误差空间分布特征 [J].https://doi.org/10.3969/j.issn.1672-0504.2017.04.005 URL [本文引用: 1] 摘要
SRTM DEM和ASTER GDEM数据作为目前全球最完整的高精度地形数据,自发布以来,就一直是全球范围内应用最为广泛的DEM数据,其精度评价问题也是历来研究的焦点.但目前研究多集中在中小区域或典型地形区,且多以DEM高程数据精度分析为主,缺乏误差空间分布规律的探究.该文以中国大陆为研究区域,以GLA14点数据为参考高程,研究两类DEM的误差统计特征和空间分布特征.研究表明:SRTM DEM和ASTERGDEM在我国的精度稍优于标称精度,但整体上存在约1m的系统性误差;SRTM DEM误差在平坦区域呈菱形分布,而在地势复杂区域,误差与地形具有较强的相关性;ASTER GDEM误差呈明显的条带状分布且误差正负值间隔分布,条带方向为东北-西南方向,与SRTM DEM相比,ASTER GDEM受地形影响较小.研究结论对两类DEM的应用、融合等研究有着一定的参考价值.
Spatial distribution of SRTM DEM and ASTER GDEM error in China [J].https://doi.org/10.3969/j.issn.1672-0504.2017.04.005 URL [本文引用: 1] 摘要
SRTM DEM和ASTER GDEM数据作为目前全球最完整的高精度地形数据,自发布以来,就一直是全球范围内应用最为广泛的DEM数据,其精度评价问题也是历来研究的焦点.但目前研究多集中在中小区域或典型地形区,且多以DEM高程数据精度分析为主,缺乏误差空间分布规律的探究.该文以中国大陆为研究区域,以GLA14点数据为参考高程,研究两类DEM的误差统计特征和空间分布特征.研究表明:SRTM DEM和ASTERGDEM在我国的精度稍优于标称精度,但整体上存在约1m的系统性误差;SRTM DEM误差在平坦区域呈菱形分布,而在地势复杂区域,误差与地形具有较强的相关性;ASTER GDEM误差呈明显的条带状分布且误差正负值间隔分布,条带方向为东北-西南方向,与SRTM DEM相比,ASTER GDEM受地形影响较小.研究结论对两类DEM的应用、融合等研究有着一定的参考价值.
|
| [6] |
SRTM1 DEM与ASTER GDEM V2数据的对比分析 [J].Analysis and comparison of SRTM1 DEM and ASTER GDEM V2 data [J]. |
| [7] |
ASTER-GDEM与SRTM3数据质量精度对比分析 [J].
<p>ASTER-GDEM是最新的全球数字高程模型,具有较高的分辨率;SRTM3是目前研究人员广泛应用的地形数据。结合实测数据、矢量化地形图,从高程精度、位置精度和坡度因子3方面对比分析两种数据精度。结果表明:ASTER-GDEM数据高程精度低于SRTM3数据,而水平位置精度较高,二者各级坡度百分率近似,与国家1∶5万数字地形图生成的DEM差异较大。</p>
Comparative analysis of the quality and accuracy between ASTER-GDEM and SRTM3 [J].
<p>ASTER-GDEM是最新的全球数字高程模型,具有较高的分辨率;SRTM3是目前研究人员广泛应用的地形数据。结合实测数据、矢量化地形图,从高程精度、位置精度和坡度因子3方面对比分析两种数据精度。结果表明:ASTER-GDEM数据高程精度低于SRTM3数据,而水平位置精度较高,二者各级坡度百分率近似,与国家1∶5万数字地形图生成的DEM差异较大。</p>
|
| [8] |
ASTER GDEM与SRTM3高程差异影响因素分析 [J].
作为最新发布的全球地形数据,ASTER GDEM比目前常用的SRTM3数据有着更高的分辨率和更广的覆盖范围,对于相关地学分析具有重要意义。本文以华中地区为研究区域,对ASTER GDEM与SRTM3数据进行了比较,重点分析了坡度、坡向、地形起伏度、土地利用类型、植被覆盖度、生成ASTER GDEM栅格点高程数据所用的ASTER DEM影像数等因素对2种DEM数据高程差异的影响。结果表明,在研究区域内,ASTER GDEM高程比SRTM3高程平均低5.42 m,两种DEM数据高程差异的RMS值为16.90 m;ASTER GDEM与SRTM3之间的高程差异随着坡度、地形起伏度、植被覆盖度的增大而增大,而ASTER DEM影像数越大,高程差异越小;坡向、土地利用类型对高程差异也有影响。
Analysis of influencing factors on height differences between ASTER GDEM and SRTM3 [J].
作为最新发布的全球地形数据,ASTER GDEM比目前常用的SRTM3数据有着更高的分辨率和更广的覆盖范围,对于相关地学分析具有重要意义。本文以华中地区为研究区域,对ASTER GDEM与SRTM3数据进行了比较,重点分析了坡度、坡向、地形起伏度、土地利用类型、植被覆盖度、生成ASTER GDEM栅格点高程数据所用的ASTER DEM影像数等因素对2种DEM数据高程差异的影响。结果表明,在研究区域内,ASTER GDEM高程比SRTM3高程平均低5.42 m,两种DEM数据高程差异的RMS值为16.90 m;ASTER GDEM与SRTM3之间的高程差异随着坡度、地形起伏度、植被覆盖度的增大而增大,而ASTER DEM影像数越大,高程差异越小;坡向、土地利用类型对高程差异也有影响。
|
| [9] |
Assessing the accuracy of SRTM DEM and ASTER GDEM datasets for the coastal zone of Shandong province, eastern China [J].https://doi.org/10.1515/pomr-2015-0026 URL [本文引用: 1] 摘要
This study assessed the performance of recently released 3 arc second SRTM DEM version 4.1 by CSI-CGIAR and 1 arc second ASTER GDEM version 1 and version 2 by METI-NASA in comparison with ground control points from 1:50000 digital line graphs for the coastal zone of Shandong Province, Easter China. The vertical accuracy of SRTM DEM is 13.74 m root mean square error (RMSE), and GDEM version 1 reaches 24.11 m RMSE. Version 2 of ASTER GDEM shows better performance than version 1 and SRTM DEM with a RMSE of 12.12 m. A strong correlation of the magnitude of elevation error with slope and elevation is identified, with lager error magnitudes in the steeper slopes and higher elevations. Taking into account slope and elevation has the potential to considerably improve the accuracy of the SRTM DEM and GDEM version 1 products. However, this improvement for GDEM version 2 can be negligible due to their limited explanatory power for the DEM elevation errors.
|
| [10] |
Comparison and validation of SRTM and ASTER GDEM for a subtropical landscape in Southeastern China [J].https://doi.org/10.1080/17538947.2013.807307 URL [本文引用: 1] |
| [11] |
SRTM DEM高程精度评价——以陕西省为例 [J].Evaluation of SRTM DEMs' elevation accuracy:A case study in Shaanxi province [J]. |
| [12] |
典型山区SRTM3与ASTER GDEM数据精度对比分析——以青藏高原东麓深切河谷区为例 [J].https://doi.org/10.3724/SP.J.1047.2015.00091 URL Magsci [本文引用: 1] 摘要
<p>目前广泛应用的数字高程模型(DEM)包括SRTM和ASTER GDEM,但在地形影响下,两类数据的误差分布并不均匀。本文选用1:5 万地形图DEM及河流要素作为参照,在青藏高原东麓山区开展实验,分别采用“河流-河谷”位置偏移量与高程中误差来评价两类数据的平面精度与垂直精度,结果表明:(1)实验区内SRTM3 存在向西南方向的水平位置偏移,平均偏移量为127.8 m,ASTER GDEM则以正西方向偏移为主,平均偏移量为104.1 m,该区域ASTER GDEM的总体平面精度较好;(2)SRTM3 数据样本的绝对误差分布相对集中,高程中误差为35.3 m,小于ASTER GDEM样本的高程中误差50.2 m,总体垂直精度优于ASTER GDEM;(3)在平均高程大于4500 m的高海拔区域,两类数据的中误差与高程值正相关,SRTM3 中误差随高程增速较慢,垂直精度较ASTER GDEM高;(4)两组数据垂直精度对坡度有较大依赖性,中误差随坡度近似指数曲线增长,在平缓区域SRTM3 中误差小于ASTER GDEM。本研究为该类数据在山区的选用及误差修正提供依据。</p>
Comparison of the accuracy between SRTM and ASTER GDEM over typical mountain area: a case study in the eastern Qinghai-Tibetan Plateau [J].https://doi.org/10.3724/SP.J.1047.2015.00091 URL Magsci [本文引用: 1] 摘要
<p>目前广泛应用的数字高程模型(DEM)包括SRTM和ASTER GDEM,但在地形影响下,两类数据的误差分布并不均匀。本文选用1:5 万地形图DEM及河流要素作为参照,在青藏高原东麓山区开展实验,分别采用“河流-河谷”位置偏移量与高程中误差来评价两类数据的平面精度与垂直精度,结果表明:(1)实验区内SRTM3 存在向西南方向的水平位置偏移,平均偏移量为127.8 m,ASTER GDEM则以正西方向偏移为主,平均偏移量为104.1 m,该区域ASTER GDEM的总体平面精度较好;(2)SRTM3 数据样本的绝对误差分布相对集中,高程中误差为35.3 m,小于ASTER GDEM样本的高程中误差50.2 m,总体垂直精度优于ASTER GDEM;(3)在平均高程大于4500 m的高海拔区域,两类数据的中误差与高程值正相关,SRTM3 中误差随高程增速较慢,垂直精度较ASTER GDEM高;(4)两组数据垂直精度对坡度有较大依赖性,中误差随坡度近似指数曲线增长,在平缓区域SRTM3 中误差小于ASTER GDEM。本研究为该类数据在山区的选用及误差修正提供依据。</p>
|
| [13] |
Evaluation of recently released open global digital elevation models of Hubei, China [J].https://doi.org/10.3390/rs9030262 URL [本文引用: 1] 摘要
The recent release of worldwide SRTM 1 DEM and AW3D30 adds new members to the open global medium resolution (90 30 m ground spacing) digital elevation models. Together with the previously existing SRTM 3 and ASTER GDEM, their quality is of great interest to various scientific applications. This paper uses 1:50,000 DEM in Hubei Province of China as a reference to assess their vertical accuracy in terms of terrain types, slopes, and land cover. For ASTER GDEM and AW3D30, we further evaluate their accuracy in terms of the stack number, i.e., the number of scenes used to generate the DEM. It is found out that: (1) all of the DEMs have nearly the same horizontal offset due to the adoption of different datums; (2) the vertical accuracy varies in terms of terrain complexity, from ~5 m for plains, ~10 m for hills to ~20 m for mountains; (3) the vertical accuracy is negatively related to the tangent of terrain slope exponentially in forest areas and linearly in cultivated lands; (4) forest areas have the lowest vertical accuracy, comparing to built-up areas, wetland, and cultivate land areas while SRTM 1 and AW3D30 have the highest accuracy in all land cover classes; (5) the large elevation differences over forest areas are likely due to canopy coverage; and (6) for ASTER GDEM and AW3D30, their accuracy is in general positively related to the stack number. This study provides a practically useful quality specification and comprehensive understanding for these four global DEMs, especially the recently released worldwide SRTM 1 DEM and AW3D30.
|
| [14] |
Evaluation of vertical accuracy of open source Digital Elevation Model (DEM) [J].https://doi.org/10.1016/j.jag.2012.09.004 URL [本文引用: 2] 摘要
Digital Elevation Model (DEM) is a quantitative representation of terrain and is important for Earth science and hydrological applications. DEM can be generated using photogrammetry, interferometry, ground and laser surveying and other techniques. Some of the DEMs such as ASTER. SRTM, and GTOPO 30 are freely available open source products. Each DEM contains intrinsic errors due to primary data acquisition technology and processing methodology in relation with a particular terrain and land cover type. The accuracy of these datasets is often unknown and is non-uniform within each dataset. In this study we evaluate open source DEMs (ASTER and SRTM) and their derived attributes using high postings Cartosat DEM and Survey of India (SOI) height information. It was found that representation of terrain characteristics is affected in the coarse postings DEM. The overall vertical accuracy shows RMS error of 12.62 m and 17.76 m for ASTER and SRTM DEM respectively, when compared with Cartosat DEM. The slope and drainage network delineation are also violated. The terrain morphology strongly influences the DEM accuracy. These results can be highly useful for researchers using such products in various modeling exercises. (C) 2012 Elsevier B.V. All rights reserved.
|
| [15] |
Statistical correction of lidar-derived digital elevation models with multispectral airborne imagery in tidal marshes [J].https://doi.org/10.1016/j.rse.2016.09.020 URL [本文引用: 1] 摘要
61RTK-GPS surveys were completed at 17 study sites along Pacific coast.61Airborne lidar root mean squared error ranged from 0.1–0.46m across study sites.61New lidar correction method was described using 1-m multispectral airborne imagery.61The LEAN model reduced lidar elevation RMSE 45–75% across all study sites.61Implications for coastal elevation models and flooding risk assessments
|
| [16] |
|
| [17] |
A geomorphology-based approach for digital elevation model fusion - case study in Danang city, Vietnam [J].https://doi.org/10.5194/esurf-2-403-2014 URL [本文引用: 2] |
| [18] |
Fusion of digital elevation models using sparse representations [C]. |
| [19] |
基于快速傅里叶变换的ASTER与SRTM有效融合研究 [J].https://doi.org/10.6046/gtzyyg.2010.04.05 URL Magsci [本文引用: 1] 摘要
nbsp;为了克服两种向全球开放的、不同数据源(ASTER和SRTM)DEM的获取技术缺陷,以甘肃省东部董志塬某测区为例,研究两种来源DEM的有效融合方案。首先,借助快速傅里叶变换(FFT)将ASTER和SRTM 的DEM数据由空域转换到频域; 然后,分别基于高通和低通滤波器进行滤波处理,并将滤波后的频域相加; 最后,基于FFT逆变换将融合后的频域转换到空域,实现DEM数据的有效融合。误差分析表明: 融合后的DEM最小、最大误差较融合前的均有明显降低,中误差也有降低趋势,误差绝对值大于30 m的网格点数占全部网格数的比例均有所下降。
Efficient fusion of ASTER and SRTM based on fast fourier transform [J].https://doi.org/10.6046/gtzyyg.2010.04.05 URL Magsci [本文引用: 1] 摘要
nbsp;为了克服两种向全球开放的、不同数据源(ASTER和SRTM)DEM的获取技术缺陷,以甘肃省东部董志塬某测区为例,研究两种来源DEM的有效融合方案。首先,借助快速傅里叶变换(FFT)将ASTER和SRTM 的DEM数据由空域转换到频域; 然后,分别基于高通和低通滤波器进行滤波处理,并将滤波后的频域相加; 最后,基于FFT逆变换将融合后的频域转换到空域,实现DEM数据的有效融合。误差分析表明: 融合后的DEM最小、最大误差较融合前的均有明显降低,中误差也有降低趋势,误差绝对值大于30 m的网格点数占全部网格数的比例均有所下降。
|
| [20] |
The influence of land cover on Shuttle Radar Topography Mission (SRTM) elevations in low-relief areas [J].https://doi.org/10.1111/j.1467-9671.2010.01217.x URL [本文引用: 1] 摘要
The Shuttle Radar Topography Mission (SRTM), the first relatively high spatial resolution near-global digital elevation dataset, possesses great utility for a wide array of environmental applications worldwide. This article concerns the accuracy of SRTM in low-relief areas with heterogeneous vegetation cover. Three questions were addressed about low-relief SRTM topographic representation: to what extent are errors spatially autocorrelated, and how should this influence sample design? Is spatial resolution or production method more important for explaining elevation differences? How dominant is the association of vegetation cover with SRTM elevation error? Two low-relief sites in Louisiana, USA, were analyzed to determine the nature and impact of SRTM error in such areas. Light detection and ranging (LiDAR) data were employed as reference, and SRTM elevations were contrasted with the US National Elevation Dataset (NED). Spatial autocorrelation of errors persisted hundreds of meters spatially in low-relief topography; production method was more critical than spatial resolution, and elevation error due to vegetation canopy effects could actually dominate the SRTM representation of the landscape. Indeed, low-lying, forested, riparian areas may be represented as substantially higher than surrounding agricultural areas, leading to an inverted terrain model.
|
| [21] |
Comparison of DEMS derived from USGS DLG, SRTM, a statewide photogrammetry program, ASTER GDEM and LiDAR: Implications for change detection [J].https://doi.org/10.1080/15481603.2015.1019708 URL [本文引用: 1] 摘要
Many digital elevation models (DEMs) now exist, enabling quantitative assessments of topographic change through DEM subtraction. However, many of these DEMs are inherently different 090009 their source data, preprocessing, and interpolation procedures introduce varying amounts of error, which are partially correlated with the local topographic situation (e.g. slope, aspect, and elevation of any given location). Understanding of these differences and potential errors is necessary prior to change detection analysis in order to incorporate the inherent uncertainties into the analysis of topographic change. This study evaluated available DEMs in the Mud 7.5090005 United States Geological Survey (USGS) topographic quadrangle in West Virginia, USA. We compare DEMs derived from the USGS digital line graphs (DLGs), the Shuttle Radar Topography Mission (SRTM), a statewide photogrammetric DEM, and the Advanced Spaceborne Thermal Emission and Reflection (ASTER) Global DEM v2, to a LiDAR DEM. Using the LiDAR data as a reference (RMSE 0.12 m), the USGS DLG and the SAMB showed low RMSE, while the SRTM and GDEM exhibited high RMSE and a systematic negative bias.
|
| [22] |
Accuracy assessment of SRTM v4 and ASTER GDEM v2 over the Altiplano watershed using ICESat/GLAS data [J].https://doi.org/10.1080/01431161.2014.999166 URL [本文引用: 1] 摘要
The new Global Digital Elevation Model (GDEM v2) has been available since 17 October 2011. With a resolution of approximately 3002m, this model should provide more accurate information than the latest version of Shuttle Radar Topographic Mission (SRTM v4) with a resolution of 9002m outside of the USA. The accuracies of these two recently released digital elevation models (DEMs) were assessed over the Altiplano watershed in South America using ICESat/GLAS data (Ice, Cloud and Land Elevation Satellite/Geoscience Laser Altimeter System). On the global scale, GDEM v2 is more accurate than SRTM v4, which presents a negative bias of approximately 8.802m. Strong correlations between the DEMs’ accuracies and mean slope values occurred. Regarding land cover, SRTM v4 could be more accurate or easier to correct on a smaller scale than GDEM v2. Finally, a merged and corrected DEM that considers all of these observations was built to provide more accurate information for this region. The new model featured lower absolute mean errors, standard deviations, and root mean square errors relative to SRTM v4 or GDEM v2.
|
| [23] |
Comparison and validation of the recent freely available ASTER-GDEM ver1, SRTM ver4.1 and GEODATA DEM-9S ver3 digital elevation models over Australia [J].https://doi.org/10.1080/08120091003677553 URL [本文引用: 1] 摘要
This study investigates the quality (in terms of elevation accuracy and systematic errors) of three recent publicly available elevation model datasets over Australia: (i) the 9 arc second national GEODATA DEM-9S ver3 from Geoscience Australia and the Australian National University; (ii) the 3 arc second SRTM ver4.1 from CGIAR-CSI; and (iii) the 1 arc second ASTER-GDEM ver1 from NASA/METI. The main features of these datasets are reported from a geodetic point of view. Comparison at about 1 billion locations identifies artefacts (e.g. residual cloud patterns and stripe effects) in ASTER. For DEM-9S, the comparisons against the space-collected SRTM and ASTER models demonstrate that signal omission (due to the 090804270 m spacing) may cause errors of the order of 100090009200 m in some rugged areas of Australia. Based on a set of geodetic ground control points over Western Australia, the vertical accuracy of DEM-9S is 0908049 m, SRTM 0908046 m and ASTER 09080415 m. However, these values vary as a function of the terrain type and shape. Thus, CGIAR-CSI SRTM ver4.1 may represent a viable alternative to DEM-9S for some applications. While ASTER GDEM has an unprecedented horizontal resolution of 09080430 m, systematic errors present in this research-grade version of the ASTER GDEM ver1 will impede its immediate use for some applications.
|
| [24] |
Improving quality of public domain digital elevation models through data fusion [J].https://doi.org/10.1016/j.biosystemseng.2008.09.010 URL [本文引用: 1] 摘要
Digital Elevation Model (DEM) fusion was investigated for improving the overall accuracy of DEMs. The approach was applied to two public domain products: Shuttle Radar Topographic Mission (SRTM) DEM and Advanced Spaceborne Thermal Emission and Reflection (ASTER) DEM. The ASTER relative DEM was co-registered to the SRTM co-ordinates and converted to an absolute DEM by shifting the histogram to the average elevation of the SRTM DEM. The voids in the DEMs were filled through an erosion technique using the slope and aspect from the other DEM and the elevation of surrounding pixels. Finally, the DEMs were converted to the frequency domain and an ideal low-pass filter with a cut-off frequency of 0.024 m 1 was applied to the ASTER DEM and a high-pass filter with the same cut-off frequency was applied to the SRTM DEM to filter out errors in the respective frequency ranges. The filtered DEM spectra were then summed in the frequency domain before being converted back to the spatial domain. This approach was tested in a 6000 ha test site with fairly complex topography located in the central region of Nepal. The fused DEM had a 42% improvement in Root Mean Squared Error (RMSE). The approach showed promise for improving DEM accuracy and completeness while maintaining the highest resolution of the input DEMs. This approach increased the reliability and applicability of public domain DEMs produced by Optical and Radar remote sensing technologies.
|
| [25] |
Accuracy assessment of GDEM, SRTM, and DLR-SRTM in Northeastern China [J].https://doi.org/10.1080/10106049.2014.883434 URL [本文引用: 2] 摘要
This work provides an overview of various methods for estimating snow cover and properties in high mountains using remote sensing techniques involving microwaves. Satellite-based remote sensing with its characteristics such as synoptic view, repetitive coverage and uniformity over large areas has great potential for identifying the temporal snow cover. Many sensors have been used in the past with various algorithms and accuracies for this purpose. These methods have been improving with the use of Synthetic Aperture Radar sensors, working in different microwave frequencies, polarisation and acquisition modes. The limitations, advantages and drawbacks are illustrated while error sources and strategies on how to ease their impacts are also reviewed. An extensive list of references, with an emphasis on studies since 1990s, allows the reader to delve into specific topics.
|
| [26] |
|
| [27] |
|
| [28] |
Mapping soil organic matter in small low-relief catchments using fuzzy slope position information [J].https://doi.org/10.1016/j.geoderma.2011.06.006 URL [本文引用: 1] 摘要
78 Fuzzy slope position information was used to direct purposive sampling. 78 Thus the typical values of soil organic matter (SOM) over an area were determined. 78 SOM was mapped using a combination of fuzzy slope positions and typical SOM values. 78 A multiple linear regression model with 48 modeling points was used as a reference. 78 Results show that SOM map with 5 modeling points in this way performs better.
|
| [29] |
坡度分级对地面坡谱的影响研究 [J].
地面坡度是最重要的地形定量指标之一,建立科学合理的地面坡度分级体系对坡度进行科学研究具有重要的意义。总结了近些年在坡度分级研究方面的已有成果,利用高精度1∶10000 DEM数据为信息源,提取了不同分级的坡谱,研究了不同分级方法及等差分级的不同级差对地面坡谱的影响。结果表明:不同的坡度分级法可以获得不同的地面坡谱表达;自定义分级法得到的坡谱对具体的应用有实际指导意义,模式分级法可以更好地表达地表形态;3°等差分级的坡谱在实际研究中更具适用性。
Influence of slope classification on slope spectrum [J].
地面坡度是最重要的地形定量指标之一,建立科学合理的地面坡度分级体系对坡度进行科学研究具有重要的意义。总结了近些年在坡度分级研究方面的已有成果,利用高精度1∶10000 DEM数据为信息源,提取了不同分级的坡谱,研究了不同分级方法及等差分级的不同级差对地面坡谱的影响。结果表明:不同的坡度分级法可以获得不同的地面坡谱表达;自定义分级法得到的坡谱对具体的应用有实际指导意义,模式分级法可以更好地表达地表形态;3°等差分级的坡谱在实际研究中更具适用性。
|
| [30] |
|

/
| 〈 |
|
〉 |
