平博 , 孟云闪, 苏奋振
PING Bo, MENG Yunshan, SU Fenzhen
通讯作者:
收稿日期: 2018-07-4
修回日期: 2018-12-10
网络出版日期: 2019-02-20
版权声明: 2019 《地球信息科学学报》编辑部 《地球信息科学学报》编辑部 所有
基金资助:
作者简介:
作者简介:平 博(1986-),男,天津人,博士生,主要从事遥感数据恢复与融合研究。E-mail: pingbo@tju.edu.cn
展开
摘要
对城市热岛效应、植物覆盖指数、叶面积指数等地表参数的高频次高精度反演,能更好地实现基于遥感手段的地表特征动态监测。然而,目前单一数据源的遥感影像还很难实现高时空分辨率数据的同步获取,时空融合技术是解决这个时空分辨率矛盾的有效方法。根据原理不同,时空融合算法可以分为基于线性模型的融合算法、基于光谱解混的融合算法等。高分卫星产品是近几年中国高分辨率对地观测系统重大专项天基系统中的首发星,对于该类数据的时空融合研究仍然较少。因此,本文拟采用4种常见的时空融合算法(STARFM、FSDAF、STDFA、Fit_FC)实现GF-1 WFV数据与MODIS数据的时空融合,分析这几种方法对GF-1 WFV数据时空融合的有效性和精度,从而为后续的研究提供一定依据。
关键词:
Abstract
Observations with high spatial resolution and frequency can better monitor land surface dynamics, such as urban heat island effect monitoring, normalized difference vegetation index, leaf area index assimilation. However, it is still difficult to acquire satellite data with high spatial and temporal resolution from one single satellite sensor. For example, Landsat TM/ETM+/OLI data at 30 m spatial resolution have been widely applied for various applications, however, their 16-day revisit-cycles limit their usage in dynamics monitoring; on the other hand, MODIS data can be widely used in land process monitoring at global or large-scale because of their daily revisit period, but the coarser spatial resolution of MODIS data cannot meet the fine-scale environment applications. The spatio-temporal fusion is an effective way to solve this trade-off problem. The spatio-temporal fusion methods can be grouped into linear model methods (STARFM, ESTARFM), unmixing methods (FSDAF, STDFA) and so on. These methods have been used to support various applications such as leaf area index assimilation, urban heat island effect monitoring, land surface temperature generating, crop types and dynamics mapping, land cover classification, and land surface water mapping. The GF-1 satellite was launched from China's Jiuquan Satellite Launch Center in April 2013. It carries two panchromatic cameras with pixel resolution of 2 m and two multi-spectral cameras with pixel resolutions of 8 m, and four wide-field view (WFV) cameras with 16 m pixel resolution. The WFV sensors capture ground features with four bands that cover the visible and near-infrared wavelength range and the swath width reaches 800 km when the four sensors are combined. The spatio-temporal fusion researches on GF-1 WFV are still insufficient, hence, in this study, we used four spatio-temporal fusion methods including STARFM, FSDAF, STDFA and Fit_FC to blend GF-1 WFV and MODIS data, and then the fusion validation and accuracies were analyzed for further researches.
Keywords:
高精度、多时相的获取地表参数,如归一化植被指数(NDVI)等,能够更好实现地表特征的动态监测。然而,目前单一数据源的遥感影像还很难实现高精度、高频次的同步观测。例如,Landsat TM/ETM+/OLI系列卫星数据的空间分辨率为30 m,然而其16 d的重访周期很难监测地表特征的动态变化,而且受到云、传感器性能等因素的限制,获取同一地区连续无云影像的周期可能会更长;MODIS数据能够实现每天1~2次的重访观测,但其较低的空间分辨率(250~1000 m)很难对中小尺度地物进行检测。时空融合算法能够有效解决这个时空分辨率矛盾问题,其是基于已知时期的高频低分数据(如MODIS数据)与高分低频数据(如Landsat数据)以及预测时期的高频低分数据来模拟预测时期的高分低频数据。
基于线性模型的时空融合是重要的时空融合方法。Gao等[1]首先提出STARFM (the Spatial and Temporal Adaptive Reflectance Fusion Model),其基本原理是通过已知时期和预测时期的高频低分数据得到反射率值的变化,然后将该变化值加到已知时期的高分低频像元,从而得到相应的预测时期高分低频像元值。为了消除混合像元问题,该方法采用邻域相似像元的加权和的方式模拟中心像元的反射值,其权重通过光谱差异、时间差异、距离差异的乘积得到。此后,Hilker等[2]基于STARFM提出STAARCH算法,以此提高土地覆盖变化区域的模拟精度;Zhu等[3]通过加入反转系数,提高了STARFM算法在异质区域的模拟精度。线性模型时空融合算法已经广泛应用于叶面积指数模拟[4],城市热岛效应监测[5]、地表温度反演[6]、植被类型和长势监测[7,8,9]、地表分类[10]、水域监测[11]等。近几年,一些新的线性时空融合方法认为在短时期内两景高频低分数据是线性变化的,其系数可以直接应用于相应的高分低频数据,从而实现预测时期高分低频数据的模拟。2017年,Cheng等[12]提出STNLFFM(the Spatial and Temporal Nonlocal Filter-based Fusion Model),其通过已知时期和预测时期的高频低分数据进行线性模型系数的拟合,然后将系数应用于已知时期高分低频数据,并采用邻域相似像元提高融合算法的精度。Wang和Atkinson[13]提出Fit_FC方法,其主要包括3个步骤:① 基于高频低分数据模拟线性模型系数;② 空间滤波;③ 残差补偿。
此外,基于光谱解混的时空融合算法也能够有效实现高分低频数据的模拟。Zurita-Milla等[14]基于光谱解混方法实现TM和MERIS数据的融合,光谱解混方法首先通过土地覆盖分类数据或图像分类结果计算每一个高频低分数据像元中每一个类别的丰富度,然后基于每一个高频低分数据像元以及其邻域的像元,采用最小二乘方法模拟中心像元中每一个类别的反射率,即高分辨率数据像元的反射率。Gevaert和Garcia-Haro[15]直接对高频低分数据的变化值进行光谱解混,得到每一个类别的变化,继而实现高分数据的模拟。Xie等[16]首先采用光谱解混方法对已知时期和预测时期的高频低分数据进行降尺度,然后基于STARFM算法进行高分低频数据模拟。Wu等[17]提出STDFA (the Spatial Temporal Data Fusion Approach)方法,其基础是相同类别像元的变化是相同的,随后其提出改进的STDFA算法,将空间变化调整和传感器差异调整加入STDFA算法[18]。Zhu等[19]提出FSDAF方法使用光谱解混方法计算每一个类别的变化,并将同质与异质区域的误差分别进行计算,通过同质指数将2个误差进行合并,对变化值进行修正,并采用邻域相似像元的处理方式消除“块效应”。光谱解混方法同样广泛应用于NDVI序列模拟[20,21]、植被监测[22]。
目前,时空融合算法多采用Landsat数据与MODIS、MERIS等数据进行融合,然而对GF-1数据的研究仍然较少。中国于2013年发射了第一颗民用高分辨率卫星高分一号(GF-1),其搭载了2台2 m分辨率全色/8 m分辨率的多光谱相机,4台16 m分辨率宽视场多光谱相机(WFV),其中WFV传感器的幅宽为800 km。理论上,GF-1宽视场相机可实现4 d的重复观测,然而受到云的影响,获取连续2景无云影像的周期会增大。相比于Landsat数据,GF-1数据与MODIS数据的分辨率差异更大,因此时空融合算法对于GF-1数据的融合精度有待探讨。本文采用主流的线性模型时空融合方法(STARFM和Fit_FC)和光谱解混时空融合方法(FSDAF和STDFA)对GF-1数据和MODIS数据进行时空融合,分析各算法的融合精度,为后续基于时序GF-1数据的应用研究提供科学依据。
本文选择2个试验区用于算法的对比。① 第1个试验区位于中国河北省唐山市南部(39.46° N-39.64° N, 118.29° E-118.73° E)大约19.2 km×38.4 km(1200×2400个GF-1像元)的区域,试验区的地貌类型主要是植被,建筑用地,河流湖泊和道路,在MODIS尺度下,可以找到相对同质的像元,因此该试验区可以被认为是同质区域(图1)。2景GF-1 WFV数据分别成像于2016年1月6日和2016年3月23日,相应的8 d合成MODIS数据(MOD09A1)获取时间为2016年1月1日和2016年3月21日,其中 1月6日的GF-1数据和1月1日的MODIS数据分别作为输入的已知高分低频数据以及高频低分数据,3月21日的MODIS数据作为预测时期的高频低分数据用来模拟相应时期的高分数据,并将3月23日的GF-1数据作为标准数据,验证时空融合算法的 精度。② 第2个试验区位于中国天津滨海新区( 38.97° N-39.15° N, 117.27° E-117.71° E )大约为 19.2 km×38.4 km (1200×2400个GF-1像元)的区域,该区域地貌类型复杂,可认为是异质区域(图2)。2景GF-1 WFV数据分别成像于2016年1月6日和2016年4月9日,相应8 d合成MODIS数据(MOD09A1)获取时 间为2016年1月1日和2016年4月6日,其中1月6日的GF-1数据和1月1日的MODIS数据分别作为输入的已知高分低频数据以及高频低分数据,4月6日的MODIS数据作为预测时期的高频低分数据来模拟相应时期的高分数据,并将4月9日的GF-1数据作为标准数据,验证时空融合算法精度。
图1 试验区1的GF-1WFV影像和MODIS影像(河北省唐山市南部)注:上面2景影像分别为2016年1月6日和2016年3月23日的GF-1WFV影像,下面为与其成像时期对应的480 m 分辨率MODIS影像。
Fig. 1 GF-1WFV and MODIS images of experimental site 1 ( Southern Tangshan City, Hebei Province )
图2 试验区2的GF-1WFV影像和MODIS影像(天津滨海新区)注:上面2景影像分别为2016年1月6日和2016年4月9日的GF-1WFV影像,下面为与其成像时期对应的480 m 分辨率MODIS影像。
Fig. 2 GF-1WFV and MODIS images of experimental site 1 (Binhai New Area in Tianjin )
GF-1数据和MODIS数据可以从中国资源卫星应用中心(http://www.cresda.com/CN/)和the NASA EOSDIS Land Processes DAAC, USGS Earth Resources Observation and Science (EROS) Center, Sioux Falls, South Dakota (https://lpdaac.usgs.gov)下载。在进行数据融合之前,需要对数据进行预处理。首先使用ENVI 5.1中的辐射校正,大气纠正模块将GF-1数据转换为反射率;使用MODIS Reprojection Tool (MRT)将MODIS数据转换为UTM 50N/WGS84投影和坐标系,并采用最邻近法重采样为480 m和16 m分辨率,最后裁剪到与GF-1数据相同的试验区域。选择GF-1数据的4个多光谱波段和相应的MODIS波段作为实验波段,具体的波段范围如表1所示。
表1 GF-1 WFV和MODIS波段范围
Tab. 1 The band widths of GF-1 WFV and MODIS
| GF-1 WFV波段范围/μm | MODIS波段范围/μm | |
|---|---|---|
| 蓝波段 | 0.450~0.520 | 0.459~0.479 |
| 绿波段 | 0.520~0.590 | 0.545~0.565 |
| 红波段 | 0.630~0.690 | 0.620~0.670 |
| 近红波段 | 0.770~0.890 | 0.841~0.876 |
STARFM算法认为某一位置的同质像元在高、低分辨率图像上是线性相关的,即:
式中:xi、yj表示某一个同质像元;t0和tk分别为预测时期和已知时期;L、M分别表示高分低频影像和高频低分影像;ε为误差。因此,预测时期高分辨率像元可以由式(2)求得。
然而,由于MODIS数据较低的分辨率,很难满足STARFM算法中同质像元的要求。因此,STARFM算法融入邻域相似像元来提高融合算法的精度,即针对预测时期某一个高分辨率像元,STARFM算法通过式(3)进行模拟。
式中:ω表示局部窗口的大小,本文中选择与文献[1]相同的策略,即3个MODIS像元为窗口的大小,对应90个GF-1 WFV像元;(xω/2, yω/2)表示窗口的中心像元,即要模拟的像元位置;Wijk为相似像元权重;n表示参与模拟的影像数。
相似像元通过式(4)进行判定:
式中:σ为影像的标准差;nc为影像的分类数,本文设定为3类。权重Wijk分别通过已知时期高、低分辨率像元的反射率差异(式(5)),已知时期和预测时期低分辨率像元的反射率差异(式(6))以及相似像元与中心像元的距离(式(7))求得。通过式(8)将 3个指标进行合并,得到最终的权重值。
式中:A为一个常量[1];
FSDAF算法能够较好地对地物类型变化的区域进行预测,其首先基于非监督分类方法对已知时期的高分低频数据进行分类。本文采用K-means非监督分类方法并设定分类数为3类,然后基于式(9)计算每一个高频低分像元中各个类别的丰富度。
式中: f(X,c)为已知时期高频低分像元X中类别c的丰富度;N(X, c)为像元X中属于类别c的高分低频像元的个数;m为高频低分像元X中包含高分低频像元的个数。选择各类别中丰富度最高的D个高频低分像元,本文D为30,求出这些高频低分像元在已知时期和预测时期的差异,继而通过最小二乘法拟合出各个类别高分低频像元反射率的变化值。
由于上述算法能够得到主要类别反射率的变化值,但当地物类型在已知时期与预测时期发生变化时,其无法得到准确预测。因此,FSDAF算法将预测时期的高频低分数据进行三次样条插值,并分析得到同质区域与异质区域的误差,通过同质系数将2种误差合并,以此来修正变化值。
最后,为了消除高低分辨率图像融合产生的“块效应”,算法选择邻域相似像元,根据距离赋予相应的权重值,并基于加权求和的方式得到中心点最终的变化值。将变化值加到已知时期的高分低频数据相应像元,得到最终的结果。具体参见文献[19]。
STDFA算法是一类光谱解混方法。该算法首先基于K-means对已知时期的高分低频影像进行分类,本文设定为3类,并采用式(9)计算每一个高频低分像元中各个类别的丰富度。以某一个高频低分像元为中心确定相应子区域,本文中子区域的大小为11个高频低分像元,通过式(10)计算子区域各个类别的平均反射率值,并将该值赋给中心像元内相应类别的高分低频像元。
式中:t表示预测时期与已知时期t0和tk;
式中:x(c, t0)和x(c, tk)分别表示预测时期与已知时期属于类别c的高分低频像元反射率。
Fit_FC算法基于线性模型进行数据时空融合,其采用已知时期与预测时期低分高频数据拟合线性系数,然后将该系数应用到已知时期相应的高分低频数据,为了消除分辨率差异较大造成的“块效应”,其基于邻域相似像元分别进行拟合值和误差值的空间平滑。以高频低分像元X为中心,确定邻域子区域,子区域大小为5个高频低分像元,并基于已知时期和预测时期的高频低分数据拟合式(12) 中的系数a和b。
将系数a和b应用于已知时期中心像元X对应的高分低频像元,即可得到预测的初始高分低频数据。另外,残差值R能够通过式(13)得到。
为了消除高低分辨率数据融合产生的“块效应”,采用式(14)[13]确定以某一个高分低频像元为中心的邻域相似像元。
式中:nb表示参与计算的波段数;x(tk)和xneigh(tk)表示已知时期高分低频中心像元以及其邻域像元。选择最小的D个高分低频像元作为相似像元,本文D为30,根据与中心像元的归一化距离赋予相应的权重。对初始预测的高分低频数据,首先基于相似像元和其权重值,通过加权和的方式得到中心高分低频像元的初始修正;然后将残差R进行线性插值,使其分辨率与高分低频数据相同,并基于得到的相似像元和权重再次修正中心高分低频像元的反射率值,从而得到最终的结果。
本文采用相关系数(r)、均方根误差(RMSE)、平均绝对误差(AAD)、结构相似指数(SSIM)和综合性整体误差(ERGAS)5个指标分析4种时空融合算法的精度。
对实验区1采用4种时空融合方法进行时空融合,其统计结果如表2所示,其中4种方法得到的ERGAS分别为1.6777、1.6772、1.6955和1.3734。从统计分析结果可看出:① 对于4个波段,基于STARFM算法得到的融合结果具有最好的相关系数和SSIM,而Fit_FC算法能够得到较低的RMSE和AAD值;相对而言,对于红波段和近红波段的预测精度要高于对蓝波段和绿波段的预测;② 对于4个波段,相比于FSDAF,STDFA和Fit_FC 3种方法,基于STARFM方法得到的结果的相关系数平均提高0.0353、0.0259、0.0826;对于蓝波段和近红波段,SSIM平均提高0.0253,0.0104,0.0381;③ 对于4个波段,相比于STARFM、FSDAF和STDFA 3种方法,基于Fit_FC方法得到的结果的RMSE和AAD值平均降低0.0078、0.0079、0.0083和0.0087、0.0081,、0.0089;对于绿波段和红波段,SSIM平均提高0.0163,、0.0342、0.0294。
表2 试验区1统计比较结果
Tab. 2 Statistical Results for site 1
| 波段 | 方法 | r | RMSE | AAD | SSIM |
|---|---|---|---|---|---|
| 蓝波段 | STARFM | 0.7238 | 0.0165 | 0.0130 | 0.9040 |
| FSDAF | 0.6980 | 0.0174 | 0.0137 | 0.8912 | |
| STDFA | 0.6865 | 0.0172 | 0.0135 | 0.8941 | |
| Fit_FC | 0.4758 | 0.0163 | 0.0122 | 0.8321 | |
| 绿波段 | STARFM | 0.7841 | 0.0461 | 0.0438 | 0.8194 |
| FSDAF | 0.7434 | 0.0457 | 0.0430 | 0.8022 | |
| STDFA | 0.7532 | 0.0465 | 0.0440 | 0.8056 | |
| Fit_FC | 0.7474 | 0.0365 | 0.0336 | 0.8428 | |
| 红波段 | STARFM | 0.8457 | 0.0490 | 0.0460 | 0.8481 |
| FSDAF | 0.8193 | 0.0489 | 0.0453 | 0.8295 | |
| STDFA | 0.8290 | 0.0494 | 0.0462 | 0.8356 | |
| Fit_FC | 0.8250 | 0.0413 | 0.0376 | 0.8572 | |
| 近红波段 | STARFM | 0.8539 | 0.0553 | 0.0511 | 0.8600 |
| FSDAF | 0.8055 | 0.0550 | 0.0496 | 0.8223 | |
| STDFA | 0.8354 | 0.0555 | 0.0512 | 0.8492 | |
| Fit_FC | 0.8288 | 0.0415 | 0.0358 | 0.8557 |
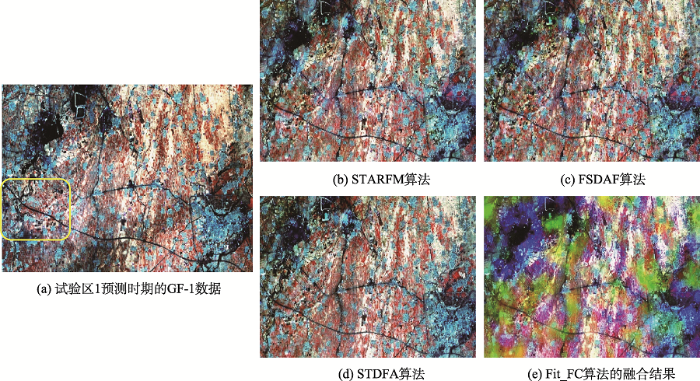
图3所示为针对试验区1采用4种方法得到的融合结果。从整体上看,4种融合方法都能够较好地得到相应的细节信息,由于Fit_FC方法是将已知时期与预测时期低分辨率数据拟合的线性系数直接应用于已知时期的高分辨率数据,因此当高、低分辨率的差异较大时,会出现明显的“块效应”(图3(e)),从而可能会失去一些细节信息,另外用于拟合系数的窗口大小对结果也有一定的影响。
图4为图3(a)中黄色框选出的区域放大图,以及该区域基于4种算法的融合结果。从结果上看, 4种融合算法都能够较好的保留空间细节信息,农田、河流、居民地等主要地物的形状和范围都得到较好的反映。
从统计分析和融合图像的视觉比较上可以看到:对于同质区域,基于线性模型和光谱解混的方法都能够得到较为理想的融合结果;对于各个波段,融合图像和真实图像的相关系数在0.7以上,且地物的空间信息能够较好的体现。
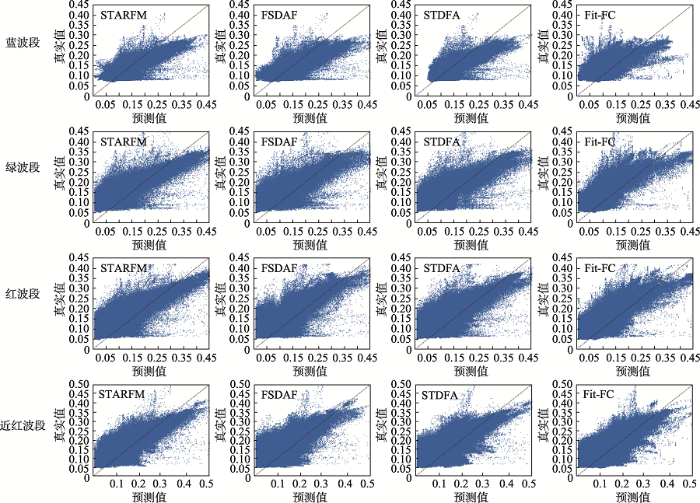
由基于4种方法得到的融合结果各个波段预测值与真实值的点分布(图5)可知,4种方法得到的各个波段点分布基本相似。总体而言,对于蓝波段, 4种方法得到的融合值与真实值基本沿1:1线分布,而对于其他3个波段,预测值往往要低于真实值,尤其在低反射率值区域,预测值会明显低于真实值。
图5 基于4种时空融合算法的各波段预测值与真实值点分布(试验区1)
Fig. 5 Scatter plots of actual and predicted values for the four experimental bands of site 1
对试验区2采用4种时空融合方法进行时空融合,其统计结果如表3所示,其中4种方法得到的ERGAS分别为2.1011、2.2312、2.0764和1.7364。从表3可看出:① STARFM算法能够得到较好的相关系数,对于蓝波段,STDFA算法能够得到较好的RMSE、AAD和SSIM值,而对于其他3个波段,Fit_FC算法能够得到比较好的RMSE、AAD和SSIM值;② 对于4个波段,相比于FSDAF,STDFA和Fit_FC方法,基于STARFM方法得到的融合结果的相关系数平均提高0.0553、0.0278、0.0909;③ 对于绿、红和近红波段,相比于STARFM,FSDAF和STDFA方法,基于Fit_FC方法得到的融合结果能够平均降低RMSE和AAD值0.0128、0.0165、0.0126和0.0143、0.0141、0.0138。
表3 试验区2统计比较结果
Tab. 3 Statistical results for site 2
| 波段 | 方法 | r | RMSE | AAD | SSIM |
|---|---|---|---|---|---|
| 蓝波段 | STARFM | 0.8075 | 0.0214 | 0.0160 | 0.8387 |
| FSDAF | 0.7424 | 0.0230 | 0.0169 | 0.8094 | |
| STDFA | 0.7985 | 0.0199 | 0.0149 | 0.8468 | |
| Fit_FC | 0.6553 | 0.0324 | 0.0272 | 0.7855 | |
| 绿波段 | STARFM | 0.8028 | 0.0586 | 0.0542 | 0.7222 |
| FSDAF | 0.7695 | 0.0597 | 0.0539 | 0.6925 | |
| STDFA | 0.7791 | 0.0578 | 0.0534 | 0.7158 | |
| Fit_FC | 0.7222 | 0.0416 | 0.0363 | 0.7812 | |
| 红波段 | STARFM | 0.8133 | 0.0545 | 0.0493 | 0.7698 |
| FSDAF | 0.7423 | 0.0598 | 0.0494 | 0.6840 | |
| STDFA | 0.7813 | 0.0539 | 0.0485 | 0.7572 | |
| Fit_FC | 0.7451 | 0.0422 | 0.0354 | 0.7833 | |
| 近红波段 | STARFM | 0.8298 | 0.0459 | 0.0394 | 0.8210 |
| FSDAF | 0.7780 | 0.0505 | 0.0388 | 0.7563 | |
| STDFA | 0.7832 | 0.0465 | 0.0394 | 0.7940 | |
| Fit_FC | 0.7671 | 0.0367 | 0.0282 | 0.8002 |
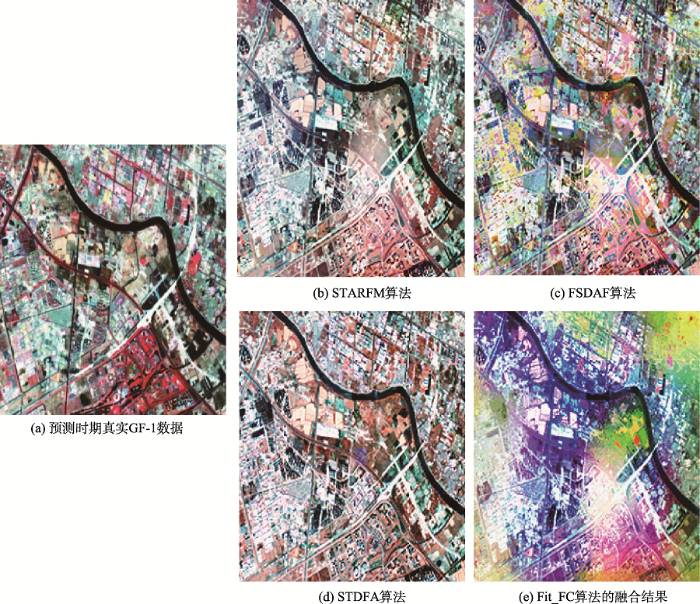
图6(见第165页)为基于4种时空融合方法对试验区2进行时空融合的结果。从图6可看出,4种融合方法都能对不同地物的空间细节进行融合。但由于分辨率差异和邻域相似像元的选择,造成STARFM算法、FSDAF算法和Fit_FC算法得到的结果出现了“块效应”,而Fit_FC算法是将低分高频数据拟合的线性系数直接应用于已知时期的高分低频数据,其“块效应”更加明显。STDFA是针对不同类别进行融合,其“块效应”不明显。
图7(见第165页)为图6(a)黄色框选区域的放大图,以及相应区域4种算法的融合结果。从图7可看出,4种方法都能够得到较好的细节信息,但STARFM算法,FSDAF算法以及Fit_FC算法都会出现一定的平滑现象,这可能是由于这3种方法都需要基于邻域像元进行局部加权运算。另外,对于异质区域的融合,其平滑现象要比对同质区域的融合更加明显。STDFA方法只是针对类别进行计算,因此,其平滑现象不明显。相比于Landsat 30 m数据,GF-1 WFV数据与MODIS数据的分辨率差异更大,因此这种局部平滑现象可能会对GF-1 WFV数据与MODIS数据的融合影响更大。
图8(见第166页)为基于4种方法得到的融合结果各个波段预测值与真实值的点分布。如图8所示,4种方法得到的各个波段点分布基本相似。总体而言,虽然预测值与真实值大致均匀分布在1:1线的两侧,但相比于试验区1的融合结果,试验区2的精度较低,具体表现在中低反射率值区域,预测值要低于真实值,而在高反射率值区域,预测值往往又要高于真实值。由于试验区2可看作是异质区域,因此与以往研究类似,其融合精度要低于同质区域的融合。
图8 基于4种时空融合算法的各波段预测值与真实值点分布(试验区2)
Fig. 8 Scatter plots of actual and predicted values for the four experimental bands of site 2
通过对2个试验区的融合可以看到,基于解混方法(FSDAF和STDFA)的时空融合算法的精度较低,这主要由2个方面造成:① 其都需要首先对已知时期的高分低频数据进行分类,而非监督分类方法(如K-means方法)的分类精度会对这2种算法造成一定影响;② 当高分低频数据与高频低分数据的分辨率差异较大时,每一个端元(即高分低频像元)所代表的区域会更加精细,当分类数较少时,会造成融合的平滑,而当分类数较多时,也会造成拟合精度的降低(如在高频低分像元中,如某一个类别的丰富度很低,会增大拟合误差)。
STARFM和Fit_FC方法都是在像元尺度进行时空融合,STARFM算法需要将已知时期和预测时期的高频低分数据进行重采样。而Fit_FC方法将已知时期和预测时期的高频低分数据进行拟合,并直接将拟合系数应用于高分低频数据,因此,GF-1 WFV和MODIS数据较大的分辨率差异会造成Fit_FC算法的结果出现明显的“块效应”。
从2个试验区预测值与真实值点分布图可看出,4种方法对于异质区域的融合效果要低于对同质区域的融合,这与以往的研究结果类似。在低反射率区域,预测值往往要低于真实值,而对于同质区域,其高反射率区域的融合值与真实值基本沿 1:1线均匀分布,对于异质区域,其高反射率区域的融合值要高于真实值。
本论文基于4种主流的时空融合算法(STARFM,FSDAF,STDFA和Fit_FC)对GF-1数据和MODIS数据进行时空融合,分析4种算法对GF-1数据时空融合的有效性,为后续基于国产卫星数据进行时序研究提供数据支持。从统计结果看,STARFM算法在4个波段能够取得较好的相关系数值,而大部分情况下Fit_FC方法能够取得较好的RMSE和AAD值。图像分析表明4种方法都能较好地实现GF-1数据的预测,但受到拟合窗口,分类数,高低分辨率影像分辨率差异较大等因素的影响,Fit_FC方法有一些过平滑现象。
下一步将主要集中于对不同地形,已知时期与预测时期间隔较大等情况时,时空融合算法对GF-1数据的融合有效性进行研究。
The authors have declared that no competing interests exist.
| [1] |
On the blending of the Landsat and MODIS surface reflectance: Predicting daily Landsat surface reflectance [J].https://doi.org/10.1109/TGRS.2006.872081 URL [本文引用: 3] 摘要
The 16-day revisit cycle of Landsat has long limited its use for studying global biophysical processes, which evolve rapidly during the growing season. In cloudy areas of the Earth, the problem is compounded, and researchers are fortunate to get two to three clear images per year. At the same time, the coarse resolution of sensors such as the Advanced Very High Resolution Radiometer and Moderate Resolution Imaging Spectroradiometer (MODIS) limits the sensors' ability to quantify biophysical processes in heterogeneous landscapes. In this paper, the authors present a new spatial and temporal adaptive reflectance fusion model (STARFM) algorithm to blend Landsat and MODIS surface reflectance. Using this approach, high-frequency temporal information from MODIS and high-resolution spatial information from Landsat can be blended for applications that require high resolution in both time and space. The MODIS daily 500-m surface reflectance and the 16-day repeat cycle Landsat Enhanced Thematic Mapper Plus (ETM+) 30-m surface reflectance are used to produce a synthetic "daily" surface reflectance product at ETM+ spatial resolution. The authors present results both with simulated (model) data and actual Landsat/MODIS acquisitions. In general, the STARFM accurately predicts surface reflectance at an effective resolution close to that of the ETM+. However, the performance depends on the characteristic patch size of the landscape and degrades somewhat when used on extremely heterogeneous fine-grained landscapes.
|
| [2] |
A new data fusion model for high spatial- and temporal-resolution mapping of forest disturbance based on Landsat and MODIS [J].https://doi.org/10.1016/j.rse.2009.03.007 URL [本文引用: 1] 摘要
Investigating the temporal and spatial pattern of landscape disturbances is an important requirement for modeling ecosystem characteristics, including understanding changes in the terrestrial carbon cycle or mapping the quality and abundance of wildlife habitats. Data from the Landsat series of satellites have been successfully applied to map a range of biophysical vegetation parameters at a 30 m spatial resolution; the Landsat 16 day revisit cycle, however, which is often extended due to cloud cover, can be a major obstacle for monitoring short term disturbances and changes in vegetation characteristics through time. The development of data fusion techniques has helped to improve the temporal resolution of fine spatial resolution data by blending observations from sensors with differing spatial and temporal characteristics. This study introduces a new data fusion model for producing synthetic imagery and the detection of changes termed Spatial Temporal Adaptive Algorithm for mapping Reflectance Change (STAARCH). The algorithm is designed to detect changes in reflectance, denoting disturbance, using Tasseled Cap transformations of both Landsat TM/ETM and MODIS reflectance data. The algorithm has been tested over a 185 185 km study area in west-central Alberta, Canada. Results show that STAARCH was able to identify spatial and temporal changes in the landscape with a high level of detail. The spatial accuracy of the disturbed area was 93% when compared to the validation data set, while temporal changes in the landscape were correctly estimated for 87% to 89% of instances for the total disturbed area. The change sequence derived from STAARCH was also used to produce synthetic Landsat images for the study period for each available date of MODIS imagery. Comparison to existing Landsat observations showed that the change sequence derived from STAARCH helped to improve the prediction results when compared to previously published data fusion techniques.
An enhanced spatial and temporal adaptive reflectance fusion model for complex heterogeneous regions [J]. |
| [4] |
Estimating winter wheat biomass by assimilating leaf area index derived from fusion of Landsat-8 and MODIS data [J].https://doi.org/10.1016/j.jag.2016.02.001 URL [本文引用: 1] 摘要
A sufficient number of satellite acquisitions in a growing season are essential for deriving agronomic indicators, such as green leaf area index (GLAI), to be assimilated into crop models for crop productivity estimation. However, for most high resolution orbital optical satellites, it is often difficult to obtain images frequently due to their long revisit cycles and unfavorable weather conditions. Data fusion algorithms, such as the Spatial and Temporal Adaptive Reflectance Fusion Model (STARFM) and the Enhanced STARFM (ESTARFM), have been developed to generate synthetic data with high spatial and temporal resolution to address this issue. In this study, we evaluated the approach of assimilating GLAI into the Simple Algorithm for Yield Estimation model (SAFY) for winter wheat biomass estimation. GLAI was estimated using the two-band Enhanced Vegetation Index (EVI2) derived from data acquired by the Operational Land Imager (OLI) onboard the Landsat-8 and a fusion dataset generated by blending the Moderate-Resolution Imaging Spectroradiometer (MODIS) data and the OLI data using the STARFM and ESTARFM models. The fusion dataset had the temporal resolution of the MODIS data and the spatial resolution of the OLI data. Key parameters of the SAFY model were optimised through assimilation of the estimated GLAI into the crop model using the Shuffled Complex Evolution-University of Arizona (SCE-UA) algorithm. A good agreement was achieved between the estimated and field measured biomass by assimilating the GLAI derived from the OLI data (GLAIL) alone (R2=0.77 and RMSE=231gm 2). Assimilation of GLAI derived from the fusion dataset (GLAIF) resulted in aR2of 0.71 and RMSE of 193gm 2while assimilating the combination of GLAILand GLAIFled to further improvements (R2=0.76 and RMSE=176gm鈭2). Our results demonstrated the potential of using the fusion algorithms to improve crop growth monitoring and crop productivity estimation when the number of high resolution remote sensing data acquisitions is limited.
|
| [5] |
Long-term and fine-scale satellite monitoring of the urban heat island effect by the fusion of multi-temporal and multi-sensor remote sensed data: A 26-year case study of the city of Wuhan in China [J].https://doi.org/10.1016/j.rse.2015.11.005 URL [本文引用: 1] 摘要
61We solve the spatial–temporal discontinuity of remotely sensed LST data.61A long-term (26-years) and fine-scale summer LST data series has been generated.61This 26-year data is used for the analysis of the SUHI characteristic. The spatial–temporal relationships are investigated from a 3D perspective.
|
| [6] |
Generating daily land surface temperature at Landsat resolution by fusing Landsat and MODIS data [J].https://doi.org/10.1016/j.rse.2014.02.003 URL [本文引用: 1] 摘要
61A fusion algorithm to produce Landsat-like LST by blending MODIS and Landsat data61Incorporate annual temperature cycle modeling into the prediction of LST change61MODIS radiance is spectrally unmixed to relate to the Landsat radiance.61Both Landsat reflective and TIR bands are utilized for searching for similar pixels.61Prediction accuracy for the whole Los Angeles area ranged from 1.3K to 2K.
|
| [7] |
Improving the mapping of crop types in the Midwestern US by fusing Landsat and MODIS satellite data [J].https://doi.org/10.1016/j.jag.2017.01.012 URL [本文引用: 1] 摘要
Mapping crop types is of great importance for assessing agricultural production, land-use patterns, and the environmental effects of agriculture. Indeed, both radiometric and spatial resolution of Landsat's sensors images are optimized for cropland monitoring. However, accurate mapping of crop types requires frequent cloud-free images during the growing season, which are often not available, and this raises the question of whether Landsat data can be combined with data from other satellites. Here, our goal is to evaluate to what degree fusing Landsat with MODIS Nadir Bidirectional Reflectance Distribution Function (BRDF)-Adjusted Reflectance (NBAR) data can improve crop-type classification. Choosing either one or two images from all cloud-free Landsat observations available for the Arlington Agricultural Research Station area in Wisconsin from 2010 to 2014, we generated 87 combinations of images, and used each combination as input into the Spatial and Temporal Adaptive Reflectance Fusion Model (STARFM) algorithm to predict Landsat-like images at the nominal dates of each 8-day MODIS NBAR product. Both the original Landsat and STARFM-predicted images were then classified with a support vector machine (SVM), and we compared the classification errors of three scenarios: 1) classifying the one or two original Landsat images of each combination only, 2) classifying the one or two original Landsat images plus all STARFM-predicted images, and 3) classifying the one or two original Landsat images together with STARFM-predicted images for key dates. Our results indicated that using two Landsat images as the input of STARFM did not significantly improve the STARFM predictions compared to using only one, and predictions using Landsat images between July and August as input were most accurate. Including all STARFM-predicted images together with the Landsat images significantly increased average classification error by 4% points (from 21% to 25%) compared to using only Landsat images. However, incorporating only STARFM-predicted images for key dates decreased average classification error by 2% points (from 21% to 19%) compared to using only Landsat images. In particular, if only a single Landsat image was available, adding STARFM predictions for key dates significantly decreased the average classification error by 4 percentage points from 30% to 26% (p < 0.05). We conclude that adding STARFM-predicted images can be effective for improving crop-type classification when only limited Landsat observations are available, but carefully selecting images from a full set of STARFM predictions is crucial. We developed an approach to identify the optimal subsets of all STARFM predictions, which gives an alternative method of feature selection for future research.
|
| [8] |
Fusing Landsat and MODIS data for vegetation monitoring [J]. |
| [9] |
Toward mapping crop progress at field scales through fusion of Landsat and MODIS imagery [J].https://doi.org/10.1016/j.rse.2016.11.004 URL [本文引用: 1] 摘要
61Remote sensing approaches for mapping crop phenology at field scale are developed.61Spatial details and seasonal variability are captured from data fusion approach.6130-m crop phenological metrics are generated using the fused Landsat-MODIS data.61Crop phenology from remote sensing are correlated to crop physiological stages.
|
| [10] |
Land cover classification based on fused data from GF-1 and MODIS NDVI time series [J].https://doi.org/10.3390/rs8090741 URL [本文引用: 1] |
| [11] |
Surface water mapping from Suomi NPP-VIIRS imagery at 30m resolution via blending with Landsat data [J].https://doi.org/10.3390/rs8080631 URL [本文引用: 1] 摘要
Monitoring the dynamics of surface water using remotely sensed data generally requires both high spatial and high temporal resolutions. One effective and popular approach for achieving this is image fusion. This study adopts a widely accepted fusion model, the Enhanced Spatial and Temporal Adaptive Reflectance Fusion Model (ESTARFM), for blending the newly available coarse-resolution Suomi NPP-VIIRS data with Landsat data in order to derive water maps at 30 m resolution. The Pan-sharpening technique was applied to preprocessing NPP-VIIRS data to achieve a higher-resolution before blending. The modified Normalized Difference Water Index (mNDWI) was employed for mapping surface water area. Two fusion alternatives, blend-then-index (BI) or index-then-blend (IB), were comparatively analyzed against a Landsat derived water map. A case study of mapping Poyang Lake in China, where water distribution pattern is complex and the water body changes frequently and drastically, was conducted. It has been revealed that the IB method derives more accurate results with less computation time than the BI method. The BI method generally underestimates water distribution, especially when the water area expands radically. The study has demonstrated the feasibility of blending NPP-VIIRS with Landsat for achieving surface water mapping at both high spatial and high temporal resolutions. It suggests that IB is superior to BI for water mapping in terms of efficiency and accuracy. The finding of this study also has important reference values for other blending works, such as image blending for vegetation cover monitoring.
|
| [12] |
A spatial and temporal nonlocal filter-based data fusion method [J].https://doi.org/10.1109/TGRS.2017.2692802 URL [本文引用: 1] 摘要
The tradeoff in remote sensing instruments that balances the spatial resolution and temporal frequency limits our capacity to monitor spatial and temporal dynamics effectively. The spatiotemporal data fusion technique is considered as a cost-effective way to obtain remote sensing data with both high spatial resolution and high temporal frequency, by blending observations from multiple sensors with different advantages or characteristics. In this paper, we develop the spatial and temporal nonlocal filter-based fusion model (STNLFFM) to enhance the prediction capacity and accuracy, especially for complex changed landscapes. The STNLFFM method provides a new transformation relationship between the fine-resolution reflectance images acquired from the same sensor at different dates with the help of coarse-resolution reflectance data, and makes full use of the high degree of spatiotemporal redundancy in the remote sensing image sequence to produce the final prediction. The proposed method was tested over both the Coleambally Irrigation Area study site and the Lower Gwydir Catchment study site. The results show that the proposed method can provide a more accurate and robust prediction, especially for heterogeneous landscapes and temporally dynamic areas.
|
| [13] |
Spatio-temporal fusion for daily Sentinel-2 images [J].https://doi.org/10.1016/j.rse.2017.10.046 URL [本文引用: 2] |
| [14] |
Downscaling time series of MERIS full resolution data to monitor vegetation seasonal dynamics [J].https://doi.org/10.1016/j.rse.2009.04.011 URL [本文引用: 1] 摘要
Monitoring vegetation dynamics is fundamental for improving Earth system models and for increasing our understanding of the terrestrial carbon cycle and the interactions between biosphere and climate. Medium spatial resolution sensors, like MERIS, exhibit a significant potential to study these dynamics over large areas because of their spatial, spectral and temporal resolution. However, the spatial resolution provided by MERIS (300 m in full resolution mode) is not appropriate to monitor heterogeneous landscapes, where typical length scales of these dynamics rarely reach 300 m. We, therefore, motivate the use of data fusion techniques to downscale medium spatial resolution data (MERIS full resolution, FR) to a Landsat-like spatial resolution (25 m). An unmixing-based data fusion approach was applied to a time series of MERIS FR images acquired over The Netherlands. The selected data fusion approach is based on the linear mixing model and uses a high spatial resolution land use database to produce images having the spectral and temporal resolution as provided by MERIS, but a Landsat-like spatial resolution. A quantitative assessment of the quality of the fused images was done in order to test the validity of the proposed method and to evaluate the radiometric characteristics of the MERIS fused images. The resulting series of fused images was subsequently used to compute two vegetation indices specifically designed for MERIS: the MERIS terrestrial chlorophyll index (MTCI) and the MERIS global vegetation index (MGVI). These indices represent continuous fields of canopy chlorophyll (MTCI) and of the fraction of photosynthetically active radiation absorbed by the canopy (MGVI). Results indicate that the selected data fusion approach can be successfully used to downscale MERIS data and, therefore, to monitor vegetation dynamics at Landsat-like spatial, and MERIS-like spectral and temporal resolution.
|
| [15] |
A comparison of STARFM and an unmixing-based algorithm for Landsat and MODIS data fusion [J].https://doi.org/10.1016/j.rse.2014.09.012 URL [本文引用: 1] 摘要
61We compared the STARFM and unmixing-based data fusion algorithms.61We propose a unique Bayesian formulation to restrain the unmixing process.61We present STRUM, combining the strengths of unmixing-based fusion and STARFM.61STRUM produced imagery most similar to reference Landsat images.61The unmixing method and STRUM were less sensitive to temporal reflectance changes.
|
| [16] |
An improved STARFM with help of an unmixing-based method to generate high spatial and temporal resolution remote sensing data in complex heterogeneous regions [J].https://doi.org/10.1109/JSEN.2016.2616227 URL [本文引用: 1] |
| [17] |
Use of MODIS and Landsat time series data to generate high-resolution temporal synthetic Landsat data using a spatial and temporal reflectance fusion model [J].https://doi.org/10.1117/1.JRS.6.063507 URL [本文引用: 2] 摘要
中国科学院机构知识库(中国科学院机构知识库网格(CAS IR GRID))以发展机构知识能力和知识管理能力为目标,快速实现对本机构知识资产的收集、长期保存、合理传播利用,积极建设对知识内容进行捕获、转化、传播、利用和审计的能力,逐步建设包括知识内容分析、关系分析和能力审计在内的知识服务能力,开展综合知识管理。
|
| [18] |
An improved high spatial and temporal data fusion approach for combining Landsat and MODIS data to generate daily synthetic Landsat imagery [J].https://doi.org/10.1016/j.inffus.2015.12.005 URL [本文引用: 1] |
| [19] |
A flexible spatiotemporal method for fusing satellite images with different resolutions [J].https://doi.org/10.1016/j.rse.2015.11.016 URL [本文引用: 2] 摘要
61FSDAF is developed to fuse multi-sensor images, e.g., Landsat and MODIS.61FSDAF needs minimum input data and is suitable for heterogeneous landscapes.61FSDAF can predict both phenological change and land cover change.61FSDAF can get more accurate fused images than existing methods.61FSDAF can support studies of rapid land surface dynamics.
|
| [20] |
An improved method for producing high spatial-resolution NDVI time series datasets with multi-temporal MODIS NDVI data and Landsat TM/ETM plus images [J].https://doi.org/10.3390/rs70607865 URL [本文引用: 1] 摘要
Due to technical limitations, it is impossible to have high resolution in both spatial and temporal dimensions for current NDVI datasets. Therefore, several methods are developed to produce high resolution (spatial and temporal) NDVI time-series datasets, which face some limitations including high computation loads and unreasonable assumptions. In this study, an unmixing-based method, NDVI Linear Mixing Growth Model (NDVI-LMGM), is proposed to achieve the goal of accurately and efficiently blending MODIS NDVI time-series data and multi-temporal Landsat TM/ETM+ images. This method firstly unmixes the NDVI temporal changes in MODIS time-series to different land cover types and then uses unmixed NDVI temporal changes to predict Landsat-like NDVI dataset. The test over a forest site shows high accuracy (average difference: 0.0070; average absolute difference: 0.0228; and average absolute relative difference: 4.02%) and computation efficiency of NDVI-LMGM (31 seconds using a personal computer). Experiments over more complex landscape and long-term time-series demonstrated that NDVI-LMGM performs well in each stage of vegetation growing season and is robust in regions with contrasting spatial and spatial variations. Comparisons between NDVI-LMGM and current methods (i.e., Spatial and Temporal Adaptive Reflectance Fusion Model (STARFM), Enhanced STARFM (ESTARFM) and Weighted Linear Model (WLM)) show that NDVI-LMGM is more accurate and efficient than current methods. The proposed method will benefit land surface process research, which requires a dense NDVI time-series dataset with high spatial resolution.
|
| [21] |
Validation of synthetic daily Landsat NDVI time series data generated by the improved spatial and temporal data fusion approach [J].https://doi.org/10.1016/j.inffus.2017.06.005 URL [本文引用: 1] 摘要
Correlation analysis has been widely used to validate the accuracy of synthetic medium-resolution data generated by spatial and temporal fusion methods. However, as the temporal resolution of Landsat data is 16 days, this method only can be used for the validation of multi-temporal Landsat data. This means that the fusion accuracy of most images in a synthetic daily time series have not been validated. Furthermore, the fusion accuracy of each image in a synthetic Landsat time series is different, because there is a negative correlation with the time interval length between the fusion date and the base image date. Therefore, there is a need for temporal validation of synthetic daily Landsat time series data. We propose a suitable validation method in this paper. The improved spatial and temporal data fusion approach (ISTDFA) was applied to generate synthetic daily Landsat Normalized Difference Vegetation Index (NDVI) time series, which were then validated for both spatial and temporal dimensions using actual MODIS NDVI time series. For temporal validation, the correlation coefficients ( R ) between the actual and synthetic 500 m NDVI time series were calculated by pixel-by-pixel to generate imagery with an R value for each pixel. For spatial validation, R between MODIS NDVI imagery and synthetic Landsat NDVI imagery was calculated day by day to generate an R time series. This method was tested and validated in two locations (Bole and Luntai) in Xinjiang Province, China. The results show that, for temporal validation, the R values of 86.08% pixels in Bole and 94.71% pixels in Luntai are higher than 0.9, and in spatial validation, R values are higher than 0.8 on most days. Synthetic daily Landsat NDVI data was used to monitor the phenology of vegetation at a spatial resolution of 30 m successfully, while the MODIS product is limited to 500 m.
|
| [22] |
Multitemporal fusion of Landsat/TM and ENVISAT/MERIS for crop monitoring [J].https://doi.org/10.1016/j.jag.2012.12.004 URL [本文引用: 1] 摘要
Monitoring Earth dynamics using current and future satellites is one of the most important objectives of the remote sensing community. The exploitation of image time series from sensors with different characteristics provides new opportunities to increase the knowledge about environmental changes and to support many operational applications. This paper presents an image fusion approach based on multiresolution and multisensor regularized spatial unmixing. The approach yields a composite image with the spatial resolution of the high spatial resolution image while retaining the spectral and temporal characteristics of the medium spatial resolution image. The approach is tested using images from Landsat/TM and ENVISAT/MERIS instruments, but is general enough to be applied to other sensor pairs. The potential of the proposed spatial unmixing approach is illustrated in an agricultural monitoring application where Landsat temporal profiles from images acquired over Albacete, Spain, in 2004 and 2009 are complemented with MERIS fused images. The resulting spatial resolution from Landsat allows monitoring small and medium size crops at the required scale while the fine spectral and temporal resolution from MERIS allow a more accurate determination of the crop type and phenology as well as capturing rapidly varying land-cover changes.
|

/
| 〈 |
|
〉 |


