杨双姝玛 , 黄庆旭, 何春阳
YANG Shuangshuma, HUANG Qingxu, HE Chunyang
通讯作者:
收稿日期: 2018-09-3
修回日期: 2018-11-26
网络出版日期: 2019-02-20
版权声明: 2019 《地球信息科学学报》编辑部 《地球信息科学学报》编辑部 所有
基金资助:
作者简介:
作者简介:杨双姝玛(1994-),女,广东佛山人,硕士生,主要从事为城市景观过程及其影响。E-mail: shuangshumayang@mail.bnu.edu.cn
展开
摘要
全面准确地分析中国建设用地空间格局,是衡量城市景观的生态环境效应和制定区域发展战略的重要依据。为此,本文基于空间分辨率为12 m的2012年的全球城市足迹数据,分别在国家、经济区和城市群量化了中国建设用地空间格局。结果表明,12 m分辨率的数据能更细致和准确地刻画中国建设用地的特征。2012年中国建设用地面积为1.73×10⁵ km2,占中国陆地总面积的1.81%。从建设用地的空间格局来看,城市群尺度的建设用地破碎度最高,其建设用地平均斑块密度分别是国家和经济区平均水平的3.66倍和1.62倍。进一步分析表明,社会经济和地形因素共同影响建设用地空间格局。今后,应针对建设用地空间格局破碎问题,因地制宜地制定合理的措施,推动中国建设用地的合理发展。
关键词:
Abstract
Accurately quantifying spatial pattern of built-up areas is of great significance to analyzing the ecological and environmental impacts of the built-up landscape and planning for regional development. In this paper, we used the Global Urban Footprint (GUF) data with 12 m spatial resolution in 2012 to analyze the spatial pattern of built-up areas in China at three scales, i.e., the national, economic zone and urban agglomeration scales. Specifically, we chose six landscape metrics, i.e., total area of the built-up area, percentage of the built-up area of the landscape, number of patches, patch density, landscape shape index and mean Euclidean nearest-neighbor distance to measure spatial pattern of the built-up areas. Then, we explored the relationship between spatial pattern of built-up area and socioeconomic variable at different scales. The results showed the 12 m GUF dataset can delineate the built-up area in China with higher accuracy and more details, compared to previous coarse resolution datasets. The built-up areas reached 1.73×10⁵ km2 in 2012, accounting for 1.81% of the total land area in China. At the economic zone scale, more than half of built-up areas concentrated in three economic zones, the Northern Coastal region, the Middle Reaches of the Yellow River and the Eastern Coastal region. From the perspective of the spatial pattern of the built-up areas, the fragmentation of built-up areas was highest at the urban agglomeration scale. The mean patch density at the urban agglomeration scale were 3.66 and 1.62 times as large as those at the national and economic zone scales. The results of correlation analysis indicated that population and economic level played important roles in influencing the spatial pattern of built-up areas. The number of patches and the degree of fragmentation for built-up areas increased with the amount of urban residents, gross domestic product and investment in the fixed assets. The correlation coefficients between these two sets of measurements ranged from 0.55 to 0.94 (P<0.05). In the future, we should make place-based plans to solve the fragmentation of the built-up areas and to promote a rational development of built-up areas in China.
Keywords:
建设用地是指以人工建筑为主,且较少有植被覆盖的区域[1]。通常,人工建筑的覆盖率超过50%被认为是建设用地,如道路、建筑物、跑道以及工业设施等。近年来,中国经历了快速大规模的建设用地扩展过程[2]。据统计,中国城市建设用地面积从1981年的0.7×10⁴ km2增加到了2016年的5.4×10⁴ km2,增长了7.4倍[3]。中国大规模的建设用地扩展不但改变了建设用地的空间结构,并且对区域的能量和水分传输,以及区域原有的气候和水热条件产生了深刻影响[4,5]。已有研究表明,由于中国建设用地空间格局的剧烈变化,空间结构正朝着更分散、更破碎和更复杂的方向发展[6,7,8]。建设用地的空间格局和动态作为人类活动的重要衡量指标,是研究区域景观过程及其生态环境影响的基础[9]。因此,准确全面地分析中国建设用地空间格局是制定区域发展战略的重要基础。
中国建设用地空间格局研究受到众多学者的关注,但大部分研究是基于中低空间分辨率的数据开展的。例如,Xu等[10]基于夜间灯光、植被指数和地表温度数据提取了中国1992-2015年1 km空间分辨率的城市建设用地信息;Sharma等[11]基于MODIS多光谱数据和VIIRS夜间灯光数据,绘制了2014年500 m空间分辨率的城市建设用地数据。Kuang等[12]基于30m空间分辨率的Landsat TM和HJ-1A卫星数据提取了中国1990-2010年的城市和工业建设用地变化;Wang等[13]基于1990-2010年的Landsat TM/ETM+数据分析城市建设用地扩展;Chen等[14]同样基于Landsat TM和HJ-1A卫星影像中获取全球2000年和2010年30 m空间分辨率的城市建设用地信息。然而,在全国尺度上,已有研究获取的建设用地空间分辨率较低,无法精细地描绘农村建设用地的空间格局,且大多研究依靠的是光学传感器数据提取的,受极端天气的影响较大。因此,亟需基于更高分辨率建设用地数据,对中国建设用地空间格局进行更精细的分析。
全球城市足迹(Global Urban Footprint)数据提供了全球2012年12 m空间分辨率的建设用地数据,为更精细地分析中国建设用地的空间格局提供了数据保障[15]。同时,为避免以往光学遥感数据受地形、光照和阴影等的影响,全球城市足迹数据在基于TerraSAR-X和TanDEM-X 2种雷达数据的基础上,采用支撑向量数据描述的非监督分类方法获取,确保数据更加准确和稳定。这套数据主要是测量了城市和农村中具有一定高度的建筑物分布[15],并且可以免费从网站上获取,开源性较强。已有相关的研究开始利用全球城市足迹数据来用于验证城市数据精度分析。例如,Minghini等[16]在意大利米兰,通过将全球城市足迹数据和全球人类居住地数据相比较,发现二者相似性较高,并且与欧盟使用的城市数据集一致性较好,整体精度达到72%~87%。Esch等[17]通过对比全球城市足迹数据、全球人类居住地数据和地面真实数据,发现全球城市足迹数据的平均Kappa系数达到0.69,是空间分辨率500 m的MOD500数据Kappa系数的2倍。
因此,本文首先基于2012年城市足迹数据提取了中国的建设用地信息;然后,利用建设用地面积、建设用地占比、斑块数量、斑块密度、景观形状指数和平均最近邻距离6个景观格局指数,分别在国家、经济区和城市群量化了2012年中国建设用地的空间格局;最后,探讨了社会经济因素以及地理区位要素与建设用地空间格局的关系,并提出了相应的政策思考和建议。
研究数据主要分为3类,分别是2012年全球城市足迹数据、社会经济数据和地理辅助数据。
2012年的全球城市足迹数据由德国航天航空中心和德国遥感数据中心在2016年发布[15,17],通过城市专题应用平台(Urban Thematic Exploitation)免费获取,具有较强的开源性。该平台一共提供了12、30和84 m共3种不同空间分辨率的全球城市足迹数据[15]。本文使用的是12 m空间分辨率的建设用地数据,是覆盖中国分辨率较高的、发布时间较新和最能体现城市与农村建设用地分布的数据集。以2011-2012年3 m空间分辨率的TerraSAR-X数据和TanDEM数据为基础数据,用182 249张雷达影像数据来覆盖全球范围。然后,依赖垂直建筑物的双重反射和后向散射特征,采用支撑向量数据描述的非监督分类方法提取建设用地。因此,本文的建设用地是指具有一定高度的人工建筑用地,它以城镇建设用地和农村居民点为主[18]。相比于低空间分辨率的建设用地数据,全球城市足迹数据在提取小规模和分散的农村建设用地方面具有较强的优势。与地面真实数据相比,全球城市足迹数据的建设用地总体精度约为85%,Kappa系数达到69%[17]。国内已有学者选择北京市验证了建设用地的准确度,总体精度为87.35%,Kappa系数为0.68,二者分别比全球人类居住地数据、全球30 m土地覆盖数据和MODIS 500 m土地数据高了3.3%~14.0%和0.1~0.4[17]。此外,该平台计划在2018年年底将发布2015年10 m空间分辨率的全球城市足迹数据。
社会经济数据包括经济数据和人口数据,其中全国、经济区和城市群的经济数据主要来自2013年的《中国区域统计年鉴》,人口数据来源于2013年的《中国人口和就业统计年鉴》。地理辅助数据主要包括中国经济区、城市群、地级市和县级尺度的行政边界数据,均来源于国家测绘地理信息局发布的1:100万数据。90 m高程数据和1:400万的河流、公路、铁路、地级市和县级中心矢量数据来自国家地理信息公共服务平台[19]。1992-2015年的多年平均气温和降水数据[20,21]来自中国气象站。本文在获取所有数据之后,将数据全部转换为Albers等积投影。
2.2.1 量化2012年中国建设用地的景观格局特征
由于景观指数能够高度浓缩景观格局信息,反映其空间组成和空间配置等方面特征,所以本文利用景观指数量化建设用地的景观格局特征[22]。参考Wu等[23]的研究,同时考虑建设用地的空间组成和空间配置,本文选用了建设用地面积、建设用地占比、斑块数量、斑块密度、景观形状指数和平均最近邻距离6个指标来量化中国建设用地的空间格局特征。其中,建设用地面积和建设用地占比表示建设用地空间组成特征;斑块数量、斑块密度、景观形状指数和平均最近邻距离表示建设用地的空间配置特征。本文所使用的景观指数均使用ArcGIS中的Patch Analysis模块进行计算(表1)。
表1 研究中选取的景观指数
Tab. 1 The landscape metrics used in this study
| 指数类型 | 指数名称 | 计算公式 | 取值范围 | 含义 |
|---|---|---|---|---|
| 空间组成 | 建设用地面积(CA) /104 km2 | CA>0 | 表征区域中的建设用地斑块面积(aij)的总和 | |
| 建设用地占比(PLAND) /% | 0<PLAND≤100 | 描述了区域中建设用地面积占区域面积(A)的比例 | ||
| 空间配置 | 斑块数量(NP)/个 | NP≥1 | 反映了区域中建设用地斑块的个数(N) | |
| 斑块密度(PD) /(个/km2) | PD>0 | 反映了单位面积上的建设用地斑块数量。其值越高,建设用地斑块越破碎 | ||
| 景观形状指数(LSI) | LSI≥1 | 用来衡量建设用地形状的规则程度。E为建设用地斑块总边长。LSI值越高,建设用地形状越趋向不规则 | ||
| 平均最近邻距离(ENN_MN) /m | ENN_MN>0 | 反映了不同建设用地斑块之间的平均最短欧式距离。hij为区域内每一个建设用地斑块与其最近邻体的距离, |
2.2.2 多尺度分析中国建设用地的空间格局
为了全面认识中国建设用地的空间格局,本文分别在国家、经济区和城市群分析了2012年中国建设用地的空间格局(图1)。选择经济区和城市群,由于经济区和城市群是相对独立和完整的城市系统,可以逐层深入理解建设用地格局的区域差异。具体而言,根据国务院发展研究中心在2005年发布的《地区协调发展的战略和政策》[25],将中国划分为东北、北部沿海、南部沿海、东部沿海、黄河中游、长江中游、西南和西北8个经济区。在城市群尺度上,参考Fang等[26]的研究和国务院在2016年发布的《中华人民共和国国民经济和社会发展第十三个五年(2016-2020)规划纲要》[27],选取了京津冀、长江三角洲、长江中游、珠江三角洲、山东半岛、成渝、辽中南、哈长、海峡西岸、关中、中原、广西北部湾、江淮和天山北坡14个城市群。
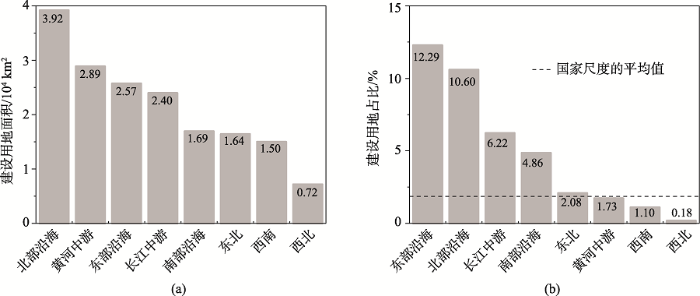
2012年中国建设用地面积为1.73×10⁵ km2,占中国陆地总面积的1.8%。经济区中,建设用地集 中在北部沿海、黄河中游和东部沿海经济区(图2(a))。这3个经济区的建设用地面积分别为3.9×10⁴、2.9×10⁴和2.6×10⁴ km2,共占中国建设用地面积的54.1%。西北经济区的建设用地面积最小,为0.7×10⁴ km2,仅占中国建设用地面积的4.2%。从建设用地占比来看,东部沿海经济区的建设用地占比最高,为12.3%,高出国家平均水平的5.8倍。西北经济区的建设用地占比最低,为0.2%,仅为国家尺度建设用地占比的十分之一。
图2 2012年中国八大经济区的建设用地空间组成
Fig. 2 The comparison of the built-up areas among China's eight economic zones in 2012
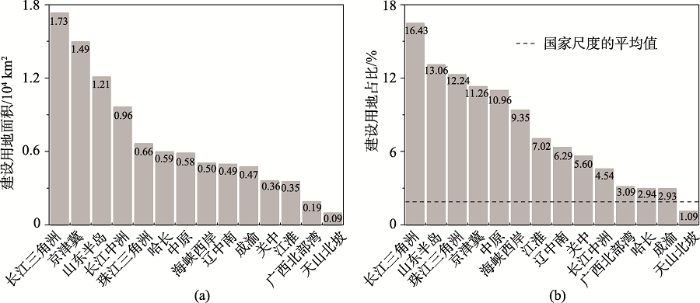
中国建设用地面积的一半以上分布在14个城市群中。2012年中国城市群的建设用地总面积为9.7×10⁴ km2,占中国建设用地总面积的55.9%。这14个城市群的建设用地面积在0.1×10⁴~1.7×10⁴ km2之间(图3(a))。其中,建设用地面积排在前三位的城市群是长江三角洲、京津冀和山东半岛城市群,建设用地面积分别为1.7×10⁴、1.5×10⁴ 和1.2×10⁴ km2, 分别占中国城市群建设用地总面积的17.9%、15.4%和12.5%。天山北坡城市群的建设用地面积最小,为0.1×10⁴ km2,约占中国城市群建设用地总面积的1%。
图3 2012年中国14个城市群的建设用地面积及占比
Fig. 3 Construction land area and proportion of 14 urban agglomerations in China in 2012
从建设用地占比来看,14个城市群的建设用地占比平均值为7.6%,是国家尺度建设用地占比的4.2倍。14个城市群的建设用地占比在1.1%~16.4%之间(图3(b))。其中,建设用地占比最高的是长江三角洲城市群,为16.4%,比国家平均水平高8.1倍;最低的是天山北坡城市群,建设用地占比为1.1%,仅为国家尺度建设用地占比的60%。
2012年中国建设用地的斑块数量为6.8×10⁶个,斑块密度为0.7个/km2,景观形状指数3994.3,平均最近邻体距离为145.9 m(表2)。
表2 2012年中国建设用地的空间配置
Tab. 2 The spatial configuration of the built-up areas in China in 2012
| 类型 | 斑块数量/106个 | 斑块密度/(个/km2) | 景观形状指数 | 平均最近邻体距离/m |
|---|---|---|---|---|
| 国家尺度 | 6.8 | 0.71 | 3994.25 | 145.87 |
| 经济区尺度均值 | 0.9 | 1.62 | 1417.47 | 156.48 |
| 城市群尺度均值 | 0.2 | 2.46 | 699.48 | 150.22 |
相较于国家尺度上的结果,经济区尺度的建设用地空间格局更加破碎(表2)。经济区尺度的建设用地平均斑块密度为1.6个/km2,是国家尺度平均 值的2.3倍,其中东部沿海经济区的建设用地空间破碎化程度最高。东部沿海经济区的建设用地 斑块密度指数最高,为4.7个/km2,是国家平均水平的6.6倍(图4(b)),且其建设用地的平均最近邻 距离指数在8个经济区中也是最小,为121.2 m,比国家平均水平低了17%(图4(d))。东部沿海经 济区的建设用地斑块数量在8个经济区中排第二,为1.0×10⁶,占中国建设用地斑块总量的14.3% (图4(a))。此外,经济区尺度的建设用地形状比国家尺度更加简单。八大经济区的建设用地景观形状指数均值为1417.5,仅为国家尺度均值的42%(图4(c))。
图4 2012年中国八大经济区的建设用地空间配置
Fig. 4 The spatial configuration of the built-up areas among China's eight economic zones in 2012
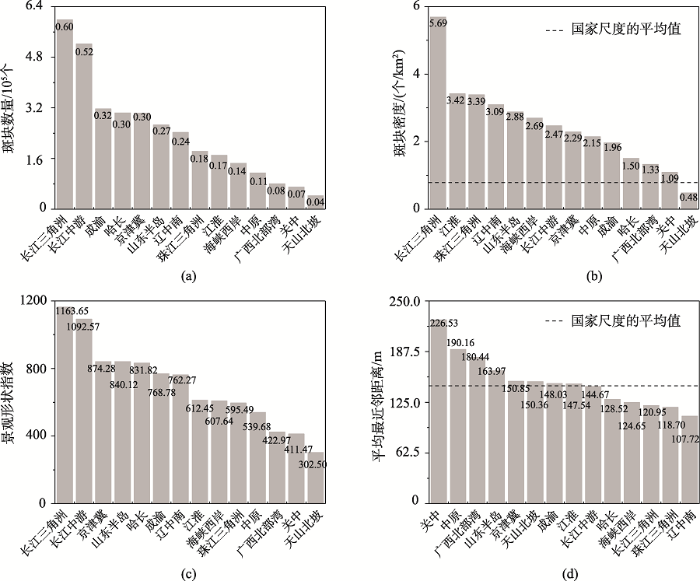
在3个尺度中,城市群尺度上的建设用地空间格局最破碎(表2)。城市群尺度的建设用地平均斑块密度是2.5个/km2,高出国家尺度平均值的2.5倍,其中长江三角洲城市群的空间破碎化程度最高。长江三角洲城市群的建设用地斑块数量在14个城市群中排第一,为0.6×106,占中国建设用地斑块总量的8.8%(图5(a));其建设用地斑块密度为5.7个/km2,高出国家尺度平均值7.0倍(图5(b));其建设用地平均最近邻距离也在14城市群中排最后,为107.7 m,为国家尺度均值的73.85%(图5(d))。从景观形状指数上来看,城市群的建设用地形状比国家尺度更加规则。城市群建设用地的平均景观形状指数仅仅为699.5,是国家尺度对应指数的17.5%(图5(c))。
图5 2012年中国14个城市群的建设用地空间配置
Fig. 5 The spatial configuration of the built-up areas among China's fourteen urban agglomerations in 2012
相较30~1000 m分辨率的建设用地数据,12 m分辨率的建设用地数据具有以下优势:① 12 m分辨率的建设用地数据可以捕捉一些被30~1000 m分辨率数据忽略的小型建设用地[28,29,30]。在遥感影像中,一直存在混合像元的问题[31]。在中低分辨率的建设用地数据中,许多非建设用地像元也包含建设用地,但由于建设用地在像元中的比例未达到一定的阈值,最终被划分为非建设用地;② 12 m分辨率的建设用地数据可以捕捉更多建设用地的空间结构的细节[32,33,34]。在更高分辨率建设用地数据中,建设用地的空间形态更加清晰可辨,为计算建设用地景观指数提供了更好的数据源。例如,Li等[35]分别基于2.44、10和30 m分辨率数据分析了城市绿地空间格局,结果显示在更高分辨率的数据下,城市绿地空间格局越细致,与地表温度数据的负相关性越强。
为了进一步验证12 m分辨率建设用地数据的优势,将本研究结果分别与Kuang等[12] 和Xu等[10]提取的2010年中国30 m和1 km分辨率的城市土地数据进行对比。值得注意的是,Kuang[12]等和Xu等[10]的城市土地数据只包括城市区域中的建设用地,而全球城市足迹数据同时包括了城市和乡村的建设用地。结果表明,基于12 m分辨率获取的建设用地面积远高于其他2套数据的城市土地面积(表3)。国家尺度上,基于12 m分辨率数据提取的建设用地面积分别比30 m和1 km分辨率数据高出了8.3×10⁴ km2和1.1×10⁵ km2,高出的比例达47.6%和62.6%。
表3 不同空间分辨率数据提取建设用地和城市土地的对比
Tab. 3 Comparison of the built-up areas and urban areas derived from datasets with different spatial resolutions (104 km2)
| 尺度 | 12 m分辨率的建设用地面积 | 30 m分辨率的城市土地面积 | 1 km分辨率的城市土地面积 |
|---|---|---|---|
| 国家 | 17.33 | 9.08 | 6.48 |
| 经济区 | 2.20 | 1.14 | 0.81 |
| 城市群 | 0.69 | 0.22 | 0.32 |
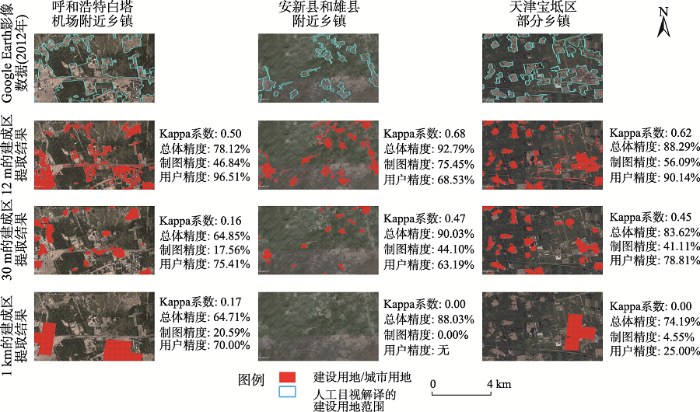
此外,12 m分辨率数据在提取小规模和分散的农村建设用地方面具有较强的优势(图6)。选择了3个城市郊区,采用目视解译的方法在Google Earth影像上勾画建设用地范围,并对比了不同分辨率数据的精度和空间格局。结果显示,基于12 m空间分辨率数据提取到的建设用地面积最大,范围最准确,建筑用地格局特征更精细,而基于1 km分辨率数据会有明显的漏分现象。从空间组成来看,基于12 m空间分辨率的建设用地面积比其他2种分辨率的城市土地面积高出了19.1%~234.5%(表4)。从提取精度来看,12 m空间分辨率的建设用地平均Kappa为0.6,比其他2种分辨率的数据的Kappa高出30.9%~212.5%(图6)。从空间配置来看,基于12 m空间分辨率的建设用地斑块密度和景观形状指数最高,分别比其他2种分辨率数据提取结果高出4.5~245.0倍和1.3~14.8倍(表4)。
图6 不同空间分辨率数据对小规模和农村建设用地的提取对比
Fig. 6 Extraction of small-scale and rural built-up areas from three datasets with difference spatial resolutions
表4 不同空间分辨率数据提取的建设用地空间格局对比
Tab. 4 Comparison of the spatial patterns of the built-up area based on the different spatial resolution data
| 空间组成 | 空间配置 | ||||||
|---|---|---|---|---|---|---|---|
| 建设用地 面积/ km2 | 建设用地 占比/% | 斑块 数量/个 | 斑块密度 /(个/km2) | 景观形状 指数 | 平均最近 邻距离/m | ||
| 呼和浩特白塔 机场附近乡镇 | 目视解译结果 | 21.51 | 23.40 | 33 | 0.36 | 10.59 | 187.14 |
| 12 m空间分辨率 | 13.38 | 19.36 | 156 | 1.90 | 26.95 | 71.78 | |
| 30 m空间分辨率 | 11.23 | 9.29 | 26 | 0.32 | 6.28 | 576.18 | |
| 1 km空间分辨率 | 4.00 | 11.76 | 3 | 0.04 | 1.71 | 4070.37 | |
| 安新县和雄县 附近乡镇 | 目视解译结果 | 14.48 | 9.69 | 22 | 0.15 | 9.19 | 472.65 |
| 12 m空间分辨率 | 15.53 | 13.41 | 302 | 2.61 | 29.23 | 63.49 | |
| 30 m空间分辨率 | 9.88 | 8.53 | 28 | 0.24 | 6.77 | 524.46 | |
| 1 km空间分辨率 | - | - | - | - | - | - | |
| 天津宝坁区 部分乡镇 | 目视解译结果 | 32.75 | 39.89 | 9 | 0.11 | 7.04 | 251.95 |
| 12 m空间分辨率 | 15.89 | 14.56 | 226 | 2.46 | 23.98 | 82.12 | |
| 30 m空间分辨率 | 7.63 | 12.22 | 41 | 0.45 | 8.90 | 299.85 | |
| 1 km空间分辨率 | 10.00 | 4.30 | 1 | 0.01 | 10.59 | - | |
建设用地空间格局的形成既受社会经济发展等要素的驱动,也受地理区位因素的制约[36]。
参考Huang等的研究[37],本文利用皮尔森相关分析方法,分析了城市群建设用地空间格局与社会经济指标的关系。考虑到数据的可获得性,选择的人口指标有3个,分别是年末常住总人口数量、年末城市人口数量和城镇化率;选取的经济指标有4个,分别是国内生产总值、第二产业生产总值、第三产业生产总值和固定资产投资金额。分析表明,城市人口越多、国内生产总值和固定资产投资越高,建设用地斑块数量越多、破碎度越大、形状越复杂(表5)。城市人口、国内生产总值和固定资产投资与建设用地面积、建设用地占比、斑块数量、斑块密度和景观形状指数呈显著正相关,相关系数在0.55~0.95之间。其中,固定资产投资金额和建设用地的景观形状指数之间的相关系数最高,达到0.95(P<0.05)。与此同时,国内生产总值与建设用地的平均最近邻距离指数呈较强的负相关,相关系数等于-0.46(P<0.10)。
表5 城市群尺度社会经济要素与建设用地空间格局的关系
Tab. 5 The relationship between the spatial pattern of built-up areas and socio-economic factors at the urban agglomeration scale
| 空间组成 | 空间配置 | ||||||
|---|---|---|---|---|---|---|---|
| 建设用地 面积/104km2 | 建设用地 占比/% | 斑块 数量/个 | 斑块密度 /(个/km2) | 景观形状 指数 | 平均最近 邻距离/m | ||
| 人口 指标 | 总人口/万人 | 0.78** | 0.42 | 0.89** | 0.55** | 0.88** | -0.30 |
| 城市人口/万人 | 0.76** | 0.57** | 0.83** | 0.70** | 0.77** | -0.31 | |
| 城镇化率/% | -0.14 | 0.14 | -0.25 | 0.03 | -0.37 | 0.21 | |
| 经济 指标 | 国内生产总值/亿元 | 0.91** | 0.71** | 0.85** | 0.79** | 0.84** | -0.46* |
| 第二产业生产总值/亿元 | 0.90** | 0.70** | 0.89** | 0.81** | 0.87** | -0.46* | |
| 第三产业生产总值/亿元 | 0.90** | 0.75** | 0.77** | 0.77** | 0.74** | -0.45 | |
| 固定资产投资金额(不含农户)/亿元 | 0.90** | 0.55** | 0.94** | 0.71** | 0.95** | -0.40 | |
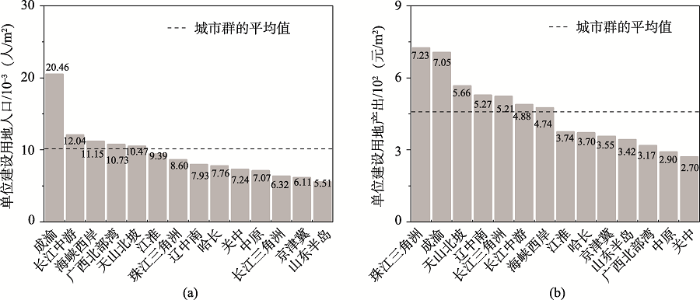
虽然社会经济发展更好的城市群,建设用地形状更破碎和复杂,但是其建设用地集约程度不一定更高(图7)。以长江三角洲为例,其建设用地最为破碎和复杂,但是其单位建设用地的人口只有 6.3×10⁻³人/m2,比城市群均值低32.4%。同时,以天山北坡城市群为例,其建设用地的破碎和复杂程度均最低,但是其单位建设用地的经济产出达到了565.6元/m2,高出城市群平均值25.3%。建设用地的集约性值得在未来的研究中进一步关注。
图7 2012年中国城市群建设用地的集约化水平
Fig. 7 The intensification of the built-up land among urban agglomerations in China in 2012
地理区位因素对建设用地的形成和发展产生一定的影响[38,39,40]。进一步通过Logistic回归探讨了建设用地空间格局与地理区位之间的关系。根据已有研究和数据的可获取性[36, 40-41],分别选择了9个指标,包括高程、坡度、距河流的距离、多年平均气温、多年平均降水、距一般公路的距离、距铁路的距离、距市中心的距离和距县中心的距离。首先,我们对这9个指标进行标准化处理。随后,利用Logistics回归结果的让步比对结果分析。当让步比大于1时,指标的增加增大了建设用地出现的概率。而让步比小于1时,指标的增加会减小建设用地出现的概率。
区位和地形因素深刻影响了中国建设用地的空间分布。回归结果ROC值为0.92,说明选取的这9种因素对建设用地的解释程度较强(表6)。其中,7个因素的让步比小于1。换句话说,距县中心的距离、距市中心的距离、坡度、距一般公路的距离、高程、距离铁路的距离和多年平均降水的增加减少与建设用地的出现有负相关。与之相反,多年平均气温的让步比大于1,这表明温度的升高与建设用地的出现有正相关。而距河流的距离没有通过显著性检验。
表6 2012年中国建设用地Logistics回归结果
Tab. 6 Logistic regression results of the built-up areas in China in 2012
| 变量 | 回归系数 | 标准差 | 显著水平 | 让步比exp(β) | ROC |
|---|---|---|---|---|---|
| 高程 | -6.59 | 0.06 | 0.00 | 1.40×10⁻³ | 0.92 |
| 坡度 | -19.71 | 0.13 | 0.00 | 2.77×10⁻⁹ | |
| 距河流的距离 | 0.63 | 0.45 | 0.16 | 1.87 | |
| 多年平均气温 | 0.33 | 0.02 | 0.00 | 1.39 | |
| 多年平均降水 | -0.50 | 0.02 | 0.00 | 0.61 | |
| 距一般公路的距离 | -12.89 | 0.28 | 0.00 | 3.00×10⁻⁶ | |
| 距铁路的距离 | -1.49 | 0.06 | 0.00 | 0.22 | |
| 距市中心的距离 | -18.97 | 0.16 | 0.00 | 5.79×10⁻⁹ | |
| 距县中心的距离 | -102.87 | 0.50 | 0.00 | 2.11×10-45 | |
| 常数 | -0.28 | 0.01 | 0.00 | 0.76 |
2012年中国建设用地面积为1.7×10⁵ km2,占中国陆地总面积的1.8%。在经济区尺度,建设用地面积主要集中在北部沿海、黄河中游和东部沿海经济区,这3个经济区的建设用地面积共占中国建设用地面积的54.1%。在城市群尺度,中国建设用地面积的一半以上分布在14个城市群之中。2012年中国城市群的建设用地总面积为9.7×10⁴ km2,占中国建设用地总面积的55.9%。
从建设用地的空间格局来看,2012年中国建设用地的斑块数量为6.8×10⁶个,斑块密度为0.7个/km2, 景观形状指数3994.3,平均最近邻体距离为145.9 m。经济区和城市群的建设用地破碎度更高。其中,经济区和城市群建设用地的平均斑块密度分别比国家平均水平高出1.3倍和2.5倍。
社会经济发展和区位要素是影响建设用地空间格局的重要因素。相关分析表明,城市人口、国内生产总值和固定资产投资与建设用地景观指数的相关系数介于0.55~0.94(P<0.05)之间。而Logistic回归表明,高程和距铁路的距离等区位因素会减少建设用地出现的概率,其让步比在1.4×10⁻³和0.6之间。
未来,应该依据不同地区建设用地空间格局存在的问题及其影响因素,制定相应措施,推动中国不同地区建设用地的发展。针对建设用地破碎度高的地区,如西北和长江中游经济区、天山北坡和长江中游城市群,应该避免建设用地无序扩展对自然生境的侵占,保护湿地、森林和草地的连通性。针对未来城市人口和社会经济仍将快速增长的地区,如东部沿海和南部沿海经济区,以及长江三角洲和珠江三角洲城市群,应该对重要的生态用地进行保护,避免建设用地扩展占用重要的生态用地。
另外,本文仅选取了6个景观指数来量化建设用地空间格局主要特征,但是这些指标无法全面反映建设用地空间格局特征;且全球城市足迹数据只有2012年一期,因此无法研究建设用地空间格局的动态。今后可选取更多反映建设用地空间格局特征的景观指数,如聚集度和蔓延度指数,从更多维度衡量建设用地的空间格局。最后,未来可以结合即将发布最新的2015年建设用地数据,实现建设用地空间格局的动态分析。
The authors have declared that no competing interests exist.
| [1] |
How much of the world's land has been urbanized, really? A hierarchical framework for avoiding confusion [J].https://doi.org/10.1007/s10980-014-0034-y URL [本文引用: 1] 摘要
Urbanization has transformed the world’s landscapes, resulting in a series of ecological and environmental problems. To assess urbanization impacts and improve sustainability, one of the first questions that we must address is: how much of the world’s land has been urbanized? Unfortunately, the estimates of the global urban land reported in the literature vary widely from less than 1–302% primarily because different definitions of urban land were used. To evade confusion, here we propose a hierarchical framework for representing and communicating the spatial extent of the world’s urbanized land at the global, regional, and more local levels. The hierarchical framework consists of three spatially nested definitions: “urban area” that is delineated by administrative boundaries, “built-up area” that is dominated by artificial surfaces, and “impervious surface area” that is devoid of life. These are really three different measures of urbanization. In 2010, the global urban land was close to 302%, the global built-up area was about 0.6502%, and the global impervious surface area was merely 0.4502%, of the word’s total land area (excluding Antarctica and Greenland). We argue that this hierarchy of urban land measures, in particular the ratios between them, can also facilitate better understanding the biophysical and socioeconomic processes and impacts of urbanization.
|
| [2] |
Extracting the dynamics of urban expansion in China using DMSP-OLS nighttime light data from 1992 to 2008 [J].https://doi.org/10.1016/j.landurbplan.2012.02.013 URL [本文引用: 1] 摘要
Timely and accurate information about the dynamics of urban expansion is vital to reveal the relationships between urban expansion and the ecosystem, to optimize land use patterns, and to promote the effective development of cities in China. Nighttime stable light data from the Defense Meteorological Satellite Program's Operational Line-scan System (DMSP-OLS) Nighttime Lights Time Series dataset provide a new source of information that can quickly reveal the dynamics of urban expansion. However, the DMSP-OLS sensor has no on-board calibration, which makes it difficult to directly compare time series data from multiple satellites. This study developed a new method for systematically correcting multi-year multi-satellite nighttime stable lights data and rapidly extracting the dynamics of urban expansion based on this corrected data for China from 1992 to 2008. The results revealed that the proposed method effectively reduced abnormal discrepancy within the nighttime stable light data and improved continuity and comparability. The dynamics of urban expansion in China from 1992 to 2008 were extracted with an average overall accuracy of 82.74% and an average Kappa of 0.40. (C) 2012 Elsevier B.V. All rights reserved.
|
| [3] |
|
| [4] |
A global analysis of the impacts of urbanization on bird and plant diversity reveals key anthropogenic drivers [J].https://doi.org/10.1098/rspb.2013.3330 URL PMID: 4027400 [本文引用: 1] 摘要
Abstract Urbanization contributes to the loss of the world's biodiversity and the homogenization of its biota. However, comparative studies of urban biodiversity leading to robust generalities of the status and drivers of biodiversity in cities at the global scale are lacking. Here, we compiled the largest global dataset to date of two diverse taxa in cities: birds (54 cities) and plants (110 cities). We found that the majority of urban bird and plant species are native in the world's cities. Few plants and birds are cosmopolitan, the most common being Columba livia and Poa annua. The density of bird and plant species (the number of species per km(2)) has declined substantially: only 8% of native bird and 25% of native plant species are currently present compared with estimates of non-urban density of species. The current density of species in cities and the loss in density of species was best explained by anthropogenic features (landcover, city age) rather than by non-anthropogenic factors (geography, climate, topography). As urbanization continues to expand, efforts directed towards the conservation of intact vegetation within urban landscapes could support higher concentrations of both bird and plant species. Despite declines in the density of species, cities still retain endemic native species, thus providing opportunities for regional and global biodiversity conservation, restoration and education.
|
| [5] |
Assessing impact of urban impervious surface on watershed hydrology using distributed object-oriented simulation and spatial regression [J].https://doi.org/10.1007/s10708-013-9506-x URL [本文引用: 1] 摘要
In this study, we investigated the relationship between watershed characteristics and hydrology using high spatial resolution impervious surface area (ISA), hydrologic simulations and spatial regression. We selected 20 watersheds at HUC 12 level with different degrees of urbanization and performed hydrologic simulation using a distributed object-oriented rainfall and runoff simulation model. We extracted the discharge per area and ratio of runoff to base flow from simulation results and used them as indicators of hydrology pattern. We derived percentage of ISA, distance from ISA to streams, and stream density as the watershed characteristics to evaluate the relationship with hydrology pattern in watersheds using ordinary least square, spatial error and spatial lag regression models. The comparison indicates that spatial lag regression model can achieve better performance for the evaluation of relationship between ratio of runoff to base flow and watershed characteristics, and that three models provide similar performance for the evaluation of relationship between discharge per area and watershed characteristics. The results from regression analyses demonstrate that ISA plays an important role in watershed hydrology. Ignorance of spatial dependence in analyses will likely cause inaccurate evaluation for relationship between ISA and watershed hydrology. The hydrologic model, regression methods and relationships between watershed characteristics and hydrology pattern provide important tools and information for decision makers to evaluate the effect of different scenarios in land management.
|
| [6] |
中国快速城市化过程中的资源环境保障问题与对策建议 [J].https://doi.org/10.3969/j.issn.1000-3045.2009.05.002 URL [本文引用: 1] 摘要
中国的城市化决定着中国的未来和世界城市化进程,而中国的资源环境保障程度又直接影响着中国城市化的速度与质量.研究表明,过去30年我国城市化进程相对于世界平均状况而言,速度快但水平低.未来20年我国将有超过60%的人口居住在城市,快速城市化进程将带来日益严峻的资源环境保障问题和资源环境剥夺问题.针对这些问题,建议立足资源环境承载能力,从国家安全角度建设资源节约型与环境友好型城市;推行适速适度的城市化发展模式,不断提高城镇化发展质量;在国家"十二五"规划及中长期规划中应淡化城市化增长指标,突出资源环境约束指标;逐步消减快速城市化进程中诱发的资源环境剥夺行为,推进和谐城市化;建立中国城市化的资源环境保障转移机制,推进安全城市化;采用多维指标的领导干部政绩考核机制,以科学的评价机制促进科学的城市化.
Issues of resources and environment protection in China's rapid urbanization process and suggestions on countermeasures [J].https://doi.org/10.3969/j.issn.1000-3045.2009.05.002 URL [本文引用: 1] 摘要
中国的城市化决定着中国的未来和世界城市化进程,而中国的资源环境保障程度又直接影响着中国城市化的速度与质量.研究表明,过去30年我国城市化进程相对于世界平均状况而言,速度快但水平低.未来20年我国将有超过60%的人口居住在城市,快速城市化进程将带来日益严峻的资源环境保障问题和资源环境剥夺问题.针对这些问题,建议立足资源环境承载能力,从国家安全角度建设资源节约型与环境友好型城市;推行适速适度的城市化发展模式,不断提高城镇化发展质量;在国家"十二五"规划及中长期规划中应淡化城市化增长指标,突出资源环境约束指标;逐步消减快速城市化进程中诱发的资源环境剥夺行为,推进和谐城市化;建立中国城市化的资源环境保障转移机制,推进安全城市化;采用多维指标的领导干部政绩考核机制,以科学的评价机制促进科学的城市化.
|
| [7] |
中国特大城市空间增长特征及其原因分析 [J].
1990年以来是中国社会经济改革全面展开的阶段,城市空间增长发生了较大的变化,本文以全国52个特大城市为样本,利用各城市1990-2008年影像图、土地利用现状图等数据,运用空间计量、拓扑结构图示等方法对城市空间增长特征进行了分析。研究表明:1990年以来中国特大城市空间在规模增长上表现出增长速度快且按人口规模等级顺序依次变缓,在要素增长上表现出新型化、多样化变化,在结构增长上出现带状化、多中心化转变,在形态增长上呈分散化、破碎化变化,城市空间增长方式以轴向式和跳跃式为主导,特别是2000年以来这种变化更加明显。工业化进入中高级阶段之后的快速经济增长、快速城市化以及政府GDP导向的政绩观是导致城市空间增长上述变化的主要原因。最后文章针对中国特大城市空间增长规模过度超前、结构松散、形态破碎的问题,提出构建以规模控制、结构优化及空间紧凑性为核心的节约型城市空间增长目标。
Features and causes of urban spatial growth in Chinese metropolises [J].
1990年以来是中国社会经济改革全面展开的阶段,城市空间增长发生了较大的变化,本文以全国52个特大城市为样本,利用各城市1990-2008年影像图、土地利用现状图等数据,运用空间计量、拓扑结构图示等方法对城市空间增长特征进行了分析。研究表明:1990年以来中国特大城市空间在规模增长上表现出增长速度快且按人口规模等级顺序依次变缓,在要素增长上表现出新型化、多样化变化,在结构增长上出现带状化、多中心化转变,在形态增长上呈分散化、破碎化变化,城市空间增长方式以轴向式和跳跃式为主导,特别是2000年以来这种变化更加明显。工业化进入中高级阶段之后的快速经济增长、快速城市化以及政府GDP导向的政绩观是导致城市空间增长上述变化的主要原因。最后文章针对中国特大城市空间增长规模过度超前、结构松散、形态破碎的问题,提出构建以规模控制、结构优化及空间紧凑性为核心的节约型城市空间增长目标。
|
| [8] |
珠三角城市群工业生产空间的时空演化及驱动机制 [J].https://doi.org/10.11821/dlyj201801004 URL [本文引用: 1] 摘要
基于多时相卫星遥感影像和GIS技术,对珠三角城市群不同时期的工业生产空间信息进行精准提取,利用多种模型定量分析了其空间扩展格局与特征,并进一步揭示了影响其时空演化的驱动机制。结果表明:①1990年以来,珠三角城市群的工业生产空间总体上呈现由核心向边缘扩散的特征,且扩展热点格局不断变动,热点区的中心极化作用逐渐减弱;②珠三角城市群工业生产空间的形态变化呈现明显的阶段性和异质性,2007年以前工业生产空间的破碎化程度增加而紧凑性降低,其面积的增加以外部扩展为主,而2007年以后的变化与此相反;③在工业生产空间扩展的不同阶段,驱动机制有所不同,政策因素、经济全球化、区域城镇化以及技术的进步与创新等,推动着珠三角城市群工业生产空间的演化与重构。
Spatio-temporal evolution of industrial production space and its driving mechanisms in Pearl River Delta urban agglomeration [J].https://doi.org/10.11821/dlyj201801004 URL [本文引用: 1] 摘要
基于多时相卫星遥感影像和GIS技术,对珠三角城市群不同时期的工业生产空间信息进行精准提取,利用多种模型定量分析了其空间扩展格局与特征,并进一步揭示了影响其时空演化的驱动机制。结果表明:①1990年以来,珠三角城市群的工业生产空间总体上呈现由核心向边缘扩散的特征,且扩展热点格局不断变动,热点区的中心极化作用逐渐减弱;②珠三角城市群工业生产空间的形态变化呈现明显的阶段性和异质性,2007年以前工业生产空间的破碎化程度增加而紧凑性降低,其面积的增加以外部扩展为主,而2007年以后的变化与此相反;③在工业生产空间扩展的不同阶段,驱动机制有所不同,政策因素、经济全球化、区域城镇化以及技术的进步与创新等,推动着珠三角城市群工业生产空间的演化与重构。
|
| [9] |
Representation of block-based image features in a multi-scale framework for built-up area detection [J].https://doi.org/10.3390/rs8020155 URL [本文引用: 1] 摘要
The accurate extraction and mapping of built-up areas play an important role in many social, economic, and environmental studies. In this paper, we propose a novel approach for built-up area detection from high spatial resolution remote sensing images, using a block-based multi-scale feature representation framework. First, an image is divided into small blocks, in which the spectral, textural, and structural features are extracted and represented using a multi-scale framework; a set of refined Harris corner points is then used to select blocks as training samples; finally, a built-up index image is obtained by minimizing the normalized spectral, textural, and structural distances to the training samples, and a built-up area map is obtained by thresholding the index image. Experiments confirm that the proposed approach is effective for high-resolution optical and synthetic aperture radar images, with different scenes and different spatial resolutions.
|
| [10] |
How did urban land expand in China between 1992 and 2015? A multi-scale landscape analysis [J].https://doi.org/10.1371/journal.pone.0154839 URL PMID: 4856333 [本文引用: 3] 摘要
Effective and timely quantification of the spatiotemporal pattern of urban expansion in China is important for the assessment of its environmental effects. However, the dynamics of the most recent urban expansions in China since 2012 have not yet been adequately explained due to a lack of current information. In this paper, our objective was to quantify spatiotemporal patterns of urban expansion in China between 1992 and 2015. First, we extracted information on urban expansion in China between 1992 and 2015 by integrating nighttime light data, vegetation index data, and land surface temperature data. Then we analyzed the spatiotemporal patterns of urban expansion at the national and regional scales, as well as at that of urban agglomerations. We found that China experienced a rapid and large-scale process of urban expansion between 1992 and 2015, with urban land increasing from 1.22 × 10⁴km2to 7.29 × 10⁴km2, increasing in size nearly fivefold and with an average annual growth rate of 8.10%, almost 2.5 times as rapid as the global average. We also found that urban land in China expanded mainly by occupying 3.31 × 10⁴km2of cropland, which comprised 54.67% of the total area of expanded urban land. Among the three modes of growth—infilling, edge expansion, and leapfrog—edge expansion was the main cause of cropland loss. Cropland loss resulting from edge expansion of urban land totalled 2.51 × 10⁴km2, accounting for over 75% of total cropland loss. We suggest that effective future management with respect to edge expansion of urban land is needed to protect cropland in China.
|
| [11] |
Global mapping of urban built-up areas of year 2014 by combining MODIS multispectral data with VIIRS nighttime light data [J].https://doi.org/10.1080/17538947.2016.1168879 URL [本文引用: 1] 摘要
An improved methodology for the extraction and mapping of urban built-up areas at a global scale is presented in this study. The Moderate Resolution Imaging Spectroradiometer (MODIS)-based multispectral data were combined with the Visible Infrared Imager Radiometer Suite (VIIRS)-based nighttime light (NTL) data for robust extraction and mapping of urban built-up areas. The MODIS-based newly proposed Urban Built-up Index (UBI) was combined with NTL data, and the resulting Enhanced UBI (EUBI) was used as a single master image for global extraction of urban built-up areas. Due to higher variation of the EUBI with respect to geographical regions, a region-specific threshold approach was used to extract urban built-up areas. This research provided 500-m-resolution global urban built-up map of year 2014. The resulted map was compared with three existing moderate-resolution global maps and one high-resolution map in the United States. The comparative analysis demonstrated finer details of the urban built-up cover estimated by the resultant map.
|
| [12] |
The rapid and massive urban and industrial land expansions in China between 1990 and 2010: A CLUD-based analysis of their trajectories, patterns, and drivers [J].https://doi.org/10.1016/j.landurbplan.2015.10.001 URL [本文引用: 3] 摘要
The past two decades saw rapid and massive urbanization and industrialization in China. Despite much research has been reportedly done at local and regional scales, little has been reported on the trajectories, patterns, and drivers of these two intertwining processes at the national level. This is mainly due to the fact that until recently, high resolution spatial data of land use and land cover change were not available at national level. The research reported in this paper aimed to fill this knowledge gap. Employing the China Land Use/Cover Dataset (CLUD), a national land use/cover change database our research team developed over the past decade, we analyzed the two intertwining processes at a 5 year interval from 1990 to 2010 to identify their trajectories, spatiotemporal patterns, and driving forces. Among out key findings are that (1) the nation's urban and industrial land areas increased from 4.8502×0210 4 02km 2 in 1990 to 9.0802×0210 4 02km 2 in 2010; (2) compared to those in the 1990s, the expansion rates of urban land and industrial land in the 2000s were respectively 2.15 and 5.79 times higher; (3) the expansion rates varied significantly across regions, revealing a distinctive spatial pattern with coastal regions being the fastest and the northeastern the slowest; (4) national development strategies and regional land-use policies had prominent impacts on land expansions; while (5) socioeconomic factors along with local and regional land-use policies explained the regional variations.
|
| [13] |
China's urban expansion from 1990 to 2010 determined with satellite remote sensing [J].https://doi.org/10.1007/s11434-012-5235-7 URL [本文引用: 1] 摘要
Based on the same data source of Landsat TM/ETM+ in 1990s, 2000s and 2010s, all urban built-up areas in China are mapped mainly by human interpretation. Mapping results were checked and refined by the same analyst with the same set of criteria. The results show during the last 20 years urban areas in China have increased exponentially more than 2 times. The greatest area of urbanization changed from Northeastern provinces in 1990s to the Southeast coast of China in Jiangsu, Guangdong, Shandong, and Zhejiang in 2010s. Urban areas are mostly converted from croplands in China. Approximately 17750 km croplands were converted into urban lands. Furthermore, the conversion from 2000 to 2010 doubled that from 1990 to 2000. During the 20 years, the most urbanized provinces are Jiangsu, Guangdong, Shandong and Zhejiang. We also analyzed built-up areas, gross domestic production (GDP) and population of 147 cities with a population of greater than 500000 in 2009. The result shows coastal cities and resource-based cities are with high economic efficiency per unit of built-up areas, resource-based cities have the highest population density, and the economic efficiency of most coastal provinces are lower than central provinces and Guangdong. The newly created urban expansion dataset is useful in many fields including trend analysis of urbanization in China; simulation of urban development dynamics; analysis of the relationship among urbanization, population growth and migration; studies of carbon emissions and climate change; adaptation of climate change; as well as land use and urban planning and management.
|
| [14] |
Global mapping of artificial surfaces at 30-m resolution [J].https://doi.org/10.1007/s11430-016-5291-y URL [本文引用: 1] 摘要
Abstract Urbanization is expected to accelerate with population growth and economic development at the global scale. The artificial surface is the main land cover form of urbanization. On the one hand, urbanization provides spaces for industry, economic activities and residence. On the other hand, artificial surfaces change the earth surface to a large extent, thus significantly affecting natural processes such as the heat exchange, hydrological processes and ecological balance. Therefore, the global mapping of artificial surfaces is valuable for both natural science and social science. This study produced the global artificial surface maps at 30-m resolution for two base-years using the satellite images acquired around 2000 and 2010. First, we proposed a new definition of “artificial surface” based on patch level with consideration of its geographic meaning and image features at 30-m resolution. Second, pixel-based and object-based image processing techniques were combined for the extraction of artificial surface patches. Finally, human editing and a quality control system were employed to guarantee the quality of global mapping. Independent accuracy assessments show that the user’s accuracy of this product is higher than 80%. It can be concluded that the product is the most reliable one among all the available global datasets of artificial surfaces (or related types). The data can significantly contribute to various research fields, such as urbanization and ecosystem assessment.
|
| [15] |
Earth observation-supported service platform for the pevelopment and provision of thematic information on the built environment - the Tep-Urban Project [C]. |
| [16] |
Preliminary assessment of the global urban footprint and the global human settlement layer for the city of Milan [C]. |
| [17] |
Breaking new ground in mapping human settlements from space: The global urban footprint [J].https://doi.org/10.1016/j.isprsjprs.2017.10.012 URL [本文引用: 4] 摘要
Today 7.2 billion people inhabit the Earth and by 2050 this number will have risen to around nine billion, of which about 70 percent will be living in cities. Hence, it is essential to understand drivers, dynamics, and impacts of the human settlements development. A key component in this context is the availability of an up-to-date and spatially consistent map of the location and distribution of human settlements. It is here that the Global Urban Footprint (GUF) raster map can make a valuable contribution. The new global GUF binary settlement mask shows a so far unprecedented spatial resolution of 0.4 arcsec ($\sim12 m$) that provides - for the first time - a complete picture of the entirety of urban and rural settlements. The GUF has been derived by means of a fully automated processing framework - the Urban Footprint Processor (UFP) - that was used to analyze a global coverage of more than 180,000 TanDEM-X and TerraSAR-X radar images with 3m ground resolution collected in 2011-2012. Various quality assessment studies to determine the absolute GUF accuracy based on ground truth data on the one hand and the relative accuracies compared to established settlements maps on the other hand, clearly indicate the added value of the new global GUF layer, in particular with respect to the representation of rural settlement patterns. Generally, the GUF layer achieves an overall absolute accuracy of about 85\%, with observed minima around 65\% and maxima around 98 \%. The GUF will be provided open and free for any scientific use in the full resolution and for any non-profit (but also non-scientific) use in a generalized version of 2.8 arcsec ($\sim84m$). Therewith, the new GUF layer can be expected to break new ground with respect to the analysis of global urbanization and peri-urbanization patterns, population estimation or vulnerability assessment.
|
| [18] |
基于主体功能区规划的中国城乡建设用地扩张时空特征遥感分析 [J].https://doi.org/10.11821/dlxb201603001 URL [本文引用: 1] 摘要
21世纪以来,随着中国社会经济的快速发展,城乡建设用地不断扩张,对社会经济和生态环境造成了一系列影响.为了国家可持续发展目标的实现,必须对国土开发空间布局做出科学的规划.为此,一些学者开展了国家主体功能区规划方案研究,其研究成果支持了国家主体功能区规划的制定,该规划于2010年底颁布实施.为分析各类主体功能区在规划颁布前后城乡建设用地变化的特征,评估规划对区域开发的指导作用,及时发现规划实施中的问题,有必要采取有效手段对不同类型主体功能区的国土开发活动进行监测和评估.为此,本研究团队在已完成的2000年和2010年两期全国土地利用变化数据库的基础上,更新了2013年全国土地利用数据库,生成分期的城乡建设用地空间数据集;并对国家尺度各类主体功能区,以及东部、中部、西部、东北4大区域在主体功能区规划颁布前10年间(2000-2010年)和后3年内(2010-2013年)城乡建设用地扩张特征与差异进行了对比分析.结果表明:①总体而言,2013年优化开发区、重点开发区、农产品主产区和重点生态功能区城乡建设用地在该类主体功能区国土面积中的占比明显不同,体现了国土开发按照不同主体功能布局的梯级特征.②与2000-2010年相比,2010-2013年优化开发区城乡建设用地年增长率明显降低,重点开发区、农产品主产区和重点生态功能区建设用地年增长率均大幅增加;其中重点开发区和农产品主产区的城乡建设用地年均扩张面积已经超过了优化开发区;重点生态功能区城乡建设用地年均扩张面积和动态度仍处于最低的水平.③在区域尺度,优化开发区中,长江三角洲地区建设用地年均增量明显高于其他优化开发区;重点开发区中,西部地区在年增加面积和增加速率两方面均高于其他区域;农产品主产区中,东部、中部和西部地区内城乡建设用地年增加面积均超过前10年的2倍,西部地区的年增加速率更是达到前10年的3倍以上;重点生态功能区中,中部地区城乡建设用地的年变化率和动态度的增长均最为显著.④2010-2013年中国城乡建设用地扩张的空间格局和变化特征,在总体上体现了主体功能区规划的梯级开发特征.但是,局部优化开发区、农产品主产区和重点生态功能区建设用地的扩张速度过快,必须切实加强空间管控.研究表明,采用空间格局变化的分析方法,开展主体功能区规划颁布前后两个时期城乡建设用地扩张特征与分阶段区域差异的分析,清晰刻画出不同功能区和不同地区建设用地变化规律及其与主体功能区规划的契合程度,证明了该分析方法的有效性,可据此为未来国土开发空间格局的优化和城乡建设发展提供科学依据.
Remote sensing-based analysis of the spatiotemporal characteristics of built-up area across China based on the plan for major function-oriented zones [J].https://doi.org/10.11821/dlxb201603001 URL [本文引用: 1] 摘要
21世纪以来,随着中国社会经济的快速发展,城乡建设用地不断扩张,对社会经济和生态环境造成了一系列影响.为了国家可持续发展目标的实现,必须对国土开发空间布局做出科学的规划.为此,一些学者开展了国家主体功能区规划方案研究,其研究成果支持了国家主体功能区规划的制定,该规划于2010年底颁布实施.为分析各类主体功能区在规划颁布前后城乡建设用地变化的特征,评估规划对区域开发的指导作用,及时发现规划实施中的问题,有必要采取有效手段对不同类型主体功能区的国土开发活动进行监测和评估.为此,本研究团队在已完成的2000年和2010年两期全国土地利用变化数据库的基础上,更新了2013年全国土地利用数据库,生成分期的城乡建设用地空间数据集;并对国家尺度各类主体功能区,以及东部、中部、西部、东北4大区域在主体功能区规划颁布前10年间(2000-2010年)和后3年内(2010-2013年)城乡建设用地扩张特征与差异进行了对比分析.结果表明:①总体而言,2013年优化开发区、重点开发区、农产品主产区和重点生态功能区城乡建设用地在该类主体功能区国土面积中的占比明显不同,体现了国土开发按照不同主体功能布局的梯级特征.②与2000-2010年相比,2010-2013年优化开发区城乡建设用地年增长率明显降低,重点开发区、农产品主产区和重点生态功能区建设用地年增长率均大幅增加;其中重点开发区和农产品主产区的城乡建设用地年均扩张面积已经超过了优化开发区;重点生态功能区城乡建设用地年均扩张面积和动态度仍处于最低的水平.③在区域尺度,优化开发区中,长江三角洲地区建设用地年均增量明显高于其他优化开发区;重点开发区中,西部地区在年增加面积和增加速率两方面均高于其他区域;农产品主产区中,东部、中部和西部地区内城乡建设用地年增加面积均超过前10年的2倍,西部地区的年增加速率更是达到前10年的3倍以上;重点生态功能区中,中部地区城乡建设用地的年变化率和动态度的增长均最为显著.④2010-2013年中国城乡建设用地扩张的空间格局和变化特征,在总体上体现了主体功能区规划的梯级开发特征.但是,局部优化开发区、农产品主产区和重点生态功能区建设用地的扩张速度过快,必须切实加强空间管控.研究表明,采用空间格局变化的分析方法,开展主体功能区规划颁布前后两个时期城乡建设用地扩张特征与分阶段区域差异的分析,清晰刻画出不同功能区和不同地区建设用地变化规律及其与主体功能区规划的契合程度,证明了该分析方法的有效性,可据此为未来国土开发空间格局的优化和城乡建设发展提供科学依据.
|
| [19] |
城市扩展过程对湿地影响的情景模拟研究——以河北怀来为例 [J].https://doi.org/10.11849/zrzyxb.20160835 URL [本文引用: 1] 摘要
在复杂多变的环境下,情景模拟法因其能考虑突发干扰的影响并能聚焦长期规划而表现出突出的优势.怀来是北京重要的水源地和环境保护屏障,2022年北京-张家口冬奥会的筹办将可能加快怀来的经济发展和城市扩展,进而对湿地的空间压力产生重要影响.因此,论文利用情景模拟法,结合城市扩展模型(land use scenario dynamics-urban,LUSD-urban)和湿地空间压力模型,模拟了趋势外推、城市规划和冬奥会3种情景下怀来未来城市扩展对湿地的空间压力.结果显示城市扩展导致怀来湿地空间压力增大,湿地平均压力从2000年的0.399增加到2013年的0.439,增长了10.03%.同时,湿地空间压力高于0.5的像元比例从6.73%增加到17.42%.3种情景下,2013-2030年怀来的湿地空间压力将增长0.002~0.005.冬奥会的举办将为怀来湿地带来更大的空间压力,冬奥会情景下湿地压力的热点区面积最大,为83.74km2,是3种情景下共有热点区面积的1.44倍,新保安镇、土木镇和沙城镇的非城市用地面临的空间压力较大.因此,怀来县在未来制定城市规划时应充分考虑县内湿地生态系统,在保护湿地资源的基础上有效促进经济的发展.
Scenarios simulation of the spatial stress on wetlands by urban expansion: A case study of Huailai County [J].https://doi.org/10.11849/zrzyxb.20160835 URL [本文引用: 1] 摘要
在复杂多变的环境下,情景模拟法因其能考虑突发干扰的影响并能聚焦长期规划而表现出突出的优势.怀来是北京重要的水源地和环境保护屏障,2022年北京-张家口冬奥会的筹办将可能加快怀来的经济发展和城市扩展,进而对湿地的空间压力产生重要影响.因此,论文利用情景模拟法,结合城市扩展模型(land use scenario dynamics-urban,LUSD-urban)和湿地空间压力模型,模拟了趋势外推、城市规划和冬奥会3种情景下怀来未来城市扩展对湿地的空间压力.结果显示城市扩展导致怀来湿地空间压力增大,湿地平均压力从2000年的0.399增加到2013年的0.439,增长了10.03%.同时,湿地空间压力高于0.5的像元比例从6.73%增加到17.42%.3种情景下,2013-2030年怀来的湿地空间压力将增长0.002~0.005.冬奥会的举办将为怀来湿地带来更大的空间压力,冬奥会情景下湿地压力的热点区面积最大,为83.74km2,是3种情景下共有热点区面积的1.44倍,新保安镇、土木镇和沙城镇的非城市用地面临的空间压力较大.因此,怀来县在未来制定城市规划时应充分考虑县内湿地生态系统,在保护湿地资源的基础上有效促进经济的发展.
|
| [20] |
A daily temperature dataset over China and its application in validating a RCM simulation [J].https://doi.org/10.1007/s00376-009-9029-z URL [本文引用: 1] |
| [21] |
一套格点化的中国区域逐日观测资料及与其它资料的对比 [J].https://doi.org/10.6038/cjg20130406 URL Magsci [本文引用: 1] 摘要
<p>为高分辨率气候模式检验等的需要,基于2400余个中国地面气象台站的观测资料,通过插值建立了一套0.25°×0.25°经纬度分辨率的格点化数据集(CN05.1).CN05.1包括日平均和最高、最低气温,以及降水4个变量.插值通过常用的"距平逼近"方法实现,首先将计算得到的气候平均场使用薄板样条方法进行插值,随后使用"角距权重法"对距平场进行插值,然后将两者叠加,得到最终的数据集.将CN05.1与CN05、EA05和APHRO三种日气温和降水资料(四种资料的分析时段统一为1961—2005年)进行对比,分析了它们对气候平均态和极端事件描述上的不同,结果表明几者总体来说在中国东部观测台站密集的地方差别较小,而在台站稀疏的西部差别较大,相差最大的是青藏高原北部至昆仑山西段等地形起伏较大而很少或没有观测台站的地方,反映了格点化数据在这些地区的不确定性,在使用中应予以注意.</p>
A gridded daily observation dataset over China region and comparison with the other datasets [J].https://doi.org/10.6038/cjg20130406 URL Magsci [本文引用: 1] 摘要
<p>为高分辨率气候模式检验等的需要,基于2400余个中国地面气象台站的观测资料,通过插值建立了一套0.25°×0.25°经纬度分辨率的格点化数据集(CN05.1).CN05.1包括日平均和最高、最低气温,以及降水4个变量.插值通过常用的"距平逼近"方法实现,首先将计算得到的气候平均场使用薄板样条方法进行插值,随后使用"角距权重法"对距平场进行插值,然后将两者叠加,得到最终的数据集.将CN05.1与CN05、EA05和APHRO三种日气温和降水资料(四种资料的分析时段统一为1961—2005年)进行对比,分析了它们对气候平均态和极端事件描述上的不同,结果表明几者总体来说在中国东部观测台站密集的地方差别较小,而在台站稀疏的西部差别较大,相差最大的是青藏高原北部至昆仑山西段等地形起伏较大而很少或没有观测台站的地方,反映了格点化数据在这些地区的不确定性,在使用中应予以注意.</p>
|
| [22] |
|
| [23] |
Urban sustainability: an inevitable goal of landscape research [J].https://doi.org/10.1007/s10980-009-9444-7 URL [本文引用: 1] 摘要
No Abstract available for this article.
|
| [24] |
Fragstats v4: Spatial pattern analysis program for categorical and continuous maps [CP]. |
| [25] |
国家新型城镇化规划(2014-2020年)[R] .National New-type Urbanization Plan (2014-2020)[R] . |
| [26] |
A Regional Categorization for "New-Type Urbanization" in China [J].https://doi.org/10.1371/journal.pone.0134253 URL PMID: 4523198 [本文引用: 1] 摘要
Regional differences in the character of urbanization in China are substantial. The promotion of what has been termed “new-type urbanization” cannot, as a result of these regional differences, be expected to follow a universal approach—rather, such a development must objectively adhere to locational and category-specific principles and adopt differentiated urbanization development models. Regional categorization is often used in geography, but is rarely deployed in research addressing human and social problems relating to urbanization. In March 2014, China published the National New-type Urbanization Plan (2014–2020), which calls for the scientific and reasonable planning of “new-type urbanization,” and appropriate regional categorizations are urgently needed in order to guide this reform. Responding to this challenge, this research engaged in the design of a “dominantly quantitative analysis, qualitatively supplemented” method in order to divide China into 5 main regions and 47 sub-regions in terms of new-type urbanization. The paper discusses the features and key problems of each region. This study introduces a new method for regional categorization, thereby remedying the lack of regional categorization in relation to “new-type urbanization” in China, and ultimately promoting the development of regional categorization in the humanities as a valuable reference for healthy and sustainable Chinese urbanization.
|
| [27] |
中华人民共和国国民经济和社会发展第十三个五年 (2016-2020年) 规划纲要 [R].The 13th Five-Year Plan for Economic and Social Development of the People’s Republic of China (2016-2020) [R]. |
| [28] |
|
| [29] |
Demarcation of prime farmland protection areas around a metropolis based on high-resolution satellite imagery [J].https://doi.org/10.1038/srep37634 URL PMID: 28000668 [本文引用: 1] 摘要
The healthy functioning of arable landscape ecosystems depends on their functional structure and productivity. In view of current global climate change and constant population mobility, the global agricultural industry has to address the effects of such factors on the functional structure of arable lands. In our research on these issues, we combined information on land use/cover changes with... [Show full abstract]
|
| [30] |
Hybrid method for building extraction in vegetation-rich urban areas from very high-resolution satellite imagery [J].https://doi.org/10.1117/1.JRS.11.036017 URL [本文引用: 1] 摘要
A continuous update of building information is necessary in today's urban planning. Digital images acquired by remote sensing platforms at appropriate spatial and temporal resolutions provide an excellent data source to achieve this. In particular, high-resolution satellite images are often used to retrieve objects such as rooftops using feature extraction. However, high-resolution images acquired over built-up areas are associated with noises such as shadows that reduce the accuracy of feature extraction. Feature extraction heavily relies on the reflectance purity of objects, which is difficult to perfect in complex urban landscapes. An attempt was made to increase the reflectance purity of building rooftops affected by shadows. In addition to the multispectral (MS) image, derivatives thereof namely, normalized difference vegetation index and principle component (PC) images were incorporated in generating the probability image. This hybrid probability image generation ensured that the effect of shadows on rooftop extraction, particularly on light-colored roofs, is largely eliminated. The PC image was also used for image segmentation, which further increased the accuracy compared to segmentation performed on an MS image. Results show that the presented method can achieve higher rooftop extraction accuracy (70.4%) in vegetation-rich urban areas compared to traditional methods.
|
| [31] |
深圳市不透水表面的遥感监测与时空格局 [J].https://doi.org/10.11821/yj2012080017 URL [本文引用: 1] 摘要
定量监测城市不透水表面扩展过程,是分析城市景观格局动态,深入剖析城市地区空间镶嵌体内部异质性景观相互转化的重要基础。以深圳市为例,通过定量划分城市不透水表面等级体系,计算不透水表面的转移矩阵与景观格局指数,分析不透水表面的时空动态,结果表明:1990~2005年间,高盖度及极高盖度的不透水表面持续增加,中盖度及低盖度不透水表面先增加后减少,而自然地表及极低盖度的不透水表面则为先减少后恢复,反映了城市化进程对城市地表覆被的结构性影响。景观格局变化显示景观多样性程度较高,且经历了低-高-低-高的变化;斑块在1990年以自然地表为主,1995年以后以中盖度等级为主,高盖度等级显著增加。自然地表和中等盖度的不透水表面变化分别主导着前期和中后期的变化过程。城市建设的迅速扩张,将林地、农田、水体及滩涂等自然地表快速地转变为不同功能的建设用地,主导着不透水表面等级分布的梯度性变化。
Quatifying spatiotemporal patterns dynamics of impervious surface in Shenzhen [J].https://doi.org/10.11821/yj2012080017 URL [本文引用: 1] 摘要
定量监测城市不透水表面扩展过程,是分析城市景观格局动态,深入剖析城市地区空间镶嵌体内部异质性景观相互转化的重要基础。以深圳市为例,通过定量划分城市不透水表面等级体系,计算不透水表面的转移矩阵与景观格局指数,分析不透水表面的时空动态,结果表明:1990~2005年间,高盖度及极高盖度的不透水表面持续增加,中盖度及低盖度不透水表面先增加后减少,而自然地表及极低盖度的不透水表面则为先减少后恢复,反映了城市化进程对城市地表覆被的结构性影响。景观格局变化显示景观多样性程度较高,且经历了低-高-低-高的变化;斑块在1990年以自然地表为主,1995年以后以中盖度等级为主,高盖度等级显著增加。自然地表和中等盖度的不透水表面变化分别主导着前期和中后期的变化过程。城市建设的迅速扩张,将林地、农田、水体及滩涂等自然地表快速地转变为不同功能的建设用地,主导着不透水表面等级分布的梯度性变化。
|
| [32] |
Structural feature modeling of high-resolution remote sensing images using directional spatial correlation [J].https://doi.org/10.1109/LGRS.2014.2306972 URL [本文引用: 1] 摘要
In the classification of high-resolution remote sensing images, spatial correlations between pixel values are important spatial information. Traditional methods of measuring spatial correlation are inadequate for the extraction of spatial information about the shape and structure of object classes. In this letter, we propose a novel method using directional spatial correlation (DSC) to model and extract spatial information in neighborhoods of pixels. Two sets of descriptors DSC_I and DSC_C are defined to describe spatial structural features. The effectiveness of the proposed method was tested by image classification on two data sets. Results show that the DSC-based approach can drastically improve the classification, and it is found by comparison that it has better performance than some existing methods.
|
| [33] |
Global and local saliency analysis for the extraction of residential areas in high-spatial-resolution remote sensing image [J].https://doi.org/10.1109/TGRS.2016.2527044 URL [本文引用: 1] 摘要
Extraction of residential areas plays an important role in remote sensing image processing. Extracted results can be applied to various scenarios, including disaster assessment, urban expansion, and environmental change research. Quality residential areas extracted from a remote sensing image must meet three requirements: well-defined boundaries, uniformly highlighted residential area, and no background redundancy in residential areas. Driven by these requirements, this study proposes a global and local saliency analysis model (GLSA) for the extraction of residential areas in high-spatial-resolution remote sensing images. In the proposed model, a global saliency map based on quaternion Fourier transform (QFT) and a global saliency map based on adaptive directional enhancement lifting wavelet transform (ADE-LWT) are generated along with a local saliency map, all of which are fused into a main saliency map based on complementarities. In order to analyze the correlation among spectrums in the remote sensing image, the phase spectrum information of QFT is used on the multispectral images for producing a global saliency map. To acquire the texture and edge features of different scales and orientations, the coefficients acquired by ADE-LWT are used to construct another global saliency map. To discard redundant backgrounds, the amplitude spectrum of the Fourier transform and the spatial relations among patches are introduced into the panchromatic image to generate the local saliency map. Experimental results indicate that the GLSA model can better define the boundaries of residential areas and achieve complete residential areas than current methods. Furthermore, the GLSA model can prevent redundant backgrounds in residential areas and thus acquire more accurate residential areas.
|
| [34] |
遥感影像空间分辨率对居民地信息提取的影响 [J].
利用遥感手段,以低廉的成本有效获取包括居民地在内的地表信息是促使卫星遥感数据转化为现实生产力的根本所在,也是遥感应用领域中亟待解决的重要课题。目前虽然已有“空间分辨率越高,遥感分类精度也越高”的共性认识,但是遥感影像空间分辨率的不同对于城镇和乡村这两种不同类型的居民地信息提取产生怎样的影响等,目前尚无明确答案。本文首先以同一区域不同空间分辨率的4种卫星遥感影像数据为信息源,定性探讨居民地在不同分辨率遥感影像上的表现特征;然后以两种不同分辨率的影像ALOS和TM为实验对象,对这两种影像上城镇和乡村居民地信息提取精度进行比较分析。结果显示:虽然基于10m-ALOS影像的居民地信息提取精度较30m-TM影像约提高6.09%,并且无论是依据哪一种空间分辨率的遥感影像,城镇居民地的信息提取精度都明显高于乡村居民地,但是,对于分散式分布的乡村居民地,遥感影像空间分辨率的下降令其遥感识别更容易受到周边环境的影响,其信息提取精度会随着遥感影像空间分辨率的增加而显著提高;相比之下,城镇居民地的信息提取精度随遥感影像空间分辨率增加的趋势是有限的。造成这一现象的原因主要在于虽然居民地的轮廓清晰性以及像元的纯净度都与遥感影像的空间分辨率基本上呈正相关,但是空间分辨率的提高会放大居民地内部结构的细节,从而对居民地的遥感识别与信息提取工作增加一些干扰性的噪声信息。
Influence of the varied spatial resolution of remote sensing images on urban and rural residential information extraction [J].
利用遥感手段,以低廉的成本有效获取包括居民地在内的地表信息是促使卫星遥感数据转化为现实生产力的根本所在,也是遥感应用领域中亟待解决的重要课题。目前虽然已有“空间分辨率越高,遥感分类精度也越高”的共性认识,但是遥感影像空间分辨率的不同对于城镇和乡村这两种不同类型的居民地信息提取产生怎样的影响等,目前尚无明确答案。本文首先以同一区域不同空间分辨率的4种卫星遥感影像数据为信息源,定性探讨居民地在不同分辨率遥感影像上的表现特征;然后以两种不同分辨率的影像ALOS和TM为实验对象,对这两种影像上城镇和乡村居民地信息提取精度进行比较分析。结果显示:虽然基于10m-ALOS影像的居民地信息提取精度较30m-TM影像约提高6.09%,并且无论是依据哪一种空间分辨率的遥感影像,城镇居民地的信息提取精度都明显高于乡村居民地,但是,对于分散式分布的乡村居民地,遥感影像空间分辨率的下降令其遥感识别更容易受到周边环境的影响,其信息提取精度会随着遥感影像空间分辨率的增加而显著提高;相比之下,城镇居民地的信息提取精度随遥感影像空间分辨率增加的趋势是有限的。造成这一现象的原因主要在于虽然居民地的轮廓清晰性以及像元的纯净度都与遥感影像的空间分辨率基本上呈正相关,但是空间分辨率的提高会放大居民地内部结构的细节,从而对居民地的遥感识别与信息提取工作增加一些干扰性的噪声信息。
|
| [35] |
Relationship between land surface temperature and spatial pattern of greenspace: What are the effects of spatial resolution? [J].https://doi.org/10.1016/j.landurbplan.2013.02.005 URL [本文引用: 1] 摘要
Urban heat island (UHI) is a worldwide phenomenon, which causes many ecological and social consequences. Urban greenspace can decrease environmental temperature and thus alleviate UHI effects. Spatial pattern of greenspace, both composition and configuration, significantly affects land surface temperature (LST). Results from previous studies, however, showed inconsistent, or even contradictory relationships between LST and spatial pattern of greenspace, suggesting these relationships may be scale dependent (sensitive to spatial resolution). But few studies have explicitly addressed this issue. This paper examines whether the spatial resolution of the imagery used to map urban greenspace affect the relationship between LST and spatial pattern of greenspace, using Beijing, China as a case study. Spatial pattern of greenspace was measured with seven landscape metrics at three spatial resolutions (2.44m, 10m, and 30m) based on QuickBird, SPOT, and TM imagery. LST was derived from thermal band of Landsat TM imagery. The relationship between LST and spatial pattern of greenspace was examined by Pearson correlation and partial Pearson correlation analysis using census tract as analytical unit. Results showed that landscape metrics of greenspace varied by spatial resolution. Imagery with higher spatial resolution could more accurately quantify the spatial pattern of greenspace. The relationship between LST and abundance of greenspace was consistently negative, but the relationship between LST and spatial configuration of greenspace varied by spatial resolution. This study extended our scientific understanding of the effects of spatial pattern, especial spatial configuration of greenspace on LST. In addition, it can provide insights for urban greenspace planning and management.
|
| [36] |
城市扩展多尺度驱动机制分析——以北京为例 [J].
厘清土地利用变化与其驱动力之间的关系,是土地利用变化研究的核心,也是建立变化模型和定量 预测的基础。以北京为研究案例,基于遥感影像和GIS技术,获取了1991-2004年北京城市扩展信息,定量分析比较了1991-2004年北京地区面 状、线状和点状三种城市扩展空间过程。并从宏观、中观和微观三个尺度上,分析了北京城市扩展过程的驱动机制。结果表明:①城镇用地扩展过程显著,城镇用地 在区域总面积中所占比例从1991年的9.80%增长到2004年的17.93%;②城市化过程,主要表现为点状、线状和面状城市化三种基本模式;③宏 观、中观和微观三层次的驱动因子影响城市扩展过程。宏观尺度上,城市规划,土地利用政策等政府行为和过去三千年城市发展形成的旧有城市格局从根本上决定了 现代北京城市发展的基本风貌和格局;在中观尺度上社会和经济因素为城市扩展提供了驱动力,最明显的是人口增长和人民生活水平的提高;微观尺度的地形、区位 和交通限制决定了城市扩展的可能性,最利于城市扩展的因子是距高速公路的距离。三者综合作用的结果是1991-2004年北京城市化强度出现一个先增长后 减小的发展趋势。
Understanding multi-scale urban expansion driving forces: In the case study of Beijing [J].
厘清土地利用变化与其驱动力之间的关系,是土地利用变化研究的核心,也是建立变化模型和定量 预测的基础。以北京为研究案例,基于遥感影像和GIS技术,获取了1991-2004年北京城市扩展信息,定量分析比较了1991-2004年北京地区面 状、线状和点状三种城市扩展空间过程。并从宏观、中观和微观三个尺度上,分析了北京城市扩展过程的驱动机制。结果表明:①城镇用地扩展过程显著,城镇用地 在区域总面积中所占比例从1991年的9.80%增长到2004年的17.93%;②城市化过程,主要表现为点状、线状和面状城市化三种基本模式;③宏 观、中观和微观三层次的驱动因子影响城市扩展过程。宏观尺度上,城市规划,土地利用政策等政府行为和过去三千年城市发展形成的旧有城市格局从根本上决定了 现代北京城市发展的基本风貌和格局;在中观尺度上社会和经济因素为城市扩展提供了驱动力,最明显的是人口增长和人民生活水平的提高;微观尺度的地形、区位 和交通限制决定了城市扩展的可能性,最利于城市扩展的因子是距高速公路的距离。三者综合作用的结果是1991-2004年北京城市化强度出现一个先增长后 减小的发展趋势。
|
| [37] |
A global comparative analysis of urban form: Applying spatial metrics and remote sensing [J].https://doi.org/10.1016/j.landurbplan.2007.02.010 URL [本文引用: 1] 摘要
Currently, debates over urban form have generally focused on the contrast between the “sprawl” often seen as typical of the United States and “compact” urban forms found in parts of Europe. Although these debates are presumed to have implications for developing worlds as well, systematic comparison of urban forms between developed and developing countries has been lacking. This paper utilized satellite images of 77 metropolitan areas in Asia, US, Europe, Latin America and Australia to calculate seven spatial metrics that capture five distinct dimensions of urban form. Comparison of the spatial metrics was firstly made between developed and developing countries, and then among world regions. A cluster analysis classifies the cities into groups in terms of these spatial metrics. The paper also explored the origins of differences in urban form through comparison with socio-economic developmental indicators and historical trajectories in urban development. The result clearly demonstrates that urban agglomerations of developing world are more compact and dense than their counterparts in either Europe or North America. Moreover, there are also striking differences in urban form across regions.
|
| [38] |
A self-modifying cellular automation model of historical urbanization in the San Francisco bay area [J].https://doi.org/10.1068/b240247 URL [本文引用: 1] |
| [39] |
北京市土地利用空间格局演化模拟及预测 [J].https://doi.org/10.18306/dlkxjz.2015.08.005 URL [本文引用: 1] 摘要
土地利用空间格局的演化模拟可定量地从空间尺度揭示区域土地利用变化的驱动因素,是厘清未来时期内土地变化的重要途径.基于CLUE-S模型,以北京市为研究案例,结合1985、2000和2010年三期土地利用数据,运用Logistic逐步回归方法识别了北京市各种土地利用类型演化的驱动因素,对北京市土地利用空间格局进行模拟.在此基础上,基于北京市社会经济发展、土地利用规划、资源禀赋及生态保护等不同情景,对北京市2020年土地利用空间分布格局进行模拟及预测.结果表明:①不同的时期内,驱动因子对不同土地利用类型的影响呈现差异性,其中交通因素及社会经济因素对土地利用类型的转化率影响较显著,坡度对各个土地利用类型的影响较大.②通过对2010年北京市土地利用变化的模拟结果来看,Kappa指数为87.03%,说明预测结果与实际土地利用情况有较好的一致性.③预测结果显示,北京市的城市发展均表现为继续向外扩展,且以东南、东北为主要扩展方向,但扩张的程度存在差异.
Simulation and projection of land-use change in Beijing under different scenarios [J].https://doi.org/10.18306/dlkxjz.2015.08.005 URL [本文引用: 1] 摘要
土地利用空间格局的演化模拟可定量地从空间尺度揭示区域土地利用变化的驱动因素,是厘清未来时期内土地变化的重要途径.基于CLUE-S模型,以北京市为研究案例,结合1985、2000和2010年三期土地利用数据,运用Logistic逐步回归方法识别了北京市各种土地利用类型演化的驱动因素,对北京市土地利用空间格局进行模拟.在此基础上,基于北京市社会经济发展、土地利用规划、资源禀赋及生态保护等不同情景,对北京市2020年土地利用空间分布格局进行模拟及预测.结果表明:①不同的时期内,驱动因子对不同土地利用类型的影响呈现差异性,其中交通因素及社会经济因素对土地利用类型的转化率影响较显著,坡度对各个土地利用类型的影响较大.②通过对2010年北京市土地利用变化的模拟结果来看,Kappa指数为87.03%,说明预测结果与实际土地利用情况有较好的一致性.③预测结果显示,北京市的城市发展均表现为继续向外扩展,且以东南、东北为主要扩展方向,但扩张的程度存在差异.
|
| [40] |
21世纪初中国土地利用变化的空间格局与驱动力分析 [J].https://doi.org/10.3321/j.issn:0375-5444.2009.12.001 URL [本文引用: 2] 摘要
在全球环境变化研究中,以土地利用与土地覆盖动态为核心的人类-环境耦合系统研究逐渐成为土地变化科学(LCS)研究的新动向。基于覆盖中国21世纪初5年间隔的遥感卫星数据获取的1km网格土地利用变化空间信息,依据近5年土地利用变化区域分异的显著特征,以及自然地理、经济发展与国家宏观政策因素综合考虑,设计针对21世纪初5年新的中国土地利用动态区划图,揭示土地利用变化的空间格局与驱动因素。总体上,21世纪初5年中国处于土地利用快速变化期,黄淮海平原、东南沿海地区与四川盆地城乡建设用地显著扩张,占用大规模优质农田,导致南方水田面积明显减少;西北绿洲农业发展与东北地区开垦导致北方旱地面积略有增加;受西部开发"生态退耕"政策的影响中西部地区林地面积显著增加,国家退耕还林还草政策成效明显,对区域土地覆盖状况的改善产生积极的影响;这一时段国土开发与区域发展战略的实施,包括"西部大开发"、"东北振兴"等国家重大政策,加之快速的经济发展是该阶段土地利用变化格局形成的主要驱动因素。
Spatial patterns and driving forces of land use change in China in the early 21st century [J].https://doi.org/10.3321/j.issn:0375-5444.2009.12.001 URL [本文引用: 2] 摘要
在全球环境变化研究中,以土地利用与土地覆盖动态为核心的人类-环境耦合系统研究逐渐成为土地变化科学(LCS)研究的新动向。基于覆盖中国21世纪初5年间隔的遥感卫星数据获取的1km网格土地利用变化空间信息,依据近5年土地利用变化区域分异的显著特征,以及自然地理、经济发展与国家宏观政策因素综合考虑,设计针对21世纪初5年新的中国土地利用动态区划图,揭示土地利用变化的空间格局与驱动因素。总体上,21世纪初5年中国处于土地利用快速变化期,黄淮海平原、东南沿海地区与四川盆地城乡建设用地显著扩张,占用大规模优质农田,导致南方水田面积明显减少;西北绿洲农业发展与东北地区开垦导致北方旱地面积略有增加;受西部开发"生态退耕"政策的影响中西部地区林地面积显著增加,国家退耕还林还草政策成效明显,对区域土地覆盖状况的改善产生积极的影响;这一时段国土开发与区域发展战略的实施,包括"西部大开发"、"东北振兴"等国家重大政策,加之快速的经济发展是该阶段土地利用变化格局形成的主要驱动因素。
|
| [41] |
关中地区土地利用格局模拟与驱动力分析 [J].
选取陕西省关中地区海拔高度、坡度、多年平均降雨量、河网密度、交通网密度、GDP和人口密度等自然和社会经济数据,通过随机空间采样,建立2000年关中地区土地利用类型的空间分布概率多元逻辑回归模型。根据所建立的模型,运用GIS技术和结合2000年相关数据,模拟出2000年该区域的土地利用空间分布格局,研究结果表明,林地的模拟准确率为91.7%,耕地的模拟准确率能达到86.3%,草地的模拟准确率为68.7%,对关中地区的土地利用格局的驱动作用具有较好的解释。
Simulation and driving force analysis of land use pattern in Guanzhong region, Shaanxi Province [J].
选取陕西省关中地区海拔高度、坡度、多年平均降雨量、河网密度、交通网密度、GDP和人口密度等自然和社会经济数据,通过随机空间采样,建立2000年关中地区土地利用类型的空间分布概率多元逻辑回归模型。根据所建立的模型,运用GIS技术和结合2000年相关数据,模拟出2000年该区域的土地利用空间分布格局,研究结果表明,林地的模拟准确率为91.7%,耕地的模拟准确率能达到86.3%,草地的模拟准确率为68.7%,对关中地区的土地利用格局的驱动作用具有较好的解释。
|

/
| 〈 |
|
〉 |

