樊智宇 , 詹庆明, 刘慧民
FAN Zhiyu, ZHAN Qingming, LIU Huimin
通讯作者:
收稿日期: 2018-09-29
修回日期: 2018-11-23
网络出版日期: 2019-02-20
版权声明: 2019 《地球信息科学学报》编辑部 《地球信息科学学报》编辑部 所有
基金资助:
作者简介:
作者简介:樊智宇(1996-),男,江苏抚州人,硕士生,主要从事城市遥感与城市大数据分析的研究。E-mail: zhiyufan@whu.edu.cn
展开
摘要
城市化的不断发展使自然地表不断被不透水面所取代,城市地表温度高于乡村,形成了显著的热岛效应。城市热岛给城市生态发展与人类健康带来了严重的负面影响,对其空间模式与背后形成机制的研究意义重大。本文以武汉市为例,基于2001、2007和2016年夏季Landsat系列影像使用辐射传导方程法反演了城市地表温度,并采用MOD11A1数据进行了验证;同时,计算了不同时期的城市温度等级和热岛比例指数,分析了城市热岛的时空变化。此外,为了探究热岛效应形成的主要原因,即不透水面与热环境的关系,全局角度使用多元线性回归分析对比了其增温效果与植被水体降温效果的强弱,空间局部角度采用地理加权回归结合地形数据得到了其增温强度的时空变化。结果表明:① 辐射传导方程法适用于实验中研究区的反演;武汉市城市热岛比例指数先增后减,但温度等级高的地区仍在不断扩张;② 多元线性回归可以准确地反映不同地表覆盖对地表温度的影响,
关键词:
Abstract
With the advancement of urbanization, natural land cover has been continuously replaced by impervious surface which resulted in the phenomenon of Urban Heat Island (UHI). UHI can lead to serious negative effects on urban ecology and residents' health, so is of great significance to study the corresponding spatial pattern and dynamic change. Based on 3 summer Landsat images acquired in 2001, 2007 and 2016 of Wuhan, this paper retrieved Land Surface Temperature (LST) using Radiative Transfer Function (RTF) method and verified the results by MOD11A1 which is the daily LST product of MODIS. Furthermore, LST grade and UHI ratio index (URI) were calculated to analyze the corresponding spatial-temporal variation. We also explored the relationship between LST and impervious surface. Globally, the multiple linear regression method was applied to compare the heating effect of impervious surface with the cooling effect of vegetation and water. Locally, we used Geographically Weighted Regression (GWR) to analyze the spatial-temporal variation of the heating effect of impervious surface combined with topographic data. The results indicated that: ① RTF method is suitable for retrieving LST in the study area. URI of Wuhan ascended from 0.42 in 2001 to 0.54 in 2007, and then descended to 0.51 in 2016. However, the areas with high temperature are still expanding; ② The multiple linear regression achieved a desirable fitting accuracy with R^2 being 0.910 because it covered the impact of 3 land cover types on LST simultaneously. Overall, the heating effect caused by impervious surface in Wuhan is stronger than the cooling effect caused by vegetation, but weaker than the cooling effect caused by water; ③ From 2001 to 2016, the distribution of areas with high heating effect of impervious surface showed a trend from "single center" to "multi-center". The original single center which is located in the center of city expanded to multiple center areas covering the districts near the Third Ring Road such as Hanyang Zhuankou Industrial Area, Qingshan Industrial Area, Yangluo Open Economic Zone and Dongxihu District. Therefore, the UHI phenomenon in Wuhan is still serious in summer. The heating effect of impervious surface is intensifying in suburb areas. So urban planners should pay more attention to these areas to mitigate the heat stress.
Keywords:
近年来,城市化的不断发展给人类文明带来进步的同时也引发了许多生态环境问题。城市的扩张使下垫面结构和类型发生了巨大变化,许多植被、水体等自然地表被建筑、道路等热容量大、反照率小的不透水面所取代[1,2]。在不透水面大量分布的情况下,城市热环境不断恶化,地表温度不断上升,形成了城市热岛效应(Urban Heat Island, UHI)[3,4]。作为城市气候的主要特征,热岛效应一直是城市生态研究的重点问题之一[5],其表征的城市高温不仅加剧了空气污染的形成,影响了居民的身体健康,还极大地增加了夏季能源的消耗,导致全球变暖问题更加显著[6,7,8]。因此研究城市热岛和明析不透水面对地表温度的影响对于优化人居环境与提升城市品质有重要的意义。
随着对地观测技术的发展,基于遥感影像进行热岛效应等城市热环境问题的研究受到了广泛关注[9]。利用遥感影像进行大范围的地表温度反演可以对城市热岛问题进行定量分析,探究时间变化与空间分布的特点[10,11]。目前使用较多的反演方法包括辐射传导方程法(大气校正法)、单窗算法和劈窗算法等[12,13,14,15],其中辐射传导方程法因为适用于任何热红外波段而被广泛使用[16]。另外,通过遥感影像还可以对城市土地覆盖进行分类,识别不透水面,进而分析城市热环境问题出现的原因[17,18,19]。
针对城市热岛与不透水面关系问题的研究,有的学者从全局尺度进行定量分析,探究了不透水面增温的影响[20,21],但无法反映其空间差异;还有的学者从局部角度研究了不透水面与地表温度关系的空间非平稳性[10-11,22],但研究尺度较大且没有结合多时相与其他空间数据,不能很好地反映城市特别是大城市内部不透水面对城市地表温度影响的时空变化。因此,本文基于武汉市夏季多时相Landsat系列影像采用辐射传导方程法反演并对城市热岛进行分析,同时使用支持向量机方法对土地覆盖进行监督分类提取不透水面;针对城市热岛与不透水面关系的研究,全局角度使用多元线性回归比较不透水面增温效果与植被水体降温效果的强弱,空间局部角度采用地理加权回归(Geographically Weight Regression, GWR)辅助以地形数据分析武汉市不透水面增温强度的时空变化。这一研究将揭示武汉市夏季热岛和不透水面增温强度的时空分布规律,为武汉市建设国家中心城市的生态规划、用地合理布局等提供实践和理论依据。
武汉市(113°41′ E-115°05′ E,29°58′ N-31°22′ N)位于江汉平原东部,由武昌、汉口、汉阳三镇组成。气候上,武汉地处北亚热带季风区,雨量充沛,热量丰富,春秋季较短,夏热冬冷。地形上,总体为平原地形,市区内有少量丘陵,大部分地区海拔高程在50 m以下。从2001-2016年武汉市人口增长率达到41%,目前人口城镇化率也已突破80%大关,城市化过程剧烈,不透水面扩张显著。与此同时,武汉市素来有“火炉”之称,夏季最高气温经常在35 ℃以上,部分地区地表温度甚至高于55 ℃,热环境问题十分突出。因此,该城市是研究不透水面与城市热岛关系的理想选择。
2.2.1 Landsat系列数据
本文使用2001年7月22日的Landsat7 ETM+影像、2007年7月31日的Landsat5 TM影像和2016年7月23日的Ladnsat8 OLI/TIRS影像进行实验。影像成像时间都为7月下旬,不同年份日期间隔不超过10 d,能够代表各年份夏季热环境状况;同时气象条件相近,便于进行比较,具体信息如表1所示。所有影像均获取于美国地质调查局官网(http://glovis.usgs.gov)。
表1 影像相关信息
Tab. 1 Related information of images
| 卫星 | 影像日期 | 成像时间 | 气象温度/℃ | 相对湿度/% | 气压/kpa | 风向 | 风速/ mph |
|---|---|---|---|---|---|---|---|
| Landsat7 | 2001-07-22 | 10:56AM | 34 | 63 | 100.2 | SW | 13 |
| Landsat5 | 2007-07-31 | 10:49AM | 35 | 67 | 100.2 | SW | 9 |
| Landsat8 | 2016-07-23 | 10:45AM | 35 | 59 | 100.2 | SSW | 13 |
所有影像在ENVI 5.3中进行几何校正、辐射定标、大气校正和影像裁剪等预处理工作;使用监督分类器支持向量机采用目视解译的方式将影像分为不透水面、植被、水体和裸土4类。所有分类的精度和Kappa系数均达标,其中2001年7月22日影像分类总精度94.66%,Kappa系数0.95;2007年7月31日影像分类总精度91.22%,Kappa系数0.92;2016年7月23日影像分类总精度92.28%,Kappa系数0.93。
2.2.2 地形数据
已有学者的研究表明,地形数据对地表温度有很大影响[23,24]。因此在进行地理加权回归分析时,可以将地形数据作为辅助加入自变量中用以反映空间差异。实验采用SRTM(Shuttle Radar Topography Mission)数字高程模型数据(Digital Elevation Model, DEM)、SRTM坡向数据和SRTM坡度数据等地形数据。所有地形数据获取于地理空间数据云(http://www.gscloud.cn/)。
影像地表温度反演采用辐射传导方程法进行,其根据实时的大气探测数据去除大气对辐射传输的影响,从而获得真实的地面辐射数据。算法认为传感器接收到的热红外辐射亮度值
式中:
表2 辐射传导方程法相关参数
Tab. 2 Parameters of radiative transfer equation-based method
| 卫星 | ||
|---|---|---|
| Ladnsat5 | 607.76 | 1260.56 |
| Ladnsat7 | 666.09 | 1282.71 |
| Ladnsat8 | 774.89 | 1321.08 |
线性回归分析是求解相关关系中运用最广泛的一种方法,形式如式(3)所示。
式中:
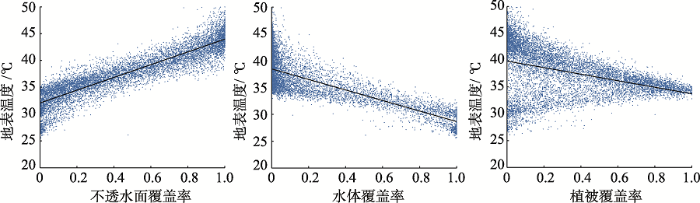
已有研究表明,不透水面对地表温度有增加作用,植被和水体对地表温度有降低作用,它们与地表温度的关系可以用线性回归表达,其中的回归系数可以直观地表示3种地物对地表温度的影响程 度[26,27]。当建立单个地类覆盖率与地表温度的一元线性回归方程时,会出现一些问题:如某区域植被在覆盖率较小时,对应的地表温度可能由于不透水面覆盖率较大变得很高,也可能由于水体覆盖率较大变得很低,导致线性回归难以解释变量间的关系,故将植被、水体和不透水面三者覆盖率进行多元回归是更稳健的选择。就研究尺度而言,Wang等[28]以武汉市为例论述了地表温度在现象层面,以及其与地表覆盖关系的机制层面最佳作用尺度均为500~650 m,故实验研究尺度确定为500 m。
因此,为了更可靠地从全局角度比较不透水面增温效果与植被水体降温效果的强弱,本文以2016年7月23日影像为例,根据分类结果计算500 m尺度下植被、水体和不透水面的覆盖率,建立三者与地表温度的多元线性回归模型。另外,实验还分别建立了三者与地表温度的一元线性回归模型用作对比。具体结果分析见第4.2节。
传统的线性回归是全局回归方法,只能反映系数在区域整体上的平均拟合,不能反映空间局部上的变化。武汉市作为一个市域面积8000 km2以上的全国中心城市,城市内部不同区域环境复杂,考虑不透水面对地表温度影响的空间异质性将有利于城市规划更加细化和明确的治理热岛效应。因此,本文将进一步在500 m尺度下使用局部回归方法——地理加权回归来研究武汉市不透水面增温强度的时空变化。
地理加权回归结合了空间分析的原理,将传统线性回归在空间展开,考虑了地理位置变化造成的变量间关系改变[29,30,31]。GWR通过建立空间范围内每一个对象处的局部线性回归方程来拟合自变量与因变量之间的关系,可以很好地解释其随着地理位置变化而变化的“空间非平稳性”。
与传统的线性回归方法类似,GWR的形式也是因变量由几个自变量线性组合加上拟合误差的表达,如式(4)所示。
式中:
式中:
武汉市内存在许多大面积自然湖泊,这些区域的不透水面覆盖率基本为0。如果不考虑这一因素进行回归将导致湖泊处不透水面覆盖率的回归系数极大,影响模型的准确性。因此,本文将以不透水面覆盖率、水体覆盖率和空间地形数据作为自变量,地表温度作为因变量,采用地理加权回归研究武汉市不透水面增温强度的时空分布特点。
根据辐射传导方程法的原理,本文对3幅影像(2001-07-22日、2007-07-31、2016-07-23)进行了反演,并将结果重采样与MOD11A1数据进行比较。MOD11A1(MODIS每日地表温度产品)为Terra卫星获取的地表温度产品,获取来源为NASA官网(https://lpdaac.usgs.gov)。Terra卫星的过境时间为每天10:30 AM,与实验所用Landsat影像的成像时间相近,因此可以将MOD11A1产品用于验证辐射传导方程法反演结果的准确性。MOD11A1产品的像元值需经过转换才能变为地表温度值,公式如式(6)所示[32]。表3展示了对比的结果。
表3 Landsat影像反演结果与MOD11A1产品统计值对比
Tab. 3 Statistical values comparison of Landsat images' retrieval results and MOD11A1(℃)
| 数据 | 2001年7月22日 | 2007年7月31日 | 2016年7月23日 | ||||||
|---|---|---|---|---|---|---|---|---|---|
| 最小温度 | 最大温度 | 平均温度 | 最小温度 | 最大温度 | 平均温度 | 最小温度 | 最大温度 | 平均温度 | |
| MOD11A1 | 28.39 | 48.57 | 37.54 | 25.55 | 44.45 | 34.77 | 25.29 | 46.10 | 36.22 |
| Landsat影像反演 | 28.84 | 54.29 | 39.06 | 25.74 | 47.87 | 35.20 | 25.92 | 52.96 | 37.26 |
从表3可看出,3幅影像反演结果的统计值都要大于MOD11A1产品,最小值的差值分别为0.45 、0.19 、0.63 ℃,最大值的差值分别为5.72 、3.42、6.86 ℃,平均值差值分别为1.52、0.43、1.04 ℃。最大值受到某些热源区域如工业区的影响差距较大,但是反映研究区总体情况的平均值的差值很小且最小值的差值也较小,因此可以认为使用辐射传导方程法反演地表温度适用于本次实验。
本文基于反演得到的地表温度数据计算了每幅影像的相对地温,计算公式如式(7)所示[33]。
式中:
式中:
2001、2007和2016年城市热岛比例指数的计算结果分别为0.42、0.54、0.51,说明武汉市总体热岛效应程度先增加后减少。结合温度等级的时空分布,2001-2016年,以高温区为代表的城市热岛分布范围在不断扩大,从最开始集中于武昌、汉口、青山等中心城区和工业区,到最后延伸至城市周边的汉阳、江夏、光谷高新区等地。对于武昌、汉口等中心城区,在2007年时有大量高温区集聚分布,到2016年已大为减少,取而代之的是更多的中温区和较高温区;工业区中存在大量极高温区,一直是城市中热岛效应最为显著的区域,例如青山和沌口等地;一些城市新发展区(如江夏、汉南、东西湖区、光谷高新区等)自2007年开始也出现了集中连片的高温区,热岛效应不断增强。因此,武汉市工业区和城市周边新发展区的热环境情况不容乐观,但中心城区的热岛效应已经有所缓解,总体上城市热岛效应程度在2007年时最强,到2016年有所减弱。
不透水面覆盖率、水体覆盖率和植被覆盖率与地表温度的多元线性回归模型及三者分别与地表温度的一元线性回归模型如表4所示,3个一元回归模型的可视化如图2所示。从表4结果可以很明显的看到,单将水体或是植被的覆盖率与地表温度进行一元线性回归,拟合系数
图2 不透水面、水体和植被与地表温度回归模型
Fig. 2 Impervious surface-land , water-land and vegetation-land surface temperature regression model
表4 回归模型建立结果
Tab. 4 The results of regression models
| 模型名称 | 回归公式 | 类型 | 拟合系数 |
|---|---|---|---|
| 不透水面-地表温度 | 一元回归 | 0.812 | |
| 水体-地表温度 | 一元回归 | 0.607 | |
| 植被-地表温度 | 一元回归 | 0.166 | |
| 不透水面、水体、植被-地表温度 | 多元回归 | 0.910 |
另外,从多元线性回归模型建立的结果发现,总体上武汉市不透水面的增温效果小于水体的降温效果并大于植被的降温效果。不透水面覆盖率前的回归系数为5.05,水体覆盖率前的回归系数为-9.89,植被覆盖率前的回归系数为-4.70。因此,理想来看,如果区域有10%的不透水面转为植被,地表温度将下降1 ℃左右;如果区域有10%的不透水面转为水体,地表温度将下降1.5 ℃左右。
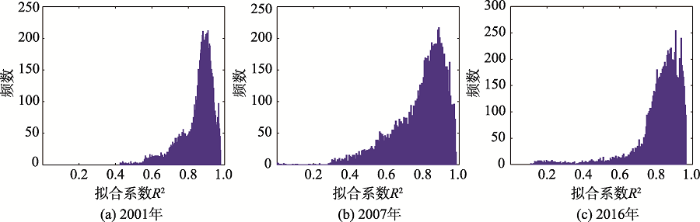
本文采用地理加权回归模型(GWR)进一步分析了武汉市不透水面增温强度的时空变化,得到不同年份不透水面覆盖率与地表温度的空间局部回归方程。其中,不透水面覆盖率的系数代表了某区域不透水面对地表温度的影响程度,值越大说明增加同样面积的不透水面地表温度增加越多,即不透水面增温强度越大。模型的全局
表5 GWR全局拟合系数结果
Tab. 5 Global fitting coefficients of GWR
| 拟合系数 | 2001-07-22 | 2007-07-31 | 2016-07-23 |
|---|---|---|---|
| 0.918 | 0.915 | 0.929 | |
| 0.917 | 0.914 | 0.928 |
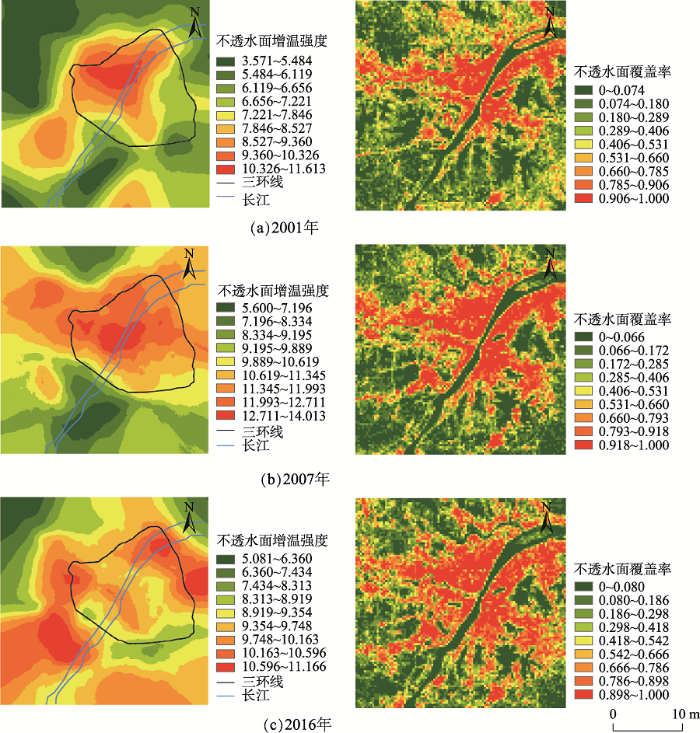
图4 不透水面增温强度与不透水面覆盖率分级
Fig. 4 Grades of temperature increasing intensity of impervious surface and impervious surface coverage rate
所有GWR全局拟合系数
2001年7月22日的结果中,不透水面增温强度较大的区域主要集中在武昌汉口的中心城区,基本和不透水面覆盖率高的区域吻合。汉口三环线以外区域的不透水面增温强度也较大,经过影像判读发现该地区当时存在大量大棚用地以及施工建筑用地,辐射率较高,导致该地区不透水面增温强度以及地表温度较高。以这些地区为中心,越往外不透水面增温强度越弱,同时东西方向的增温强度递减速度慢于南北方向的递减速度,整个不透水面增温强度较高的区域呈现南北方向为短轴的椭圆形分布,这与当时武汉市着力建设东西部新城有关。
2007年7月31日的结果中,不透水面增温强度以城市中心最高,向外辐射递减的“单中心”分布模式更加明显。与2001年的结果相比,不透水面覆盖率高的地区向南北方向进一步扩展,增温强度较高区域的分布也更为集中和规整,呈现类似于圆形的分布。另外,随着原先东西部新城的完工,武汉市东西部不透水面的增温强度相对之前有所下降。在中心城区,不透水面增温强度最高的区域大多分布在汉口地区,武昌地区虽然不透水面覆盖率仍然较高但是其回归系数较前一时期的相对等级有所减弱。同时,汉阳和江夏等城市外围地区的回归系数较2001年的相对等级更高。
2016年7月23日的结果中,不透水面增温强度的分布与之前的“单中心”模式相比有了很大的差别;强度较高的区域分散集中在三环线附近的汉阳沌口工业区、青山工业区、阳逻开发区和东西湖区等地,形成了“多中心”分布的模式。与之相应,城市不透水面不断延伸,许多城市外围区域不透水面覆盖率越来越高,呈现块状分散分布。武昌汉口中心城区的不透水面覆盖率依然很高,但是回归系数相对等级在继续下降。
总的来看,武汉市中心城区的不透水面增温强度在不断减弱,城市周边新发展区域的不透水面增温强度在不断增加;强度较高区域的分布由原来单一集中于中心城区的“单中心”模式变为了分散集中于三环线附近地区的“多中心”模式,包围着中心城区。因此,武汉市在进行城市生态治理时应该结合不透水面覆盖率变化的趋势与特点,从局部尺度出发,重点考虑这些“多中心”地区与中心城区的生态空间协同发展。
本文利用辐射传导方程反演了武汉市2001、2007和2016年的地表温度,并在此基础上进行了热岛分析。对不透水面增温效果的分析,全局上使用多元线性回归分析比较了不透水面增温效果与植被水体降温效果的强弱,空间局部上采用GWR对3个时期的不透水面增温强度进行了时空分析。得出了以下结论:
(1)辐射传导方程法适用于实验中研究区的反演;武汉市城市热岛比例指数先增后减,中心城区的热岛效应已经有所缓解;但温度等级高的地区仍在不断扩张,工业区和城市周边新发展区的热环境情况不容乐观,总体上城市热岛效应在2007年时最强,到2016年有所减弱。
(2)总体上武汉市不透水面的增温效果强于植被的降温效果并弱于水体的降温效果;理想来看,如果区域有10%的不透水面转为植被,地表温度将下降1 ℃左右;如果区域有10%的不透水面转为水体,地表温度将下降1.5 ℃左右。
(3)不透水面增温强度较高的区域由单一集中分布于武昌汉口中心城区的“单中心”模式变为分散集中于汉阳沌口工业区、青山工业区、阳逻开发区和东西湖区等三环线附近地区的“多中心”模式。这些“多中心”的不透水面增温强度大于中心城区,将成为城市生态治理重点。另外,不透水面增温强度的变化一定程度上也可反映城市扩张的趋势和特点。
本研究反映了武汉市城市热岛以及不透水面增温强度的时空演变,可看出武汉市的热环境问题仍然突出,特别是城市外围地区的发展对地表温度造成了巨大的影响,使城市热岛不断扩张,热环境问题进一步恶化。不透水面增温强度由“单中心”到“多中心”的变化也意味着单从城市尺度下提出概念性的规划策略已经不能很好地缓解武汉市城市热岛现象,面对这些“多中心”的出现,武汉市应该从局部尺度出发对不同区域进行空间协同规划,实现中心城区与城市外围区域的可持续协调发展。
所以,深入到这些“多中心”区域细化分析不同类别不透水面对温度的影响和建立一套标准来评价其带来的正面社会经济效益与负面生态环境效应是今后的研究重点之一。另外,本文在局部尺度下的研究只考虑了地形等空间要素,未来的研究中还应该结合气象、水文等要素,进一步将武汉市规划治理落实到不同区域,为城市热环境的改善提供决策支持。
The authors have declared that no competing interests exist.
| [1] |
城乡不透水面增长格局及地表温度的响应特征研究 [J].https://doi.org/10.3724/SP.J.1047.2017.00134 URL [本文引用: 1] 摘要
为探究中国北方中温带,特别是东北寒区快速城市化地区城乡不透水增长格局及地表温度的响应特征,本文以哈尔滨市为例,基于国家资源环境遥感时空信息平台土地利用/覆盖变化(LUCC)数据集解译的2001年与2015年城乡建设用地和Landsat 7/8数字遥感影像,结合植被-不透水面-土壤(V-I-S)端元选取和完全约束最小二乘混合像元线性分解模型进行了不透水面提取(分辨率15 m×15 m),并运用单窗算法进行了夏季地表温度遥感反演。结果表明:2001-2015年建设用地扩张259.05 km2,不透水面上升163.96 km2,城市与乡村不透水面占各自建设用地的比例由2001年的43.92%、21.35%变化为2015年的49.14%、34.27%,城乡比例差由22.57%缩减至14.87%,单位建设用地内乡村不透水面增量较高;2001-2015年城区以低温区、中温区、高温区为主,对不透水面扩张的响应剧烈,而乡村以低温区和中温区为主,低温区和高温区响应剧烈;地表温度与不透水面具有显著正相关,在低、中、高不透水密度区分别升温1.16o、1.45和1.79℃,相同不透水面盖度下城市升温高于乡村。总体而言,研究区不透水面大幅扩张,温度分区变化剧烈,地表温度随不透水面增加升温效果明显。
Pattern of impervious surface change and its effect on land surface temperature in urban and rural areas [J].https://doi.org/10.3724/SP.J.1047.2017.00134 URL [本文引用: 1] 摘要
为探究中国北方中温带,特别是东北寒区快速城市化地区城乡不透水增长格局及地表温度的响应特征,本文以哈尔滨市为例,基于国家资源环境遥感时空信息平台土地利用/覆盖变化(LUCC)数据集解译的2001年与2015年城乡建设用地和Landsat 7/8数字遥感影像,结合植被-不透水面-土壤(V-I-S)端元选取和完全约束最小二乘混合像元线性分解模型进行了不透水面提取(分辨率15 m×15 m),并运用单窗算法进行了夏季地表温度遥感反演。结果表明:2001-2015年建设用地扩张259.05 km2,不透水面上升163.96 km2,城市与乡村不透水面占各自建设用地的比例由2001年的43.92%、21.35%变化为2015年的49.14%、34.27%,城乡比例差由22.57%缩减至14.87%,单位建设用地内乡村不透水面增量较高;2001-2015年城区以低温区、中温区、高温区为主,对不透水面扩张的响应剧烈,而乡村以低温区和中温区为主,低温区和高温区响应剧烈;地表温度与不透水面具有显著正相关,在低、中、高不透水密度区分别升温1.16o、1.45和1.79℃,相同不透水面盖度下城市升温高于乡村。总体而言,研究区不透水面大幅扩张,温度分区变化剧烈,地表温度随不透水面增加升温效果明显。
|
| [2] |
城市不透水面与地表温度定量关系的遥感分析 [J].
<p>作为城市下垫面的最主要组成部分,城市不透水面是引发城市热岛效应的主要因素,但目前不透水面与地表温度之间的定量关系仍不明确,不同研究的结论也不尽相同。选取了上海、广州、北京、长沙、兰州、福州等6个代表我国不同区域的城市作为研究区来进一步研究城市不透水面与城市热环境的定量关系。采用Landsat ETM+影像和线性光谱混合分析法提取出各个研究区的不透水面,利用热红外波段反演出各研究区的地表温度,采用多种回归模型和大样本量对二者之间的相关关系进行定量分析;在此基础上讨论了不透水面对城市热环境的影响机制。结果表明:不透水面与地表温度呈明显的正相关关系,并且以指数函数为最佳拟合模型,回归方程的相关系数均为0.750以上,最高可达0.954 1;高不透水面盖度地区的升温幅度更大,比低不透水面盖度地区高出0.600~1.700 ℃,其原因主要是高不透水面盖度地区的植被覆盖率低,蒸腾蒸发作用小。</p>
Quantitative relationship between impervious surface and land surface temperature based on remote sensing technology [J].
<p>作为城市下垫面的最主要组成部分,城市不透水面是引发城市热岛效应的主要因素,但目前不透水面与地表温度之间的定量关系仍不明确,不同研究的结论也不尽相同。选取了上海、广州、北京、长沙、兰州、福州等6个代表我国不同区域的城市作为研究区来进一步研究城市不透水面与城市热环境的定量关系。采用Landsat ETM+影像和线性光谱混合分析法提取出各个研究区的不透水面,利用热红外波段反演出各研究区的地表温度,采用多种回归模型和大样本量对二者之间的相关关系进行定量分析;在此基础上讨论了不透水面对城市热环境的影响机制。结果表明:不透水面与地表温度呈明显的正相关关系,并且以指数函数为最佳拟合模型,回归方程的相关系数均为0.750以上,最高可达0.954 1;高不透水面盖度地区的升温幅度更大,比低不透水面盖度地区高出0.600~1.700 ℃,其原因主要是高不透水面盖度地区的植被覆盖率低,蒸腾蒸发作用小。</p>
|
| [3] |
A remote sensing-GIS evaluation of urban expansion and its impact on surface temperature in the Zhujiang Delta, China [J].https://doi.org/10.1080/713860788 URL [本文引用: 1] 摘要
The Zhujiang Delta of South China has experienced a rapid urban expansion over the past two decades due to accelerated economic growth. This paper reports an investigation into the application of the integration of remote sensing and geographic information systems (GIS) for detecting urban growth and assessing its impact on surface temperature in the region. Remote sensing techniques were used to carry out land use/cover change detection by using multitemporal Landsat Thematic Mapper data. Urban growth patterns were analysed by using a GIS-based modelling approach. The integration of remote sensing and GIS was further applied to examine the impact of urban growth on surface temperatures. The results revealed a notable and uneven urban growth in the study area. This urban development had raised surface radiant temperature by 13.01 K in the urbanized area. The integration of remote sensing and GIS was found to be effective in monitoring and analysing urban growth patterns, and in evaluating urbanization impact on surface temperature.
|
| [4] |
近20年来福州城市热环境变化遥感分析 [J].
城市热环境是城市微气候的重要组成部分,已成为近年来的研究热点。受制于卫星传感器较低的热红外波段空间分辨率,此类数据反演得到的地表温度难以反映城市热环境的实际情况。为解决这一困境,本文利用空间降尺度HUTS算法反演得到30 m空间分辨率的福州市中心城区1994年5月12日、2003年5月29日和2016年7月27日3个时相的地表温度影像。在此基础上,结合土地利用等数据对热环境的时空变化做定量分析,并进一步引入景观指数,分析近20年间福州市中心城区高温度等级斑块的形态变化。结果表明:(1)近20年间随着城市拓展,福州市建成区的高温区域面积从35.75 km2增加到184.11 km2,高温度等级斑块不断从市中心向四周扩散;(2)市中心的特高温斑块和高温斑块趋向破裂、分散,聚集程度下降,次高温斑块的面积与占比均大幅提升,成为建成区内高温区域的主要组成部分;(3)城市热岛比例指数URI由0.39上升到0.52,热岛效应明显加强。总体上,近20 a间福州市建成区的热环境变化较大,其中鼓楼区南部、台江区和晋安区南部的高温区域聚集现象有所改善,而仓山区、马尾区和闽侯县的大部分区域在经历快速城市化过程后温度等级明显升高。
Remote sensing analysis of changes of urban thermal environment of Fuzhou city in China in the past 20 years [J].
城市热环境是城市微气候的重要组成部分,已成为近年来的研究热点。受制于卫星传感器较低的热红外波段空间分辨率,此类数据反演得到的地表温度难以反映城市热环境的实际情况。为解决这一困境,本文利用空间降尺度HUTS算法反演得到30 m空间分辨率的福州市中心城区1994年5月12日、2003年5月29日和2016年7月27日3个时相的地表温度影像。在此基础上,结合土地利用等数据对热环境的时空变化做定量分析,并进一步引入景观指数,分析近20年间福州市中心城区高温度等级斑块的形态变化。结果表明:(1)近20年间随着城市拓展,福州市建成区的高温区域面积从35.75 km2增加到184.11 km2,高温度等级斑块不断从市中心向四周扩散;(2)市中心的特高温斑块和高温斑块趋向破裂、分散,聚集程度下降,次高温斑块的面积与占比均大幅提升,成为建成区内高温区域的主要组成部分;(3)城市热岛比例指数URI由0.39上升到0.52,热岛效应明显加强。总体上,近20 a间福州市建成区的热环境变化较大,其中鼓楼区南部、台江区和晋安区南部的高温区域聚集现象有所改善,而仓山区、马尾区和闽侯县的大部分区域在经历快速城市化过程后温度等级明显升高。
|
| [5] |
城市热岛的生态环境效应 [J].https://doi.org/10.3321/j.issn:1000-0933.2005.08.032 URL Magsci [本文引用: 1] 摘要
城市热岛效应(Urbanheatislandeffect,简称UHI)是一种由于城市建筑及人类活动导致热量在城区空间范围内聚集的现象,是城市气候最显著的特征之一。热岛引起地表温度的提高,必将强烈地影响着城市生态系统的物流、能流,改变城市生态系统结构和功能,产生一系列生态环境效应,影响着城市气候、城市水文、城市土壤理化性质、城市大气环境、城市生物习性、城市物质循环、城市能量代谢以及城市居民健康等。提高能量利用效率、优化城市格局、建设绿色屋顶、采用高反射率地表材料以及增加城市绿地均可有效地控制城市热岛效应。利用遥感手段和数值模型技术,开展多尺度的城市热岛生态环境效应研究,为改善城市生态环境、实现城市可持续发展提供理论依据。
A review of the eco-environmental consequences of urban heat islands [J].https://doi.org/10.3321/j.issn:1000-0933.2005.08.032 URL Magsci [本文引用: 1] 摘要
城市热岛效应(Urbanheatislandeffect,简称UHI)是一种由于城市建筑及人类活动导致热量在城区空间范围内聚集的现象,是城市气候最显著的特征之一。热岛引起地表温度的提高,必将强烈地影响着城市生态系统的物流、能流,改变城市生态系统结构和功能,产生一系列生态环境效应,影响着城市气候、城市水文、城市土壤理化性质、城市大气环境、城市生物习性、城市物质循环、城市能量代谢以及城市居民健康等。提高能量利用效率、优化城市格局、建设绿色屋顶、采用高反射率地表材料以及增加城市绿地均可有效地控制城市热岛效应。利用遥感手段和数值模型技术,开展多尺度的城市热岛生态环境效应研究,为改善城市生态环境、实现城市可持续发展提供理论依据。
|
| [6] |
Urban thermal environment dynamics and associated landscape pattern factors: A case study in the Beijing metropolitan region [J].https://doi.org/10.1016/j.rse.2015.11.027 URL [本文引用: 1] 摘要
61LST dynamic was examined in Beijing during 2001–2009.61LST increased averagely in the whole metropolitan area but decreased in city center.61Built-up areas and barren land contribute most to UHI.61Cooling effects of ecological land is obvious with the proportion above 70%.61LST is determined more by landscape composition than spatial configuration.
|
| [7] |
The London Heat Island and building cooling design [J].https://doi.org/10.1016/j.solener.2006.06.005 URL [本文引用: 1] 摘要
London urban heat island increases the mean air temperature which affects the demand for heating and cooling buildings. Measured air temperature data have been used as input to a building energy simulation computer program to assess the heating and cooling load of a typical air-conditioned office building positioned at 24 different locations within the London Heat Island. It is found that the urban cooling load is up to 25% higher than the rural load over the year, and the annual heating load is reduced by 22%. The effect of raised temperature and urban context are assessed separately, and the sensitivity of the net impact to the internal gains in a building is determined. For the estimation of peak cooling demand, we propose hourly temperature corrections based on radial distance from London centre to be applied to standard published temperatures for the region. For more detailed investigations over the cooling season a range of models is available. These are reviewed in this paper and we describe preliminary results of an Artificial Neural Network (ANN) model that predicts location specific hourly temperatures for London, taking into account radial distance from central London, hourly air temperature measured at the meteorological station and associated synoptic weather data.
|
| [8] |
The multi-timescale temporal patterns and dynamics of land surface temperature using Ensemble Empirical Mode Decomposition [J]. |
| [9] |
Remote sensing of impervious surfaces in the urban areas: Requirements, methods, and trends [J].https://doi.org/10.1016/j.rse.2011.02.030 URL [本文引用: 1] 摘要
78 Comprehensive review on methods to extract, estimate and map impervious surfaces. 78 Discussions on the mapping requirements of urban impervious surfaces. 78 Problems and prospects in remote sensing of impervious surfaces in the urban areas. 78 Impact of new sensing systems on the models and algorithms in urban remote sensing. 78 First to discuss about research traditions in urban remote sensing.
|
| [10] |
基于遥感和GWR的兰州中心城区夏季热场格局及与土地覆盖的关系 [J].
兰州是河谷型城市的典型代表,利用多期Landsat遥感影像,定量反演兰州中心城区1990—2015年的夏季地表温度,分别采用普通线性回归模型(OLS)和地理加权回归模型(GWR)拟合土地覆被变化比例与地表温度的关系,分析其空间非稳定性。结果表明:空间分布上,兰州市中心城区夏季地表温度高的区域主要集中在南北两山的未利用地,黄河流经的河谷盆地温度较低;城市热岛比例指数也呈现出先下降后增长的特点。土地覆被变化比例对地表温度的变化影响显著,且二者之间存在空间上的非稳定性,地理位置和周边环境是产生空间非稳定性的主要原因。OLS回归模型会高估或低估不同土地覆被类型的增温或降温能力,GWR模型的拟合结果优于OLS模型,能够更直观准确地量化土地覆盖比例与地表温度二者关系的空间非稳定性时空格局。
Spatiotemporal pattern of summer thermal field and its relationship with land cover in Lanzhou based on RS and GWR [J].
兰州是河谷型城市的典型代表,利用多期Landsat遥感影像,定量反演兰州中心城区1990—2015年的夏季地表温度,分别采用普通线性回归模型(OLS)和地理加权回归模型(GWR)拟合土地覆被变化比例与地表温度的关系,分析其空间非稳定性。结果表明:空间分布上,兰州市中心城区夏季地表温度高的区域主要集中在南北两山的未利用地,黄河流经的河谷盆地温度较低;城市热岛比例指数也呈现出先下降后增长的特点。土地覆被变化比例对地表温度的变化影响显著,且二者之间存在空间上的非稳定性,地理位置和周边环境是产生空间非稳定性的主要原因。OLS回归模型会高估或低估不同土地覆被类型的增温或降温能力,GWR模型的拟合结果优于OLS模型,能够更直观准确地量化土地覆盖比例与地表温度二者关系的空间非稳定性时空格局。
|
| [11] |
基于GWR模型的土地覆盖与地表温度的关系——以京津唐城市群为例 [J].https://doi.org/10.13287/j.1001-9332.201607.008 URL Magsci [本文引用: 2] 摘要
<p>基于Landsat TM土地覆盖分类数据和MODIS地表温度数据,探讨京津唐城市群不同土地覆盖的地表温度(7日),并采用常用的普通线性回归(OLS)和地理加权回归(GWR)方法分别拟合土地覆盖比例与地表温度的关系.结果表明: 研究区不同土地覆盖类型的地表温度差异明显,人工表面(40.92℃)和耕地(39.74℃)的平均温度较高,林地(34.43℃)〖JP〗和湿地(35.42℃)的平均温度较低;土地覆盖比例与地表温度显著相关,且两者之间的定量关系存在空间非稳定性,地理位置以及周围环境影响的差异是空间非稳定性产生的主要原因;GWR模型的拟合结果优于OLS模型(),并且GWR模型可以量化土地覆盖比例与地表温度两者关系的空间非稳定性特征.</p>
Relationship between land surface temperature and land cover types based on GWR model: A case of Beijing-Tianjin-Tangshan urban agglomeration, China [J].https://doi.org/10.13287/j.1001-9332.201607.008 URL Magsci [本文引用: 2] 摘要
<p>基于Landsat TM土地覆盖分类数据和MODIS地表温度数据,探讨京津唐城市群不同土地覆盖的地表温度(7日),并采用常用的普通线性回归(OLS)和地理加权回归(GWR)方法分别拟合土地覆盖比例与地表温度的关系.结果表明: 研究区不同土地覆盖类型的地表温度差异明显,人工表面(40.92℃)和耕地(39.74℃)的平均温度较高,林地(34.43℃)〖JP〗和湿地(35.42℃)的平均温度较低;土地覆盖比例与地表温度显著相关,且两者之间的定量关系存在空间非稳定性,地理位置以及周围环境影响的差异是空间非稳定性产生的主要原因;GWR模型的拟合结果优于OLS模型(),并且GWR模型可以量化土地覆盖比例与地表温度两者关系的空间非稳定性特征.</p>
|
| [12] |
用辐射传输方程从MODIS数据中反演地表温度的方法 [J].https://doi.org/10.3321/j.issn:0455-2059.2007.04.003 URL [本文引用: 1] 摘要
介绍了辐射传输方程反演地表温度理论和传统参数的获取.针对MODIS波段设置特点,从MODIS的某些波段来反演大气参数,从而突破传统参数获取的局限性,提高了辐射传输方法在地表温度反演中的实用性.最后用环渤海地区的MODIS影像对该地区的地表温度进行了反演,并对MODIS的第31,32波段反演结果做了对比分析.
Retrieving land surface temperature from MODIS data by using radiance transfer equation [J].https://doi.org/10.3321/j.issn:0455-2059.2007.04.003 URL [本文引用: 1] 摘要
介绍了辐射传输方程反演地表温度理论和传统参数的获取.针对MODIS波段设置特点,从MODIS的某些波段来反演大气参数,从而突破传统参数获取的局限性,提高了辐射传输方法在地表温度反演中的实用性.最后用环渤海地区的MODIS影像对该地区的地表温度进行了反演,并对MODIS的第31,32波段反演结果做了对比分析.
|
| [13] |
用陆地卫星TM6数据演算地表温度的单窗算法 [J].https://doi.org/10.1142/S0252959901000401 URL [本文引用: 1] 摘要
陆地卫星 TM数据 (TM6)热波段表示地表热辐射和地表温度变化。长期以来 ,从 TM6数据中演算地表温度通常是通过所谓大气校正法。这一方法需要估计大气热辐射和大气对地表热辐射传导的影响 ,计算过程很复杂 ,误差也较大 ,在实际中应用不多。根据地表热辐射传导方程 ,推导出一个简单易行并且精度较高的演算方法 ,把大气和地表的影响直接包括在演算公式中。该算法需要用地表辐射率、大气透射率和大气平均温度 3个参数进行地表温度的演算。验证表明 ,该方法的地表温度演算较高。当参数估计没有误差时 ,该方法的地表温度演算精度达到 0 .4℃ ,在参数估计有适度误差时 ,演算精度仍达 1 .1℃。因该方法适用于仅有一个热波段的遥感数据 ,故称为单窗算法。
Mono-window Algorithm for Retrieving Land Surface Temperature from Landsat TM6 data [J].https://doi.org/10.1142/S0252959901000401 URL [本文引用: 1] 摘要
陆地卫星 TM数据 (TM6)热波段表示地表热辐射和地表温度变化。长期以来 ,从 TM6数据中演算地表温度通常是通过所谓大气校正法。这一方法需要估计大气热辐射和大气对地表热辐射传导的影响 ,计算过程很复杂 ,误差也较大 ,在实际中应用不多。根据地表热辐射传导方程 ,推导出一个简单易行并且精度较高的演算方法 ,把大气和地表的影响直接包括在演算公式中。该算法需要用地表辐射率、大气透射率和大气平均温度 3个参数进行地表温度的演算。验证表明 ,该方法的地表温度演算较高。当参数估计没有误差时 ,该方法的地表温度演算精度达到 0 .4℃ ,在参数估计有适度误差时 ,演算精度仍达 1 .1℃。因该方法适用于仅有一个热波段的遥感数据 ,故称为单窗算法。
|
| [14] |
Land surface temperature retrieval from Landsat TM5 [J].https://doi.org/10.1016/j.rse.2004.02.003 URL [本文引用: 2] 摘要
In this paper, three methods to retrieve the land surface temperature (LST) from thermal infrared data supplied by band 6 of the Thematic Mapper (TM) sensor onboard the Landsat 5 satellite are compared. The first of them lies on the estimation of the land surface temperature from the radiative transfer equation using in situ radiosounding data. The others two are the mono-window algorithm developed by Qin et al. [International Journal of Remote Sensing 22 (2001) 3719] and the single-channel algorithm developed by Jiménez-Mu09oz and Sobrino [Journal of Geophysical Research 108 (2003)]. The land surface emissivity (LSE) values needed in order to apply these methods have been estimated from a methodology that uses the visible and near infrared bands. Finally, we present a comparison between the LST measured in situ and the retrieved by the algorithms over an agricultural region of Spain (La Plana de Requena-Utiel). The results show a root mean square deviation (rmsd) of 0.009 for emissivity and lower than 1 K for land surface temperature when the Jiménez-Mu09oz algorithm is used.
|
| [15] |
A generalized single-channel method for retrieving land surface temperature from remote sensing data [J].https://doi.org/10.1029/2003JD003480 URL [本文引用: 1] 摘要
[1] Many papers have developed algorithms to retrieve land surface temperature from at-sensor and land surface emissivity data. These algorithms have been specified for different thermal sensors on board satellites, i.e., the algorithm used for one thermal sensor (or a combination of thermal sensors) cannot be used for other thermal sensor. The main goal of this paper is to propose a generalized single-channel algorithm that only uses the total atmospheric water vapour content and the channel effective wavelength (assuming that emissivity is known), and can be applied to thermal sensors characterized with a FWHM (Full-Width Half-Maximum) of around 1 0204m actually operative on board satellites. The main advantage of this algorithm compared with the other single-channel methods is that in-situ radiosoundings or effective mean atmospheric temperature values are not needed, whereas the main advantage of this algorithm compared with split-window and dual-angle methods is that it can be applied to different thermal sensors using the same equation and coefficients. The validation for different test sites shows root mean square deviations lower than 2 K for AVHRR channel 4 (0203 090908 10.8 0204m) and ATSR-2 channel 2 (0203 090908 11 0204m), and lower than 1.5 K for Landsat Thematic Mapper (TM) band 6 (0203 090908 11.5 0204m).
|
| [16] |
Land Surface Temperature retrieval from Landsat 8 TIRS-comparison between radiative transfer equation-based method, split window algorithm and single channel method [J].https://doi.org/10.3390/rs6109829 URL [本文引用: 1] 摘要
Accurate inversion of land surface geo/biophysical variables from remote sensing data for earth observation applications is an essential and challenging topic for the global change research. Land surface temperature (LST) is one of the key parameters in the physics of earth surface processes from local to global scales. The importance of LST is being increasingly recognized and there is a strong interest in developing methodologies to measure LST from the space. Landsat 8 Thermal Infrared Sensor (TIRS) is the newest thermal infrared sensor for the Landsat project, providing two adjacent thermal bands, which has a great benefit for the LST inversion. In this paper, we compared three different approaches for LST inversion from TIRS, including the radiative transfer equation-based method, the split-window algorithm and the single channel method. Four selected energy balance monitoring sites from the Surface Radiation Budget Network (SURFRAD) were used for validation, combining with the MODIS 8 day emissivity product. For the investigated sites and scenes, results show that the LST inverted from the radiative transfer equation-based method using band 10 has the highest accuracy with RMSE lower than 1 K, while the SW algorithm has moderate accuracy and the SC method has the lowest accuracy.
|
| [17] |
Spatial non-stationarity in the relationships between land cover and surface temperature in an urban heat island and its impacts on thermally sensitive populations [J].https://doi.org/10.1016/j.landurbplan.2012.05.016 URL [本文引用: 1] 摘要
Past studies focused on the relationships between land cover and urban temperature have commonly assumed stationarity and used conventional (global) regression analysis. In this study, geographically weighted regression (GWR) was used to test the spatial stationarity of the relationships between a set of land cover types (built-up, water, paddy field, and other vegetation) and the surface temperature in TaoYuan, Taiwan. By adopting the GWR approach, significant spatial non-stationarity of these relationships was observed and the strength of these relationships was markedly higher than from a conventional regression analysis. The differences have large impacts. If the regression models were used to derive an estimate of the urban heat island intensity for TaoYuan this would equate to 2.63 degrees C and 3.17 degrees C for the global and GWR models, respectively. This result showed that the urban heat island was underestimated by global model and this, therefore, increased potential to underestimate the risk of ill-health and discomfort for urban populations. The mapped parameters derived from GWR analyses provided useful information for planning temperature mitigation and adaptation strategies especially for the very young and elderly that are particularly sensitive to temperature. (C) 2012 Elsevier B.V. All rights reserved.
|
| [18] |
Investigating spatial non-stationary and scale-dependent relationships between urban surface temperature and environmental factors using geographically weighted regression [J].https://doi.org/10.1016/j.envsoft.2010.06.011 URL [本文引用: 1] 摘要
Despite growing concerns for the variation of urban thermal environments and driving factors, relatively little attention has been paid to issues of spatial non-stationarity and scale-dependence, which are intrinsic properties of the urban ecosystem. In this paper, using Shenzhen City in China as a case study, a geographically weighted regression (GWR) model is used to explore the scale-dependent and spatial non-stationary relationships between urban land surface temperature () and environmental determinants. These determinants include the distance between city and highway, patch richness density of forestland, wetland, built-up land and unused land and topographic factors such as elevation and slope aspect. For reference, the ordinary least squares (OLS) model, a global regression technique, was also employed, using the same response variable and explanatory variables as in the GWR model. The results indicate that the GWR model not only provides a better fit than the traditional OLS model, but also provides local detailed information about the spatial variation of , which is affected by geographical and ecological factors. With the GWR model, the strength of the regression relationships increased significantly, with a mean of 59% of the changes in the values explained by the predictors, compared with only 43% using the OLS model. By computing a stationarity index, one finds that different predictors have different variational trends which tend towards the stationary state with the coarsening of the spatial scale. This implies that underlying natural processes affecting the land surface temperature and its spatial pattern may operate at different spatial scales. In conclusion, the GWR model is an alternative approach to addressing spatial non-stationary and scale-dependent problems in geography and ecology.
|
| [19] |
Effects of landscape composition and pattern on land surface temperature: An urban heat island study in the megacities of Southeast Asia [J].https://doi.org/10.1016/j.scitotenv.2016.10.195 URL PMID: 27832866 [本文引用: 1] 摘要
61We examined LST's relationship with IS and GS in Bangkok, Jakarta and Manila.61On average, the mean LST of IS is about 3°C higher than that of GS.61LST had a significant strong correlation with IS and GS along urban-rural gradient.61LST's correlation with IS density increases in larger grids (smaller grids for GS).61Aggregation of IS and GS had consistent significant strong correlation with LST.
|
| [20] |
城市不透水面与相关城市生态要素关系的定量分析 [J].https://doi.org/10.3321/j.issn:1000-0933.2009.05.032 URL Magsci [本文引用: 1] 摘要
城市空间的快速扩展已使得原来以植被为主的自然景观逐渐被人工不透水建筑物所取代,并对区域乃至全球的生态系统造成了明显的影响。因此,准确了解城市不透水面及其与植被、水体、城市热环境的相关关系对于城市的科学规划和城市生态系统的修复具有重要的意义。以福州市为例,采用遥感空间信息技术,获得了城市不透水面、地表温度、植被和水体的信息,并对它们的关系进行了定量分析。发现了城市不透水面与地表温度之间的关系并不是一种简单的线性关系,而是一种很显著的指数函数关系,说明高不透水面比例地区的升温效应要明显高于低不透水面比例地区。多元统计分析表明不透水面是引发城市热岛的最重要因子。
Quantitative analysis on the relationship of urban impervious surface with other components of the urban ecosystem [J].https://doi.org/10.3321/j.issn:1000-0933.2009.05.032 URL Magsci [本文引用: 1] 摘要
城市空间的快速扩展已使得原来以植被为主的自然景观逐渐被人工不透水建筑物所取代,并对区域乃至全球的生态系统造成了明显的影响。因此,准确了解城市不透水面及其与植被、水体、城市热环境的相关关系对于城市的科学规划和城市生态系统的修复具有重要的意义。以福州市为例,采用遥感空间信息技术,获得了城市不透水面、地表温度、植被和水体的信息,并对它们的关系进行了定量分析。发现了城市不透水面与地表温度之间的关系并不是一种简单的线性关系,而是一种很显著的指数函数关系,说明高不透水面比例地区的升温效应要明显高于低不透水面比例地区。多元统计分析表明不透水面是引发城市热岛的最重要因子。
|
| [21] |
An analysis of urban thermal characteristics and associated land cover in Tampa Bay and Las Vegas using Landsat satellite data [J].https://doi.org/10.1016/j.rse.2005.09.023 URL [本文引用: 1] 摘要
Remote sensing data from both Landsat 5 and Landsat 7 systems were utilized to assess urban area thermal characteristics in Tampa Bay watershed of west-central Florida, and the Las Vegas valley of southern Nevada. To quantitatively determine urban land use extents and development densities, sub-pixel impervious surface areas were mapped for both areas. The urban 搑ural boundaries and urban development densities were defined by selecting certain imperviousness threshold values and Landsat thermal bands were used to investigate urban surface thermal patterns. Analysis results suggest that urban surface thermal characteristics and patterns can be identified through qualitatively based urban land use and development density data. Results show the urban area of the Tampa Bay watershed has a daytime heating effect (heat-source), whereas the urban surface in Las Vegas has a daytime cooling effect (heat-sink). These thermal effects strongly correlated with urban development densities where higher percent imperviousness is usually associated with higher surface temperature. Using vegetation canopy coverage information, the spatial and temporal distributions of urban impervious surface and associated thermal characteristics are demonstrated to be very useful sources in quantifying urban land use, development intensity, and urban thermal patterns.
|
| [22] |
沈阳市区土地利用类型与地表温度关系研究 [J].https://doi.org/10.3969/j.issn.1673-503X.2016.06.013 URL [本文引用: 1] 摘要
利用2010年8月Landsat TM数据计算沈阳市三环内地表温度(Land Surface Temperature,LST),基于目视解译与监督分类结合的方法将研究区划分为建筑用地、绿地、农田、弃地、道路和水体6类土地利用类型;以城市中心点为原点,分析城市中心不同距离圆环的LST及其与土地利用类型配置的关系,采用多元线性回归法和偏最小二乘回归法建立LST预测模型,并进行模型验证。结果表明:沈阳市区建筑用地、绿地、农田、道路和中心城区的平均LST均随着距中心原点的距离增加而减小;同一级别缓冲区内,建筑和道路的LST较高,水体的LST最低。城市的"摊饼"式发展,也造成了增强热岛效应的建筑用地和道路面积百分比随着距中心原点距离的增加逐渐降低。研究区范围内最主要的土地利用类型为建筑用地,其次为道路。对比分析表明,多元线性回归法和偏最小二乘回归法建立的模型均能较好的预测LST,采用偏最小二乘回归方法对沈阳地区土地利用类型与LST进行回归分析效果更理想。
Study on the relationships between land use and land surface temperature in Shenyang urban districts [J].https://doi.org/10.3969/j.issn.1673-503X.2016.06.013 URL [本文引用: 1] 摘要
利用2010年8月Landsat TM数据计算沈阳市三环内地表温度(Land Surface Temperature,LST),基于目视解译与监督分类结合的方法将研究区划分为建筑用地、绿地、农田、弃地、道路和水体6类土地利用类型;以城市中心点为原点,分析城市中心不同距离圆环的LST及其与土地利用类型配置的关系,采用多元线性回归法和偏最小二乘回归法建立LST预测模型,并进行模型验证。结果表明:沈阳市区建筑用地、绿地、农田、道路和中心城区的平均LST均随着距中心原点的距离增加而减小;同一级别缓冲区内,建筑和道路的LST较高,水体的LST最低。城市的"摊饼"式发展,也造成了增强热岛效应的建筑用地和道路面积百分比随着距中心原点距离的增加逐渐降低。研究区范围内最主要的土地利用类型为建筑用地,其次为道路。对比分析表明,多元线性回归法和偏最小二乘回归法建立的模型均能较好的预测LST,采用偏最小二乘回归方法对沈阳地区土地利用类型与LST进行回归分析效果更理想。
|
| [23] |
Estimating subpixel surface temperatures and energy fluxes from the vegetation index-radiometric temperature relationship [J].https://doi.org/10.1016/S0034-4257(03)00036-1 URL [本文引用: 1] 摘要
Routine (i.e., daily to weekly) monitoring of surface energy fluxes, particularly evapotranspiration (ET), using satellite observations of radiometric surface temperature has not been feasible at high pixel resolution (i.e., 6510 1–10 2 m) because of the low frequency in satellite coverage over the region of interest (i.e., approximately every 2 weeks). Cloud cover further reduces the number of useable observations of surface conditions resulting in high-resolution satellite imagery of a region typically being available once a month, which is not very useful for routine ET monitoring. Radiometric surface temperature observations at 651- to 5-km pixel resolution are available multiple times per day from several weather satellites. However, this spatial resolution is too coarse for estimating ET from individual agricultural fields or for defining variations in ET due to land cover changes. Satellite data in the visible and near-infrared wavelengths, used for computing vegetation indices, are available at resolutions an order of magnitude smaller than in the thermal-infrared, and hence provide higher resolution information on vegetation cover conditions. A number of studies have exploited the relationship between vegetation indices and radiometric surface temperature for estimating model parameters used in computing spatially distributed fluxes and available moisture. In this paper, the vegetation index–radiometric surface temperature relationship is utilized in a disaggregation procedure for estimating subpixel variation in surface temperature with aircraft imagery collected over the US Southern Great Plains. The disaggregated surface temperatures estimated by this procedure are compared to actual observations at this subpixel resolution. In addition, a remote sensing-based energy balance model is used to compare output using actual versus estimated surface temperatures over a range of pixel resolutions. From these comparisons, the utility of the surface temperature disaggregation technique appears to be most useful for estimating subpixel surface temperatures at resolutions corresponding to length scales defining agricultural field boundaries across the landscape.
|
| [24] |
Influence of topography on landscape radiation temperature distribution [J].https://doi.org/10.1080/01431169408954317 URL [本文引用: 1] 摘要
The evaluation of the influence of topography on landscape radiation temperature distribution is carried out by statistical processing of digital models of elevation, gradient, aspect, horizontal, vertical and mean landsurface curvatures and the infrared thermal scene generated by the Thermovision 880 system. Significant linear correlation coefficients between the landscape radiation temperature and elevation, slope, aspect, vertical and mean landsurface curvatures are determined, being 0900000-57, 0 38, 0-26, 015, 013, respectively. The equation of the topography influence on the distribution of the landscape radiation temperature is defined.
|
| [25] |
陆地卫星TM6波段范围内地表比辐射率的估计 [J].https://doi.org/10.3969/j.issn.1001-070X.2004.03.007 URL Magsci [本文引用: 1] 摘要
地表比辐射率是用热红外波段遥感数据反演地表温度的关键参数。目前,应用陆地卫星TM6波段数据反演地表温度共有3种算法,即大气校正法、单窗算法和单通道算法。这3种算法都需要TM6波段范围内的地表比辐射率作为地表温度反演参数。本文首先简介这3种反演算法;然后着重探讨TM6波段地表比辐射率估计方法;最后,利用这一方法对山东省陵县附近农田地区进行地表比辐射率估计和地表温度反演。结果表明,该方法能获得较合理的地表温度反演结果。
The estimation of land surface emissivity for Landsat TM6 [J].https://doi.org/10.3969/j.issn.1001-070X.2004.03.007 URL Magsci [本文引用: 1] 摘要
地表比辐射率是用热红外波段遥感数据反演地表温度的关键参数。目前,应用陆地卫星TM6波段数据反演地表温度共有3种算法,即大气校正法、单窗算法和单通道算法。这3种算法都需要TM6波段范围内的地表比辐射率作为地表温度反演参数。本文首先简介这3种反演算法;然后着重探讨TM6波段地表比辐射率估计方法;最后,利用这一方法对山东省陵县附近农田地区进行地表比辐射率估计和地表温度反演。结果表明,该方法能获得较合理的地表温度反演结果。
|
| [26] |
Impacts of landscape structure on surface urban heat islands: A case study of Shanghai, China [J].https://doi.org/10.1016/j.rse.2011.07.008 URL [本文引用: 1] 摘要
78 Strong relationship between LST and vegetation and impervious surface. 78 Stronger vegetation mitigation effect on UHI in summer than in early spring. 78 Largest residential contribution to UHI. 78 Strong influence of Urban landscape configuration on UHI.
|
| [27] |
Relationship between land surface temperature and spatial pattern of greenspace: What are the effects of spatial resolution [J].https://doi.org/10.1016/j.landurbplan.2013.02.005 URL [本文引用: 1] 摘要
Urban heat island (UHI) is a worldwide phenomenon, which causes many ecological and social consequences. Urban greenspace can decrease environmental temperature and thus alleviate UHI effects. Spatial pattern of greenspace, both composition and configuration, significantly affects land surface temperature (LST). Results from previous studies, however, showed inconsistent, or even contradictory relationships between LST and spatial pattern of greenspace, suggesting these relationships may be scale dependent (sensitive to spatial resolution). But few studies have explicitly addressed this issue. This paper examines whether the spatial resolution of the imagery used to map urban greenspace affect the relationship between LST and spatial pattern of greenspace, using Beijing, China as a case study. Spatial pattern of greenspace was measured with seven landscape metrics at three spatial resolutions (2.44m, 10m, and 30m) based on QuickBird, SPOT, and TM imagery. LST was derived from thermal band of Landsat TM imagery. The relationship between LST and spatial pattern of greenspace was examined by Pearson correlation and partial Pearson correlation analysis using census tract as analytical unit. Results showed that landscape metrics of greenspace varied by spatial resolution. Imagery with higher spatial resolution could more accurately quantify the spatial pattern of greenspace. The relationship between LST and abundance of greenspace was consistently negative, but the relationship between LST and spatial configuration of greenspace varied by spatial resolution. This study extended our scientific understanding of the effects of spatial pattern, especial spatial configuration of greenspace on LST. In addition, it can provide insights for urban greenspace planning and management.
|
| [28] |
Characterizing the spatial dynamics of land surface temperature-impervious surface fraction relationship [J].https://doi.org/10.1016/j.jag.2015.11.006 URL [本文引用: 1] 摘要
The land surface temperature (LST) pattern is treated as one of the primary indications of environmental impacts of land cover change. Researchers continue to explore the potential contribution of land surface to temperature rising. The LST-land surface relationship is dynamic and varies spatially. Based upon the previous studies, this research assumes that such dynamics is manifested at two levels: (1) the phenomenon level, and (2) its formation mechanism level. The research presents a workflow of exploring such dynamics at both levels. The variogram of the phenomenon and multi-scale analysis of the LST-land surface relationship are mutually interpreted. In the case study of Wuhan, China, the variogram of the LST indicates that the operational scale of the phenomenon is 500–65002m. It suggests the optimal scale to inspect the LST and its cause in the study area. This finding is verified and further inspected through multi-scale analysis of the LST–Impervious Surface Fraction (ISF) relationship at the formation mechanism level. The research also employs the Spatial Autocorrelation model to show how the ISF impacts the LST through scales. A flexible autocorrelation weight matrix is proposed and implemented in the model. The parameters of the model exhibit the thermal sensitivity of land surface and again represent the scale features. The Ordinary Least Square regression is used as the benchmark. Several implications are discussed.
|
| [29] |
Geographically weighted regression: A natural evolution of the expansion method for spatial data analysis [J]. |
| [30] |
Geographically weighted regression-modelling spatial non-stationarity [J].https://doi.org/10.1111/1467-9884.00145 URL [本文引用: 1] 摘要
In regression models where the cases are geographical locations, sometimes regression coefficients do not remain fixed over space. A technique for exploring this phenomenon, geographically weighted regression is introduced. A related Monte Carlo significance test for spatial non-stationarity is also considered. Finally, an example of the method is given, using limiting long-term illness data from the 1991 UK census.
|
| [31] |
地理加权回归基本理论与应用研究[D] .The Basic theoretics and application research on geographically weighted regression[D] . |
| [32] |
An unstandardized selective variance reduction script for elevation, latitude and longitude decorrelation stretch of multi-temporal LST imagery [J].https://doi.org/10.1007/s40808-016-0103-0 URL [本文引用: 1] 摘要
A selective variance reduction (SVR) script is presented that applies linear regression models to the principal components (PCs) of multi-temporal night monthly averaged land surface temperature...
|
| [33] |
基于TM/ETM+数据的沈阳市各区城市热岛特征 [J].
<div style="line-height: 150%">应用2001年8月和2010年8月Landsat TM/ETM<sup>+</sup>数据,计算沈阳市区及三环内各区的地表热岛强度(SUHI),根据土地利用数据和热岛源汇特征提取源汇信息,分析SUHI与土地利用类型、热岛源汇面积及边界长度、归一化植被指数(NDVI)、归一化建筑指数(NDBI)、改进的归一化差异水体指数(MNDWI)的关系。结果表明:2001年沈阳市区的中等热岛强度以上区域主要集中在三环内和苏家屯区,强热岛地区主要出现在铁西区和皇姑区;2010年中等以上热岛强度地区,与城区发展相一致,主要向西南,南面扩展,弱热岛、中等强度和强热岛地区有较大幅度的增加;城市热岛强度与NDVI存在显著的负相关,与NDBI存在显著的正相关;热岛源在区域内的面积比重与中等强度以上热岛存在较显著的相关关系,源汇边界长度与弱热岛和中等热岛存在较显著的相关关系。</div><div style="line-height: 150%"> </div><div style="line-height: 150%"> </div>
Urban heat island variation of each district in Shenyang based on TM /ETM+ data [J].
<div style="line-height: 150%">应用2001年8月和2010年8月Landsat TM/ETM<sup>+</sup>数据,计算沈阳市区及三环内各区的地表热岛强度(SUHI),根据土地利用数据和热岛源汇特征提取源汇信息,分析SUHI与土地利用类型、热岛源汇面积及边界长度、归一化植被指数(NDVI)、归一化建筑指数(NDBI)、改进的归一化差异水体指数(MNDWI)的关系。结果表明:2001年沈阳市区的中等热岛强度以上区域主要集中在三环内和苏家屯区,强热岛地区主要出现在铁西区和皇姑区;2010年中等以上热岛强度地区,与城区发展相一致,主要向西南,南面扩展,弱热岛、中等强度和强热岛地区有较大幅度的增加;城市热岛强度与NDVI存在显著的负相关,与NDBI存在显著的正相关;热岛源在区域内的面积比重与中等强度以上热岛存在较显著的相关关系,源汇边界长度与弱热岛和中等热岛存在较显著的相关关系。</div><div style="line-height: 150%"> </div><div style="line-height: 150%"> </div>
|
| [34] |
Remote sensing of the urban heat island and its changes in Xiamen City of SE China [J].https://doi.org/10.3321/j.issn:1001-0742.2004.02.022 URL PMID: 15137654 [本文引用: 1] 摘要
Abstract World-wide urbanization has significantly modified the landscape, which has important climatic implications across all scales due to the simultaneous removal of natural land cover and introduction of urban materials. This resulted in a phenomenon known as an urban heat island (UHI). A study on the UHI in Xiamen of China was carried out using remote sensing technology. Satellite thermal infrared images were used to determine surface radiant temperatures. Thermal remote sensing data were obtained from band 6 of two Landsat TM/ETM+ images of 1989 and 2000 to observe the UHI changes over 11-year period. The thermal infrared bands were processed through several image enhancement technologies. This generated two 3-dimension-perspective images of Xiamen's urban heat island in 1989 and 2000, respectively, and revealed heat characteristics and spatial distribution features of the UHI. To find out the change of the UHI between 1989 and 2000, the two thermal images were first normalized and scaled to seven grades to reduce seasonal difference and then overlaid to produce a difference image by subtracting corresponding pixels. The difference image showed an evident development of the urban heat island in the 11 years. This change was due largely to the urban expansion with a consequent alteration in the ratio of sensible heat flux to latent heat flux. To quantitatively compare UHI, an index called Urban-Heat-Island Ratio Index (URI) was created. It can reveal the intensity of the UHI within the urban area. The calculation of the index was based on the ratio of UHI area to urban area. The greater the index, the more intense the UHI was. The calculation of the index for the Xiamen City indicated that the ratio of UHI area to urban area in 2000 was less than that in 1989. High temperatures in several areas in 1989 were reduced or just disappeared, such as those in old downtown area and Gulangyu Island. For the potential mitigation of the UHI in Xiamen, a long-term heat island reduction strategy of planting shade trees and using light-colored, highly reflective roof and paving materials should be included in the plans of the city planers, environmental managers and other decision-makers to improve the overall urban environment in the future.
|
| [35] |
成都市热岛效应与城市空间发展关系分析 [J].https://doi.org/10.3724/SP.J.1047.2014.00070 URL Magsci [本文引用: 1] 摘要
利用Landsat卫星影像反演成都市中心城区1992、2001和2009年的地表温度,建筑用地和植被等信息,计算其城市热岛比例指数(URI),对成都市中心城区热岛效应与城市空间发展关系进行了分析。结果表明,在1992-2009年期间成都市主城区范围从91.24km<sup>2</sup>扩展到403.8km<sup>2</sup>。成都市建成区的大面积扩展导致了城市热岛空间分布发生迁移,从单中心聚集分布转变为多中心环状分布。回归分析说明,建筑用地和植被都是影响地表温度的重要因素,其中建筑用地与地表温度呈指数型正相关关系,而植被与地表温度呈负相关关系。总的看来,成都市中心城区在这17年间的热岛效应有了明显的缓解,城市热岛比例指数从0.72下降到0.33。城市植被覆盖率的增加和合理的规划对缓解城市热岛效应起到了积极的作用。
Analysis of the Relationship between urban heat island effect and urban expansion in Chengdu, China [J].https://doi.org/10.3724/SP.J.1047.2014.00070 URL Magsci [本文引用: 1] 摘要
利用Landsat卫星影像反演成都市中心城区1992、2001和2009年的地表温度,建筑用地和植被等信息,计算其城市热岛比例指数(URI),对成都市中心城区热岛效应与城市空间发展关系进行了分析。结果表明,在1992-2009年期间成都市主城区范围从91.24km<sup>2</sup>扩展到403.8km<sup>2</sup>。成都市建成区的大面积扩展导致了城市热岛空间分布发生迁移,从单中心聚集分布转变为多中心环状分布。回归分析说明,建筑用地和植被都是影响地表温度的重要因素,其中建筑用地与地表温度呈指数型正相关关系,而植被与地表温度呈负相关关系。总的看来,成都市中心城区在这17年间的热岛效应有了明显的缓解,城市热岛比例指数从0.72下降到0.33。城市植被覆盖率的增加和合理的规划对缓解城市热岛效应起到了积极的作用。
|
| [36] |
High-resolution multi-temporal mapping of global urban land using Landsat images based on the Google Earth Engine Platform [J].https://doi.org/10.1016/j.rse.2018.02.055 URL [本文引用: 1] 摘要
Cellular automata (CA) have been efficiently used to express the complexity and dynamics of cities at different scales. However, those large-scale simulation models typically use only binary values to represent urbanization states without considering mixed types within a cell. They also ignore differences among the cells in terms of their temporal evolution characteristics at different... [Show full abstract]
|

/
| 〈 |
|
〉 |
