刘怡媛 , 肖池伟, 刘影
LIU Yiyuan, XIAO Chiwei, LIU Ying
通讯作者:
收稿日期: 2018-08-29
修回日期: 2018-12-29
网络出版日期: 2019-03-15
版权声明: 2019 《地球信息科学学报》编辑部 《地球信息科学学报》编辑部 所有
基金资助:
作者简介:
作者简介:刘怡媛(1994-),女,江西赣州人,硕士生,主要从事资源遥感研究。E-mail: liuyiy163@163.com
展开
摘要
基于西双版纳2014年和2018年旱季Landsat-8 OLI遥感影像,利用橡胶林落叶-新叶萌生期内归一化焚烧指数变化率(CRNBR)算法,运用当年新叶萌生期植被分布(NDVI)与海拔数据(ASTER GDEM)进行掩膜提取,分别获取了2014年和2018年西双版纳橡胶成林种植面积,基于ArcGIS 10.5平台分析了橡胶成林时空格局和种植面积增减变化。结果表明: ① 西双版纳橡胶林主要分布于南部水热条件较好、中低海拔的橡胶种植适宜区。景洪市的橡胶林面积最大,其次是勐腊县,勐海县最小。集中分布于景洪市的勐龙镇、允景洪街道和嘎洒镇;勐腊县的关累镇、勐棒镇和勐满镇;② 西双版纳及其下辖一市两县2014-2018年橡胶林种植面积总体呈现下降趋势,减幅为17.27%。其中,勐腊县的减幅最大为19.10%,勐海县减幅最小,仅2.70%。③ 橡胶林持续种植区主要在景洪市勐龙镇、嘎洒镇和景哈镇等,勐腊县的关累镇、勐棒镇和勐腊镇等;橡胶林种植增加区主要集中在景洪市勐龙镇、嘎洒镇和允景洪街道,勐腊县关累镇、勐腊镇和勐伴镇,勐海县打洛镇;橡胶林种植减少区主要在景洪市勐养镇、嘎洒镇和勐龙镇,勐腊县勐棒镇、勐腊镇和勐伴镇,本研究可为西双版纳橡胶林种植现状特征提供了新的认识。
关键词:
Abstract
With the Landsat-8 Operational Land Imager (OLI) images over Xishuangbanna acquired during the dry seasons of 2014 and 2018 , the Change Rate of Normalized Burn Ratio (CRNBR) algorithm (reported in our previous study), along with two masks of Landsat-derived natural forest and Advanced Spaceborne Thermal Emission and Reflection Radiometer Global Digital Elevation Model (ASTER GDEM), were used to detect and obtain the geographical information of the mature rubber plantations during this period. The spatial and temporal change pattern of mature rubber plantations were detected and analyzed by means of spatial and statistical analyses using the ArcGIS 10.5 platform. Results showed that: (1) Mature rubber plantations were mainly distributed in areas with well hydrothermal conditions and moderate to low elevations in the south of Xishuangbanna. Jinghong City had the largest area of mature rubber plantations, followed by Mengla County and Menghai County accordingly. These plantations were typically concentrated within the towns of Menglong, Yunjinghong, and Gasa of Jinghong City, and Guanlei, Mengbang, and Mengman of Mengla County. (2) The declining area of mature rubber plantations were initially reported in Xishuangbanna from 2014 to 2018 (at a reduction of approximately 17.27%). In particular, Mengla County had the largest reduction in mature rubber plantations (19.10%), while Menghai County had the least (2.70%). (3) The stable plantation areas of mature rubber were predominantly located in the towns of Menglong, Gasa and Jingha of Jinghong City, and Guanlei, Mengbang and Mengla of Mengla County. The increase in mature rubber plantation areas were mainly concentrated in the towns of Menglong, Gasa and Yunjinghong in Jinghong City, Guanlei, Mengla and Mengban in Mengla County, and the town of Daluo in Menghai County. The reduction area was mainly evident in the towns of Mengyang, Gasa and Menglong of Jinghong City, and Mengbang of Mengla County and Mengban in Mengla County. This study can provide a new understanding of the current status of rubber plantation in Xishuangbanna.
Keywords:
天然橡胶树(Hevea brasiliensis)原本生长在南美洲亚马逊河流域,然而橡胶园却已在过去认为不适合种植的东南亚北部山区迅速扩展[1]。类似地,西双版纳自20世纪50年代以来经历了剧烈且广泛的土地利用变化,其中以橡胶林扩展尤为突出。橡胶林的快速发展虽然极大地改善了当地居民的收入状况[2],但也给当地生态环境造成了显著影响,如水土流失、土壤肥力下降和水质恶化等问题日益突出[3,4]。基于遥感手段进行橡胶林种植信息提取与动态监测,是开展橡胶林种植随市场波动及其动态变化的前提。
目前,有关橡胶林种植信息的算法构建、遥感监测及其动态分析等已取得一定研究进展。在遥感识别和监测方法方面,过去多以传统分类器为主,包括决策树法[5,6,7,8]、面向对象法[9,10,11]和最大似然法[3,12]等。2008年以来,随着Landsat历史影像产品免费共享,基于物候特征的遥感算法在橡胶林监测应用中表现出显著优势[13,14,15,16]。如基于单窗口或双窗口的物候算法减少了遥感监测所需的数据需求,又显著提高了分类结果精度[13,14,15,16,17]。在时空格局与分布特征等动态分析方面,相关研究主要分析了包括橡胶林种植面积变化、时空分布与地形、气候特征的相关性,认为橡胶林适宜海拔在600~1200 m[10],而种植海拔上限高达2100 m[5],适宜坡度在8~25 °之间[10]。同时,也对橡胶林林龄结构、地类转变关系以及扩展速度等进行了定量分析[18,19]。值得注意的是,过去学者普遍认为西双版纳橡胶林种植面积在增加,且不断向海拔更高、坡度更陡的区域扩张[7]。然而,在2015、2016与2018年共3年的实地考察与农户调研中发现,受2012年天然橡胶价格下跌的影响,西双版纳橡胶林种植区已有大量私营(民营)橡胶园因橡胶林快进入老林期(>20年)而提前淘汰老林并栽种橡胶幼苗,或不再更新种植橡胶林而改种菠萝、香蕉等其他经济作物的现象。不难发现,不同于国营橡胶农场,橡胶林市场价格的变动使得西双版纳胶农面临是否继续种植橡胶的窘境。由此,西双版纳近5年来橡胶林种植有什么新变化?其增长势头是否有所变化?这些都是亟待回答的现实问题。然而到目前为止,围绕上述问题的遥感监测与分析研究还未见报道。此外,Landsat影像作为橡胶林监测的常用数据产品,尽管ETM+条带问题限制了相关分析,但2013年初发射的OLI传感器系列产品数据为开展上述研究提供了可靠基础[20]。
本研究以西双版纳为试验区,利用2014与2018年落叶期-新叶萌生期内Landsat-8 OLI影像并计算相应的归一化焚烧指数(NBR)与归一化植被指数(NDVI),基于前期发表的NBR变化率(CRNBR)算法[15],结合ASTER GDEM 30 m海拔掩膜数据,分别提取了西双版纳两期橡胶成林的空间分布信息。在此基础上,分析了该州2014-2018年橡胶成林的增减变化及其时空格局,以期为西双版纳橡胶林种植现状特征提供新的认识。
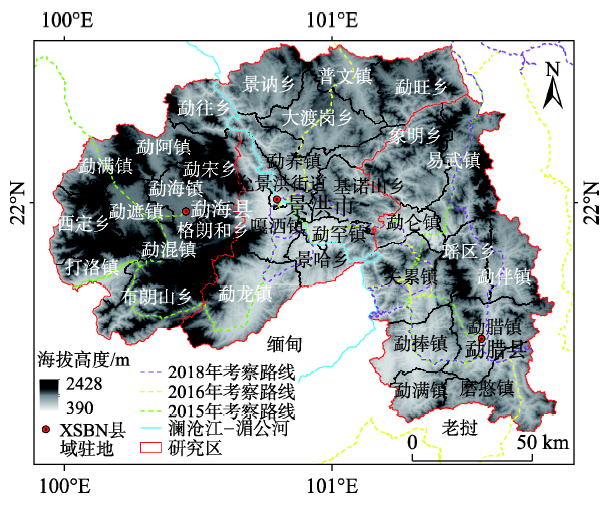
西双版纳傣族自治州(以下简称“西双版纳”或XSBN,图1)位于中国云南省南部边缘(21°08′ N–22°36′ N,99°56′ E–101°50′ E),下辖景洪市、勐海县和勐腊县,全州面积1.91×10⁴ km2。作为云南省边境州,南与老挝、缅甸接壤,国境线长966.3 km,东南亚第一大国际河流澜沧江-湄公河从此出境。全州以山地为主,海拔在389~2428 m之间,地形起伏较大。该州地处热带季风气候北缘,一年分为旱季(11月至次年4月)和雨季(5-10月),全州多年平均气温约19.7~22.9 ℃,年降雨量介于1036.1~2431.5 mm,年空气相对湿度达80 %以上。雨季优越的水、热、气等自然条件有利于包括橡胶林在内的热带植物生长。此外,长达半年的旱季又有利于无云/少云Landsat影像的获取[20,21]。
图1 研究区地形图及2015、2016和2018年考察路线
Fig. 1 Topographical map of the study area (ASTER GDEM) showing the field trips in 2015, 2016 and 2018
早在20世纪50年代,橡胶树就已被成功引入西双版纳,经过近70年的发展,现已成为中国第二大天然橡胶基地[9]。1956年起,华南垦殖区在西双版纳先后建立了11个国营农场。80年代早期,西双版纳橡胶种植以国营为主,发展规模较大,总面积达2.69×10⁴ hm2。90年代之后,橡胶价格不断上涨,极大激发了农民种植橡胶的热情,民营橡胶迅速发展,如早在1999年,全州橡胶林种植面积已达到14.32×10⁴ hm2,橡胶种植业成为了西双版纳农业中的一项基础支柱产业[9]。西双版纳原生树种以常绿林为主,而橡胶树通常在1月底至2月落叶,在3月上中旬发芽开始长出新叶,到3月底可完全长出新叶[15]。因此,橡胶成林特有的落叶-新叶萌生特征为遥感识别与监测提供了科学依据[22]。
从美国地质勘探局地球资源观测和科学中心(USGS EROS,https://espa.cr.usgs.gov/index/)订购并免费获取了西双版纳地区Landsat-8影像(P/R:130/045)的一级地形校正产品。USGS EROS提供了多项数据选项,包括多光谱波段的地表反射率(如Red和NIR)、光谱指数(如NDVI和NBR)与质量评价波段(QA)等。Landsat一级地形校正产品已经进行了辐射校正、几何精校正,数据质量能满足研究需要。根据橡胶成林旱季落叶-新叶萌生期物候特征与影像重访周期,并考虑到影像云量影响(如2015、2016、2017年落叶期或新叶萌生期的影像受云量影响较大,云量>18 %),本文分别获取了2014年和2018年2月落叶期、3月新叶期无云或少云的4景OLI影像(表1)进行橡胶成林提取等。通过影像对比分析,对于影像中受到云及其阴影影响的像元,利用QA数据进行剔除处理。
表1 2014和2018年西双版纳Landsat-8 OLI影像使用列表
Tab. 1 Lists of Landsat-8 OLI images over Xishuangbanna in 2014 and 2018 used in this study
| 影像获取时间 | 云量/% | 物候期 | 不同影像边界对应的西双版纳面积/% | |
|---|---|---|---|---|
| 落叶期 | 新叶萌生期 | |||
| 2014-02-09 | 0.01 | 1月底-2月 | 3月 | 95.44 |
| 2014-03-13 | 4.08 | 95.32 | ||
| 2018-02-20 | 0 | 95.73 | ||
| 2018-03-08 | 2.52 | 95.76 | ||
为了揭示西双版纳近5年来橡胶成林种植的时空变化过程和地域增减差异,本文利用归一化焚烧指数变化率(CRNBR)算法[15]提取出橡胶成林的可能像元,并再结合当年新叶萌生期内归一化植被指数(NDVI)和数字高程模型(DEM)作为掩膜条件,进一步提取2014年与2018年橡胶成林真实分布信息与面积。NBR[23]及CRNBR[15]的计算公式如下:
式中:
此前,利用CRNBR>1.0提取了西双版纳橡胶林的空间分布信息[15]。然而,通过对比影像与遥感提取结果发现,新叶萌生期内NBR值只需要大于落叶期内NBR值便能有效识别与提取出橡胶成林信息。因此,在本文中对该指数进行适当修正,即以CRNBR>0来确定西双版纳橡胶成林种植信息的可能分布,而其他地类相应的CRNBR≤0。在此基础上,利用当年新叶萌生期内影像的植被分布(NDVI>0.60[15])与橡胶林适宜种植海拔范围(600 m <DEM<1200 m)进一步确定橡胶林最终分布信息。需要说明,植被掩膜主要是用来消除物候期内非林地的影响[17]。地形(海拔)掩膜“下限”(600 m)是为了进一步消除建设用地对橡胶林提取的影响,而海拔“上限”(1200 m)主要是考虑到橡胶林种植一般不超过这个界线。此外,需要特别说明的是,西双版纳橡胶幼林一般需要6-7年以上开割[15,17]。在开割以前橡胶林冠层郁闭度较低,且落叶特征不太明显[19],在遥感监测中不易被识别出来,故本文基于归一化焚烧指数变化率(CRNBR)算法的监测对象为橡胶成林。
当前,对于典型地类(如橡胶林)的监测过程中,使用Google Earth(GE)图像进行训练算法和验证结果较为常见[14,24-25]。GE影像的高分辨率和橡胶林环状纹理特征,为样本的选择提供了基础。基于2014年和2018年GE影像,结合2015、2016与2018年3次野外调查所收集的点位照片,分别随机选取了2014年的样本(橡胶成林186个、非橡胶林90个)和2018年的样本(橡胶成林156个、非橡胶林78个)。需要说明的是,所选样点均没有受到云或阴影的影响,且橡胶林样点位于均质的大块林地。基于混淆矩阵(表2)结果表明,2014年的分类总体精度为92.16 %,Kappa系数为0.84;2018年的分类总体精度为91.77 %,Kappa系数为0.83。精度评价表明,基于Landsat-8 OLI的影像的归一化焚烧指数变化率(CRNBR)算法,对于西双版纳橡胶成林种植信息的提取是可行的,相应结果可满足时空分析需求。
表2 基于混淆矩阵的西双版纳2014年和2018年橡胶成林提取结果精度评价
Tab. 2 Accuracy assessment of mature rubber plantations derived from the CRNBR approach via confusion matrix in Xishuanbanna in 2014 and 2018
| 地表真实像素分类数据 | 用户精度 | 整体精度/% | Kappa系数 | |||||
|---|---|---|---|---|---|---|---|---|
| 橡胶成林 | 非橡胶成林 | 小计 | ||||||
| 2014年 | 分类结果 | 橡胶成林 | 23 429 | 337 | 23 766 | 0.99 | 92.16 | 0.84 |
| 非橡胶成林 | 2890 | 14 514 | 17 404 | 0.83 | ||||
| 小计 | 26 319 | 14 851 | 41 170 | |||||
| 生产者精度 | 0.89 | 0.98 | ||||||
| 2018年 | 分类结果 | 橡胶成林 | 22 409 | 392 | 22 801 | 0.98 | 91.77 | 0.83 |
| 非橡胶成林 | 2986 | 15 238 | 18 224 | 0.84 | ||||
| 小计 | 25 395 | 15 630 | 41 025 | |||||
| 生产者精度 | 0.88 | 0.97 | ||||||
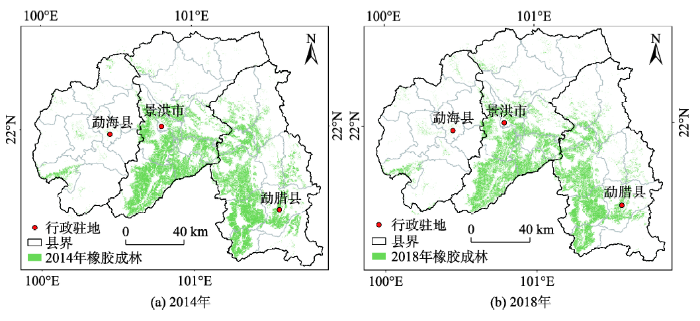
基于物候特征的CRNBR橡胶成林提取算法,分别提取了西双版纳2014年和2018年橡胶林种植的分布信息(图2)。结果表明,西双版纳橡胶林主要分布于南部中低海拔、水热条件较好的橡胶种植适宜区。具体来看,超过80%橡胶林的种植区分布于景洪市南部与东南部乡镇(包括勐龙镇、允景洪街道、嘎洒镇、景哈乡、勐养镇和勐罕镇)、勐腊县西南部乡镇(包括关累镇、勐棒镇、勐满镇、勐仑镇和勐腊镇)。此外,在勐海县西南部打洛镇、景洪市北部景讷乡和勐腊县东部勐伴镇,北部的象明乡都有较小范围的分布。
图2 2014年和2018年西双版纳橡胶成林空间分布
Fig. 2 Maps of mature rubber plantations in Xishuangbanna in 2014 and 2018
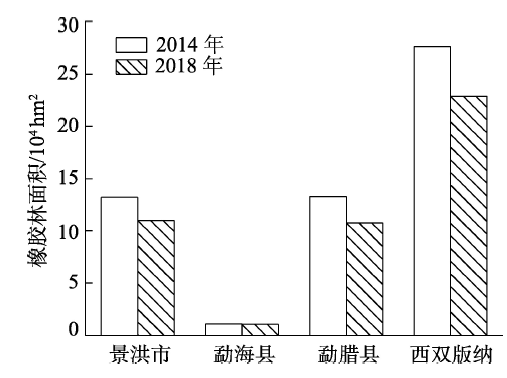
根据2014-2018年橡胶成林种植信息提取结果(图3)分析发现,西双版纳及其下辖一市两县2014-2018年橡胶林种植面积总体呈现下降趋势,共减少了4.78×10⁴ hm2,减幅约为17.27%。这表明2014-2018年大面积的橡胶林转换成其他经济作物或者其他地物类型。就一市两县而言,其橡胶林种植面积差异较大。景洪市和勐腊县种植面积占了全州的绝大部分,而勐海县种植橡胶林的面积远小于景洪市和勐腊县,仅占全州种植面积的5%左右。景洪市从2014年的13.21×10⁴ hm2减少到2018年的11.01×10⁴ hm2,减幅为16.65%;勐腊县从2014年的13.30×10⁴ hm2降低至2018年的10.76×10⁴ hm2,减幅达到19.10%;而勐海县由于种植面积基数最小,因此减少的面积也最小,减幅为2.70%。总体而言,景洪市的橡胶林种植面积最大,而勐腊县2014-2018年的减幅最大。
图3 西双版纳及相应市县2014和2018年橡胶成林种植面积
Fig. 3 Changes in the area sizes of mature rubber plantation in Xishuangbanna between 2014 and 2018
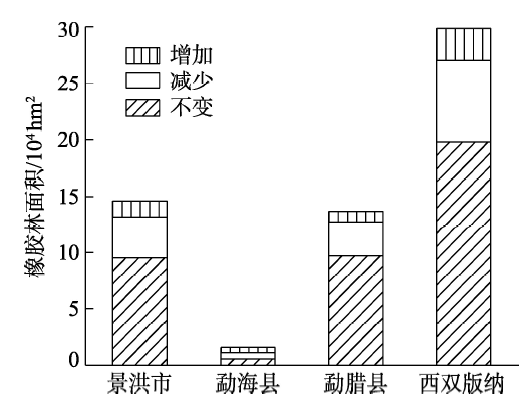
为了进一步厘清西双版纳近5年橡胶林种植面积增减变化与区域差异,通过分区统计,得到西双版纳2014-2018年橡胶林种植面积增减变化图(图4)。2014-2018年整个西双版纳橡胶林种植面积呈减少状态,且橡胶林种植的减少区远大于增加区,其中橡胶林持续不变的种植区面积有19.80×10⁴ hm2,减少的面积达7.25×10⁴ hm2,增加的面积约2.83×10⁴ hm2。由于数据处理时将云/影像元剔除为空值,可能与直接提取的橡胶林有一些误差。一市两县中,橡胶林持续种植区的面积最大的勐腊县(9.73×104 hm2),其次是景洪市(9.53×10⁴ hm2),勐海县最小;橡胶林种植增加量由大到小依次是景洪市(1.41×10⁴ hm2)、勐腊县(2.06×10⁴ hm2)和勐海县(1.00×10⁴ hm2);橡胶林种植区减少最多的是景洪市(3.67×10⁴ hm2),勐腊县紧随其后(3.03×10⁴ hm2),勐海县减少的面积最小。在2014-2018年勐腊县持续种植橡胶林的面积最大,景洪市橡胶林变化(增加和减少之和)的面积最大。
图4 西双版纳及其相应市县2014-2018年橡胶成林种植面积增减变化
Fig. 4 Differences in the change of rubber plantation area in Xishuangbanna from 2014 to 2018
从乡镇橡胶林种植的时空变化来看(图5(a)),橡胶林持续种植区主要分布在国营农场所在的乡镇,如景洪市的勐龙镇、嘎洒镇和景哈镇等,勐腊县的关累镇、勐棒镇和勐腊镇等。橡胶林种植增加区有景洪市的勐龙镇、嘎洒镇和允景洪街道,勐腊县的关累镇、勐腊镇和勐伴镇,勐海县的打洛镇,其余乡镇橡胶林种植区仅有零星增加。橡胶林种植减少区则主要分布在景洪市的勐养镇、嘎洒镇和勐龙镇,勐腊县的勐棒镇、勐腊镇和勐伴镇,其余乡镇橡胶林种植区也有零星减少。结合实地调研与文献研究,分析发现橡胶林种植面积增加可能与主要经营橡胶生产的大型半私有化公司、私营公司凭借其大规模以及长时间的经营经验认定橡胶种植在未来仍具有的潜在利润有关,促使了扩展橡胶再生产[26]。
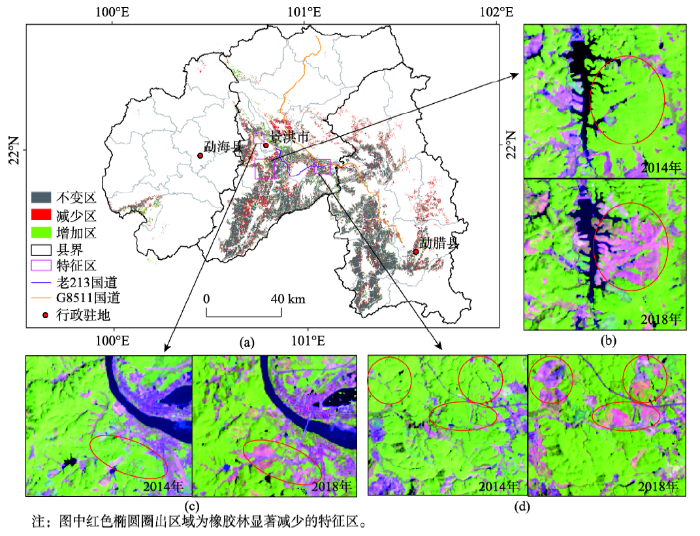
图5 西双版纳2014-2018年橡胶成林面积空间增减及影像对比
Fig. 5 Dynamic pattern of mature rubber plantations and regional imaging comparisons in Xishuangbanna from 2014 to 2018
橡胶种植减少原因可能与以下因素有关: ①2012年起,西双版纳橡胶价格持续下跌,致使部分胶农将其橡胶园租出,甚至停止开采或更新[26]。②在政府土地利用政策影响下,西双版纳部分村民重视原生森林衍生的生态系统服务以及精神利益,促使新开辟区域橡胶林种植现象显著减少[27]。 ③2011年云南省政府批准的《西双版纳环保橡胶管理工作指导意见》,明确要求制定以市场为基础的生态补偿/支付方案和生态系统服务奖励,这也在很大程度上抑制了橡胶林继续扩张[28]。
在以往的研究中,更多关注橡胶林种植的增加或跨境扩展,而忽略了橡胶林种植减少的客观事实。因此,在西双版纳2014-2018年橡胶林种植增减变化图的基础上,利用Landsat影像进一步对比分析了橡胶林减少较为明显的区域。如图5所示,在景洪市勐龙镇居民聚集区的北缘坝卡村附近有集中的、成片的橡胶林减少,并在勐龙镇与勐罕镇一条东北西南方向的乡道两侧也有较为明显的橡胶林减少,在嘎洒镇居民聚集区的北缘因道路的扩建也导致橡胶林明显的减少。此外,嘎洒镇中部地区的曼飞龙水库周边(图5(b))、嘎洒镇和允景洪街道交界的澜沧江南岸也出现了成片的橡胶林减少区(图5(c))。在勐罕镇的东北部国道G8511和老213国道两侧出现大面积连片的橡胶林减少区(图5(d))。在勐腊镇大沙坝水库的南部和勐腊镇居民点北侧的橡胶林也出现成片的减少。通过对橡胶林减少较为明显区域的重点分析,发现橡胶林种植的减少区主要集中在城镇建设用地、水库、湖泊的边缘以及河道、公路的两侧。
随着城市化的不断推进,人工建设用地必然要优先挤占附近的低平土地,因此城镇居民建设用地周边的橡胶林种植面积减少是大势所趋。此外,2012年西双版纳生物产业作物办公室“十二五”规划,其中概述了考虑到生态系统服务的橡胶林土地利用战略,其要点有避免在海拔高、坡度陡的区域种植橡胶,并在河道和其他走廊上种植当地原生植物物种作为缓冲地带,这也是河道和公路两侧橡胶成林减少的原因。水库周边橡胶林减少,其主要原因是为了避免橡胶林种植对饮用水的污染。橡胶作物生长期使用化肥导致当地水体富营养化,同时除草剂的流失也可能污染当地饮用水源[29]。
本文利用西双版纳2014年和2018年Landsat-8 OLI遥感影像,基于橡胶成林落叶-新叶萌生期内归一化焚烧指数变化率(CRNBR)算法,结合当年新叶萌生期植被(NDVI>0.60)分布与海拔数据(600 m <DEM<1200 m)进行掩膜,提取了该州2014年和2018年橡胶成林种植面积,通过空间分析揭示了橡胶成林时空格局和种植面积增减变化。结果表明:
(1)基于橡胶成林落叶-新叶萌生期内归一化焚烧指数变化率(CRNBR>0)算法,能够有效提取西双版纳落叶型橡胶成林分布信息。在提取阈值界定上,进一步完善了CRNBR算法。
(2)西双版纳橡胶林主要分布于南部中低海拔、水热条件较好的橡胶种植适宜区。景洪市的橡胶林面积最大,其次是勐腊县,勐海县最小。集中分布在景洪市勐龙镇、允景洪街道、嘎洒镇;勐腊县关累镇、勐棒镇、勐满镇。
(3)西双版纳及其下辖一市两县2014-2018年橡胶林种植面积总体呈现下降趋势,从2014年的27.62×10⁴ hm2到2018年的22.85×10⁴ hm2,减幅为17.27%。其中,勐腊县的减幅最大为19.10%,勐海县减幅最小仅2.70%。
(4)橡胶林持续种植区主要是景洪市勐龙镇、嘎洒镇和景哈镇等,勐腊县的关累镇、勐棒镇和勐腊镇等;橡胶林种植增加区主要集中在景洪市勐龙镇、嘎洒镇和允景洪街道,勐腊县关累镇、勐腊镇和勐伴镇,勐海县打洛镇;橡胶林种植减少区主要在景洪市勐养镇、嘎洒镇和勐龙镇,勐腊县勐棒镇、勐腊镇和勐伴镇。
值得强调,受Landsat重访周期(16 d)的影响,每年选取的落叶期和生叶期的影像略有差异,导致提出结果可能存在差异。另外,在数据处理过程中利用QA数据将云量和阴影的覆盖像素全部剔除,也会使部分的橡胶林种植区被剔除,导致提取面积有所减少。因此,未来通过提高影像时间分辨率,减少云/影干扰,可进一步提高遥感分类精度。此外,作为中国重要的橡胶种植基地和橡胶跨境(老挝、缅甸)种植前沿,尽管价格波动是西双版纳橡胶林种植面积增长势头发生较大变化的重要原因之一,但有关其他驱动因素及其影响程度等研究缺乏相应报道。因此,未来亟待从胶农层面(微观视角),进一步厘清当前形势下西双版纳橡胶林时空变化的驱动因素及其影响。
The authors have declared that no competing interests exist.
| [1] |
The rubber juggernaut [J].https://doi.org/10.1126/science.1173833 URL [本文引用: 1] |
| [2] |
西双版纳土地利用/土地覆被变化时空格局分析 [J].
西双版纳土地利用/土地覆被变化对于区域土地资源合理利用和生态环境保护以及边境安全保障具有重要意义。基于Landsat TM/ETM遥感数据,采用决策树分类方法,获得西双版纳1990年、2000年和2010年3期的土地利用/土地覆被分类数据;从结构变化、类型变化、空间变化3个角度,系统分析1990-2010年间西双版纳的土地利用/土地覆被时空变化规律,并对轮歇地、茶园和橡胶园3个典型地类进行了重点讨论。研究表明:①西双版纳土地利用/土地覆被呈现以"林地-园地-耕地"为主导的地域结构特征,有林地是最为重要的土地覆被类型,橡胶园是最为主要的土地利用类型;②1990-2010年间,土地利用/土地覆被变化速度呈加快趋势,土地利用强度呈增加趋势,近10年来则更为显著;③1990-2010年间,土地利用/土地覆被变化的主要特征是有林地不断减少,橡胶园、旱地和茶园不断增加;有林地为面积减少最多的地类,橡胶园为面积增加最多的地类,轮歇地为增速最快的地类,灌木林地为减速最快的地类;④1990-2010年间,土地利用/土地覆被类型发生转化的地类主要是轮歇地、灌木林地和有林地,主要的转化方向是轮歇地向有林地和灌木林地转化,橡胶园和茶园的主要来源是有林地和灌木林;⑤1990-2010年间,土地利用/土地覆被空间变化较显著的地类是有林地、灌木林地、橡胶园、茶园和轮歇地;有林地呈以减少为主要特征的"南退北进"的空间变化特征,灌木林地呈先增加后减少为主要特征的"西退东进、南退北进"的空间变化特征,橡胶园呈以增加为主要特征的"以景洪市区为中心,北上南进,西拓东扩"的空间变化特征。
Spatial-temporal pattern analysis of land use and land cover change in Xishuangbanna [J].
西双版纳土地利用/土地覆被变化对于区域土地资源合理利用和生态环境保护以及边境安全保障具有重要意义。基于Landsat TM/ETM遥感数据,采用决策树分类方法,获得西双版纳1990年、2000年和2010年3期的土地利用/土地覆被分类数据;从结构变化、类型变化、空间变化3个角度,系统分析1990-2010年间西双版纳的土地利用/土地覆被时空变化规律,并对轮歇地、茶园和橡胶园3个典型地类进行了重点讨论。研究表明:①西双版纳土地利用/土地覆被呈现以"林地-园地-耕地"为主导的地域结构特征,有林地是最为重要的土地覆被类型,橡胶园是最为主要的土地利用类型;②1990-2010年间,土地利用/土地覆被变化速度呈加快趋势,土地利用强度呈增加趋势,近10年来则更为显著;③1990-2010年间,土地利用/土地覆被变化的主要特征是有林地不断减少,橡胶园、旱地和茶园不断增加;有林地为面积减少最多的地类,橡胶园为面积增加最多的地类,轮歇地为增速最快的地类,灌木林地为减速最快的地类;④1990-2010年间,土地利用/土地覆被类型发生转化的地类主要是轮歇地、灌木林地和有林地,主要的转化方向是轮歇地向有林地和灌木林地转化,橡胶园和茶园的主要来源是有林地和灌木林;⑤1990-2010年间,土地利用/土地覆被空间变化较显著的地类是有林地、灌木林地、橡胶园、茶园和轮歇地;有林地呈以减少为主要特征的"南退北进"的空间变化特征,灌木林地呈先增加后减少为主要特征的"西退东进、南退北进"的空间变化特征,橡胶园呈以增加为主要特征的"以景洪市区为中心,北上南进,西拓东扩"的空间变化特征。
|
| [3] |
Demand for rubber is causing the loss of high diversity rain forest in SW China [J].https://doi.org/10.1007/s10531-006-9052-7 URL [本文引用: 2] |
| [4] |
Rubber plantations act as water pumps in tropical China [J].https://doi.org/10.1029/2011GL050006 URL [本文引用: 1] 摘要
Whether rubber plantations have the role of water pumps in tropical Southeast Asia is under active debate. Fifteen years (1994-2008) of paired catchments water observation data and one year paired eddy covariance water flux data in primary tropical rain forest and tropical rubber plantation was used to clarify how rubber plantation affects local water resources of Xishuangbanna, China. Both catchment water observations and direct eddy covariance estimates indicates that more water was evapotranspired from rubber plantation (1137 mm based on catchment water balance, 1125 mm based on eddy covariance) than from the rain forest (969 mm based on catchment water balance, 927 mm based on eddy covariance). Soil water storage during the rainy season is not sufficient to maintain such high evapotranspiration rates, resulting in zero flow and water shortages during the dry season in the rubber plantation. Therefore, this study supports the idea that rubber plantations act as water pumps as suggested by local inhabitants.
|
| [5] |
基于HJ-1CCD数据的西双版纳地区橡胶林分布特征 [J].
The distribution situation of the rubber tree Hevea brasiliensis in the Xishuangbanna area in 2011 was estimated using decision tree classification of HJ-1 satellite data and field sampling data. A quantitative evaluation of climatic characteristics and topography was conducted on this basis by spatial analysis in a geographic information system using digital elevation model and climatic data. The climate boundary of Hevea brasiliensis distribution as well as the range of altitude, slope and aspect tolerated by the species in the Xishuangbanna area were determined. The results show that the classification information acquired from HJ-1 satellite data is accurate enough to allow the dynamic monitoring of key vegetation issues. Eighty percent of Hevea brasiliensis forest was found at an elevation of 600-1300 m, with a maximum of 2100 m. Ninety percent of forest was on slopes from 0-24 degrees. The species appeared not to be sensitive to aspect and to favor areas with an average annual temperature of 18℃- with a maximum temperature of 25℃, and minimum temperature of 14℃. The relationship between slope, elevation and distribution frequency of Hevea brasiliensis can be modeled by a Gauss function. Quantification of the climatic and topographic extent of forest distribution has a significant role in the management and restoration of damaged forest ecosystems.
Analysis of distribution characteristics of Hevea brasiliensis in the Xishuangbanna area based on HJ-1 satellite data [J].
The distribution situation of the rubber tree Hevea brasiliensis in the Xishuangbanna area in 2011 was estimated using decision tree classification of HJ-1 satellite data and field sampling data. A quantitative evaluation of climatic characteristics and topography was conducted on this basis by spatial analysis in a geographic information system using digital elevation model and climatic data. The climate boundary of Hevea brasiliensis distribution as well as the range of altitude, slope and aspect tolerated by the species in the Xishuangbanna area were determined. The results show that the classification information acquired from HJ-1 satellite data is accurate enough to allow the dynamic monitoring of key vegetation issues. Eighty percent of Hevea brasiliensis forest was found at an elevation of 600-1300 m, with a maximum of 2100 m. Ninety percent of forest was on slopes from 0-24 degrees. The species appeared not to be sensitive to aspect and to favor areas with an average annual temperature of 18℃- with a maximum temperature of 25℃, and minimum temperature of 14℃. The relationship between slope, elevation and distribution frequency of Hevea brasiliensis can be modeled by a Gauss function. Quantification of the climatic and topographic extent of forest distribution has a significant role in the management and restoration of damaged forest ecosystems.
|
| [6] |
基于决策树分类的橡胶林地遥感识别 [J].https://doi.org/10.3969/j.issn.1002-6819.2013.24.022 URL Magsci [本文引用: 1] 摘要
中老缅交界地区是橡胶林地的主要种植区,利用遥感手段快速动态监测橡胶林地的时空变化,对于橡胶合理种植、生态环境保护以及边境安全保障具有重要的科学价值和实践意义。研究基于Landsat数据和MODIS-NDVI数据,采用决策树分类的方法提取中老缅交界地区的橡胶林地。研究发现:1)1月上旬至3月下旬为提取橡胶林地的主要时间窗口;根据橡胶林不同树龄所表现的光谱差异,按照橡胶幼林(<10 a)和橡胶成林(≥10 a)提取橡胶林地;橡胶成林、高植被覆盖度的旱地、有林地容易发生误分,橡胶幼林、茶园、灌木林地和草地容易发生混淆。2)基于原始光谱特征、归一化指数、K-T变换指数以及纹理特征分别构建橡胶幼林和橡胶成林决策树分类模型;2010年橡胶成林分类总精度超过90%,橡胶幼林分类总精度超过75%;对同一地区1980、1990、2000年3个时相的决策树分类发现,橡胶幼林和橡胶成林决策树分类模型简单有效,结合晚期的橡胶成林来验证提取早期的橡胶幼林可以达到更高的分类精度。3)1980-2010年间,中老缅交界地区橡胶林地由7.05万hm2增至60.14万hm2,橡胶林地扩张趋势显著;橡胶幼林扩张速度明显快于橡胶成林,特别是近10 a来;西双版纳橡胶种植面积在中老缅交界地区占主导地位,橡胶林地不断向老挝、缅甸边境地区扩张。
Application of decision tree classification to rubber plantations extraction with remote sensing [J].https://doi.org/10.3969/j.issn.1002-6819.2013.24.022 URL Magsci [本文引用: 1] 摘要
中老缅交界地区是橡胶林地的主要种植区,利用遥感手段快速动态监测橡胶林地的时空变化,对于橡胶合理种植、生态环境保护以及边境安全保障具有重要的科学价值和实践意义。研究基于Landsat数据和MODIS-NDVI数据,采用决策树分类的方法提取中老缅交界地区的橡胶林地。研究发现:1)1月上旬至3月下旬为提取橡胶林地的主要时间窗口;根据橡胶林不同树龄所表现的光谱差异,按照橡胶幼林(<10 a)和橡胶成林(≥10 a)提取橡胶林地;橡胶成林、高植被覆盖度的旱地、有林地容易发生误分,橡胶幼林、茶园、灌木林地和草地容易发生混淆。2)基于原始光谱特征、归一化指数、K-T变换指数以及纹理特征分别构建橡胶幼林和橡胶成林决策树分类模型;2010年橡胶成林分类总精度超过90%,橡胶幼林分类总精度超过75%;对同一地区1980、1990、2000年3个时相的决策树分类发现,橡胶幼林和橡胶成林决策树分类模型简单有效,结合晚期的橡胶成林来验证提取早期的橡胶幼林可以达到更高的分类精度。3)1980-2010年间,中老缅交界地区橡胶林地由7.05万hm2增至60.14万hm2,橡胶林地扩张趋势显著;橡胶幼林扩张速度明显快于橡胶成林,特别是近10 a来;西双版纳橡胶种植面积在中老缅交界地区占主导地位,橡胶林地不断向老挝、缅甸边境地区扩张。
|
| [7] |
老挝北部5省橡胶林提取及时空扩张研究 [J].https://doi.org/10.13275/j.cnki.lykxyj.2017.05.002 URL [本文引用: 2] 摘要
[目的]分析老挝北部“金三角”地区橡胶林提取方法及橡胶林时空扩张特征,为合理规划橡胶种植、区域生态环境保护等提供方法和依据.[方法]基于MODIS影像和橡胶林物候特征,选取不同地类特征参数,实现橡胶林空间分布快速可重复的决策树提取新方法,并基于单一土地利用率模型研究橡胶林扩张机制.[结果](1)橡胶林提取时间窗口为1月至3月,基于不同地类特征参数生成的橡胶成林、幼林决策树提取方法总精度为80.67%,高分一号影像通过面向对象方法验证MODIS影像提取结果精度可靠.(2)2010-2015年,老挝北部5省橡胶林由12.6万hm2扩张到16.96万hm2,面积变化率最大的是乌多姆赛省,丰沙里省扩张速度最慢.[结论] MODIS影像提取橡胶林方法和结果简单有效.橡胶林分布在海拔和坡度上呈现不断上升的趋势,海拔1500m以上零星分布,坡度上分布上限为35°,而坡向扩张无明显规律.从LUCC视角分析得到橡胶林时空扩张的主要影响因素是社会政策和经济因素.
Research on extraction and spatial-temporal expansion of rubber forest in five provinces of northern Laos based on multi-source remote sensing [J].https://doi.org/10.13275/j.cnki.lykxyj.2017.05.002 URL [本文引用: 2] 摘要
[目的]分析老挝北部“金三角”地区橡胶林提取方法及橡胶林时空扩张特征,为合理规划橡胶种植、区域生态环境保护等提供方法和依据.[方法]基于MODIS影像和橡胶林物候特征,选取不同地类特征参数,实现橡胶林空间分布快速可重复的决策树提取新方法,并基于单一土地利用率模型研究橡胶林扩张机制.[结果](1)橡胶林提取时间窗口为1月至3月,基于不同地类特征参数生成的橡胶成林、幼林决策树提取方法总精度为80.67%,高分一号影像通过面向对象方法验证MODIS影像提取结果精度可靠.(2)2010-2015年,老挝北部5省橡胶林由12.6万hm2扩张到16.96万hm2,面积变化率最大的是乌多姆赛省,丰沙里省扩张速度最慢.[结论] MODIS影像提取橡胶林方法和结果简单有效.橡胶林分布在海拔和坡度上呈现不断上升的趋势,海拔1500m以上零星分布,坡度上分布上限为35°,而坡向扩张无明显规律.从LUCC视角分析得到橡胶林时空扩张的主要影响因素是社会政策和经济因素.
|
| [8] |
基于决策树的多角度遥感影像分类 [J].https://doi.org/10.3724/SP.J.1047.2016.00416 URL Magsci [本文引用: 1] 摘要
<p>快速准确地获取土地利用/覆被信息是遥感领域研究的一个热点课题.本文用5种决策树分类器及MISR多角度数据,对塔里木河下游地区进行土地覆被分类研究.通过对不同波段和观测角数据组合形成的6个数据集进行分类比较发现:(1)无论使用哪种分类器,相比于天底角观测方式,多角度观测都能获得更高的分类精度,特别是能显著提高灌木,林地和草地类型的分类精度,说明多角度观测能有效地反映地物的反射异质性信息,更好地区分地物.(2)与MLC分类法相比,决策树算法的分类精度更高,特别是随机森林和C 5.0方法最为突出,说明决策树的分类能力要优于MLC法.使用多角度数据集时,这种差别更明显,说明决策树能更有效地利用多角度信息.(3)4种决策树算法(J48,Random Forest,LMT,C 5.0)使用近红外波段的分类效果好于使用红光波段的分类效果,说明近红外波段能提供更多的地物反射异质性信息.</p>
Classification of MISR multi- angle imagery based on decision tree classifier [J].https://doi.org/10.3724/SP.J.1047.2016.00416 URL Magsci [本文引用: 1] 摘要
<p>快速准确地获取土地利用/覆被信息是遥感领域研究的一个热点课题.本文用5种决策树分类器及MISR多角度数据,对塔里木河下游地区进行土地覆被分类研究.通过对不同波段和观测角数据组合形成的6个数据集进行分类比较发现:(1)无论使用哪种分类器,相比于天底角观测方式,多角度观测都能获得更高的分类精度,特别是能显著提高灌木,林地和草地类型的分类精度,说明多角度观测能有效地反映地物的反射异质性信息,更好地区分地物.(2)与MLC分类法相比,决策树算法的分类精度更高,特别是随机森林和C 5.0方法最为突出,说明决策树的分类能力要优于MLC法.使用多角度数据集时,这种差别更明显,说明决策树能更有效地利用多角度信息.(3)4种决策树算法(J48,Random Forest,LMT,C 5.0)使用近红外波段的分类效果好于使用红光波段的分类效果,说明近红外波段能提供更多的地物反射异质性信息.</p>
|
| [9] |
西双版纳橡胶林地的遥感识别与数字制图 [J].
橡胶林地是西双版纳人工景观的主导类型, 橡胶林地的遥感识别与动态监测对于促进西双版纳的经济发展和生态保护具有重要意义。研究基于MODIS-NDVI数据, 通过分析各植被覆盖地类的物候特征, 判定橡胶林提取的时间窗口;以2010年TM为主要数据源, 根据橡胶林在不同树龄所表现的光谱差异, 采用面向对象分类方法, 按照橡胶幼林(<10年)、橡胶成林(≥10年)系统分析其光谱、纹理、地形以及类相关特征, 完成了2010年橡胶林地的提取与制图。精度评价结果表明, 总分类精度达到85.20%, 较基于像元的决策树分类精度提高5.20%;其中橡胶成林分类精度达到92.50%, 橡胶幼林分类精度在76.42%。统计结果表明, 橡胶幼林与橡胶成林种植面积比重为1.04:1, 与目前民营橡胶种植面积超过国营橡胶种植面积现状相吻合。研究提出来一种验证和提高橡胶林分类精度的新方法, 即采用相同分类方法提取2000年的橡胶林地, 通过2000年和2010年两期橡胶林地变化的叠加分析, 发现橡胶成林提取方法较为可靠, 而橡胶幼林误分率略大, 可通过提取更晚年份的橡胶成林来进一步改善和提高提取精度。
Rubber plantations in Xishuangbanna: Remote sensing identification and digital mapping [J].
橡胶林地是西双版纳人工景观的主导类型, 橡胶林地的遥感识别与动态监测对于促进西双版纳的经济发展和生态保护具有重要意义。研究基于MODIS-NDVI数据, 通过分析各植被覆盖地类的物候特征, 判定橡胶林提取的时间窗口;以2010年TM为主要数据源, 根据橡胶林在不同树龄所表现的光谱差异, 采用面向对象分类方法, 按照橡胶幼林(<10年)、橡胶成林(≥10年)系统分析其光谱、纹理、地形以及类相关特征, 完成了2010年橡胶林地的提取与制图。精度评价结果表明, 总分类精度达到85.20%, 较基于像元的决策树分类精度提高5.20%;其中橡胶成林分类精度达到92.50%, 橡胶幼林分类精度在76.42%。统计结果表明, 橡胶幼林与橡胶成林种植面积比重为1.04:1, 与目前民营橡胶种植面积超过国营橡胶种植面积现状相吻合。研究提出来一种验证和提高橡胶林分类精度的新方法, 即采用相同分类方法提取2000年的橡胶林地, 通过2000年和2010年两期橡胶林地变化的叠加分析, 发现橡胶成林提取方法较为可靠, 而橡胶幼林误分率略大, 可通过提取更晚年份的橡胶成林来进一步改善和提高提取精度。
|
| [10] |
西双版纳橡胶林信息提取和时空格局扩张监测 [J].https://doi.org/10.13428/j.cnki.fjlk.2017.02.008 URL [本文引用: 3] 摘要
以Landsat TM/OLI遥感影像为数据源,利用归一化指数、纹理、光谱差异、地形因子等特征构建面向对象隶属度分类模型分别提取2005年、2010年、2015年西双版纳橡胶林信息,并借助Google Earth平台和调查采样点进行橡胶林的判识和分析验证,最后,结合地形因子、橡胶林面积变化等分析橡胶林时空扩张情况.研究结果表明:采用面向对象隶属度对橡胶林分类效果较好,提取的橡胶林主要集中在景洪和勐腊2市县,橡胶大多分布在海拔600~ 1200 m和坡度在8°~25°范围内;2005-2010年期间,橡胶林扩展速度最快,为3.39万hm2·a-1,2010年以后,橡胶林种植面积增长速率逐渐减少.
Rubber plantation of Xishuangbanna information extraction and monitoring of spatial-temporal pattern expansion [J].https://doi.org/10.13428/j.cnki.fjlk.2017.02.008 URL [本文引用: 3] 摘要
以Landsat TM/OLI遥感影像为数据源,利用归一化指数、纹理、光谱差异、地形因子等特征构建面向对象隶属度分类模型分别提取2005年、2010年、2015年西双版纳橡胶林信息,并借助Google Earth平台和调查采样点进行橡胶林的判识和分析验证,最后,结合地形因子、橡胶林面积变化等分析橡胶林时空扩张情况.研究结果表明:采用面向对象隶属度对橡胶林分类效果较好,提取的橡胶林主要集中在景洪和勐腊2市县,橡胶大多分布在海拔600~ 1200 m和坡度在8°~25°范围内;2005-2010年期间,橡胶林扩展速度最快,为3.39万hm2·a-1,2010年以后,橡胶林种植面积增长速率逐渐减少.
|
| [11] |
面向对象的特色农作物种植遥感调查方法研究 [J].
宁夏自治区具有土地、光能、引黄灌溉等优势,为宁夏特色农作物(硒砂瓜、枸杞、大枣)的生长提供了先天条件.快速准确地获取特色农作物的种植信息不仅是宁夏特色农作物监测、估产和灾害评估的重要依据,同时也是分析特色农作物结构分布变化和评价区域特色农业生产影响的重要凭证.近年来,随着航天技术和卫星传感器的不断发展,越来越多的学者将遥感技术运用到农作物种植信息的提取研究中.但是传统的遥感调查模型都是基于中低分辨遥感数据建立的,对于新的高分数据没有完备的信息提取模型.此外,基于GF-1遥感影像对类似宁夏特色农作物(硒砂瓜、枸杞、大枣)的信息提取研究相对较少,决策条件和分类模型的选择也难以满足高分农业的需求.基于此,本文利用国产GF-1 PMS遥感影像,在分析3类特色农作物光谱特征和纹理特征的基础上,建立了面向对象的支持向量机(SVM)分类模型,总体分类精度达到94.94%,Kappa系数为0.9174.同时将分类结果与传统的SVM分类结果相比较,研究发现面向对象的SVM模型的精度更高,效果最好,纹理信息的引入使光谱特征差异较小的枸杞和大枣更容易区分,有效降低了模型错分和漏分误差,改善了模型分类结果.研究结果为实现宁夏特色农作物的快速自动化提取提供了有效途径,也为开展农作物承保和受灾定损评估体系建设提供技术支撑.
Remote sensing investigation method of object-oriented crops with special characteristics [J].
宁夏自治区具有土地、光能、引黄灌溉等优势,为宁夏特色农作物(硒砂瓜、枸杞、大枣)的生长提供了先天条件.快速准确地获取特色农作物的种植信息不仅是宁夏特色农作物监测、估产和灾害评估的重要依据,同时也是分析特色农作物结构分布变化和评价区域特色农业生产影响的重要凭证.近年来,随着航天技术和卫星传感器的不断发展,越来越多的学者将遥感技术运用到农作物种植信息的提取研究中.但是传统的遥感调查模型都是基于中低分辨遥感数据建立的,对于新的高分数据没有完备的信息提取模型.此外,基于GF-1遥感影像对类似宁夏特色农作物(硒砂瓜、枸杞、大枣)的信息提取研究相对较少,决策条件和分类模型的选择也难以满足高分农业的需求.基于此,本文利用国产GF-1 PMS遥感影像,在分析3类特色农作物光谱特征和纹理特征的基础上,建立了面向对象的支持向量机(SVM)分类模型,总体分类精度达到94.94%,Kappa系数为0.9174.同时将分类结果与传统的SVM分类结果相比较,研究发现面向对象的SVM模型的精度更高,效果最好,纹理信息的引入使光谱特征差异较小的枸杞和大枣更容易区分,有效降低了模型错分和漏分误差,改善了模型分类结果.研究结果为实现宁夏特色农作物的快速自动化提取提供了有效途径,也为开展农作物承保和受灾定损评估体系建设提供技术支撑.
|
| [12] |
Impact of land use and land cover changes on ecosystem services in Menglun, Xishuangbanna, southwest China [J].https://doi.org/10.1007/s10661-007-0067-7 URL PMID: 18157650 [本文引用: 1] 摘要
Changing the landscape has serious environmental impacts affecting the ecosystem services, particularly in the tropics. In this paper, we report changes in ecosystem services in relation to land use and land cover over an 18-year period (198809“2006) in the Menglun Township, Xishuangbanna, Southwest China. We used Landsat TM/ETM and Quickbird data sets to estimate changes in ten land use and land cover categories, and generalized value coefficients to estimate changes in the ecosystem services provided by each land category. The results showed that over the 18-year period, the land use and land cover in the study area experienced significant changes. Rubber plantations increased from 12.10% of total land cover to 45.63%, while forested area and swidden field decreased from 48.73 and 13.14 to 27.57 and 0.46%, respectively. During this period, the estimated value of ecosystem services dropped by US $11.427 million (09030427.73%). Further analysis showed that there were significant changes in ecological functions such as nutrient cycling, erosion control, climate regulation and water treatment as well as recreation; the obvious increase in the ecological function is provision of raw material (natural rubber). Our findings conclude that an abrupt shift in land use from ecologically important tropical forests and traditionally managed swidden fields to large-scale rubber plantations result in a great loss of ecosystem services in this area. Further, the study suggests that provision of alternative economic opportunities would help in maintaining ecosystem services and for an appropriate compensation mechanisms need to be established based on rigorous valuation.
|
| [13] |
Mapping tropical forests and rubber plantations in complex landscapes by integrating PALSAR and MODIS imagery [J].https://doi.org/10.1016/j.isprsjprs.2012.07.004 URL [本文引用: 2] 摘要
Knowledge of the spatial distribution of forest types in tropical regions is important for implementation of Reducing Emissions from Deforestation and Forest Degradation (REDD), better understanding of the global carbon cycle, and optimal forest management. Frequent cloud cover in moist tropical regions poses challenges for using optical images to map and monitor forests. Recently, Japan Aerospace Exploration Agency (JAXA) released a 50m orthorectified mosaic product from the Phased Array Type L-band Synthetic Aperture Radar (PALSAR) onboard the Advanced Land Observing Satellite (ALOS). PALSAR data provides information about the land surface without cloud interference. In this study we use the fine beam dual (FBD) polarization PALSAR 50m mosaic imagery and a Neural Network (NN) method to produce a land cover map in Hainan Island, China. Subsequently, forest areas are classified into evergreen and deciduous forests and rubber plantations are mapped using vegetation and land surface water indices derived from 250 to 500m resolution MODIS products. The PALSAR 50m forest cover map, MODIS-based forest types and rubber plantation maps are fused to generate fractional maps of evergreen forest, deciduous forest and rubber plantation within 500m or 250m pixels. PALSAR data perform well for land cover classification (overall accuracy=89% and Kappa Coefficient=0.79) and forest identification (both the Producer Accuracy and User Accuracy are higher than 92%). The resulting land cover maps of forest, cropland, water and urban lands are consistent with the National Land Cover Dataset of China in 2005 (NLCD-2005). Validation from ground truth samples indicates that the resultant rubber plantation map is highly accurate (the overall accuracy=85%). Overall, this study provides insight on the potential of integrating cloud-free 50m PALSAR and temporal MODIS data on mapping forest types and rubber plantations in moist tropical regions.
|
| [14] |
Mapping deciduous rubber plantations through integration of PALSAR and multi-temporal Landsat imagery [J].https://doi.org/10.1016/j.rse.2013.03.014 URL [本文引用: 3] 摘要
61Phenology of deciduous rubber trees is captured in Landsat time series data.61Rubber plantation delineation by integrating PALSAR and Landsat imagery.61Geo-Referenced Field Photo Library supported algorithm training and validation.
|
| [15] |
Mapping rubber tree plantations using a Landsat-based phenological algorithm in Xishuangbanna, southwest China [J].https://doi.org/10.1080/2150704X.2014.996678 URL [本文引用: 9] 摘要
中国科学院机构知识库(CAS IR GRID)以发展机构知识能力和知识管理能力为目标,快速实现对本机构知识资产的收集、长期保存、合理传播利用,积极建设对知识内容进行捕获、转化、传播、利用和审计的能力,逐步建设包括知识内容分析、关系分析和能力审计在内的知识服务能力,开展综合知识管理。
|
| [16] |
Monitoring annual dynamics of mature rubber plantations in Xishuangbanna during 1987-2018 using Landsat time series data: A multiple normalization approach [J]. |
| [17] |
An updated delineation of stand ages of deciduous rubber plantations during 1987-2018 using Landsat-derived bi-temporal thresholds method in an anti-chronological strategy [J].https://doi.org/10.1016/j.jag.2018.10.020 URL [本文引用: 3] |
| [18] |
西双版纳橡胶林面积遥感监测和时空变化 [J].https://doi.org/10.3969/j.issn.1002-6819.2014.22.021 URL Magsci [本文引用: 1] 摘要
旨在利用遥感手段监测橡胶林种植面积,探讨橡胶林的林龄划分方法,揭示橡胶林时空格局变化规律,为认识橡胶林的林龄结构、空间扩展模式和理解区域土地利用变化及其生态环境效应提供科学基础。该文基于RS和GIS技术,研究了西双版纳地区橡胶林的生长过程,并提出了基于橡胶林从种植到生长过程的归一化植被指数(NDVI,normalized difference vegetation index)时间序列变化,判断橡胶林的林龄阶段的方法。并进一步从种植面积、空间分布、林龄结构、地类转变关系4个方面,探讨了西双版纳地区1990-2014年橡胶林的时空变化。研究发现:西双版纳橡胶林按年龄阶段可划分为橡胶幼林(0~5 a)、橡胶成林(>5~13 a)、橡胶老林 (>13 a);1990-2014年,橡胶林种植面积总体上呈增加趋势,橡胶林的林龄结构有所变化。1990年橡胶林空间分布从中心到外围为老林-幼林/成林,2000年变为老林-成林-幼林,2010年和2014年为幼林-老林-成林且这一趋势更为明显;西双版纳自然保护区橡胶林种植面积和种植密度远远低于非自然保护区。橡胶林扩张以侵占天然林为代价,热带季雨林是受橡胶林扩张干扰最强烈的天然林。该研究以2月下旬-4月中旬为提取橡胶林的时间窗口,利用逐旬的归一化植被指数、土壤亮度指数、土壤湿度指数、近红外反射率变化特征提取橡胶林空间分布信息效果较好。此外,基于NDVI阈值的橡胶林林龄阶段判别方法,也具有一定的普适性。
Area monitoring by remote sensing and spatiotemporal variation of rubber plantations in Xishuangbanna [J].https://doi.org/10.3969/j.issn.1002-6819.2014.22.021 URL Magsci [本文引用: 1] 摘要
旨在利用遥感手段监测橡胶林种植面积,探讨橡胶林的林龄划分方法,揭示橡胶林时空格局变化规律,为认识橡胶林的林龄结构、空间扩展模式和理解区域土地利用变化及其生态环境效应提供科学基础。该文基于RS和GIS技术,研究了西双版纳地区橡胶林的生长过程,并提出了基于橡胶林从种植到生长过程的归一化植被指数(NDVI,normalized difference vegetation index)时间序列变化,判断橡胶林的林龄阶段的方法。并进一步从种植面积、空间分布、林龄结构、地类转变关系4个方面,探讨了西双版纳地区1990-2014年橡胶林的时空变化。研究发现:西双版纳橡胶林按年龄阶段可划分为橡胶幼林(0~5 a)、橡胶成林(>5~13 a)、橡胶老林 (>13 a);1990-2014年,橡胶林种植面积总体上呈增加趋势,橡胶林的林龄结构有所变化。1990年橡胶林空间分布从中心到外围为老林-幼林/成林,2000年变为老林-成林-幼林,2010年和2014年为幼林-老林-成林且这一趋势更为明显;西双版纳自然保护区橡胶林种植面积和种植密度远远低于非自然保护区。橡胶林扩张以侵占天然林为代价,热带季雨林是受橡胶林扩张干扰最强烈的天然林。该研究以2月下旬-4月中旬为提取橡胶林的时间窗口,利用逐旬的归一化植被指数、土壤亮度指数、土壤湿度指数、近红外反射率变化特征提取橡胶林空间分布信息效果较好。此外,基于NDVI阈值的橡胶林林龄阶段判别方法,也具有一定的普适性。
|
| [19] |
A renormalized modified normalized burn ratio (RMNBR) index for detecting mature rubber plantations with Landsat-8 OLI in Xishuangbanna, China [J].https://doi.org/10.1080/2150704X.2018.1541106 URL [本文引用: 2] |
| [20] |
Spatio-temporal differences in cloud cover of Landsat-8 OLI observations across China during 2013-2016 [J].https://doi.org/10.1007/s11442-018-1482-0 URL [本文引用: 2] 摘要
Currently, the historical archive images of Landsat family sensors are probably the most effective data products for tracking global longitudinal changes since the 1970 s. However, the issue of the degree and extent of cloud coverage is always a challenge and varies distinctively worldwide. So far, acquisition probability(AP) analyses of cloud cover(CC) of Landsat observations have been conducted with different sensors at regional scale. To our knowledge, CC probability analysis for the newly-launched Landsat-8 Operational Land Imager(OLI) across China is not reported. In this paper, monthly, seasonal, and annual APs for Landsat OLI(44,228 in total) images over China acquired from April 2013 to October 2016 with various CC thresholds were analyzed. The results showed that: first, the cumulative average APs of all OLI data over China at the CC thresholds ≤30% was about 49.6% which illustrated the availability of OLI imagery across China. Second, the spatial patterns of 10%, 20%, and 30% CC thresholds of OLI observations, coincided well with the precipitation distributions separated by the respective 200 mm, 400 mm, and 800 mm isohyetal lines. Third, the APs of images with the 30% CC threshold are the highest in autumn and winter especially in October of 58.7%, while the corresponding lowest probability occurred in June of 41.0%. Finally, the spatial differences in APs of targeted images with ≤30% CC thresholds were quite significant. At regional scales, the arid and semi-arid areas, Inland River and Songliao River basins, and northwestern side of the Hu Huanyong population line had the larger probabilities of obtaining high-quality images. Our study suggested that OLI imagery satisfy the data requirements needed for land surface monitoring, although there existed obvious spatio-temporal differences in APs over China at the 30% CC threshold.
|
| [21] |
Acquisition probability differences in cloud coverage of the available Landsat observations over mainland Southeast Asia from 1986 to 2015 [J].https://doi.org/10.1080/17538947.2017.1327619 URL [本文引用: 1] 摘要
Abstract Landsat data are the longest available records that consistently document global change. However, the extent and degree of cloud coverage typically determine its usability, especially in the tropics. In this study, scene-based metadata from the U.S. Geological Survey Landsat inventories, ten-day, monthly, seasonal, and annual acquisition probabilities (AP) of targeted images at various cloud coverage thresholds (10% to 100%) were statistically analyzed using available Landsat TM, ETM+, and OLI observations over mainland Southeast Asia (MSEA) from 1986 to 2015. Four significant results were found. First, the cumulative average acquisition probability of available Landsat observations over MSEA at the 30% cloud cover (CC) threshold was approximately 41.05%. Second, monthly and ten-day level probability statistics for the 30% CC threshold coincide with the temporal distribution of the dry and rainy seasons. This demonstrates that Landsat images acquired during the dry season satisfy the requirements needed for land cover monitoring. Third, differences in acquisition probabilities at the 30% CC threshold are different between the western and eastern regions of MSEA. Finally, the ability of TM, ETM+, and OLI to acquire high-quality imagery has gradually enhanced over time, especially during the dry season, along with consequently larger probabilities at lower CC thresholds.
|
| [22] |
Addicted to rubber [J].https://doi.org/10.1126/science.325_564 URL [本文引用: 1] |
| [23] |
Mapping burns and natural reforestation using thematic mapper data [J].https://doi.org/10.1080/10106049109354290 URL [本文引用: 1] 摘要
Remote sensing techniques are specially suitable to detect and to map areas affected by forest fires. In this work, Landsat 5 Thematic Mapper (TM) data has been used to study a number of forest fires that occurred in the province of Valencia (Spain) and to monitor the vegetation regeneration over burnt areas.
|
| [24] |
Mapping rubber tree growth in mainland Southeast Asia using time-series MODIS 250 m NDVI and statistical data [J].https://doi.org/10.1016/j.apgeog.2011.06.018 URL [本文引用: 1] 摘要
Expanding global and regional markets are driving the conversion of traditional subsistence agricultural and occupied non-agricultural lands to commercial-agricultural purposes. In many parts of mainland Southeast Asia rubber plantations are expanding rapidly into areas where the crop was not historically found. Over the last several decades more than one million hectares of land have been converted to rubber trees in areas of China, Laos, Thailand, Vietnam, Cambodia and Myanmar, where rubber trees were not traditionally grown. This expansion of rubber plantations has replaced ecologically important secondary forests and traditionally managed swidden fields and influenced local energy, water and carbon fluxes. Accurate and up-to-date monitoring and mapping of rubber tree growth is critical to understanding the implications of this changing ecosystem. Discriminating rubber trees from second-growth forests and fallow land has proven challenging. Previous experiments using machine-learning approaches with hard classifications on remotely sensed data, when faced with the realities of a heterogeneous plant-life mixture and high intra-class variance, have tended to overestimate the areas of rubber tree growth. Our current research sought to: 1) to investigate the potential of using a Mahalanobis typicality model to deal with mixed pixels; and 2) to explore the potential for combining MOderate Resolution Imaging Spectroradiometer (MODIS) imagery with sub-national statistical data on rubber tree areas to map the distribution of rubber tree growth across this mainland Southeast Asia landscape. Our study used time-series MODIS Terra 16-day composite 250 m Normalized Difference Vegetation Index (NDVI) products (MOD13Q1) acquired between March 2009 and May 2010. We used the Mahalanobis typicality method to identify pixels where rubber tree growth had the highest probability of occurring and sub-national statistical data on rubber tree growth to quantify the number of pixels of rubber tree growth mapped per administrative unit. We used Relative Operating Characteristic (ROC) and error matrix analysis, respectively, to assess the viability of Mahalanobis typicalities and to validate classification accuracy. High ROC values, over 0.8, were achieved with the Mahalanobis typicality images of both mature and young rubber trees. The proposed method greatly reduced the commission errors for the two types of rubber tree growth to 1.9% and 2.8%, respectively (corresponding to user accuracies of 98.1% and 97.2%, respectively). Results indicate that integrating Mahalanobis typicalities with MODIS time-series NDVI data and sub-national statistics can successfully overcome the earlier overestimation problem.
|
| [25] |
Mapping rubber plantations and natural forests in Xishuangbanna (southwest China) using multi-spectral phenological metrics from MODIS time series [J].https://doi.org/10.3390/rs5062795 URL [本文引用: 1] |
| [26] |
Situational analysis report: Xishuangbanna autonomous Dai prefecture Yunnan, China [R]. |
| [27] |
The expansion of smallholder rubber farming in Xishuangbanna, China: A case study of two Dai villages [J].https://doi.org/10.1016/j.landusepol.2014.09.015 URL [本文引用: 1] 摘要
During the last half century, rubber plantations have spread widely and rapidly in Xishuangbanna, China. This study characterizes the process of expansion in smallholder rubber farming and the subsequent changes in upland use through an in-depth case study of two Dai villages in Xishuangbanna. The results show that the area of smallholder rubber farming has increased in the study villages, as observed in other parts of Xishuangbanna. The evolution of forest policy governing the community forest in Xishuangbanna is divided into three periods: the initial, transition and strict control periods. In the initial period, customary law governed the community forest, and planting rubber was a risky choice in the eyes of villagers, while the government-provided subsidy and techniques spurred the conversion from subsistence cropping to rubber gardens. In the transition period, forest governance by the government began to intervene in the land use customs. Villagers recognized the profitability of rubber farming, and they had chance to convert community forests into rubber gardens because the forest policy was ambiguous. The expansion of rubber farming had a substantial impact on forest cover in the transition period, while the village communities conserved a part of community forest because they have a stake in conserving forest resource. In the strict control period, the government initiated a strict control, especially targeting logging. Consequently, even though there remains a strong demand for the expansion of rubber farms, the new lands chosen for rubber farms were areas in which other crops were already established. In conclusion, strict government governance with a clear objective and support from local communities has been sufficient to control the encroachment of smallholder rubber farming into natural forests in Xishuangbanna. (C) 2014 Elsevier Ltd. All rights reserved.
|
| [28] |
Developing indicators of economic value and biodiversity loss for rubber plantations in Xishuangbanna, southwest China: A case study from Menglun township [J].https://doi.org/10.1016/j.ecolind.2013.03.016 URL [本文引用: 1] 摘要
In Xishuangbanna, southwest China, rubber plantations are lucrative and have expanded dramatically in the past two decades, leaving little natural forest. The local government hopes to use eco-compensation mechanisms to promote forest restoration without forcing smallholders to forego profits. Based on a landscape productivity model for two management systems and given a range of prices, we assessed the feasibility of this concept by constructing a spatially explicit map of net present value (NPV) of rubber plantations. We found that roughly 7% of existing plantations generally had negative NPV, therefore opportunity costs would be negligible. But to restore forest in buffer zones along roads and rivers as recommended by the state government, more substantial opportunity costs were observed because these areas have high NPV values. Additionally, plantations situated above 900 m elevation or on slopes >24 degrees were not profitable and a conversion ban should be enforced. Opportunity costs and plant species biodiversity are positively correlated, so any policy to protect species-rich areas must take this relationship into consideration. Eco-compensation schemes can feasibly promote forest restoration on marginal lands and spatially-explicit mapping of NPV can provide monetary targets to adequately recover opportunity costs for smallholders. (C) 2013 Elsevier Ltd. All rights reserved.
|
| [29] |
Landscape transformation through the use of ecological and socioeconomic indicators in Xishuangbanna, southwest China, Mekong Region [J].https://doi.org/10.1016/j.ecolind.2012.08.023 URL [本文引用: 1] 摘要
Rapid land-use transformations are occurring throughout the Mekong Region, and especially in Xishuangbanna, Yunnan Province in southwest China. Most of this is due to the spread of monoculture rubber plantations. Using a new map derived from Landsat and RapidEye imagery tracking the spread of rubber from 1992 to 2010 in combination with a literature review and interviews with key local experts and officials, we performed a general overview of the extent, causes and consequences of landscape transformation in Xishuangbanna. We discovered that structural and functional biodiversity has been reduced, habitat fragmentation has increased, carbon sequestration in natural forests has been reduced, and hydrological systems altered. For humans, while incomes have risen, food insecurity has also grown. The drivers of these changes are regional economic integration, government policy, and conservation vs development value systems. To improve land-use management, we surveyed the availability of ecological and socioeconomic indicators that may better track such changes. We found that combining both types of indicators within a multi-scale conservation planning framework would help to inform policy making in the region. As yet, however, there is little integrative research using indicators to track changes in ecosystems and human livelihoods in the region.
|

/
| 〈 |
|
〉 |