
不同尺度DEM的河流裂点提取及其效应分析
作者简介:王婷婷(1989-),女,山东临沂人,硕士生,主要从事DEM与数字地形分析研究。E-mail:wangtting1121@163.com
收稿日期: 2014-01-06
要求修回日期: 2014-03-19
网络出版日期: 2014-11-01
基金资助
国家自然科学基金项目“基于DEM的黄土沟壑种群特征及空间异质性研究”(41271438)
“基于DEM的黄土地貌沟沿线研究”(41171299)
Identification of Fluvial Knickpoints and Analysis of Its Scale Effect Based on DEMs
Received date: 2014-01-06
Request revised date: 2014-03-19
Online published: 2014-11-01
Copyright
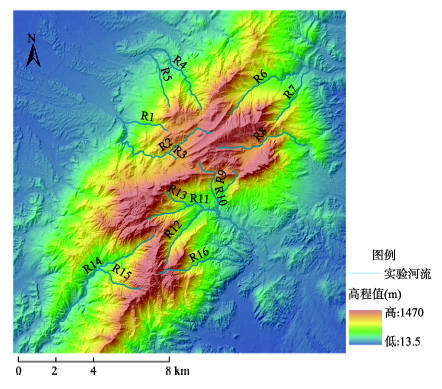
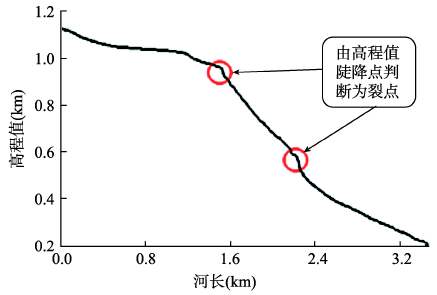
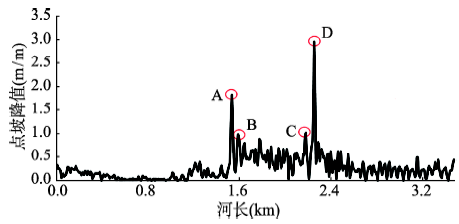
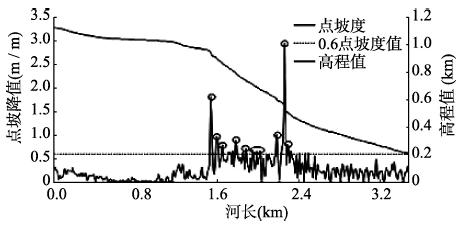
以不同尺度DEM数据提取裂点及其效应存在较大差异。本文以1:1万DEM为基础数据,通过小波分析生成多尺度DEM数据。以庐山地区16条河流为例,实现了多尺度DEM数据的河流裂点提取,探讨了河流裂点的变化规律,并构建了裂点个数的尺度预测模型。实验结果表明:(1)采用河道纵剖面与点坡降相结合的方法可快速准确地判断裂点;(2)在庐山地区,1:1万DEM数据可准确判断高差不小于5 m的裂点,对于高差小于5 m的裂点由于DEM表达精度和数据误差,而无法准确判定;(3)DEM尺度对裂点提取影响显著,裂点个数随着DEM分辨率降低逐渐减少,符合幂函数递减规律;(4)通过与ASTER GDEM和SRTM DEM对比验证,本文所构建的裂点个数与DEM尺度的拟合模型具有一定的预测精度。
王婷婷 , 杨昕 , 叶娟娟 , 王琛智 . 不同尺度DEM的河流裂点提取及其效应分析[J]. 地球信息科学学报, 2014 , 16(6) : 882 -889 . DOI: 10.3724/SP.J.1047.2014.00882
Knickpoints are fundamental for understanding local erosion basis and the evolution of fluvial landforms. To extract the knickpoints, Digital Elevation Model (DEM) is widely adopted as the basic data in literatures. However, the accuracy of the extraction is greatly influenced by the DEM resolution. In this paper, to explore the influence of DEM resolution on the extraction of knickpoints, we analyzed the gradient of the fluvial longitudinal profiles to extract the knickpoints in Mount Lu area based on DEM and Digital Line Graphic (DLG). Firstly, the longitudinal profiles of the 16 streams with elevations are derived from 5 m DEM, from which the potential knickpoints are extracted from an empirical gradient domain. Secondly, to find a suitable gradient domain, a field investigation of four typical rivers, including Three-Step Spring and Crane Ravine, is carried out to collect the spatial positions of 30 knickpoints with GPS. Thirdly, multiple resolutions of DEM data are generated by wavelet transformation based on the 5 m DEM. The knickpoints in each scale are extracted in the same way from the corresponding DEM. Finally, the influence of the DEM resolution on the accuracy of knickpoints is discussed. The experiment results reveal that the suitable threshold of gradient domain for 5 m DEM is 0.6, by which the knickpoints’ altitude differences are greater than 5 m. The number of knickpoints is subject to a power function of the DEM resolution. As the DEM resolution coarsens, the number of knickpoints decreases. To verify this power function, the ASTER GDEM and SRTM DEM data are used, which reveals the consistency between the extracted knickpoints from the DEMs and the predicted ones from the function.
Key words: knickpoints; multi-scale DEM; scale effect; Mount Lu region; power function model
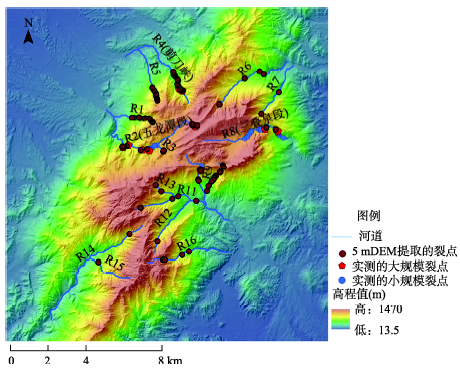
Fig. 1 Spatial distribution map of rivers in test areas图1 实验区河流的分布图 |
Tab. 1 Statistics of DEM data parameters with different resolutions表1 各分辨率DEM数据参数统计 |
| 分辨率(m) | 最小值(m) | 最大值(m) | 标准差 | 平均值(m) | 中误差(m) |
|---|---|---|---|---|---|
| 5 | 13.5 | 1470.00 | 386.98 | 435.11 | 0 |
| 10 | 13.5 | 1470.00 | 386.96 | 434.96 | 2.45 |
| 20 | 13.7 | 1470.00 | 386.91 | 434.65 | 6.72 |
| 40 | 13.7 | 1469.83 | 386.84 | 434.24 | 8.38 |
| 80 | 14.3 | 1461.24 | 386.66 | 433.43 | 12.68 |
Fig. 2 R10 longitudinal profile图2 R10河流纵剖面图 |
Fig. 3 The stream gradient of R10图3 R10点坡度图 |
Fig. 4 The stream gradients with longitudinal profile of R10图4 R10点坡降与河流纵剖面复合图 |
Fig. 5 The measured knickpoints and results distribution map图5 实测与提取裂点空间分布图 |
Tab. 2 The measured and the extracted knickpoints表2 DEM提取裂点与实测裂点对比 |
| 河流名称 | 实测裂点个数 | 5 m DEM提取裂点个数 | 整体准确率 | 点坡降阈值>0.6的准确率 | |
|---|---|---|---|---|---|
| 点坡降 阈值<0.6 | 点坡降阈值>0.6 | ||||
| 三叠泉段 | 11 | 2 | 2 | 0.14 | 1 |
| 白鹤涧段 | 1 | 1 | 2 | 1 | 0.50 |
| 乌龙潭段 | 4 | 7 | 6 | 0.50 | 0.85 |
| 剪刀峡段 | 0 | 4 | 4 | 1 | 1 |
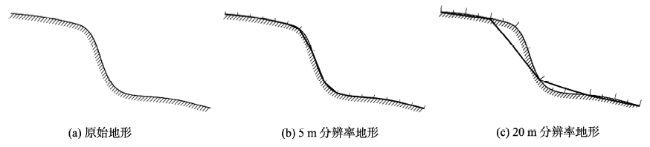
Fig. 6 Changes of the terrain longitudinal profile in different sampling scales图6 不同采样尺度的地形纵剖面变化 |
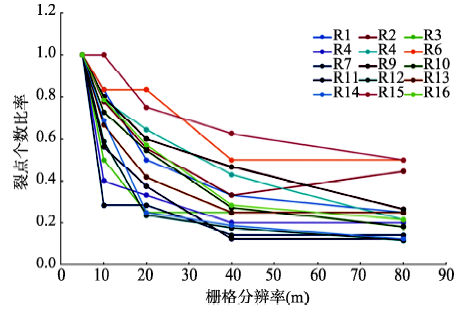
Tab. 3 The number of extracted knickpoints in different scales of DEM表3 不同尺度DEM提取河道裂点个数 |
| 分辨率(m) | R1 | R2 | R3 | R4 | R5 | R6 | R7 | R8 | R9 | R10 | R11 | R12 | R13 | R14 | R15 | R16 |
|---|---|---|---|---|---|---|---|---|---|---|---|---|---|---|---|---|
| 5 | 12 | 9 | 4 | 15 | 14 | 6 | 7 | 2 | 14 | 11 | 16 | 17 | 12 | 14 | 8 | 14 |
| 10 | 10 | 7 | 2 | 6 | 11 | 5 | 2 | 2 | 12 | 8 | 9 | 10 | 8 | 11 | 8 | 11 |
| 20 | 6 | 5 | 1 | 5 | 9 | 5 | 2 | 2 | 8 | 6 | 6 | 4 | 5 | 4 | 6 | 8 |
| 40 | 4 | 3 | 1 | 3 | 6 | 3 | 1 | 2 | 7 | 3 | 2 | 3 | 3 | 3 | 5 | 4 |
| 80 | 3 | 3 | 1 | 3 | 3 | 3 | 1 | 2 | 4 | 2 | 2 | 2 | 3 | 2 | 4 | 3 |
Fig. 7 Trend of extracted knickpoints with different grid resolutions图7 不同栅格分辨率河流裂点变化趋势 |
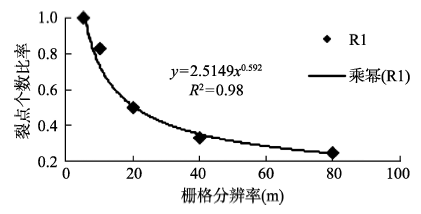
Fig. 8 The number of knickpoints and its fitting curve about R1 in multi-scale DEM图8 R1裂点个数的尺度变化及其拟合曲线 |
Tab. 4 The fitting model of 15 rivers表4 15条河道的拟合模型 |
| 河道编号 | 拟合模型 | R2 | 河道编号 | 拟合模型 | R2 |
|---|---|---|---|---|---|
| R1 | y = 2.5149x-0.592 | 0.98 | R10 | y = 3.0397x-0.633 | 0.98 |
| R2 | y = 1.6777x-0.356 | 0.80 | R11 | y = 3.6858x-0.817 | 0.94 |
| R3 | y = 1.6946x-0.5 | 0.78 | R12 | y = 3.3193x-0.791 | 0.97 |
| R4 | y = 1.9041x-0.564 | 0.88 | R13 | y = 2.2513x-0.542 | 0.95 |
| R5 | y = 2.6627x-0.532 | 0.93 | R14 | y = 3.5117x-0.787 | 0.96 |
| R6 | y = 1.5996x-0.274 | 0.87 | R15 | y = 1.6688x-0.268 | 0.95 |
| R7 | y = 2.018x-0.661 | 0.83 | R16 | y = 2.8575x-0.59 | 0.97 |
| R9 | y = 2.2521x-0.459 | 0.96 |
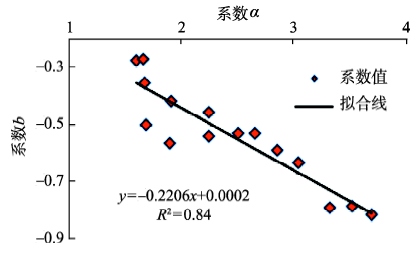
Fig. 9 The relationship of model coefficients图9 模型系数关系图 |
Tab. 5 Parameter statistics of each river表5 各河流的参数统计表 |
| 河道编号 | R1 | R2 | R3 | R4 | R5 | R6 | R7 | R9 | R10 | R11 | R12 | R13 | R14 | R15 | R16 |
|---|---|---|---|---|---|---|---|---|---|---|---|---|---|---|---|
| 裂点个数 | 12 | 9 | 4 | 15 | 14 | 6 | 7 | 14 | 11 | 16 | 17 | 12 | 14 | 8 | 14 |
| α | 2.51 | 1.68 | 1.69 | 1.90 | 2.66 | 1.60 | 1.91 | 2.25 | 3.04 | 3.69 | 3.32 | 2.25 | 3.51 | 1.67 | 2.86 |
| J | 0.64 | 0.85 | 0.83 | 0.78 | 0.52 | 0.70 | 0.71 | 0.85 | 1.13 | 0.49 | 0.63 | 0.79 | 0.35 | 0.81 | 0.63 |
| c | 0.32 | 0.13 | 0.22 | 0.12 | 0.22 | 0.15 | 0.16 | 0.31 | 0.23 | 0.15 | 0.20 | 0.32 | 0.10 | 0.32 | 0.22 |
Tab. 6 The predictions of the power function model compared with the extracted results of the corresponding grid resolution表6 幂函数模型预测与相应栅格分辨率提取结果对比 |
| 河道编号 | R1 | R2 | R3 | R4 | R5 | R6 | R7 | R9 | R10 | R11 | R12 | R13 | R14 | R15 | R16 |
|---|---|---|---|---|---|---|---|---|---|---|---|---|---|---|---|
| 30 m预测值 | 5 | 4 | 1 | 4 | 6 | 4 | 1 | 7 | 4 | 4 | 4 | 4 | 4 | 5 | 5 |
| ASTER | 6 | 4 | 2 | 4 | 6 | 4 | 2 | 8 | 5 | 6 | 6 | 5 | 5 | 6 | 5 |
| 90 m预测值 | 3 | 3 | 1 | 3 | 3 | 3 | 1 | 4 | 2 | 1 | 2 | 2 | 2 | 4 | 3 |
| SRTM | 4 | 3 | 1 | 3 | 3 | 3 | 1 | 4 | 2 | 2 | 2 | 3 | 3 | 4 | 3 |
The authors have declared that no competing interests exist.
| [1] |
|
| [2] |
|
| [3] |
|
| [4] |
|
| [5] |
|
| [6] |
|
| [7] |
|
| [8] |
|
| [9] |
|
| [10] |
|
| [11] |
|
| [12] |
|
| [13] |
|
| [14] |
|
| [15] |
|
| [16] |
|
| [17] |
|
| [18] |
|
| [19] |
|
| [20] |
|
| [21] |
|
| [22] |
|
| [23] |
|
| [24] |
|
| [25] |
|
| [26] |
|
| [27] |
|
| [28] |
|
| [29] |
|
/
| 〈 |
|
〉 |