
一种以等差分级的DEM填洼算法
作者简介:高 翔(1989-),男,江苏盐城人,硕士生,研究方向为地图制图学与地理信息系统。E-mail:15281063584@163.com
收稿日期: 2014-02-11
要求修回日期: 2014-04-02
网络出版日期: 2015-01-05
基金资助
教育部“新世纪优秀人才支持计划”(NCET-12-0942)
“2011计划”轨道交通安全协同创新中心西南交通大学先行先试项目
国家测绘地理信息局重点实验室开放基金项目(DM2013SC03)
A New Algorithm to Fill Depressions in Digital Elevation Model Based on Arithmetic Arrays
Received date: 2014-02-11
Request revised date: 2014-04-02
Online published: 2015-01-05
Copyright
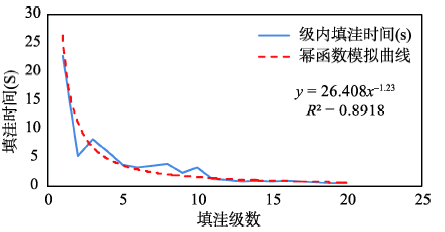
DEM的填洼是水系提取中最耗时的过程。真实的地表低高程点通常在空间上相邻,在对低高程栅格进行填洼时,少数栅格的高程值更新会导致级内大量栅格的循环迭代,从而消耗大量运算时间。为了提高DEM的填洼效率,在分级填洼的基础上,提出一种等差分级填洼算法,该算法顾及DEM各级填洼时间呈幂函数逐级递减这一地形规律。算法首先创建一系列数组,数组大小随等差数列递增;然后依次将排序后的DEM数据存放至数组中,由于定义的数组大小逐渐增大,因此,低高程区域被“分割”得很细;最后,当填洼运算从级内转至数组内时,低高程区域细致的划分极大缩短了栅格循环迭代时间,从而使得算法获得了较高的效率。新算法既能有效缩短填洼过程中的迭代时间,又能保证所提取水系的完整性与连贯性。为验证算法的有效性,选用四川省不同地区的SRTM 90 m分辨率DEM作为实验数据,并与已有的DEM分级填洼算法进行对比分析。实验结果显示:当研究区域栅格总数达到两千万个时,本文算法填洼效率提升了50%左右,且随着DEM数据量的增大,算法效率的提升更为明显,与此同时,利用新方法进行填洼后,DEM水文线连续性较强,表明了新方法的有效性。
高翔 , 蔡国林 , 徐柱 , 蔡伟娣 . 一种以等差分级的DEM填洼算法[J]. 地球信息科学学报, 2015 , 17(1) : 15 -21 . DOI: 10.3724/SP.J.1047.2015.00015
Depressions cause errors or breaks when extracting rivers from DEM. Filling the depressions in the initial DEM is important. Low elevated surface areas in space are usually adjacent, and high elevated surface areas in space are always discrete. Therefore, when the grids of low elevated areas are filled, a large number of grids in low elevated areas will have to be recalculated, which makes the process of depression filling more complex. This paper investigates a new ranking algorithm for improving the efficiency of filling the depressions of DEM. First, considering the fact that the depression filling time in different pieces decreases in the form of power function, the algorithm creates a list of variable arrays. Then the data of DEM, which has been ranked using quicksort algorithm, is put into the arrays successively. Finally, grids are filled within the variable arrays, whose lengths are increased with respect to arithmetic sequence. As the lengths of the arrays are increased, the low elevated areas are divided finely. With the increase of elevation, the arrays will contain more numbers of grids, which will reduce the depth of seeking path in iterations for the unfilled grids. The new algorithm keeps the integrity and continuity of the drainage networks extracted by the pits-removed DEM and well reduces the depth of seeking path in iterations to accelerate pits-removing process. To illustrate this approach, the algorithm has been employed in the SRTM DEM at a 90-meter resolution of Chengdu City. The results show a considerable efficiency. The efficiency of the algorithm outperforms the traditional algorithm, as it will improve 50% efficiency compared with previous algorithm when the number of grids of DEM reaches 20 million. And the improvement will be more evident when the amount of DEM data increases.
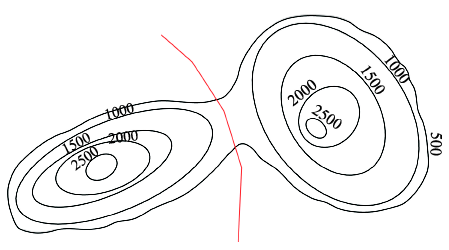
Fig. 1 Schematic diagram of contours图1 等高线示意图 |
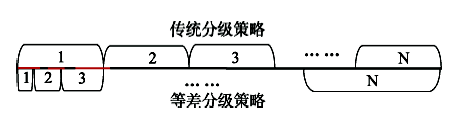
Fig. 2 Ranking process of arithmetic arrays图2 等差分级过程 |
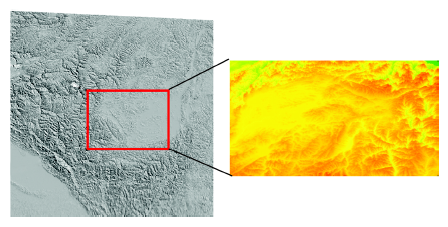
Fig. 3 Original elevation data of SRTM of 90 m resolution图3 SRTM 90 m分辨率的原始高程数据 |
Tab. 1 Time cost of filling depressions of ranked algorithm(s)表1 高程分级填洼耗时(s) |
| 数 | 时间(s) | 循环次数 | 级数 | 时间(s) | 循环次数 |
|---|---|---|---|---|---|
| 1 | 22.86 | 158 | 11 | 1.29 | 15 |
| 2 | 5.21 | 58 | 12 | 1.11 | 16 |
| 3 | 8.22 | 83 | 13 | 0.80 | 11 |
| 4 | 6.01 | 62 | 14 | 0.88 | 14 |
| 5 | 3.71 | 40 | 15 | 0.82 | 12 |
| 6 | 3.21 | 26 | 16 | 0.90 | 10 |
| 7 | 3.53 | 22 | 17 | 0.77 | 7 |
| 8 | 3.91 | 25 | 18 | 0.58 | 5 |
| 9 | 2.36 | 19 | 19 | 0.54 | 4 |
| 10 | 3.23 | 33 | 20 | 0.49 | 4 |
Fig. 4 Curve fitting of depression filling time in pieces图4 级内填洼时间曲线拟合 |
Tab. 2 Total number of DEMs from six groups表2 6组DEM的栅格总数汇总 |
| 区域1 | 区域2 | 区域3 | 区域4 | 区域5 | 区域6 | ||
|---|---|---|---|---|---|---|---|
| 栅格总数(个) | 836 740 | 2 143 750 | 4 821 320 | 8 575 000 | 13 394 910 | 19 275 000 | |
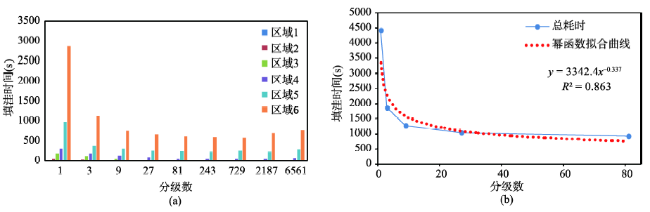
Tab. 3 Variation between depression filling time and number of the pieces表3 填洼时间随分级数的变化规律 |
| 分级数 | 区域1 | 区域2 | 区域3 | 区域4 | 区域5 | 区域6 | 总耗时(s) |
|---|---|---|---|---|---|---|---|
| 1 | 17.53 | 57.38 | 187.57 | 317.86 | 973.42 | 2876.58 | 4430.34 |
| 3 | 9.47 | 34.62 | 117.32 | 193.54 | 383.60 | 1134.52 | 1873.07 |
| 9 | 4.33 | 11.20 | 51.14 | 136.92 | 314.77 | 753.69 | 1272.05 |
| 27 | 1.12 | 6.54 | 23.60 | 87.11 | 253.94 | 674.53 | 1046.84 |
| 81 | 0.49 | 4.73 | 17.38 | 59.29 | 234.50 | 613.97 | 930.36 |
| 243 | 0.13 | 4.11 | 14.26 | 52.05 | 227.65 | 603.41 | 901.61 |
| 729 | 0.14 | 4.27 | 15.80 | 51.73 | 259.80 | 587.32 | 919.06 |
| 2187 | 0.96 | 4.18 | 15.66 | 55.83 | 232.19 | 697.62 | 1006.44 |
| 6561 | 1.50 | 7.92 | 18.73 | 62.40 | 296.34 | 774.36 | 1161.25 |
Fig. 5 Variation between depression filling time and number of the pieces图5 填洼时间随分级数的变化图 |
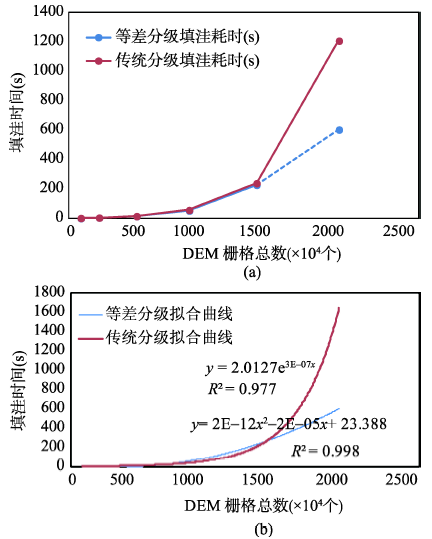
Tab. 4 Comparison of efficiency between the new algorithm and the traditional algorithm表4 新算法与传统算法效率对比(SRTM 90 m分辨率) |
| 区域 | 等差分级填洼耗时(s) | 传统分级填洼耗时(s) | 新方法栅格迭代总数 | 传统分级栅格迭代总数 | 新算法与传统算法时间差(s) |
|---|---|---|---|---|---|
| 1 | 0.13 | 1.49 | 13 860 | 13 736 | 1.36 |
| 2 | 4.11 | 4.66 | 82 734 | 86 063 | 0.55 |
| 3 | 14.26 | 15.03 | 340 983 | 379 001 | 0.77 |
| 4 | 52.05 | 56.63 | 2 161 678 | 2 442 419 | 4.58 |
| 5 | 227.65 | 238.64 | 11 484 804 | 12 599 816 | 10.99 |
| 6 | 603.41 | 1207.84 | 61 173 465 | 62 142 823 | 604.43 |
Tab. 5 Prediction equations of depression filling time表5 填洼耗时预测方程 |
| 洼算法 | 多项式拟合方程 | R2 |
|---|---|---|
| 传统分级填洼 | y = 2.0127e3E-07x | 0.9774 |
| 等差分级填洼 | y = 2E-12x2 - 2E-05x + 23.388 | 0.9984 |
Fig. 6 Comparison of depression filling time between variable arrays based algorithm and the traditional algorithm图6 等差分级与传统算法填洼耗时对比 |
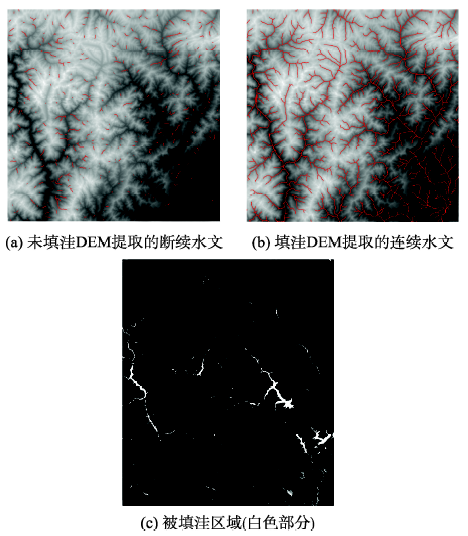
Fig. 7 Hydrological analysis based on DEM图7 基于DEM提取水文 |
The authors have declared that no competing interests exist.
| [1] |
|
| [2] |
|
| [3] |
|
| [4] |
|
| [5] |
|
| [6] |
|
| [7] |
|
| [8] |
|
| [9] |
|
| [10] |
|
| [11] |
|
| [12] |
|
| [13] |
|
| [14] |
|
| [15] |
|
| [16] |
|
| [17] |
|
| [18] |
|
| [19] |
|
| [20] |
|
/
| 〈 |
|
〉 |