
基于CLUE-S模型的辽河流域景观格局空间分布模拟
作者简介:王 鑫(1989-),男,山西长治人,硕士生,研究方向为“3s”技术与应用。E-mail:wangxin_king1989@126.com
收稿日期: 2014-05-04
要求修回日期: 2014-07-03
网络出版日期: 2013-12-26
基金资助
中国工程院咨询研究项目“辽河流域生态文明建设发展战略研究”资助(2014-X-Z-14)
Landscape Spatial Distribution Modeling Based on CLUE-S Model in the Liaohe Watershed
Received date: 2014-05-04
Request revised date: 2014-07-03
Online published: 2013-12-26
Copyright
基于CLUE-S模型,以辽河流域为研究区,利用2000年和2010年两期土地利用数据,采用Logistic逐步回归方程ROC曲线,选择高程、距离、土壤等8种驱动因子,对2010年景观格局进行模拟,并依据2010景观格局、相应的辽河流域土地利用规划,设置3种不同情景,进行2010-2020年景观格局模拟。研究表明:(1)模拟的2010年景观格局,kappa精度达到90%以上,表明CLUE-S模型在辽河流域具有良好的景观格局模拟能力。(2)辽河流域在不同情境下,建设用地均出现不同程度的增加,耕地出现不同程度减少。其中,情景2中,森林有所减少,耕地转化幅度较大,建设用地围绕辽河流域城镇带建设逐步扩展,集中在沈阳、抚顺、鞍山等工业发达城市;情景3中,森林、湿地逐步扩大,表现在东部退耕还林,南部紧靠辽海入口湿地增加。研究结论可为未来辽河流域的生态保护建设及景观格局合理规划提供参考依据。
王鑫 , 刘伟玲 , 张丽 , 张林波 , 郑娇琦 . 基于CLUE-S模型的辽河流域景观格局空间分布模拟[J]. 地球信息科学学报, 2014 , 16(6) : 925 -932 . DOI: 10.3724/SP.J.1047.2014.00925
In this paper, we took the Liaohe watershed as the study area and applied the CLUE-S model for the purpose of landscape pattern simulation, based on the land use data in 2000 and 2010. Eight key driving factors were selected in this study, which include elevation, DEM, slope, distance, soil and others. Firstly, the land use data in 2000 was used to simulate the spatial pattern of land use in 2010 for the Liaohe watershed. Based on the adjusted model parameters, the land use patterns of 2020 were then simulated respectively for the natural increase scenario, economic development scenario, and ecological protection scenario. The results showed that the simulation accuracy for 2010 reached a considerably 90.7%, implying that the CLUE-S model is well fitted for modeling the land use pattern in the Liaohe watershed. In different scenarios, it shows explicitly an increase in urban land and a decrease in cultivated land. Under the economic development scenario, we concluded that: the cultivated land conversion range is the largest; the forest reduction is relatively small; and the construction land surrounding the developing zones of the Liaohe River basin had gradually expanded, which mainly aggregated in Shenyang, Fushun, Anshan and other industrial developed cities. Under the ecological protection scenario, we discovered that the forests and wetlands that located at the mouth of the Liaohe River had gradually increased. This is due to the conversion of farmland into forest in the east region. The conclusions made in this study will provide data reference and basic information for the ecological protection in the Liaohe watershed, the land use planning management, and policy-making in future.
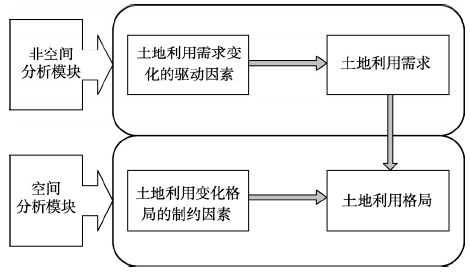
Fig. 1 Overview of the modeling procedure图1 CLUE-S 模型流程示意图 |
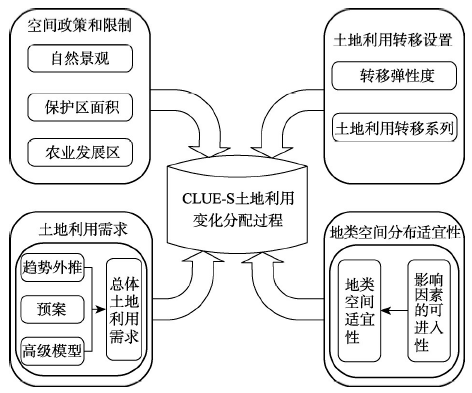
Fig. 2 Data support system of the CLUE-S model图2 CLUE-S模型的数据支撑体系 |
Tab. 1 The transferring matrix of area with respect to different landscape types from 2000 to 2010表1 2000-2010年景观转移矩阵(km2) |
| 森林 | 灌丛 | 草地 | 湿地 | 耕地 | 城镇 | 未利用土地 | 2010年合计 | |
|---|---|---|---|---|---|---|---|---|
| 森林 | 19423.7 | 1.3 | 0 | 2.9 | 28 | 9 | 0.4 | 19465.3 |
| 灌丛 | 0.1 | 2461.8 | 0 | 0.2 | 1.9 | 1.1 | 0.1 | 2465.2 |
| 草地 | 0.1 | 1.4 | 577.5 | 0 | 0 | 0.1 | 0 | 579.1 |
| 湿地 | 1.5 | 0.1 | 2.3 | 2199.1 | 31.1 | 91.1 | 3.3 | 2328.5 |
| 耕地 | 23.5 | 1.2 | 39.2 | 100.4 | 34851.1 | 1038.9 | 19.8 | 36074.1 |
| 城镇 | 0.2 | 0.1 | 1 | 6.8 | 0.7 | 5127.5 | 0.6 | 5136.9 |
| 未利用土地 | 0.1 | 0 | 3 | 1.5 | 0.9 | 2.4 | 105.6 | 113.5 |
| 2000年合计 | 19449.2 | 2465.9 | 623 | 2310.9 | 34913.7 | 6270.1 | 129.8 | 66162.6 |
Tab. 2 Single land use dynamic degree表2 单一土地利用动态度 |
| 类型 | 单一土地利用转出率(%) | 单一土地利用转入率(%) | ||
|---|---|---|---|---|
| 2000-2005(年) | 2005-2010(年) | 2000-2005(年) | 2005-2010(年) | |
| 林地 | 0.13 | 0.09 | 0.08 | 0.05 |
| 灌丛 | 0.08 | 0.06 | 0.08 | 0.09 |
| 草地 | 0.00 | 0.24 | 1.03 | 6.34 |
| 湿地 | 1.07 | 4.54 | 1.56 | 3.33 |
| 耕地 | 1.05 | 2.37 | 0.09 | 0.09 |
| 城镇 | 0.001 | 0.18 | 6.18 | 12.83 |
| 未利用土地 | 1.23 | 6.00 | 2.43 | 16.53 |
Tab.3 Beta values and exponent Beta values for logistic regression in CLUE-S model表3 CLUE-S模型各驱动因子回归系数 |
| 驱动因子 | 森林 | 灌丛 | 草地 | |||
|---|---|---|---|---|---|---|
| Beta系数 | Exp(β) | Beta系数 | Exp(β) | Beta系数 | Exp(β) | |
| 高程 | 0.00568401 | 1.005723 | 0.00445170 | 1.0044610 | 0.002295380 | 1.002298021 |
| 到城市居民点距离 | -0.00000631 | 0.999993 | -0.00002937 | 0.9999706 | 0.000021921 | 1.000021920 |
| 到县级居民点距离 | -0.00000132 | 0.999012 | -0.00000231 | 0.9995699 | 0.000012988 | 0.999999870 |
| 到河流距离 | -0.00001110 | 0.999980 | -0.00003374 | 0.9999662 | 0.000016914 | 1.000016914 |
| 到公路距离 | 0.00000546 | 1.000006 | 0.00000646 | 1.0000064 | -0.000012250 | 0.999987740 |
| 坡度 | 0.17217200 | 1.186375 | – | – | -0.086910760 | 0.916758897 |
| 土壤类型 | 0.00799600 | 1.009013 | – | – | -0.086910760 | 0.916758890 |
| 人口密度 | 0.00008890 | 0.999857 | 0.000549611 | 1.00038258 | – | – |
| GDP | – | 1.000000 | -0.000081020 | 0.99999991 | -0.000000380 | 0.999999960 |
| 常量 | -2.37488 | 0.093025 | -3.307222400 | 0.036617741 | -4.169922 | 0.015453450 |
| ROC | 0.847 | 0.797 | 0.705 | |||
| 驱动因子 | 湿地 | 耕地 | 建设用地 | |||
| Beta系数 | Exp(β) | Beta系数 | Exp(β) | Beta系数 | Exp(β) | |
| 高程 | -0.0085759400 | 0.99146072 | -0.005299000 | 0.99471490 | -0.004737500 | 0.99527360 |
| 到城市居民点距离 | – | – | 0.000001815 | 1.00001810 | -0.000026000 | 0.99997396 |
| 到县级居民点距离 | – | – | 0.000256893 | 1.00098730 | -0.000010100 | 1.00000012 |
| 到河流距离 | 0.0000096300 | 1.00000963 | 0.000000305 | 0.99999690 | 0.000000686 | 1.00000600 |
| 到公路距离 | -0.0000003119 | 0.99999688 | 0.000000123 | 1.00000123 | -0.000011400 | 0.99998850 |
| 坡度 | 0.1115012000 | 1.11795518 | -0.151551000 | 0.85937300 | – | – |
| 土壤类型 | 0.1871957800 | 1.20586335 | -0.028856000 | 0.97155618 | 0.013248540 | 1.01333669 |
| 人口密度 | -0.0003068010 | 0.999693245 | -0.000614790 | 0.99938539 | 0.000067530 | 1.00067550 |
| GDP | -0.0000088300 | 0.99999999 | 0.000002924 | 1.00000000 | 0.000008246 | 1.00000000 |
| 常量 | -4.4368890000 | 0.01183269 | 1.357303000 | 3.88569960 | -1.578751000 | 0.20623249 |
| ROC | 0.727 | 0.770 | 0.766 | |||
注:“–”表示未通过显著性检验 |
Tab. 4 The results of Kappa coefficients表4 kappa系列指数精度验证 |
| Kstandard | Klocation | Kno | Kquantity |
|---|---|---|---|
| 0.907 | 0.934 | 0.909 | 0.971 |
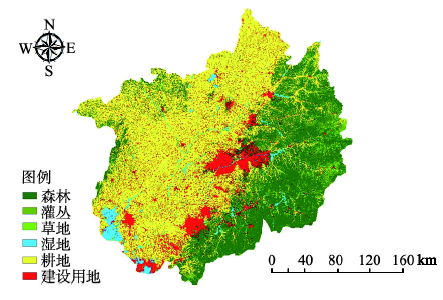
Fig. 3 The simulation result of natural development in 2020图3 情景1的2020年模拟结果 |
Fig. 4 The simulation result of economical development in 2020图4 情景2的2020年模拟结果 |
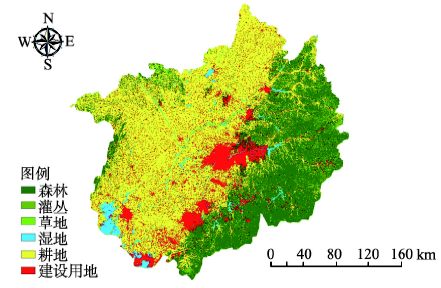
Fig. 5 The simulation result of ecological development in 2020图5 情景3的2020年模拟结果 |
The authors have declared that no competing interests exist.
| [1] |
|
| [2] |
|
| [3] |
|
| [4] |
|
| [5] |
|
| [6] |
|
| [7] |
|
| [8] |
|
| [9] |
|
| [10] |
|
| [11] |
|
| [12] |
|
| [13] |
|
| [14] |
|
| [15] |
|
| [16] |
|
| [17] |
|
| [18] |
|
| [19] |
|
/
| 〈 |
|
〉 |