
基于GIS的汉江流域水汽输送与降水时空模式研究
作者简介:梁文谦(1988-),男,硕士生,研究方向为水资源与地理信息系统应用。E-mail:1694281210@qq.com
收稿日期: 2013-04-24
要求修回日期: 2013-12-20
网络出版日期: 2014-07-10
基金资助
国家自然科学基金项目(41371368、41101258)
华中科技大学专项基金(1162)
The Spatio-Temporal Distribution of Water Vapor Transport and Precipitation over Hanjiang River Basin Based on GIS
Received date: 2013-04-24
Request revised date: 2013-12-20
Online published: 2014-07-10
Copyright
水汽输送及降水模式对流域水文模型及水资源研究具有重要意义。汉江流域水资源对南水北调以及下游生态环境有重要影响,研究汉江流域水汽输送和降水的时空分布特征是水文模拟和水资源环境管理的基础。本文利用NCEP/NCAR再分析资料和汉江流域19个气象站点的降水资料,以及GIS数据库和分析工具,分析了汉江流域的水汽通量、可降水量、实测降水量和降水转换率的计算方法;以汉江流域1998年7月的气候再分析资料和降水资料为例,计算并分析了汉江流域1998年7月可降水量与实测降水量的空间分布特征,以及降水转化率的分布特征;探讨了水汽输送、可降水量、实测降水量,以及降水转化率的相关性和空间分布特征。通过分析汉江流域1981-2010年的可降水量和实际降水量的分布表明,汉江流域可降水量与降水量变化趋势基本相同,降水转换率近年有所增加。
梁文谦 , 易善桢* , 曾小凡 , 李宏宏 , 孙燕 . 基于GIS的汉江流域水汽输送与降水时空模式研究[J]. 地球信息科学学报, 2014 , 16(4) : 575 -581 . DOI: 10.3724/SP.J.1047.2014.00575
The spatio-temporal distributions of water vapor transport and precipitation are important factors for hydrologic modeling and water resources planning. The precipitation in Hanjiang River Basin is an important factor to South-to-North Water Diversion Project. At the same time, the water resources utilization of Hanjiang River Basin has significant impact on the downstream ecologic environment of Hangjiang River. The research of spatio-temporal distribution of water vapor transport and precipitation is a foundation for hydrologic modeling, water resources utilization and environment management for Hanjiang River Basin. First, a work flowhart was designed based on climate reanalysis data, station precipitation data and GIS. Based on GIS tools, by using NCEP/ NCAR monthly reanalysis data and precipitation data of 19 meteorological stations in Hanjiang River Basin, the paper has provided methods for calculating water vapor transport, precipitable water, measured precipitation and the conversion rate from precipitable water to actual precipitation. Using the climate reanalysis data and precipitation data in the July of 1998 as the experiment data, the spatial distribution of precipitable water, measured precipitation and the conversion rate from precipitable water to actual precipitation were calculated and visualized based on GIS. The spatial changing trends of the distributions are analyzed. The paper has explored the spatio-temporal distribution and relationships among water vapor transport, precipitable water, measured precipitation and the conversion rate. The temporal distribution of precipitable water and measured precipitation during 1981-2010 were analyzed, and the results indicated that the changing trends of precipitable water and measured precipitation are similar, and the conversion rate from precipitable water to actual precipitation has increased in recent years in Hanjiang River Basin.
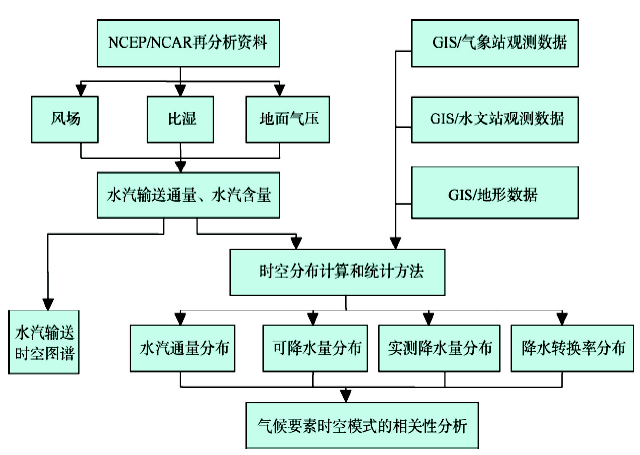
Fig.1 A flowchart of the research for spatio-temporal distribution of water vapor transport图1 水汽输送时空模式研究方法及流程图 |
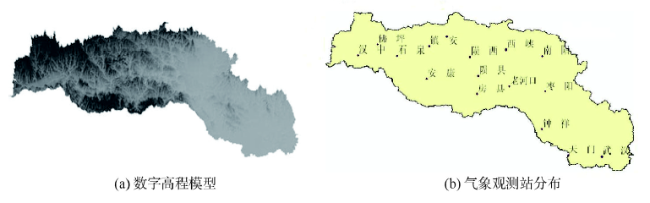
Fig.2 Locations of observing stations and digital elevation map of Hanjiang River Basin图2 汉江流域数字高程模型及气象观测站的分布图 |
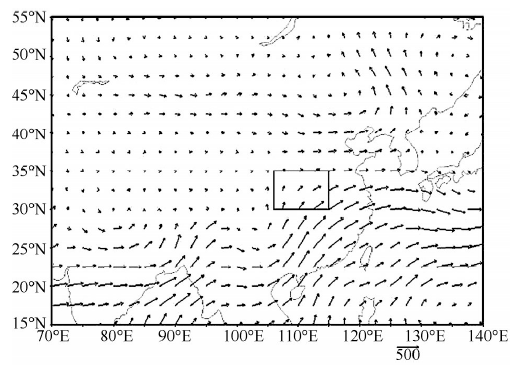
Fig.3 The vector field of water vapor flux in mid-July of 1998 (kg∙m-1∙s-1)图3 1998年7月中旬整层水汽通量矢量场(kg∙m-1∙s-1) |
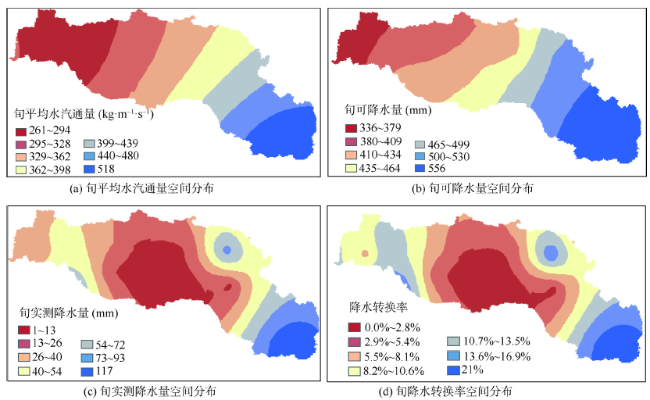
Fig.4 The spatial distribution of climatic variables for Hanjiang River Basin in mid-July of 1998图4 汉江流域1998年7月中旬气候要素空间分布图 |
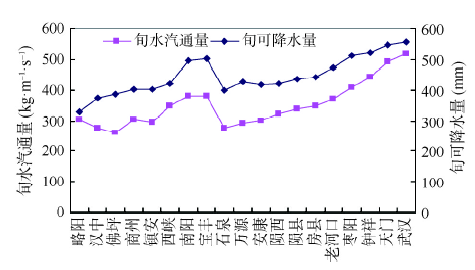
Fig.5 The distribution of precipitable water and water vapor flux for Hanjiang River Basin in mid-July of 1998图5 汉江流域1998年7月中旬各气象站水汽输送通量与可降水量分布图 |
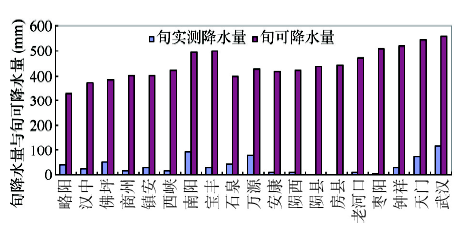
Fig.6 The spatial distribution of precipitation and precipitable water for Hanjiang Basin in mid-July of 1998图6 汉江流域1998年7月中旬各气象站可降水量与实测降水量分布图 |
Tab.1 The correlationship of water vapor flux, precipitable water, precipitation and conversion rate of precipitation in 1998表1 汉江流域1998年旬水汽通量、可降水量、实测降水量、降水转换率之间的相关关系 |
| 站名 | 水汽通量 | 水汽通量 | 水汽通量 | 可降水量 | 实测降水量 |
|---|---|---|---|---|---|
| 与可降水量 | 与实测降水量 | 与降水转换率 | 与实测降水量 | 与降水转换率 | |
| 汉中 | 0.764 | 0.651 | 0.722 | 0. 678 | 0.959 |
| 佛坪 | 0.721 | 0.565 | 0.619 | 0.706 | 0.960 |
| 石泉 | 0.725 | 0.577 | 0.605 | 0.683 | 0.957 |
| 南阳 | 0.834 | 0.559 | 0.385 | 0.561 | 0.911 |
| 陨西 | 0.762 | 0.309 | 0.156 | 0.535 | 0.812 |
| 钟祥 | 0.865 | 0.474 | 0.323 | 0.500 | 0.887 |
| 天门 | 0.861 | 0.451 | 0.257 | 0.495 | 0.870 |
| 武汉 | 0.868 | 0.267 | 0.185 | 0.466 | 0.931 |
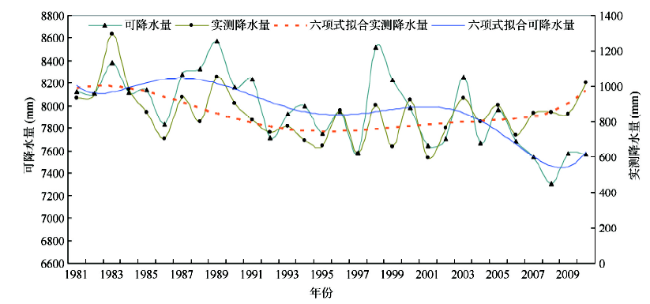
3.4 可降水量与实测降水量的时间变化特征 |
Fig.7 Standardized anomaly evolution curve of precipitable water and precipitation in Hanjiang River Basin图7 汉江流域大气可降水量与降水量标准化距平演变曲线 |
The authors have declared that no competing interests exist.
| [1] |
|
| [2] |
|
| [3] |
|
| [4] |
|
| [5] |
|
| [6] |
|
| [7] |
|
| [8] |
|
| [9] |
|
| [10] |
|
| [11] |
|
| [12] |
|
| [13] |
|
| [14] |
|
| [15] |
|
| [16] |
|
| [17] |
|
| [18] |
|
| [19] |
|
| [20] |
|
| [21] |
|
| [22] |
|
| [23] |
|
| [24] |
|
| [25] |
|
/
| 〈 |
|
〉 |