
医疗设施布局的GIS优化评价——以翔安区医疗设施为例
作者简介:谢小华(1987-),女,硕士,助理工程师,主要从事三维数字建模、GIS应用、地理国情普查统计分析等研究。E-mail:fzxiexh@126.com
收稿日期: 2014-04-09
要求修回日期: 2014-06-18
网络出版日期: 2015-03-10
基金资助
福建省测绘地理信息局科技项目(201312)
Evaluating the Medical Facilities Layout Based on GIS: An Application of Xiang'an District
Received date: 2014-04-09
Request revised date: 2014-06-18
Online published: 2015-03-10
Copyright
开展现有医疗设施布局的分析与评价,对解决公众医疗需求与医疗服务供给的矛盾,以及政府部门决策具有重要意义。本文在厦门市第一次全国地理国情普查试点的背景下,以翔安区医疗设施为研究对象,在地理国情普查数据结果的基础上,结合卫生等专业部门的统计数据,从医疗设施的现状、服务水平和空间布局优化3个角度,构建了医疗设施布局的评价指标体系。从医疗卫生角度分析医疗资源现状特征;基于GIS网络分析开展医疗设施服务水平的分析与评价;利用GIS“位置分配模型”对医疗设施空间布局进行优化。最后,本文对医疗设施布局提出改善建议和措施。研究结果表明:(1)翔安区医疗资源总量不足,分布不均衡;(2)城乡医疗设施差异明显,医疗服务水平不高;(3)翔安区需新增4家医院,5家卫生院才能满足居民就医需求。本研究可以为今后翔安区医疗设施布局决策提供借鉴和参考,为医疗设施布局评价提供一个可行的方法。
谢小华 , 王瑞璋 , 文东宏 , 张智勇 . 医疗设施布局的GIS优化评价——以翔安区医疗设施为例[J]. 地球信息科学学报, 2015 , 17(3) : 317 -328 . DOI: 10.3724/SP.J.1047.2015.00317
It is of great significance to analyze and evaluate the medical facilities layout. It can not only solve the contradiction between the public health demand and the medical service supplies, but also help government make rational decisions. Xiamen was selected as a pilot area in the first national census of geographic conditions. On this background, this paper takes Xiang'an District as an example and gives a comprehensive study on its medical facilities layout. Based on two kinds of data source: the data of the first national geographic conditions census and the statistical data from the department of health and other departments, an evaluation index system of medical facilities layout was constructed from three aspects: the current situation, the service level and the spatial layout optimization. The current situation of medical resources was analyzed from the view of medical and health care. The evaluation of the service level of medical facilities was performed on the basis of GIS network analysis. The spatial layout of the medical facilities was optimized by the usage of the GIS “Location Allocation Model”. Finally, this paper presented improvement suggestions and measures for medical facilities layout. The study results show: (1) the medical resources are insufficient and distribute unevenly. (2) The medical facilities vary widely between urban and rural area. Meanwhile, the medical service is in a low level. (3) Four hospitals and five health centers should be added to meet the public’s health demand. In a word, this study will be helpful for government to make decision regarding Xiang'an District’s medical facilities layout in future. In addition, it provides a feasible method to evaluate the medical facilities layout reasonableness.
Tab. 1 The optimization model types of LA in GIS表1 GIS“位置分配”的优化模型类型 |
| 优化模型 | 模型目标 | 模型说明 |
|---|---|---|
| 最小化阻抗 | 请求点与设施点解之间的所有加权成本之和最小,即任何一个请求点到距其最近的设施之间的平均距离最小 | “最小化阻抗”能减少公众到达选定设施点的总距离。通常被用于某些公共设施(如图书馆、学校、医疗诊所等)的选址 |
| 最大化覆盖范围 | 在设施点的阻抗中断内,使尽可能多的请求点被分配到所求解的设施点 | 常用于定位消防站、警察局和ERS中心等紧急救援服务设施 |
| 最大化有容量限制的覆盖范围 | 在设施点的阻抗中断内,使尽可能多的请求点被分配到所求解的设施点,同时,分配给设施点的加权请求不可超过设施点的容量 | 在“最大化覆盖范围”基础上,增加了设施点的容量限制 |
| 最小化设施点 | 在设施点的阻抗中断内,使尽可能多的请求点被分配到所求解的设施点,同时,还要使覆盖请求点的设施点的数量最小化 | 在“最大化覆盖范围”基础上,考虑了定位的设施点数目。如需考虑设施点的建造成本,则原本使用“最大覆盖范围”的组织可应用“最小化设施点”来求解 |
| 最大化人流量 | 在假定分配至设施点的请求数量随着距离的增加而减少的前提下,将设施点定位在能将尽可能多的请求权重分配给设施点的位置上 | 该模型适合于存在竞争的商业设施,如专卖店、餐馆等;也适用于公交车站的选址 |
| 最大化市场份额 | 利用指定数量的设施点,占尽可能多的市场份额 | 该模型需要知道自己和竞争对手的设施点的权重。若拥有包括竞争对手数据在内的全面信息,最大化人流量问题类型的设施点也可以使用市场份额类型 |
| 目标市场份额 | 在存在竞争者的情况下,确定出占有总市场份额指定百分比所需的设施点的最小数量 | 在考虑预算的情况下,“目标市场份额”就回到了“最大化市场份额”的情况 |
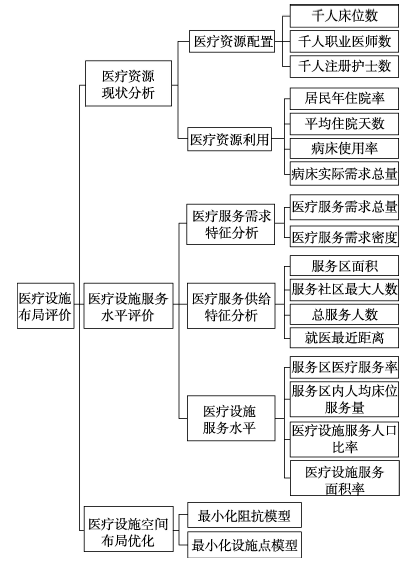
Fig. 1 The evaluation index system of medical facilities layout图1 医疗设施布局评价指标体系 |
Tab. 2 Per capita medical resources of Xiang'an District in 2012表2 2012年翔安区人均医疗资源 |
| 地区 | 千人床位数(张) | 千人职业医师(人) | 千人注册护士(人) |
|---|---|---|---|
| 翔安区 | 2.3 | 1.3 | 1.2 |
| 厦门市 | 3.1 | 1.6 | 1.8 |
| 福建省 | 3.5 | 1.8 | 1.9 |
| 中国 | 4.2 | 1.9 | 1.8 |
注:资料来源于2013年《厦门市经济特区年鉴》、《福建省统计年鉴》、《中国统计年鉴》 |
Tab. 3 Indices of the medical resource utilization in Xiang'an District表3 翔安区医疗资源利用指标值 |
| 指标 | 医院 | 社区卫生服务中心 | 乡镇卫生院 |
|---|---|---|---|
| 入院人数(×104人) | 364.95 | 6.65 | 118.13 |
| 平均住院日(d) | 9.00 | 6.20 | 5.00 |
| 病床使用率(%) | 97.30 | 48.00 | 63.30 |
注:资料来源于《福建省统计年鉴-2013》 |
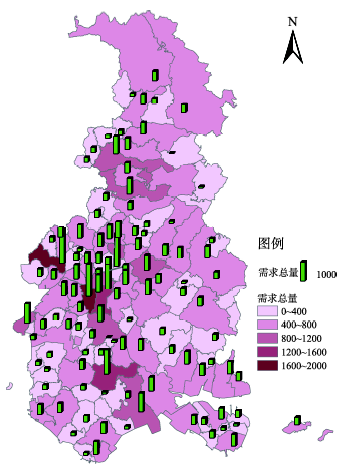
Fig. 2 The aggregate demand distribution of Xiang'an图2 翔安区患病总需求量分布图 |
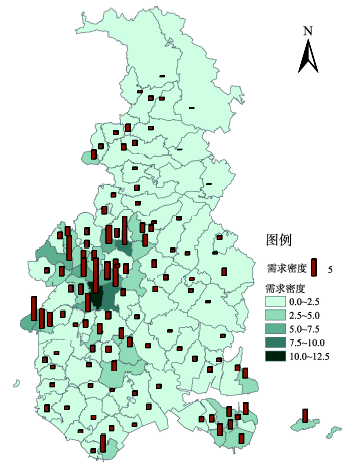
Fig. 3 The demand density distribution of Xiang'an图3 翔安区医疗服务需求密度分布图 |
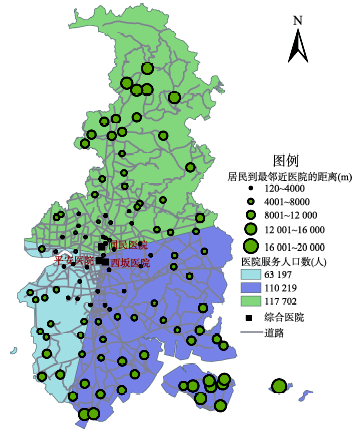
Fig. 4 The distances from residents to the nearest hospitals图4 村/社区到最邻近医院的距离分布图 |
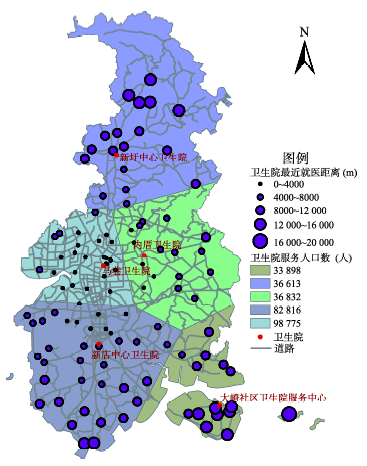
Fig. 5 The distances from residents to the nearest health-centers图5 村/社区到最邻近卫生院的距离分布图 |
Tab. 4 The statistical data of distances from residents to the nearest hospitals表4 村/社区到最邻近医院的距离统计表 |
| 指标 (km) | <2 | 2~4 | 4~6 | 6~7.5 | 7.5~10 | >10 |
|---|---|---|---|---|---|---|
| 村/社区数(个) | 11 | 24 | 20 | 10 | 21 | 26 |
| 居民点所占比例(%) | 9.8 | 21.4 | 17.9 | 8.9 | 18.8 | 23.2 |
| 人口数(人) | 49 036 | 73 135 | 39 776 | 28 163 | 48 686 | 52 322 |
Tab. 5 The statistical data of distances from residents to the nearest health-centers表5 村/社区到最邻近卫生院的距离统计表 |
| 指标 (km) | <0.5 | 0.5~2 | 2~4 | 4~6 | >6 |
|---|---|---|---|---|---|
| 村/社区数 | 5 | 30 | 41 | 30 | 6 |
| 居民点所占比例(%) | 4.5 | 26.8 | 36.6 | 26.8 | 5.3 |
| 人口数(人) | 12 817 | 88 932 | 110 473 | 67 405 | 11 491 |
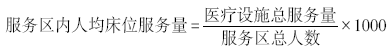
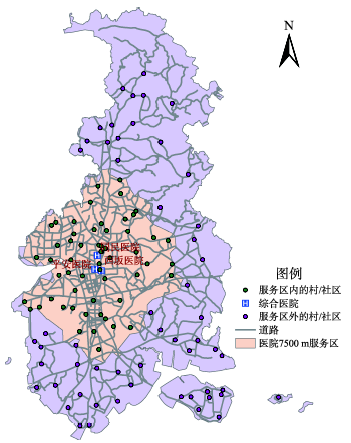
Fig. 6 Hospital service area图6 医院7500 m服务区图 |
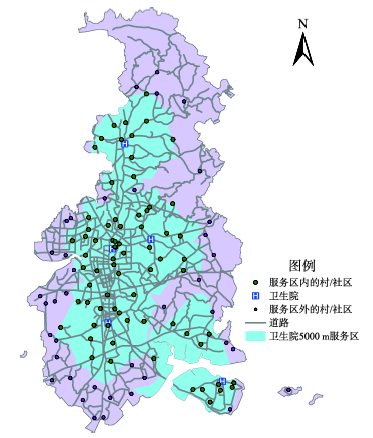
Fig. 7 Health-center service area图7 卫生院5000 m服务区图 |
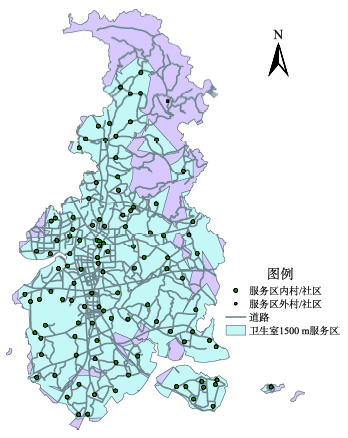
Fig. 8 Clinic service area图8 卫生室1500 m服务区图 |
Tab. 6 The statistics of medical facilities’ service capability in Xiang'an District表6 翔安区医疗机构服务能力统计表 |
| 机构 | 服务总人数(人) | 服务区面积(km2) | 人均服务量(张/千人) | 服务面积率(%) | 服务人口比率(%) | 服务率(%) |
|---|---|---|---|---|---|---|
| 医院 | 177 048 | 112.56 | 3.05 | 31.6 | 58.2 | 72.4 |
| 卫生院 | 205 478 | 182.87 | 0.73 | 51.4 | 67.5 | 51.0 |
| 卫生室 | 288 884 | 264.58 | - | 74.3 | 94.9 | - |
注:卫生室不设置病床 |
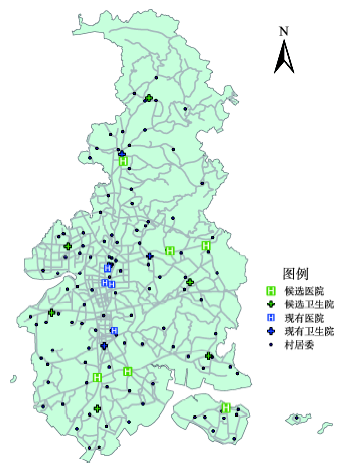
Fig. 9 The distribution of new medical facilities图9 新增医疗设施点分布图 |
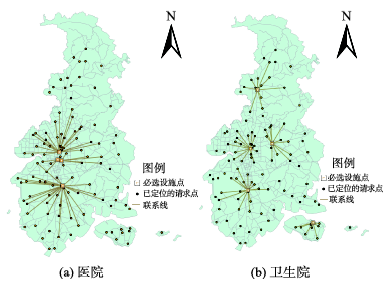
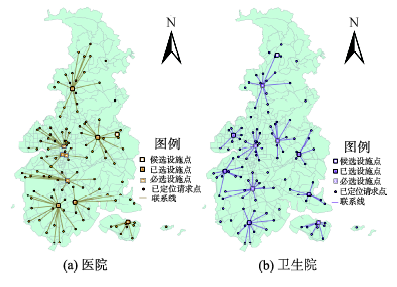
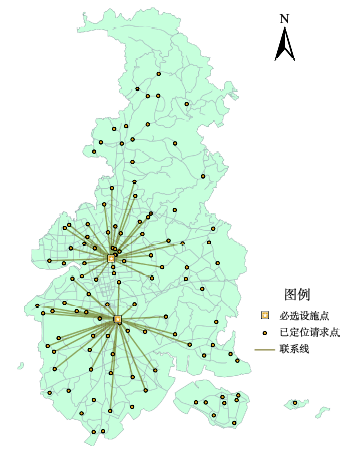
Fig. 10 The minimum impedance model of medical facilities in Xiang'an District图10 翔安区医疗设施最小化阻抗模型图 |
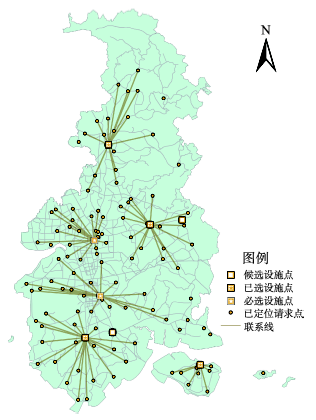
Fig. 11 The minimum impedance model of different numbers of hospitals图11 不同医院数量的最小化阻抗模型图 |
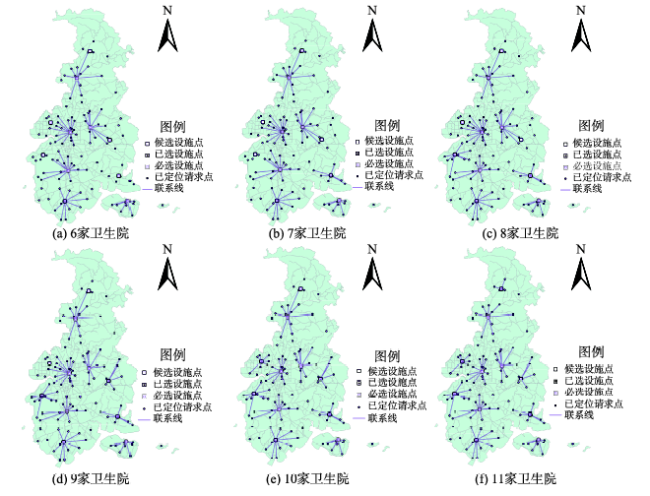
Fig. 12 The minimum impedance model of different numbers of health-centers图12 不同卫生院数量的最小化阻抗模型图 |
Tab. 7 The classification statistics for the minimum impedance model of medical facilities in Xiang'an District表7 翔安区医疗设施最小化阻抗模型分级统计表 |
| 机构 | 选取医院数量(个) | 联系线数量(条) | 服务人口数(人) | 服务人口比例(%) |
|---|---|---|---|---|
| 医院 | 5 | 82 | 231 512 | 76.07 |
| 6 | 90 | 247 672 | 81.38 | |
| 7 | 97 | 261 192 | 85.82 | |
| 8 | 102 | 270 495 | 88.88 | |
| 9 | 104 | 274 998 | 90.36 | |
| 10 | 104 | 274 998 | 90.36 | |
| 卫生院 | 6 | 76 | 211 457 | 69.48 |
| 7 | 83 | 229 072 | 75.27 | |
| 8 | 89 | 245 053 | 80.52 | |
| 9 | 93 | 253 727 | 83.37 | |
| 10 | 96 | 259 865 | 85.39 | |
| 11 | 99 | 264 963 | 87.06 |
Fig. 13 The minimized facilities model of medical facilities in Xiang'an District图13 翔安区医疗机构最小化设施点模型图 |
Fig. 14 The minimum impedance model of Tongmin hospital and the Fifth hospital图14 同民医院和厦门市第五医院最小化阻抗模型图 |
Tab. 8 The classification statistics for the minimum impedance model of Tongmin hospital and the Fifth hospital in Xiang'an District表8 同民医院和厦门市第五医院的最小化阻抗模型分级统计表 |
| 选取医院数量(个) | 联系线数量(条) | 服务人口数(人) | 服务人口比例(%) |
|---|---|---|---|
| 2 | 68 | 202 694 | 66.60 |
| 3 | 80 | 228 941 | 75.23 |
| 4 | 88 | 245 101 | 80.54 |
| 5 | 95 | 258 621 | 84.98 |
| 6 | 102 | 270 495 | 88.88 |
| 7 | 104 | 274 998 | 90.36 |
| 8 | 104 | 274 998 | 90.36 |
Fig. 15 The minimum impedance model of different numbers of hospitals图15 不同医院数量的最小化阻抗模型图 |
Fig. 16 The distribution of hospital layout optimization图16 医院空间布局优化位置分布图 |
The authors have declared that no competing interests exist.
| [1] |
|
| [2] |
|
| [3] |
|
| [4] |
|
| [5] |
|
| [6] |
|
| [7] |
|
| [8] |
|
| [9] |
|
| [10] |
|
| [11] |
|
| [12] |
|
| [13] |
|
| [14] |
|
| [15] |
|
| [16] |
|
| [17] |
|
| [18] |
|
| [19] |
|
| [20] |
|
/
| 〈 |
|
〉 |

