
基于地表通量特征的城市不透水表面定量热红外遥感反演
作者简介:刘 越(1977-),男,博士,主要从事城市生态遥感定量模拟与分析研究工作。E-mail:liuyue@lries.ac.cn
收稿日期: 2014-04-30
要求修回日期: 2014-06-12
网络出版日期: 2014-07-10
基金资助
国家自然科学青年基金项目(40901224)
国家重点基础研究发展计划(2010CB95090101)
The Surface Flux Characteristics Based Quantitative Thermal Infrared Remote Sensing Inversion of Urban Impervious Surfaces
Received date: 2014-04-30
Request revised date: 2014-06-12
Online published: 2014-07-10
Copyright
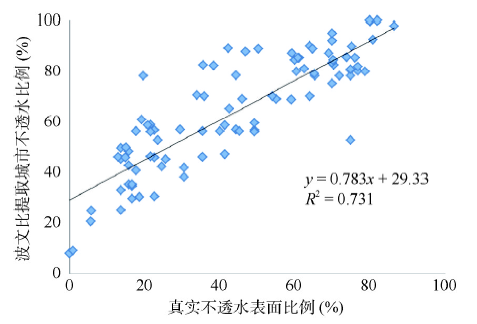
城市不透水地表格局通过改变城市下垫面结构,引起地表反照率、比辐射率、地表粗糙度的变化,从而对地表辐射和能量平衡产生直接影响。不透水地表能增强地表显热通量,导致地表波文比升高,因此地表波文比的空间差异可推算城市人工不透水表面的分布。本研究选择北京市为实验区,应用Landsat TM卫星热红外遥感数据,采用PCACA模型及理论定位算法,对城市地表波文比进行反演,进而计算遥感地表波文比空间分布数据与城市不透水表面比例数据之间的相关关系,构建回归方程,实现北京市城区与近郊区人工不透水表面百分比分布的定量估算,最后以高分辨率遥感数据获取的城市人工不透水表面比例数据进行结果验证。结果表明,采用PCACA模型定量反演城市地表波文比数据,利用地表波文比数据与不透水表面比例数据之间的相关关系可实现城市人工不透水表面百分比数据的定量估算;波文比值不仅可在遥感像元水平定性判定不透水像元,还可对混合像元中的不透水比例进行较高精度的定量反演,其相关系数R²值为0.731。此方法有效地揭示了城市不透水下垫面对地表热通量影响的机制以及空间定量关系。
刘越 , 迟文峰 , 匡文慧 . 基于地表通量特征的城市不透水表面定量热红外遥感反演[J]. 地球信息科学学报, 2014 , 16(4) : 609 -620 . DOI: 10.3724/SP.J.1047.2014.00609
Urban impervious surface pattern causes changes of surface albedo, emissivity and surface roughness by changing the structure of urban surface, and thereforeinfluences the balance of surface radiation and energy directly. Impervious surfaces will increase the surface sensible heat flux, resulting in a rise of surface Bowen ratio, which provides a physical basis forpredicting the distribution of urban artificial impervious surfaces through spatial differences of Bowen ratio. In this study, we selected Beijing as the experimental areaand appliedthe PCACA model and theoretical positioning algorithm to calculate the Bowen ratio of urban surfaces with Landsat TM satellite thermal infrared remote sensing data. Furthermore, based on the correlation between the spatial distribution of surface Bowen ratio and the proportion of urban impervious surfaces, a regression equation was built to estimatethe percentage of Beijing urban artificial impervious surfaces distribution. The result was tested and verifiedwith the artificial impervious surface ratio of the city extracted from high-resolution remote sensing data. The result shows that in the method which inverts urban surface Bowen ratio data using the PCACA model, and then estimates the ratio of urban artificial impervious surface percentage distribution based on the correlation between the surface Bowen ratio data and the proportion data of urban impervious surfaces, Bowen ratio can be used not only to qualitatively determine if a remote sensing pixel is the impermeable at a pixel level, but also to calculate with high accuracy the proportion of the impermeable part of a mixed pixel, and the correlation coefficient R² value between the estimated impervious surface ratio based on Bowen ratio and the real proportion was 0.731. This method reveals the mechanism of the impact of the urban impervious land surfaceson heat flux and their spatial quantitative relationship.
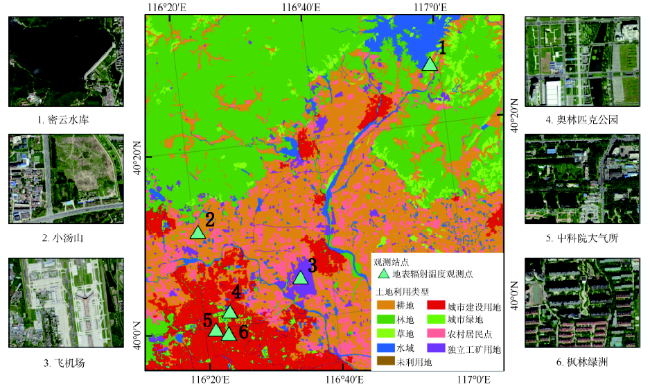
Fig.1 The observation points of surface flux inthe experiment area图1 研究区地表通量观测点分布图 |
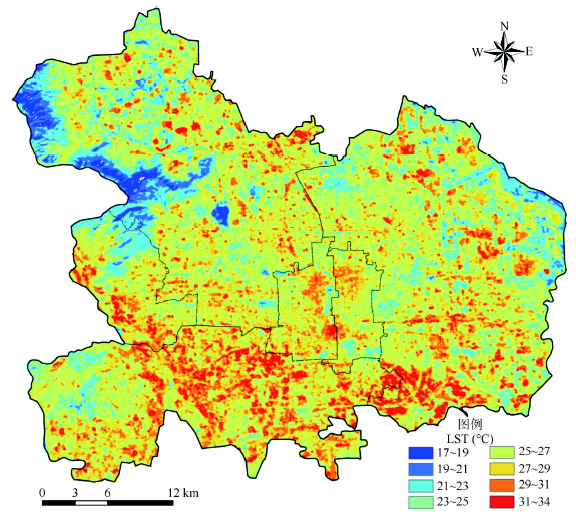
Fig.2 Spatial distribution map of the instantaneous surface temperature of the experiment area图2 研究区瞬间地表温度空间分布图(2009年9月20日12:43) |
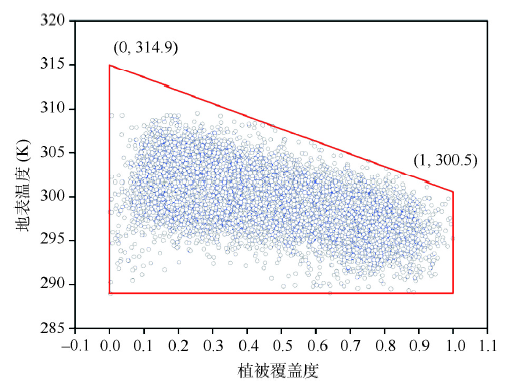
Fig.3 Trapezium structure of the relationship between vegetation cover percentage and land surface temperature of the experimental area图3 研究区植被覆盖度与地表面温度相关梯形结构图 |
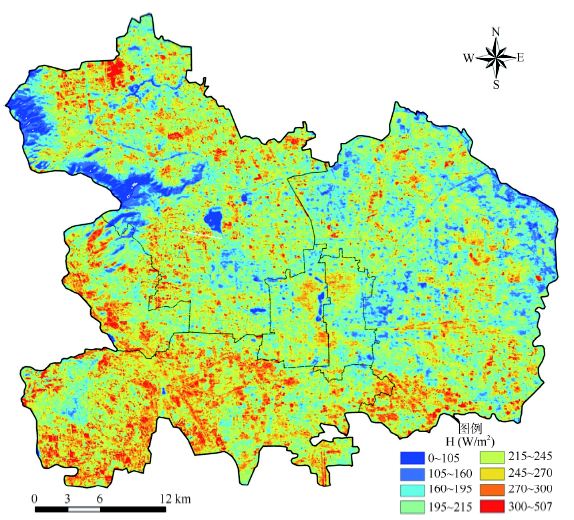
Fig.4 Spatial distribution map of the instantaneous sensible heat flux of the experiment area图4 研究区瞬间显热通量空间分布图(2009年9月20日10:43) |
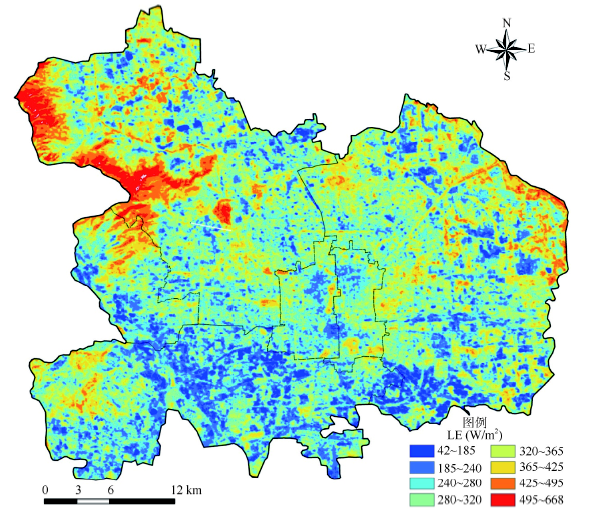
Fig.5 Spatial distribution map of the latent heat flux of the experiment area图5 研究区潜热通量空间分布图(2009年9月20日10:43) |
 (17)
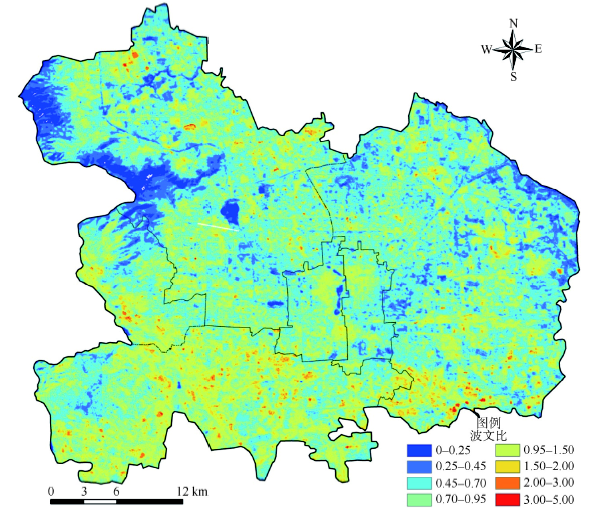
(17) Fig.6 Spatial distribution map of the Bowen ratio of the experiment area图6 研究区波文比空间分布图 |
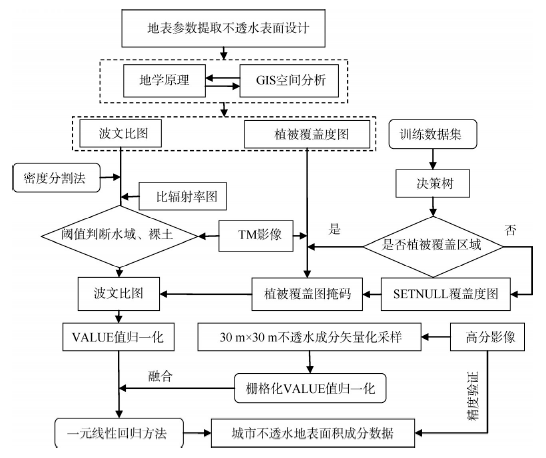
Fig.7 Technical flow chart of impervious surface parameters extraction图7 地表参数不透水信息提取技术流程 |
Fig.8 Linear plot of fitting line between Bowen ratio and measured data图8 真实采样与波文比拟合直线图 |
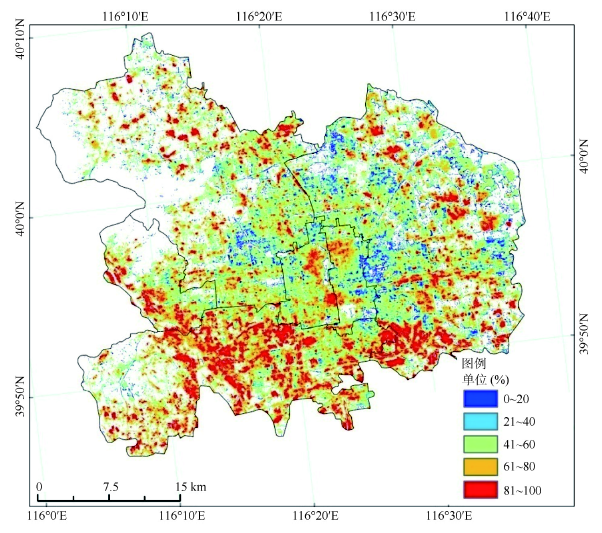
Fig.9 Urbanimpervious rate fitting results based on Bowen ratio图9 基于波文比的城市不透水率拟合结果图 |
Tab.1 Comparisonofland surface temperature values表1 地表温度值比对表 |
| 序号 | 区域名称 | 地理坐标 | 土地利用类型 | 实测值(℃) | 反演值(℃) |
|---|---|---|---|---|---|
| 1 | 国际机场区域 | 40°07′ N,116°59′E | 水泥道路 | 30.64 | 29.09 |
| 2 | 国际机场区域 | 40°07′ N,116°59′E | 草地 | 30.61 | 29.36 |
| 3 | 国际机场区域 | 40°06′ N,116°60′E | 沥青道路 | 30.73 | 31.16 |
| 4 | 密云水库 | 40°45′ N,116°96′E | 水域 | 20.86 | 19.30 |
| 5 | 密云水库 | 40°45′ N,116°98′E | 灌木 | 24.37 | 23.67 |
| 6 | 密云水库 | 40°45′ N,116°98′E | 裸土 | 28.10 | 25.64 |
| 7 | 小汤山区域 | 40°17′ N,116°34′E | 草地 | 25.02 | 23.31 |
| 8 | 小汤山区域 | 40°18′ N,116°34′E | 人工育苗林地 | 25.40 | 23.84 |
| 9 | 小汤山区域 | 40°18′ N,116°34′E | 玉米地 | 21.06 | 21.98 |
| 10 | 小汤山区域 | 40°17′ N,116°34′E | 人工草地 | 27.01 | 24.09 |
| 11 | 小汤山区域 | 40°17′ N,116°34′E | 草地 | 25.61 | 22.30 |
| 12 | 小汤山区域 | 40°18′ N,116°34′E | 林地 | 21.20 | 21.66 |
| 13 | 地理所东北侧 | 40°01′ N,116°38′E | 沥青道路 | 34.10 | 28.42 |
| 14 | 中科联附近区域 | 40°00′ N,116°38′E | 人工草地 | 26.50 | 26.97 |
| 15 | 地理所附近 | 40°01′ N,116°38′E | 城市林地 | 25.30 | 24.97 |
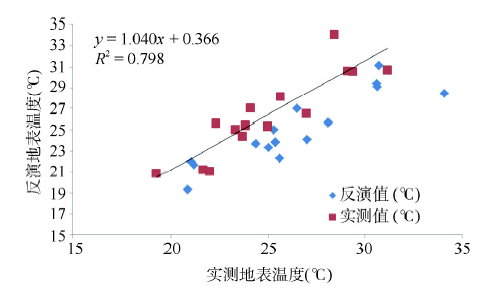
Fig.10 Linear plot of the measured surface temperature and the values of the inversion图10 地表温度实测值与反演值的线性关系图 |
Tab.2 Comparison between the inverted and measured surface Bowen ratio values表2 地表波文比反演值与实测值比对表 |
| 区域名称 | 下垫面类型 | 实测值(W/m2) | 反演值(W/m2) | ||||
|---|---|---|---|---|---|---|---|
| Rn | H | LE | H/LE | Rn | H/LE | ||
| 中科联楼顶 | 城市 | 460 | 186 | 53 | 3.51 | 535 | 1.78 |
| 森林公园 | 草地林地 | 491 | 85 | 109 | 0.78 | 581 | 0.79 |
Tab.3 Comparison of this result withrelevant values from the literature表3 本研究结果与参考文献值的对比 |
| 城市 | 观测高度(m) | 观测时段 | 比例(H/LE) | 地表特征与 参考文献编号 |
|---|---|---|---|---|
| 加拿大,温哥华 (49°16′N,123°06′W) | / | 1992年8月 | 4.42 | 典型城区,[35] |
| 法国,马赛 (43°17′N,5°23′E) | 43.9, 34.6 | 2001年6-7月 | 4.27 | 典型城区,[36] |
| 瑞士,巴塞尔(47°34′N,7°36′E) | 32.0 | 2002年7-8月 | 2.50 | 典型城区,[37] |
| 日本,COSMO实验(39°04′N,139°07′E) | 3.0 | 2006年7月 | 1.90 | 典型城区,[38] |
| 美国,图森 (32°07′N,110°56′W) | 25.6 | 1990年6月 | 1.83 | 典型城区,[39] |
| 日本,东京 (35°34′N,139°41′E) | 29.0 | 2001年7月 | 1.77 | 典型城区,[40] |
| 美国,洛杉矶 (34°08′N,118°03′W) | 30.5 | 1993年7-8月 | 1.40 | 城区,较多绿地[39] |
| 美国,萨克拉门托 (38°39′N,121°30′W) | 29.0 | 1991年8月 | 1.37 | 城区,较多绿地,[39] |
| 美国,芝加哥 (41°57′N,87°48′W) | 18.0 | 1992年7月 | 0.78 | 城市绿地,[39] |
| 中国,北京 (39°58′N,116°42′E) | 140.0 | 2009年7-8月 2010年6月 | 0.82 | 城市绿地,[41] |
| 中国,北京中科联楼顶(40°00′N,116°38′E) | 15.0 | 2011年9月22日 | 3.51 | 典型居民区,本文实测 |
| 中国,北京森林公园(40°04′N,116°39′E) | 3.0 | 2011年9月22日 | 0.78 | 城市绿地,本文实测 |
| 中国,北京风林绿洲小区(40°00′N,116°38′E) | / | 2009年9月20日 | 1.78 | 典型居民区,本文反演 |
| 中国,北京森林公园(40°04′N,116°39′E) | / | 2009年9月20日 | 0.79 | 城市绿地,本文反演 |
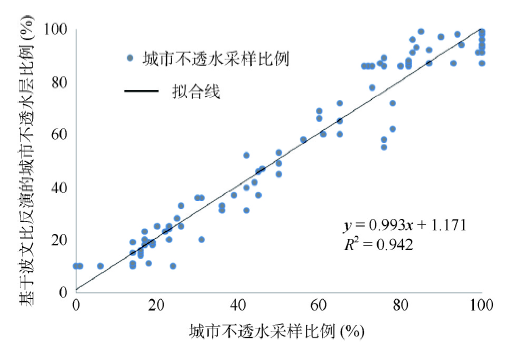
Fig.11 Correlation between Bowen ratio based impervious surface ratio and the real proportion of impervious surface图11 基于波文比数据提取的不透水比例数据与真实不透水表面比例间的相关关系 |
The authors have declared that no competing interests exist.
| [1] |
|
| [2] |
|
| [3] |
|
| [4] |
|
| [5] |
|
| [6] |
|
| [7] |
|
| [8] |
|
| [9] |
|
| [10] |
|
| [11] |
|
| [12] |
|
| [13] |
|
| [14] |
|
| [15] |
|
| [16] |
|
| [17] |
|
| [18] |
|
| [19] |
|
| [20] |
|
| [21] |
|
| [22] |
|
| [23] |
|
| [24] |
|
| [25] |
|
| [26] |
|
| [27] |
|
| [28] |
|
| [29] |
|
| [30] |
|
| [31] |
|
| [32] |
|
/
| 〈 |
|
〉 |