
海口市海岸带土地利用时空格局变化分析
作者简介:王德智(1990-),男,硕士生,研究方向为GIS开发和土地生态。E-mail:wuhan1990hk@126.com
收稿日期: 2013-12-16
要求修回日期: 2014-03-06
网络出版日期: 2014-11-01
基金资助
国家自然科学基金项目(41361090)
海南省自然科学基金项目(412103)
海南师范大学国家大学生创新实验项目(101165839)
Research on Spatial-temporal Changes of Land Use in Haikou City’s Coastal Zone
Received date: 2013-12-16
Request revised date: 2014-03-06
Online published: 2014-11-01
Copyright
在深入分析土地利用转移矩阵基础上,对单项土地利用类型动态度进行改进,引入信息熵和缓冲区梯度带法,提出了自然生态影响度的土地利用变化程度的概念、含义,并构建计算模型。对海口市南渡江东岸海岸带进行研究,得到以下结论:1991-2010年间建设用地增长最为明显,耕地面积减少量最大;信息熵持续增加,表明均衡度增加,快速城市化过程中各经济产业所需的职能土地类型已逐渐产生,区域发展逐渐走向成熟;土地利用变化程度指数能有效衡量土地利用类型变化的剧烈程度,而且能够测算这种变化对自然生态环境的影响大小,1991-2010年间偏离自然生态方向、较强变化以上的区域占总面积的20.60%,与耕地、林地转变为建设用地,以及林地转变为园地区域重合;趋向自然生态方向、较强变化以上的区域仅占总面积的2.42%;东岸海岸带受城市梯度辐射和开发区、大学城飞地影响,同时也受农业比较利益和土地利用调控政策影响。东寨港红树林面积略微减小,受城市化影响较小。研究表明:分层次、多种算法相结合的研究方法,可有效分析综合型海岸带土地利用时空格局变化特征及其驱动机制。
关键词: 海口市; 海岸带; 土地利用变化程度指数; 信息熵; 梯度理论
王德智 , 邱彭华 , 方源敏 , 李颖 . 海口市海岸带土地利用时空格局变化分析[J]. 地球信息科学学报, 2014 , 16(6) : 933 -940 . DOI: 10.3724/SP.J.1047.2014.00933
In order to study the spatial-temporal changes of land use in coastal city, this paper proposes the concept and meaning of land use change degreebased on the ecological impact,constructs a calculation model, and improves the dynamic degree of single land use type based on the analysis of transfer matrix of land use. Meanwhile, the method of information entropy and gradient buffer zone is introduced. Take the east coast of Nandu River in Haikou City as the study area,the results indicated that: from 1991 to 2010, the construction land had the most significant growth, and the amount of arable land was reducing the most.The increase of information entropyindicated that the equilibrium degreewas gradually increasing, each type of land required for economic industry had been gradually produced under the rapid urbanization process, and regional development was gradually matured. The index of land use change degree can effectively measure the intensity of the land use changes, and its impact on the natural environment. From 1991 to 2010, the region that deviated from the natural environment with stronger variation in land use was 20.60% of the total area, which was in coincidence with the percentage of arable land and forest land that were converted to construction land combined with forest land that was converted to garden area. The region following the natural ecological direction, with stronger variations in land use accounted for only 2.42% of the total area. In addition, the east coastal zone was influenced not only by the radiation of city gradient, the enclave of the development zone and the emerging university town, but also influenced by the agricultural comparative benefits and the regulatory policies of land use. Mangrove areain Dongzhai Harborhad decreased slightly, which was less affected by urbanization effect. The research shows that combining a variety of methods, the characteristics of spatial-temporal changes of land use in the integrated coastal zone and its driving mechanism can be analyzed efficiently.
Key words: Haikou; coastal zone; land use change degree; information entropy; gradient theory
Tab.2 Land use dynamic degree in the study area表2 研究区土地利用类型动态度统计表 |
| 时段(年) | 耕地(%) | 园地(%) | 林地(%) | 建设用地(%) | 水域用地(%) | 其他土地(%) | 综合(%) |
|---|---|---|---|---|---|---|---|
| 1991-2001 | 3.14 | 4.92 | 3.56 | 4.92 | 2.10 | 5.18 | 2.49 |
| 2001-2010 | 3.30 | 4.87 | 3.70 | 4.23 | 2.52 | 5.09 | 2.68 |
Tab.1 Land use change degree matrix based on graded assignment method表1 基于分级赋值法的土地利用变化程度矩阵 |
| 地类1 | 地类2 | 地类3 | 地类4 | 地类5 | |
|---|---|---|---|---|---|
| 地类1 | 0 | Χ2–Χ1 | Χ3–Χ1 | Χ4–Χ1 | Χ5–Χ1 |
| 地类2 | Χ1–Χ2 | 0 | Χ3–Χ2 | Χ4–Χ2 | Χ5–Χ2 |
| 地类3 | Χ1–Χ3 | Χ2–Χ3 | 0 | Χ4–Χ3 | Χ5–Χ3 |
| 地类4 | Χ1–Χ4 | Χ2–Χ4 | Χ3–Χ4 | 0 | Χ5–Χ4 |
| 地类5 | Χ1–Χ5 | Χ2–Χ5 | Χ3–Χ5 | Χ4–Χ5 | 0 |
Tab.3 Land use conversion matrixes from 1991 to 2010 in the study area(hm2)表3 研究区1991-2010年土地利用转换矩阵(hm2) |
| 类 型 | 耕地 | 园地 | 林地 | 建设用地 | 水域用地 | 其他土地 | 1991年合计 | 流失土地 |
|---|---|---|---|---|---|---|---|---|
| 耕地 | 7521.41 | 2096.03 | 2261.53 | 2827.11 | 1537.24 | 252.12 | 16 495.44 | 8974.03 |
| 园地 | 844.39 | 567.38 | 483.23 | 472.59 | 172.09 | 86.68 | 2626.36 | 2058.98 |
| 林地 | 2279.96 | 1236.38 | 3218.01 | 1430.89 | 1138.49 | 74.55 | 9378.29 | 6160.28 |
| 建设用地 | 605.96 | 111.40 | 124.97 | 425.80 | 140.07 | 31.99 | 1440.19 | 1014.39 |
| 水域用地 | 880.00 | 76.02 | 620.13 | 157.77 | 5062.59 | 33.48 | 6829.99 | 1767.40 |
| 其他土地 | 106.50 | 4.84 | 96.21 | 99.33 | 80.94 | 6.74 | 394.56 | 387.82 |
| 2010年合计 | 12 238.22 | 4092.05 | 6804.08 | 5413.50 | 8131.43 | 485.55 | 37 164.82 | |
| 新增地 | 4716.81 | 3524.67 | 3586.07 | 4987.70 | 3068.84 | 478.81 |
Tab.4 Land use change degree matrix based on graded assignment method in the study area表4 基于分级赋值法的研究区土地利用变化程度矩阵 |
| 耕地 | 园地 | 林地 | 建设 | 水域 | 其他 | |
|---|---|---|---|---|---|---|
| 耕地 | 0 | 0 | 2 | -1 | 1 | 3 |
| 园地 | 0 | 0 | 2 | -1 | 1 | 3 |
| 林地 | -2 | -2 | 0 | -3 | -1 | 1 |
| 建设 | 1 | 1 | 3 | 0 | 2 | 4 |
| 水域 | -1 | -1 | 1 | -2 | 0 | 2 |
| 其他 | -3 | -3 | -1 | -4 | -2 | 0 |
Tab.5 The classification of land use change degree (hm2)表5 土地利用变化程度分级(hm2) |
| 变化 程度 | 极强 变化+ | 强烈 变化+ | 较强 变化+ | 中度 变化+ | 轻微 变化 | 中度 变化– | 较强 变化– | 强烈 变化– | 极强 变化– |
|---|---|---|---|---|---|---|---|---|---|
| 程度 区间 | -180~-40 | -140~-100 | -100~-60 | -60~-20 | -20~20 | 20~60 | 60~100 | 100~140 | 140~180 |
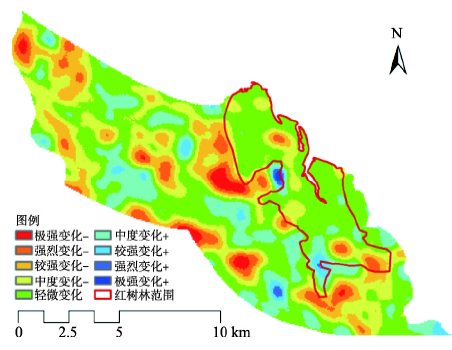
Fig.1 Land use change degree in the study area图1 研究区土地利用变化程度 |
Fig.2 Graded statistics of land use change degree in the study area图2 研究区土地利用变化程度分级统计 |
Fig.3 Division of the gradient buffer zone图3 缓冲区梯度带划分 |
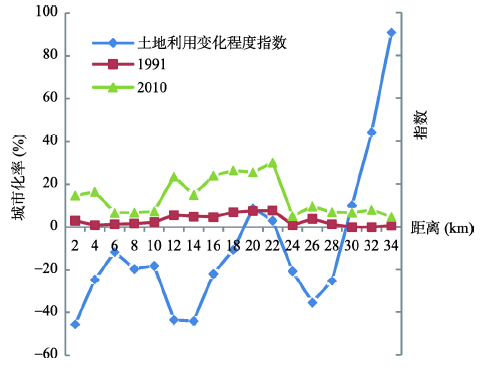
Fig.4 Land use change degree and urbanization rate in the gradient zone图4 梯度带土地利用变化程度与城市化率 |
The authors have declared that no competing interests exist.
| [1] |
|
| [2] |
|
| [3] |
|
| [4] |
|
| [5] |
|
| [6] |
|
| [7] |
|
| [8] |
|
| [9] |
|
| [10] |
|
| [11] |
|
| [12] |
|
| [13] |
|
| [14] |
|
| [15] |
|
| [16] |
|
| [17] |
|
| [18] |
|
| [19] |
|
| [20] |
|
| [21] |
|
/
| 〈 |
|
〉 |

