
快速城市化地区交通主干道对景观格局变化的影响
作者简介:曹武星(1989-),男,硕士生,主要从事GIS应用和景观生态学研究。E-mail:caowuxing2009@163.com
收稿日期: 2013-12-30
要求修回日期: 2014-04-05
网络出版日期: 2014-11-01
基金资助
上海市浦江人才计划项目(14PJ1402800)
上海市教育委员会科研创新项目(14ZS053)
上海市城市化生态过程与生态恢复重点实验室开放课题基金(SHUES2014B02、SHUES2013A02)
The Impact of Road Development on Landscape Pattern Change in Rapidly Urbanizing Area
Received date: 2013-12-30
Request revised date: 2014-04-05
Online published: 2014-11-01
Copyright
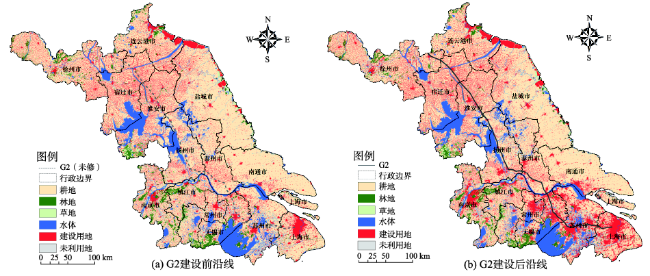
交通主干道建设对两侧景观格局变化有着深远的影响,探索其影响机制对道路生态环境评价和区域可持续发展规划具有重要指导意义。本文以京沪高速公路(简称G2)为例,利用TM遥感影像,提取出1995、2000、2005和2010年长江三角洲地区土地利用/覆被图。同时,用缓冲区分析和景观生态学方法,分别计算不同时段和地域段G2缓冲带景观数量结构特征指数和景观格局指数变化率;并结合相关分析和非线性回归方法研究指数变化率与缓冲带距离的关系,据此判断G2对沿线景观格局变化的影响程度和范围。研究结果表明:(1)G2沿线地区景观格局变化程度与缓冲带距离呈现显著的负相关性,G2对景观格局变化的影响呈现明显的“轴带”规律;(2)G2对沿线景观格局变化的影响范围比自然生态脆弱区的道路建设更广,2000-2005年为6 km,2005-2010年扩大到9 km;(3)从整体来看,2005-2010年间的景观数量结构特征指数相关系数明显高于2000-2005年间,而景观格局指数相关系数则相反,“轴带”影响存在时间差异性;(4)从不同区域段来看,苏北和苏南段景观动态度相关系数均高于上海段,在城市化水平较低的地域段,“轴带”影响更加显著;(5)通过对比道路沿线地区不同时段、不同地域段的相关景观特征指数变化率,并结合缓冲带分析和数量统计方法,较好地评估了交通主干道对沿线景观格局变化的影响程度和范围。
曹武星 , 罗飞雄 , 韩骥 , 武彩燕 , 象伟宁 . 快速城市化地区交通主干道对景观格局变化的影响[J]. 地球信息科学学报, 2014 , 16(6) : 898 -906 . DOI: 10.3724/SP.J.1047.2014.00898
Understanding the mechanism of how road development lays profound impacts on the landscape change is significant for regional sustainable development. This paper takes the YRD section of Beijing-Shanghai Expressway as a case, analyzes the remote sensing images in 1995, 2000, 2005 and 2010,and utilizes buffer zone analysis method to estimate the change rate of the landscape quantity structure and landscape pattern index in different periods and regions. Meanwhile, the correlation analysis and nonlinear regression methods are adopted to investigate the relationship between the change rate of landscape pattern and the buffer zone distance. The results from this study indicated the following points: firstly, the construction of G2 expressway generated an axial impact on landscape pattern change. In rapidly urbanizing areas, there is a negative correlation between the change rate of landscape pattern and the buffer distance, which is different from the case of Qinghai-Tibet Highway. Secondly, there is a significant impact of main roads on the succession rule of landscape pattern along the rapidly urbanizing areas, which has broader and stronger effects than the roads in ecologically fragile areas. Finally, the construction of main roads has different temporal and spatial gradient impacts on the succession rule of landscape pattern. With the development of urbanization, the road's effects on the landscape pattern become more obvious. The influence range of G2 is expanding, which was increased from 6 km during the period of 2000-2005 to 9 km during 2005-2010. In addition, in YRD region, the axial affection is more remarkable in cities with low degree of urbanization than those with high degree of urbanization. By combining buffer zone analysis, correlation analysis and nonlinear regression, as well as calculating the change rate of landscape pattern characteristics indices in different periods and regions, we could effectively assess the influence degree and scope of main roads on the landscape pattern change along the roads.
Fig. 1 The location of G2 and landscape pattern along the roads图1 G2地理位置及沿线景观示意图 |
Tab. 1 Introduction of research indices表1 研究指标介绍 |
| 指标名称 | 计算公式 | 定义描述 |
|---|---|---|
| 土地利用动态度 | 和分别为研究期初和期末某种土地利用类型的面积,T为研究时段长度,当T设为年时,K为某种土地利用类型面积的年变化率 | |
| 综合土地利用动态度 | 为监测起始时刻第i类土地利用类型的面积;为监测时段第i类土地利用类型转换为第j类土地利用类型的面积;T为检测时段长度 | |
| 土地利用程度综合指数 | 取值100到400,为第i级的土地利用程度分级指数;为第i级土地利用程度分级面积百分比 | |
| 斑块密度 | N代表斑块数,A为区域面积,定义为每km2的斑块数,取值无上限 | |
| 分维数 | 反映斑块的复杂程度 | |
| 多样性指数 | 为斑块i在总面积中的比重,反映景观中各类斑块的复杂性和变异性的度量 |
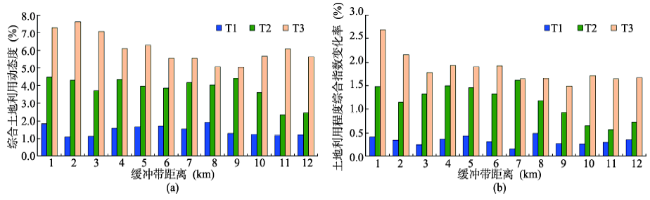
Fig. 2 The change of landscape quantity structure characteristic index of buffer zones图2 缓冲带不同时期景观数量结构特征指数变化率 |
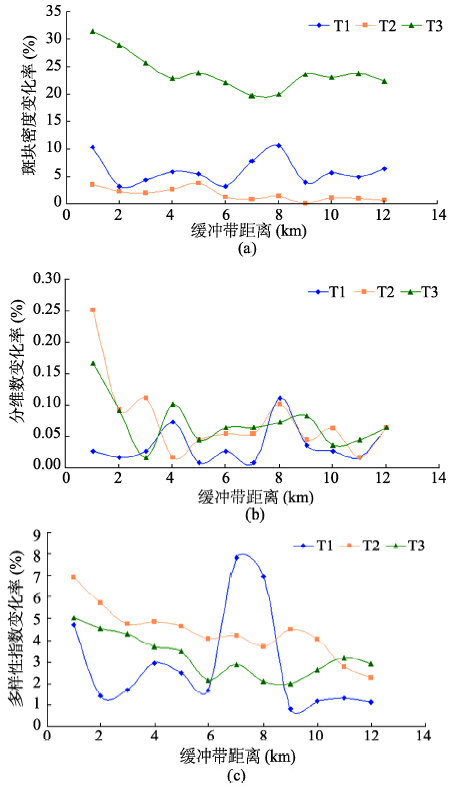
Fig. 3 The change of landscape pattern index of buffer zones图3 缓冲带不同时期景观格局指数变化率 |
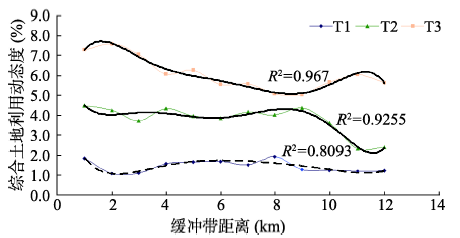
Fig. 4 The fitting curves of LC value in buffer zones within different periods图4 不同时期道路缓冲带LC值变化拟合曲线 |
Tab. 2 Correlation between the buffer distance and the change rate of landscape quantity structure characteristic index表2 缓冲带距离与景观数量结构特征指数变化率的相关系数及显著性 |
| 时段 | 土地利用程度综合指数 | 综合土地利用动态度 |
|---|---|---|
| T1 | -0.207 | -0.262 |
| T2 | -0.760(P<0.01) | -0.709(P<0.01) |
| T3 | -0.772(P<0.01) | -0.761(P<0.01) |
Tab. 3 Correlation between the buffer distance and landscape dynamic degree表3 缓冲带距离与各景观动态度变化率的相关系数及显著性 |
| 景观类型 | T1 | T2 | T3 |
|---|---|---|---|
| 整体景观 | -0.262 | -0.709(P<0.01) | -0.761(P<0.01) |
| 耕地 | -0.468(P<0.05) | -0.719(P<0.01) | -0.832(P<0.01) |
| 林地 | -0.120 | -0.532(P<0.05) | -0.321 |
| 水体 | -0.507(P<0.05) | -0.453(P<0.05) | -0.644(P<0.05) |
| 建设用地 | -0.024 | -0.787(P<0.01) | -0.703(P<0.01) |
Tab. 4 Correlation between the buffer distance and the change rate of landscape pattern index表4 缓冲带距离与景观格局指数变化率的相关系数及显著性 |
| 景观指数 | T1 | T2 | T3 |
|---|---|---|---|
| 斑块密度 | -0.038 | -0.748(P<0.01) | -0.655(P<0.05) |
| 分维数 | -0.210 | -0.557(P<0.05) | -0.469(P<0.05) |
| 多样性指数 | -0.187 | -0.898(P<0.01) | -0.745(P<0.01) |
Tab. 5 Correlation between the buffer distance and landscape dynamic degree in different regions表5 不同地域段景观动态度与缓冲带距离相关系数及显著性 |
| 景观类型 | 苏北段 | 苏南段 | 上海段 |
|---|---|---|---|
| 整体景观 | -0.445(P<0.05) | -0.915(P<0.01) | -0.545(P<0.05) |
| 耕地 | -0.754(P<0.01) | -0.834(P<0.01) | -0.409(P<0.05) |
| 林地 | -0.065 | -0.486(P<0.05) | -0.509(P<0.05) |
| 水体 | -0.839(P<0.01) | -0.853(P<0.01) | -0.563(P<0.05) |
| 建设用地 | -0.788(P<0.01) | -0.588(P<0.05) | -0.488(P<0.05) |
The authors have declared that no competing interests exist.
| [1] |
|
| [2] |
|
| [3] |
|
| [4] |
|
| [5] |
|
| [6] |
|
| [7] |
|
| [8] |
|
| [9] |
|
| [10] |
|
| [11] |
|
| [12] |
|
| [13] |
|
| [14] |
|
| [15] |
|
| [16] |
|
| [17] |
|
| [18] |
|
| [19] |
|
| [20] |
|
| [21] |
|
| [22] |
|
| [23] |
|
| [24] |
|
| [25] |
|
| [26] |
|
| [27] |
|
| [28] |
|
| [29] |
|
| [30] |
|
| [31] |
|
| [32] |
|
/
| 〈 |
|
〉 |