
近30 a中国上空臭氧总量时空变化遥感监测分析
作者简介:张莹(1988-),女,江苏徐州人,硕士生,研究方向为3S技术在气象上的应用。E-mail:zhangying1988101@163.com
收稿日期: 2013-12-20
要求修回日期: 2014-04-02
网络出版日期: 2014-11-01
基金资助
国家自然科学基金项目(41001289、41201369)
江苏高校优势学科建设工程资助项目
Variation of Total Ozone over China for 30 Years Analyzed by Multi-source Satellite Remote Sensing Data
Received date: 2013-12-20
Request revised date: 2014-04-02
Online published: 2014-11-01
Copyright
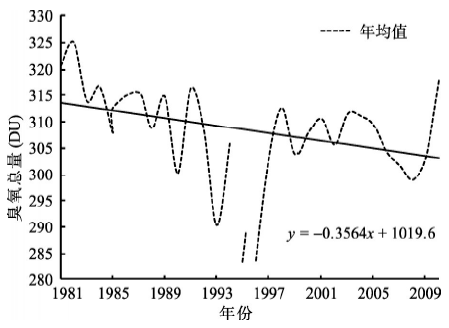
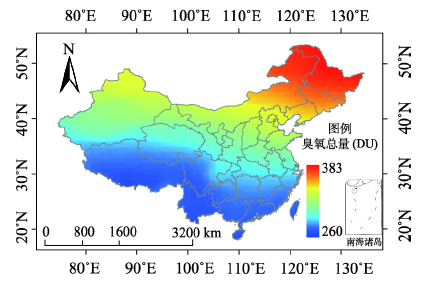
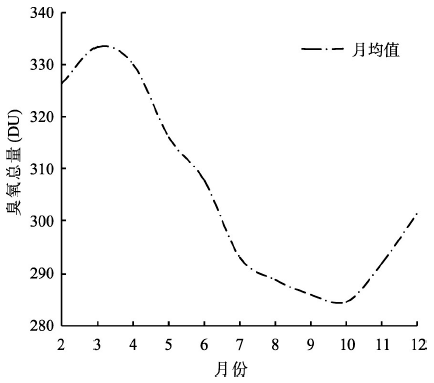
本文对近30 a以来中国上空臭氧总量的时空动态变化特征进行遥感监测与分析。结果表明,中国上空的臭氧总量在持续下降,下降速度低于全球臭氧总量下降速度,而与北半球下降速度基本一致,略低于北半球下降速度。中国臭氧总量每年平均减少0.11%,大约下降0.36 DU,但2000年后中国臭氧总量下降的速度有所减缓,尤其是2005年以来,中国臭氧总量呈上升趋势,这与全球的臭氧总量变化趋势相同。中国臭氧总量的季节变化呈正弦曲线变化,最大和最小值分别出现在3月和10月,平均值大约分别为333.36 DU和284.54 DU。中国臭氧总量季节变化在纬度方向上不明显,而在经度方向上变化较大,同纬度地区臭氧总量,东部地区的大于西部地区的,南北方地区臭氧总量季节变化几乎呈相反的趋势。
张莹 , 高玚 , 祝善友 , 张桂欣 . 近30 a中国上空臭氧总量时空变化遥感监测分析[J]. 地球信息科学学报, 2014 , 16(6) : 971 -979 . DOI: 10.3724/SP.J.1047.2014.00971
This paper focuses on the temporal and spatial dynamics of total ozone over China from 1981 to 2010 with multi-resource remote sensing and ground-level monitors. The results indicate that the total ozone over China is continuously decreasing. The speed of the decreasing is slower compared with the whole world and keeps almost the same compared with the northern hemisphere, but it is slightly slower than that of the northern hemisphere. The total ozone declines by 0.11% per year, reaching 0.36 DU. However, the pace of the decreasing slowed down since 2000. The temporal distribution of the total ozone over China is uneven. The total ozone increases with the rise of latitude, and the total ozone of the eastern region is higher than the western region. The total ozone tended to increase from 2005. The seasonal variation of the total ozone in China indicates a sine curve and the maximum and the minimum values appear in March and October respectively, and their corresponding average values are about 333.36 DU and 284.54 DU respectively. The total ozone over China shows an obvious seasonal variation. Overall, the total ozone over China in winter and spring is higher than summer and autumn. In different seasons, the variations of the total ozone over China of the southern area and the northern area are not the same. In winter and spring, the variations of the total ozone over China of the southern area and the northern area are bigger. While in summer and autumn, the variations are not obvious. The seasonal change of the total ozone over China is not evident in the latitudinal direction, but in the longitudinal direction. The seasonal variations of the southern area and the northern area are almost opposite. The amplitude of the seasonal variation increases with respect to the latitude.
Tab. 1 Information of 4 total ozone ground observations表1 4个臭氧总量地面观测点信息 |
| 站点号 | 站名 | 仪器 | 纬度 | 经度 | 高度(m) |
|---|---|---|---|---|---|
| 208 | 香河 | Dobson#75 | 39.75°N | 116.37°E | 80 |
| 295 | 瓦里关 | Brewer#054 | 36.287°N | 100.898°E | 3816 |
| 326 | 龙凤山 | Brewer#076 | 44.727°N | 127.585°E | 331 |
| 349 | 拉萨 | Brewer#117 | 29.67°N | 91.13°E | 3650 |
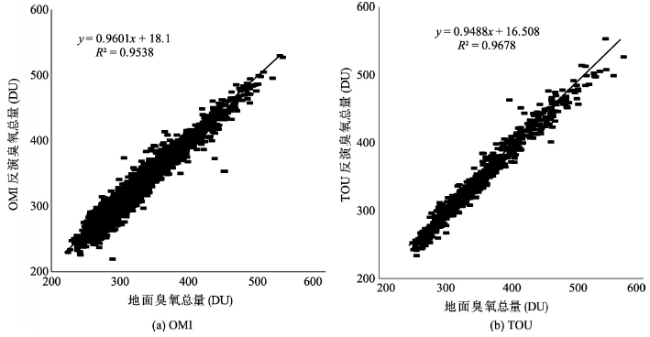
Tab. 2 Comparison and contrast of OMI and TOU with ground-based data (WOUDC)表2 OMI 和TOU遥感数据与地面数据(WOUDC)的比较验证 |
| 数据源 | 平均值(DU) | 相关系数 | 斜率 | 截距 | 时间 |
|---|---|---|---|---|---|
| WOUDC | 324.05 | 00.975 | 0.9601 | 18.1 | 2006.01-2009.06 |
| OMI | 318.66 | ||||
| WOUDC | 346.01 | 0.98 | 0.9482 | 16.508 | 2009.07-2010.12 |
| TOU | 347.28 |
Fig. 1 Comparison and contrast of OMI and TOU with ground-based data (WOUDC)图1 OMI 和TOU遥感数据与地面数据 (WOUDC) 的比较验证散点图 |
Fig. 2 Variation of average total ozone of Chinese mainland for 30 years图2 近30 a中国臭氧总量的年均值变化 |
Fig. 3 Distributive map of average total ozone of Chinese mainland for 30 years图3 近30 a中国大陆臭氧柱总量平均值分布图 |
Fig. 4 Monthly variation of total ozone of Chinese mainland for 30 years图4 近30 a 中国大陆臭氧总量月平均值的变化 |
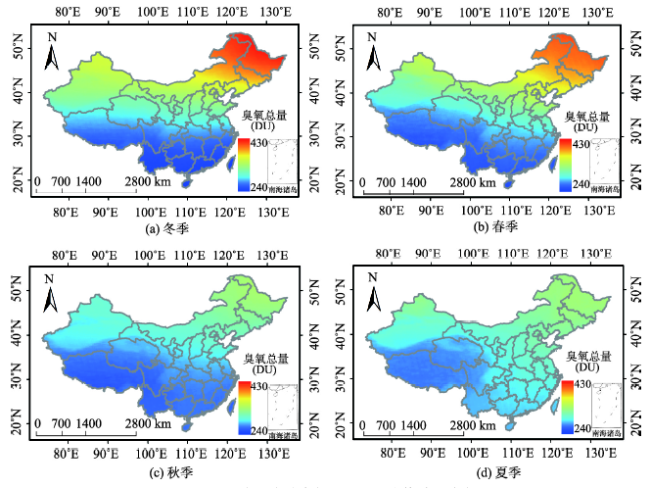
图5 近30a中国大陆臭氧柱总量平均值季节分布图Fig. 5 Seasonal variation of total ozone of Chinese mainland for 30 years |
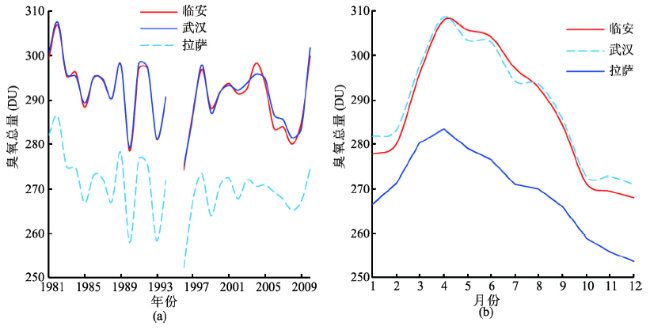
Fig. 6 Annually and monthly variation of total ozone for Lin'an, Wuhan, and Lhasa , which are at the same latitude but different longitudes图6 同一纬度不同经度3个点地区(临安、武汉、拉萨)年均值和月均值变化曲线 |
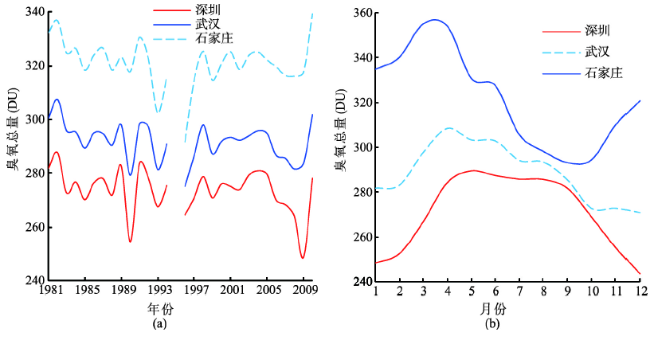
Fig. 7 Annually and monthly variation of total ozone for Shenzhen, Wuhan and Shijiazhuang, which are at the same longitude but different latitudes图7 同一经度不同纬度3个点地区(深圳、武汉、石家庄)年均值和月均值变化曲线 |
The authors have declared that no competing interests exist.
| [1] |
|
| [2] |
|
| [3] |
|
| [4] |
|
| [5] |
|
| [6] |
|
| [7] |
|
| [8] |
|
| [9] |
|
| [10] |
|
| [11] |
|
| [12] |
|
| [13] |
|
| [14] |
|
| [15] |
|
| [16] |
|
| [17] |
|
| [18] |
|
| [19] |
|
| [20] |
|
/
| 〈 |
|
〉 |