
基于MOD16产品的我国2001-2010年蒸散发时空格局变化分析
作者简介:贺添(1977-),男,博士生,四川成都人,研究方向为区域气候变化。E-mail:het.12b@igsnrr.ac.cn
收稿日期: 2014-05-21
要求修回日期: 2014-06-23
网络出版日期: 2014-11-01
基金资助
国家重点基础研究发展计划“973”项目(2010CB950902)
国家科技支撑计划项目(2013BAC03B04)
国家自然科学基金项目(41371409)
Spatial-temporal Variation of Terrestrial Evapotranspiration in China from 2001 to 2010 Using MOD16 Products
Received date: 2014-05-21
Request revised date: 2014-06-23
Online published: 2014-11-01
Copyright
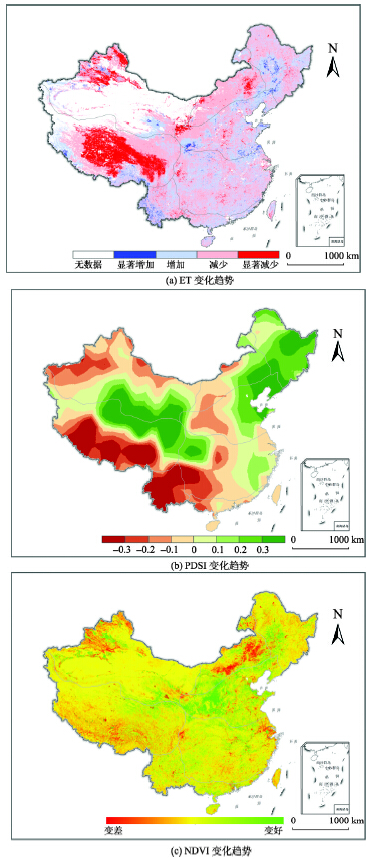
蒸散发的时空格局分析对理解气候变化与水资源之间的相互影响具有重要的作用。本文基于MODIS全球蒸散发产品(MOD16),分析了2001-2010年我国陆面蒸散发的时空格局变化,得出以下结论:(1)站点尺度和流域尺度的精度验证结果表明,MOD16产品对于我国森林、农田生态系统类型,以及辽河、海河、黄河和淮河流域的模拟精度较高;(2)2001-2010年,我国年均蒸散发为532±10 mm,年内蒸散值变化最大的是东北区,月均蒸散变异系数为0.87,而西北区变化幅度最小,变异系数为0.19;(3)2001-2010年,我国陆面蒸散发年际变化总的趋势不明显,占陆地面积11.2%区域的蒸散发呈显著减少趋势(p<0.05),主要分布在青藏高原中部,内蒙古中东部地区及新疆北部,只有2.3%的区域的蒸散发增加趋势显著,(p<0.05),主要分布在黄土高原地区、黄淮海平原及东北平原;(4)通过对比干旱指数变化趋势、植被指数变化趋势图可以看出,蒸散发显著减少的区域主要分布于干旱加剧的半干旱地区,而蒸散发显著增加的区域主要位于植被变好的地区。
贺添 , 邵全琴 . 基于MOD16产品的我国2001-2010年蒸散发时空格局变化分析[J]. 地球信息科学学报, 2014 , 16(6) : 979 -988 . DOI: 10.3724/SP.J.1047.2014.00979
Terrestrial evapotranspiration (ET) is a key process in the climate system and a nexus of the water and energy cycles. Understanding the temporal and spatial change of ET is important to analyze the climate impact on water resource. However, large scale ET estimation methods are still in evolution due to the complexity of processing ET. With the aid of MODIS ET products (MOD16), we obtained the 10-year spatial-temporal data sets of terrestrial ET in China from 2001 to 2010.MOD16 ET products were first validated at 8 flux towers and 10 large basins in China. The results show that although some uncertainties are present, the magnitudes and spatial pattern of ET in China are basically reasonable. The MOD16 products withthe best performances were observed at sites with forest and crop land cover, as well as in four basins in the north of China.The average annual terrestrial ET in China from 2001 to 2010 is 532±10 mm.The seasonal change of the ET in Northeast China is most obvious with a coefficient of variation (CV) of 0.87 based onthe average monthly ET, while the Northwest China has little seasonal variations making the CV is only 0.19. Generally, the estimated terrestrial ET in China shows littlesignificant variation during the 2001 to 2010 period. On the regional scale, approximately11.2% of the areas show significant negative ET trends, which occur mainly in the center of Tibetan Plateau, northeast of Inner Mongolia and the north of Xinjiang. Only 2.3% of the areas show significant positive ET trends, which mostly occur in Loess Plateau, Northeast Plain and Huang-Huai-Hai Plain. According to the analysis of the maps of the linear trends of PDSI and NDVI in China during 2001 to 2010, we can see the negative ET mainly occurs in the semi-arid areas which under go increasing drought; while the positive ET occurs in areas where the vegetation is turning better after large-scale ecological restoration projects were implemented.
Key words: evapotranspiration; MODIS; spatial-temporal variation; China
Tab. 1 General background of flux observation sites used in this study表1 通量观测站点基本信息 |
| 站点 | 覆被类型 | 经度 | 纬度 | 气候类型 | 海拔(m) | 降水(mm) |
|---|---|---|---|---|---|---|
| 长白山 | 落叶阔叶和针叶混交林 | 128°05′45″ | 42°24′9″ | 温带大陆性气候 | 738 | 713 |
| 千烟洲 | 人工针叶林 | 115°03′29″ | 26°44′29″ | 典型亚热带季风气候 | 100 | 1542 |
| 鼎湖山 | 常绿阔叶林 | 112°34′ | 23°10′ | 热带季风气候 | 300 | 1956 |
| 西双版纳 | 热带季节性雨林 | 101°12′ | 21°57′ | 热带季风气候 | 756 | 1453 |
| 禹城 | 旱作农田 | 116°34′ | 36°50′ | 暖温带半湿润季风气候 | 28 | 582 |
| 海北 | 高寒草甸 | 101°19′52″ | 37°39′55″ | 高原大陆性气候 | 3293 | 580 |
| 内蒙古 | 典型草原和草甸草原 | 116°40′ | 44°32′ | 温带半干旱大陆性气候 | 1187 | 400 |
| 当雄 | 高寒草甸 | 91°05′ | 30°51′ | 高原大陆性气候 | 4250 | 476 |
Tab. 2 Average precipitation and runoff data of selected river basins for ET comparisons from 2001-2010 national water resource first-order regionalizations表2 中国水资源一级区2001-2010年平均降水和径流 |
| 编号 | 水资源一级区 | 计算面积(×104km2) | 降水量(mm) | 径流量 (mm) |
|---|---|---|---|---|
| 1 | 松花江区 | 93.5 | 461 | 134 |
| 2 | 辽河区 | 31.4 | 514 | 138 |
| 3 | 海河区 | 32.0 | 490 | 81 |
| 4 | 黄河区 | 79.5 | 443 | 79 |
| 5 | 淮河区 | 33.0 | 869 | 314 |
| 6 | 长江区 | 180.0 | 1055 | 532 |
| 7 | 东南诸河 | 24.5 | 1663 | 944 |
| 8 | 珠江区 | 57.8 | 1536 | 811 |
| 9 | 西南诸河区 | 84.4 | 1071 | 667 |
| 10 | 西北诸河区 | 336.2 | 172 | 42 |
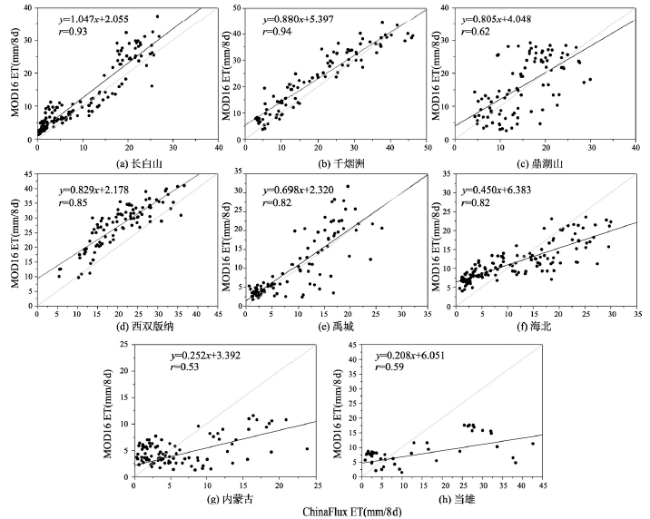
Fig. 1 Validation results from ChinaFlux sites图1 通量站点验证结果 |
Tab. 3 Statistics of MOD16 ET against the eddy-flux tower observations.表3 通量站点观测值与MOD16值比较 |
| 站点 | r | RMSE | BIAS | MAE | 时段 |
|---|---|---|---|---|---|
| 长白山 | 0.93 | 0.53 | 0.32 | 0.41 | 2003-2005 |
| 千烟洲 | 0.94 | 0.64 | 0.37 | 0.52 | 2003-2004 |
| 鼎湖山 | 0.62 | 0.85 | 0.14 | 0.69 | 2004-2005 |
| 西双版纳 | 0.85 | 0.99 | 0.89 | 0.86 | 2003-2004 |
| 禹城 | 0.82 | 0.59 | 0.12 | 0.43 | 2003-2004 |
| 海北 | 0.82 | 0.78 | 0.02 | 0.58 | 2003-2005 |
| 内蒙古 | 0.53 | 0.67 | -0.16 | 0.48 | 2004-2005 |
| 当雄 | 0.59 | 1.45 | -0.56 | 1.07 | 2004 |
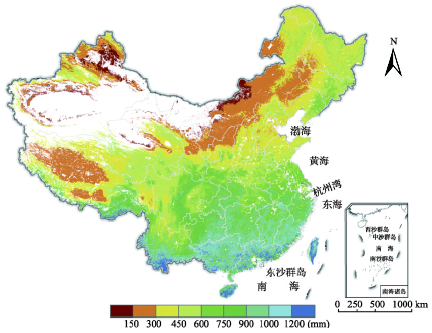
Fig. 3 Map of multiyear (2001-2010) mean annual ET in China图3 我国2001-2010年均蒸散分布图 |
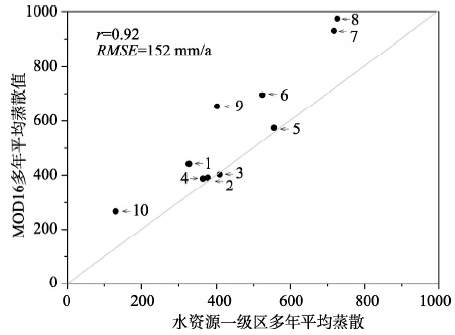
Tab. 4 Comparison of the MOD16 ET and basin scale ET over the 10 basins.表4 水资源一级区年均蒸散值与MOD16年均值比较 |
| 编号 | 水资源一级区 | 流域 ET(mm) | MOD16 ET(mm) |
|---|---|---|---|
| 1 | 松花江区 | 326.9 | 442.0 |
| 2 | 辽河区 | 376.8 | 391.4 |
| 3 | 海河区 | 408.6 | 402.8 |
| 4 | 黄河区 | 363.7 | 387.9 |
| 5 | 淮河区 | 554.9 | 573.7 |
| 6 | 长江区 | 523.5 | 696.5 |
| 7 | 东南诸河 | 717.3 | 930.3 |
| 8 | 珠江区 | 726.0 | 974.4 |
| 9 | 西南诸河区 | 401.6 | 654.0 |
| 10 | 西北诸河区 | 130.2 | 266.6 |
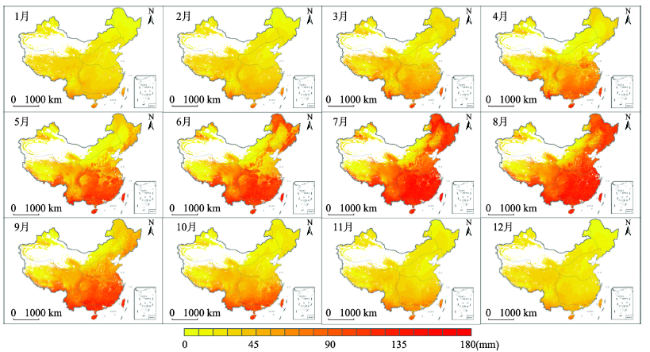
Fig. 4 Average monthly ET in China during 2001-2010图4 我国2001-2010年逐月陆面蒸散发分布图 |
Tab. 5 Statistics of average monthly ET of every district in China(mm)表5 我国不同区域多年平均月蒸散发量统计(mm) |
| 地区 | 月份 | 均值 | 变异系数 | |||||||||||
|---|---|---|---|---|---|---|---|---|---|---|---|---|---|---|
| 1 | 2 | 3 | 4 | 5 | 6 | 7 | 8 | 9 | 10 | 11 | 12 | |||
| 东北区 | 8.8 | 12.8 | 25.6 | 23.0 | 32.5 | 70.4 | 102.9 | 95.4 | 40.3 | 19.3 | 16.8 | 9.9 | 38.1 | 0.87 |
| 华北区 | 22.4 | 21.8 | 21.6 | 25.1 | 35.8 | 40.5 | 73.9 | 81.2 | 48.7 | 23.6 | 19.5 | 21.0 | 36.3 | 0.59 |
| 华中区 | 30.0 | 35.5 | 47.7 | 62.8 | 84.4 | 97.3 | 120.2 | 114.3 | 90.2 | 59.4 | 37.0 | 28.0 | 67.2 | 0.49 |
| 华南区 | 45.7 | 52.2 | 70.4 | 87.1 | 105.2 | 108.0 | 120.0 | 119.0 | 113.5 | 96.1 | 62.6 | 47.4 | 85.6 | 0.33 |
| 西南区 | 37.1 | 38.7 | 48.5 | 54.8 | 71.0 | 88.1 | 99.7 | 99.7 | 87.7 | 71.3 | 48.6 | 37.2 | 65.2 | 0.37 |
| 内蒙区 | 16.5 | 17.5 | 18.8 | 10.9 | 10.0 | 20.0 | 34.5 | 33.8 | 16.8 | 15.2 | 20.0 | 17.4 | 19.3 | 0.39 |
| 西北区 | 20.8 | 21.3 | 23.4 | 19.5 | 21.4 | 26.7 | 33.6 | 27.8 | 20.4 | 18.6 | 21.2 | 21.5 | 23.0 | 0.19 |
| 青藏区 | 29.4 | 31.1 | 36.0 | 34.5 | 42.1 | 48.1 | 55.5 | 55.2 | 45.4 | 35.8 | 28.5 | 28.2 | 39.1 | 0.25 |
注:分区依据任美锷、包浩生提出的中国自然地理区划方案 |
Fig. 5 Map of the linear trend of ET, PDSI and NDVI in China during 2001-2010图5 中国2001-2010年ET、PDSI和NDVI变化趋势图 |
The authors have declared that no competing interests exist.
| [1] |
|
| [2] |
|
| [3] |
|
| [4] |
|
| [5] |
|
| [6] |
|
| [7] |
|
| [8] |
|
| [9] |
|
| [10] |
|
| [11] |
|
| [12] |
|
| [13] |
|
| [14] |
|
| [15] |
|
| [16] |
|
| [17] |
|
| [18] |
|
| [19] |
|
| [20] |
|
| [21] |
|
| [22] |
|
| [23] |
|
| [24] |
|
| [25] |
|
| [26] |
|
| [27] |
|
| [28] |
|
| [29] |
|
| [30] |
|
| [31] |
|
| [32] |
|
| [33] |
|
| [34] |
|
| [35] |
|
| [36] |
|
| [37] |
|
/
| 〈 |
|
〉 |