
太湖浮游藻类的后向散射分离及其叶绿素a浓度反演
作者简介:阎福礼(1973-),男,博士,副研究员,主要从事定量反演研究。E-mail:yanfl@radi.ac.cn
收稿日期: 2014-03-17
要求修回日期: 2014-04-18
网络出版日期: 2014-11-01
基金资助
国家自然科学基金项目“富营养化水体的比辐射率测量及其红外水温遥感反演”(41371363)
Phytoplankton Backscattering Coefficients Partitioning and Its Applications in Retrieving Chlorophyll-a Concentrations in Taihu Lake
Received date: 2014-03-17
Request revised date: 2014-04-18
Online published: 2014-11-01
Copyright
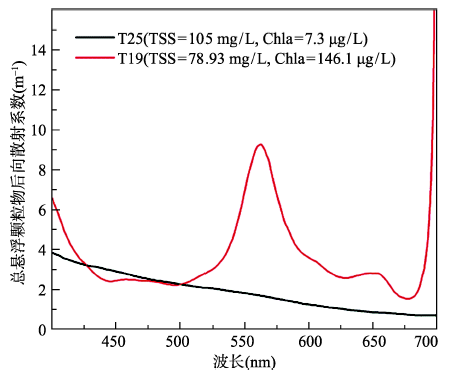
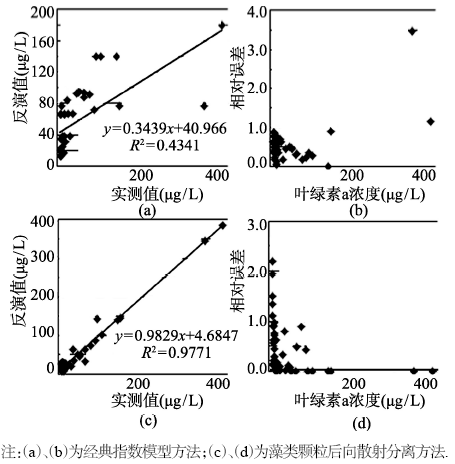
浮游藻类的后向散射是水体光谱构成的重要组成部分,作为水体辐射传输模型中的重要参数,高精度的藻类后向散射系数对水体叶绿素a浓度的遥感反演精度至关重要。本文以简化的辐射传输模型-生物光学模型为基础,尝试性分离了太湖浮游藻类的后向散射系数。通过藻类后向散射规律分析,建立了浮游藻类吸收、后向散射特征的叶绿素a反演模型,改善了叶绿素a浓度的遥感反演精度。分析表明:藻类颗粒物的后向散射系数与吸收系数之间存在反比关系,且在560 nm、700 nm附近存在明显的散射峰,与叶绿素a浓度之间相关性显著;低密度藻类水体总悬浮颗粒的后向散射以非色素颗粒为主导,适合采用经典的指数模型模拟后向散射系数,而藻类密度较高的富营养化水体,水体总悬浮颗粒的后向散射以藻类颗粒为主导,传统的指数模型已不适用;采用分离藻类后向散射系数的方法,使得叶绿素a浓度的反演值与真实值相关系数从0.66提高到0.98,相对误差从55%降低到38%,均方根误差(RMSE)也由60.95 μg/L降低至13.98 μg/L。其真实性检验表明,与经典指数模型方法相比,利用藻类颗粒后向散射分离方法反演叶绿素a浓度,能够显著改善反演精度。
阎福礼 , 刘韶菲 , 王世新 , 周艺 . 太湖浮游藻类的后向散射分离及其叶绿素a浓度反演[J]. 地球信息科学学报, 2014 , 16(6) : 989 -996 . DOI: 10.3724/SP.J.1047.2014.00989
As key parameters in bio-optical model, the backscattering coefficients of phytoplankton plays an important role in modelling the reflectance spectra and retrieving chlorophyll-a (CHL-a) concentrations from eutrophic water. An exponential model is usually used to simulate the total backscattering coefficients by omitting the phytoplankton backscattering in inland water characterized by lower concentrations of CHL-a. However, the exponential model is not valid for inland water with high CHL-a concentrations, and high relative errors and residues may exist in retrieving the CHL-a concentrations in the algae blooming area, due to the errors made by omitting or introducing inaccurate backscattering coefficients of phytoplankton. Therefore, a precise determination of the phytoplankton backscattering coefficients is of great importance in retrieving chlorophyll-a concentrations. Based on the classical bio-optical model, we proposed a method to partition the phytoplankton backscattering coefficients. The variations of the backscattering coefficients of phytoplankton particles with wavelengths in 400~700 nm and the chlorophyll-a concentrations are illustrated and discussed in details. According to the results mentioned above, following conclusions are drawn: (a) it is appropriate to model the total backscattering coefficients by using exponential function in most Case 2 waters with lower concentrations of Chlorophyll-a, where the non-algal suspended sediments dominated the optical properties. However, it is not applicable in eutrophic waters with higher concentrations of chlorophyll-a, where the algal particles dominated the optical properties; (b) phytoplankton backscattering coefficients vary inversely to their absorption coefficients, and two backscattering peaks emerge in the wavelengths of 560nm and 700nm, which are significantly correlated with CHL-a concentrations; (c) compare to the exponential model, the accuracy of the bio-optical model using the partitioned phytoplankton backscattering coefficients has improved greatly: the correlation coefficient between the retrieved and the measured CHL-a is increased from 0.66 to 0.98, the average relative error decreases from 55% to 38% , and the RMSE decreases from 60.95 to 13.98 in estimating CHL-a concentrations.
Key words: phytoplankton; backscattering coefficients; partitioning; eutrophic water
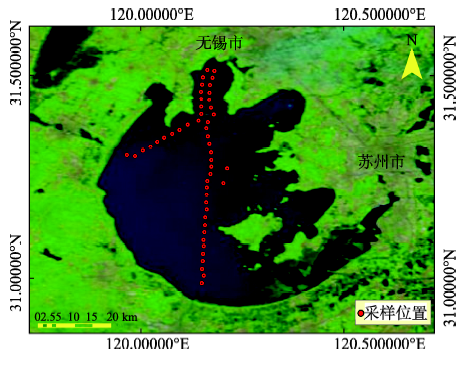
Fig. 1 Sampling locations in Taihu Lake图1 太湖采样点分布图 |
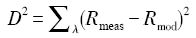
 表示对所有波段求和。通常定义一个最小距离D2来衡量光谱之间的匹配程度。
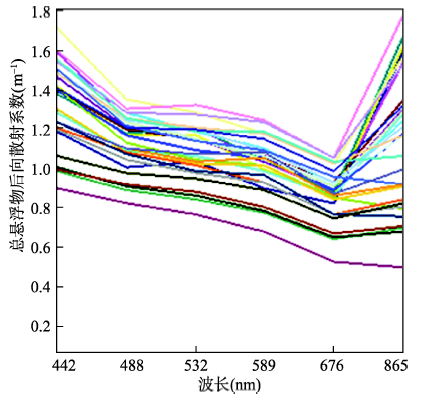
Fig. 3 Backscattering coefficients of the total suspended particulates in Taihu Lake图3 太湖总悬浮颗粒的后向散射特性 |
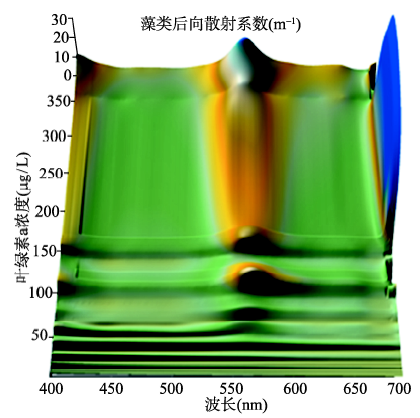
Fig. 4 The relationship between the phytoplankton backscattering coefficients and the chlorophyll-a concentration图4 藻类颗粒物后向散射系数与叶绿素a浓度的关系 |
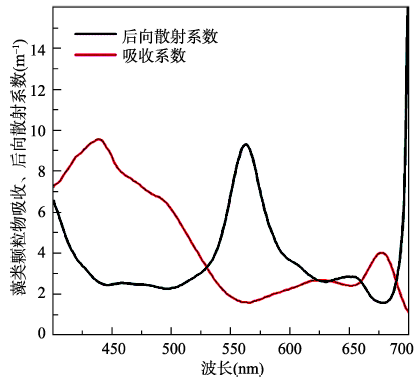
Fig. 5 The comparison between the phytoplankton scattering coefficients and its absorption coefficients图5 藻类颗粒物后向散射系数与吸收系数特征比较 |
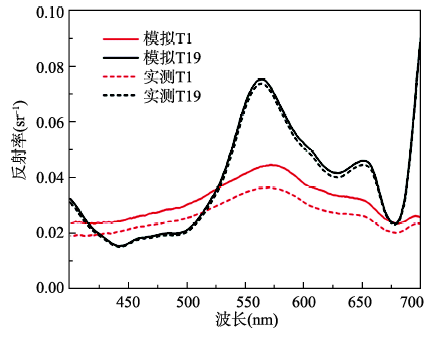
Fig. 6 Comparison on the simulated reflectance spectrum of the water samples with different CHL-a concentrations.图6 不同叶绿素a浓度的模拟反射率光谱对比 |
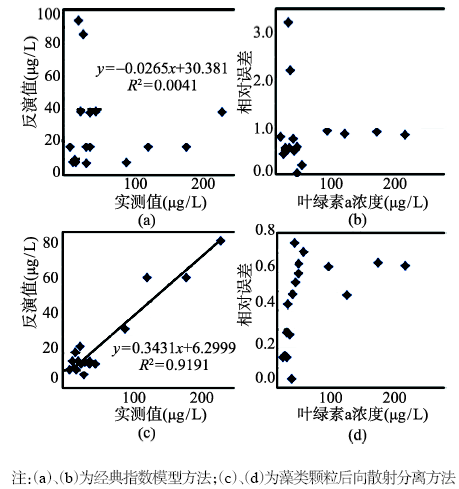
Fig. 7 The retrieved CHL-a concentration and its relative errors by different simulating methods of the backscattering coefficients图7 不同后向散射系数模拟方法的叶绿素a反演结果与相对误差 |
Fig. 8 The retrieved CHL-a concentration and its relative errors by using the in-situ datasets obtained on October 27-28, 2003图8 2003年10月27-28日叶绿素a反演结果与相对误差. |
The authors have declared that no competing interests exist.
| [1] |
|
| [2] |
|
| [3] |
|
| [4] |
|
| [5] |
|
| [6] |
|
| [7] |
|
| [8] |
|
| [9] |
|
| [10] |
|
| [11] |
|
| [12] |
|
| [13] |
|
| [14] |
|
| [15] |
|
| [16] |
|
| [17] |
|
| [18] |
|
| [19] |
|
| [20] |
|
| [21] |
|
| [22] |
|
| [23] |
|
| [24] |
|
| [25] |
|
| [26] |
|
| [27] |
|
| [28] |
|
| [29] |
|
| [30] |
|
| [31] |
|
| [32] |
|
| [33] |
|
| [34] |
|
| [35] |
|
| [36] |
|
| [37] |
|
| [38] |
|
| [39] |
|
/
| 〈 |
|
〉 |