
1982-2006年加纳植被覆盖时空变化及其气候影响
作者简介:王昭生(1985-),男,甘肃武威人,博士生,研究方向为陆地生态系统对气候变化响应的模拟与分析。E-mail:wangzs@ieecas.cn
收稿日期: 2014-01-17
要求修回日期: 2014-03-23
网络出版日期: 2015-01-05
基金资助
中国科学院地理科学与资源研究所“一三五”战略科技计划项目
国家“973”计划项目(2010CB950603)
国家自然科学基金项目(41271118)
Spatiotemporal Variation of Vegetation and Climate Impacts on It in Ghana from 1982 to 2006
Received date: 2014-01-17
Request revised date: 2014-03-23
Online published: 2015-01-05
Copyright
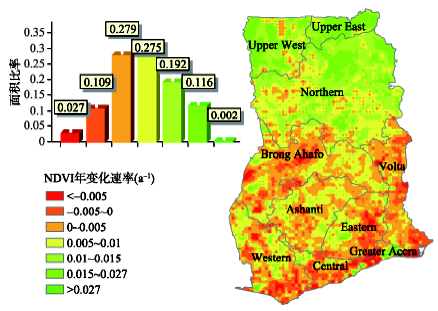
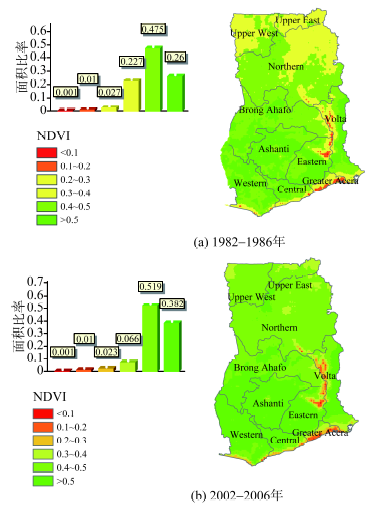
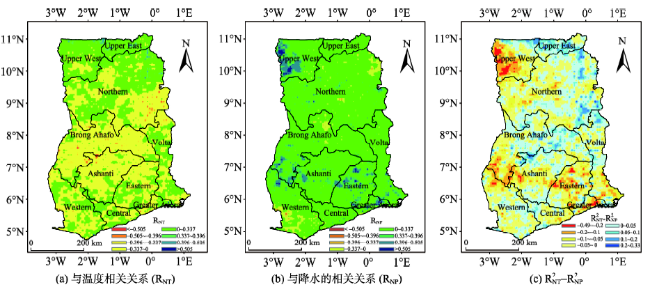
非洲陆地生态系统是气候变化的高敏感区,研究该区域植被覆盖变化及其控制因素,对深刻认识气候变化的影响具有重要意义。本文利用1982-2006年植被指数(NDVI)数据,研究位于非洲西部热带地区的加纳共和国植被覆盖的时空变化特征,结合同期的气温和降水量数据,分析其植被活动对气候变化的响应特征。研究结果表明,加纳86.4%的植被覆盖区NDVI在25 a间都呈现不同程度的增加趋势。20世纪80年代初和21世纪初这2个时期,NDVI值大于0.4的面积百分比呈增加趋势;NDVI值大于0.5的面积百分比从26%增加到38.2%;NDVI值在0.4-0.5之间的面积百分比从47.5%增加到51.9%。NDVI受降水量控制的区域占总区域面积的57.2%,而受气温控制的面积占总区域面积的42.8%。总的来看,加纳植被覆盖对降水量变化的敏感程度强于气温变化。
王昭生 , 黄玫 , 闫慧敏 , 王军邦 , 岳溪柳 . 1982-2006年加纳植被覆盖时空变化及其气候影响[J]. 地球信息科学学报, 2015 , 17(1) : 78 -85 . DOI: 10.3724/SP.J.1047.2015.00078
As African terrestrial ecosystem is highly sensitive to climate change, considerable researches during the past several decades have focused on monitoring vegetation activity and its responses to climate change, thus we can thoroughly understand the progress of climate change. It's significant to study the vegetation variation and its control factors in this area.We combined datasets of the satellite-derived Normalized Difference Vegetation Index (NDVI),whose spatial resolution is 8 km, and climate factors (temperature and precipitation) to detect vegetation activity change. Additionally, we analyzed the spatial correlations among NDVI, temperature, precipitation on the spatio-temporal patterns from 1982 to 2006 in Ghana. In order to conduct certain spatial correlation analysis, we interpolated the temperature and precipitation data from Climatic Research Unit (CRU3.0) datasets with respect to the spatial resolution of NDVI. At the regional scale, the results from this study showed the different increase trends occurred in the vegetation area of Ghana in the recently 25 years, which suggested that the vegetation activity has been strengthened. Compare the spatial distribution of NDVI in the early 1980 s (1982-1986) with the early 21st century (2002-2006), we found that the areas whose NDVI value is greater than 0.5 and whose value is between 0.4 and 0.5 all show a trend of increase; area percentage with NDVI value greater than 0.5 had increased from 26% to 38.2%, and the area percentage with NDVI value between 0.4 and 0.5 had increased from 47.5% to 51.9%.Spatial correlation analysis showed that the area with precipitation governed NDVI accounted for 57.2% of the total area, and the area with NDVI controlled by the temperature accounted for 42.8% of the total area. In summary, the vegetation of Ghana is more sensitive to the rainfall changes than the temperature changes.
Key words: Africa; NDVI; vegetation activity; influencing factor
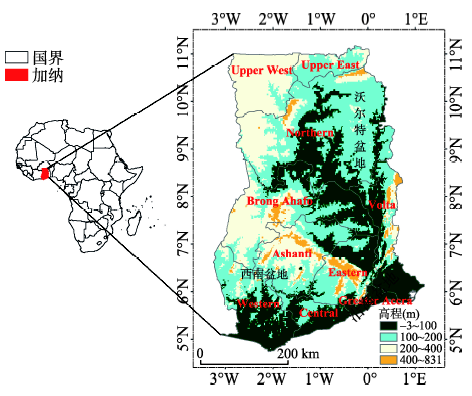
Fig. 1 Topography map of Ghana图1 加纳地形空间分布 |
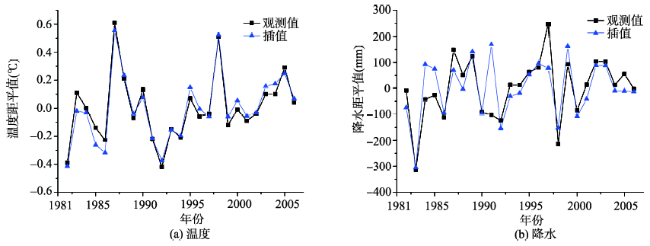
Fig. 2 Comparison validation of temperature and precipitation图2 温度和降水数据的对比验证 |
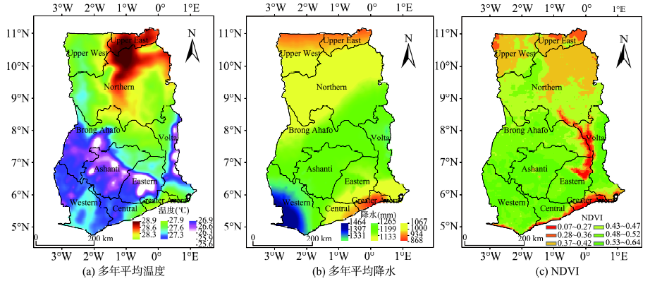
Fig. 3 Spatial and temporal distribution of average multiannual temperature, precipitation and NDVI of Ghana in 1982-2006图3 1982-2006年加纳多年平均温度、降水和NDVI的时空分布 |
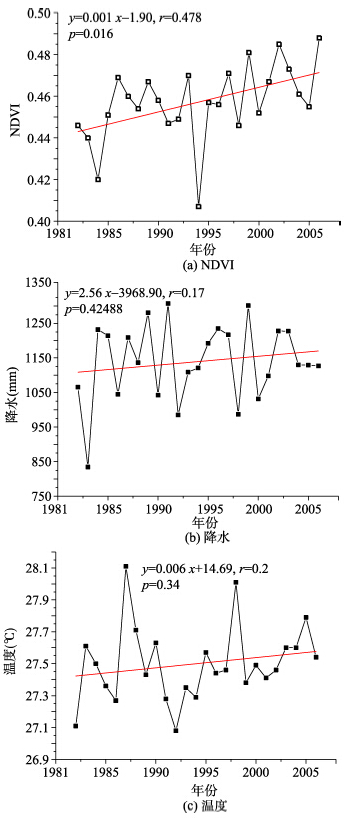
Fig. 4 Interannual variation of NDVI, precipitation and temperature in 1982-2006图4 1982-2006年NDVI、降水、温度的年际变化 |
Fig. 5 Spatial distribution of average annual NDVI variation rate in 1982-2006图5 1982-2006年加纳年均NDVI变化速率的空间分布 |
Fig. 6 Spatial distribution of five-year average annual NDVI in the 1980 s (1982-1986) and the early-2000 s (2002-2006)图6 20世纪80年代初和21世纪初加纳年均NDVI的空间分布 |
Fig. 7 Correlation relationship of temperature ,precipitation with NDVI ,and the difference between the square of two-coefficient (RNT, RNP, , respectively)图7 NDVI与温度和降水的相关关系,以及两相关系数平方之差 |
The authors have declared that no competing interests exist.
| [1] |
|
| [2] |
|
| [3] |
|
| [4] |
|
| [5] |
|
| [6] |
|
| [7] |
|
| [8] |
|
| [9] |
|
| [10] |
|
| [11] |
|
| [12] |
|
| [13] |
|
| [14] |
|
| [15] |
|
| [16] |
|
| [17] |
|
| [18] |
|
| [19] |
|
| [20] |
|
| [21] |
|
| [22] |
|
| [23] |
|
| [24] |
|
| [25] |
|
| [26] |
|
| [27] |
|
| [28] |
|
| [29] |
|
| [30] |
|
| [31] |
|
| [32] |
|
| [33] |
|
| [34] |
|
| [35] |
|
| [36] |
|
| [37] |
|
| [38] |
Wikipedia.Forestry in Ghana[EB/OL].
|
| [39] |
Immigration and Refugee Board of Canada.Ghana: Conflict between the Konkomba and Nanumba tribes and the government response to the conflict (1994-September 2000), 26 September 2000, GHA35249E[EB/OL].
|
| [40] |
|
| [41] |
|
| [42] |
|
| [43] |
|
/
| 〈 |
|
〉 |