
多源遥感数据的降水空间降尺度研究——以川渝地区为例
作者简介:嵇涛(1988-),男,江苏扬州人,硕士生,主要从事资源环境遥感与GIS研究。E-mail:taoji_scholar@126.com
收稿日期: 2014-04-11
要求修回日期: 2014-05-16
网络出版日期: 2015-01-05
基金资助
国家自然科学基金面上项目(41271411、40771135)
重庆市科委软科学计划项目(CSTC2011CX-rkxA0280)
科技基础性工作专项项目“格网化资源环境综合科学调查规范”(2011FY110400)
Spatial Downscaling of Precipitation Using Multi-source Remote Sensing Data: A Case Study of Sichuan-Chongqing Region
Received date: 2014-04-11
Request revised date: 2014-05-16
Online published: 2015-01-05
Copyright
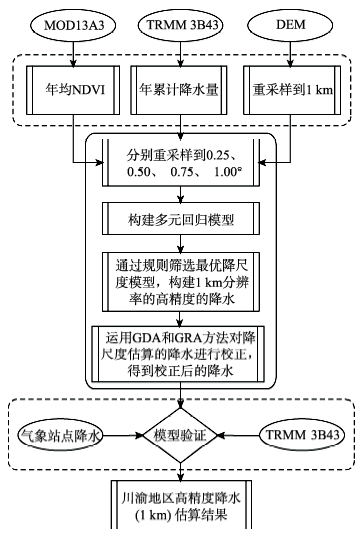
大量研究表明,通过传统地面气象站点实测的单点数据,不能有效地反映降水的空间变化特征。目前,以遥感数据获取的降水产品已得到了广泛的应用,但在地形地势复杂区域,遥感降水产品的空间分辨率与数据精度等方面仍然存在着极大的不足。因此,本文以四川重庆(川渝)地区为例,通过建立降水产品降尺度算法,以实现降水产品的降尺度估算,提高降水数据的空间分辨率。依据在不同尺度下(0.25°、0.50°、0.75°和1.00°),TRMM 3B43、地理因子,以及MOD13A3(NDVI)之间存在的相关关系,构建了多元回归模型。通过对比这4种尺度下的回归模型,选择其中精度最高的作为最终的降尺度算法,然后再把这种降尺度算法应用到1 km分辨率下进行降水估算。进一步,以区域差异分析(GDA)和区域比率分析法(GRA)对降尺度估算的降水数据进行校正,并结合部分地面气象站点实测的降水数据进行验证。验证结果表明:降尺度算法是可靠的,能有效提升降水产品的空间分辨率,同时GDA和GRA校正方法能减小误差,进一步提升降水估算的精度,满足区域地表过程应用的需求。
嵇涛 , 刘睿 , 杨华 , 何太蓉 , 吴建峰 . 多源遥感数据的降水空间降尺度研究——以川渝地区为例[J]. 地球信息科学学报, 2015 , 17(1) : 108 -117 . DOI: 10.3724/SP.J.1047.2015.00108
Precipitation data with high spatial resolution is deemed necessary for hydrology, meteorology, ecology and others. Currently there are mainly two sources of precipitation estimation: meteorological stations and remote sensing technology. However, a large number of studies demonstrated that the measurements acquired from conventional meteorological stations are single points of data, and they can not reflect the spatial variation of precipitation effectively, especially in studying the more complex areas. While the technology of remote sensing can not only improve the quality of the actual observations, but also be able to produce reasonably high resolution gridded precipitation fields. These products obtained by satellites have been widely used in previous studies. However, when applied to complex topography region, the spatial resolution of these products is too coarse and data accuracy is not high. Therefore, we present a statistical downscaling algorithm based on the relationships between precipitation and other environmental associated factors such as topography and vegetation in the Sichuan-Chongqing region, which was developed for downscaling the spatial precipitation fields with these remote sensing products. This algorithm is demonstrated with the Tropical Rainfall Measuring Mission (TRMM) 3B43 dataset, the Digital Elevation Model (DEM) from ASTER Global Digital Elevation Model (ASTER GDEM) and Moderate resolution Imaging Spectroradiometer (MODIS) 13A3 dataset. The statistical relationship among precipitation, geographical factors and Normalized Difference Vegetation Index (NDVI), which is a representation for vegetation, is variable at different scales; therefore, a multiple non-linear regression model was established under four different scales (0.25°, 0.50°, 0.75° and 1.00°, respectively). By applying a downscaling methodology, TRMM 3B43 0.25°×0.25° precipitation fields were downscaled to 1 km×1 km pixel resolution for each year from 2000 to 2011. By comparing these four regression models, we first select the regression model with the highest accuracy as the final downscaling algorithm, and then apply this downscaling algorithm (0.25°) to 1 km resolution for the estimation of high precision in this study. Second, the calibration of downscaling precipitation was conducted based on Geographical Difference Analysis (GDA) and Geographical Ratio Analysis (GRA). The final downscaling estimation results were validated by applying part of meteorological stations measured precipitation data for a period of 12 years in Sichuan-Chongqing region. As a whole, these results indicated downscaling algorithm is reliable, and can effectively improve spatial resolution of precipitation products. The resultant best value of the 1 km annual precipitation data are achieved through downscaling followed by GDA and GRA calibration for most cases. And the downscaling 1 km annual precipitation has not only been significantly improved in the spatial resolution, but also corresponded well with TRMM 3B43 precipitation data and meteorological stations data achieved for Sichuan-Chongqing region.
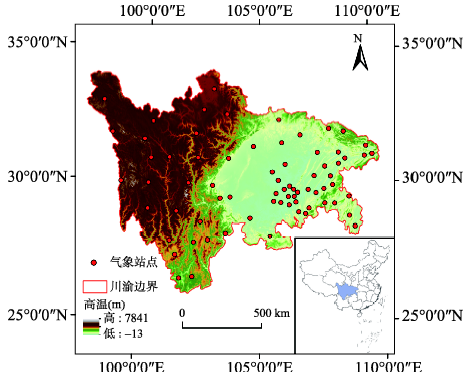
Fig. 1 Location, elevation of study area and distribution of the meteorological stations图1 研究区地理位置、高程及气象站点分布 |
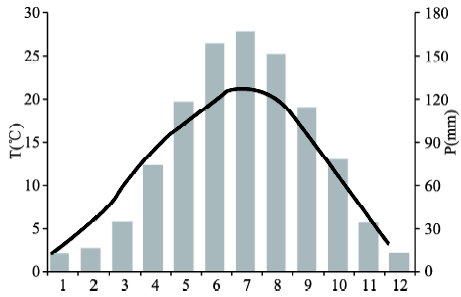
Fig. 2 Average monthly precipitation and temperature of study area. The bars represent precipitation and the line represents temperature.图2 研究区各月平均降水和气温(其中柱状图表示降水,折线图表示气温) |
Fig. 3 Flowchart of high-precision reconstruction of precipitation based on multi-source remote sensing data图3 多源遥感数据的降水高精度重建流程图 |
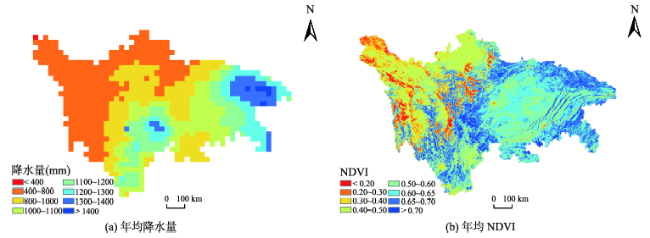
Fig. 4 TRMM 3B43 average annual precipitation and average annual NDVI of the study area during 2000-2011图4 研究区2000-2011年TRMM 3B43年均降水量和年均NDVI |
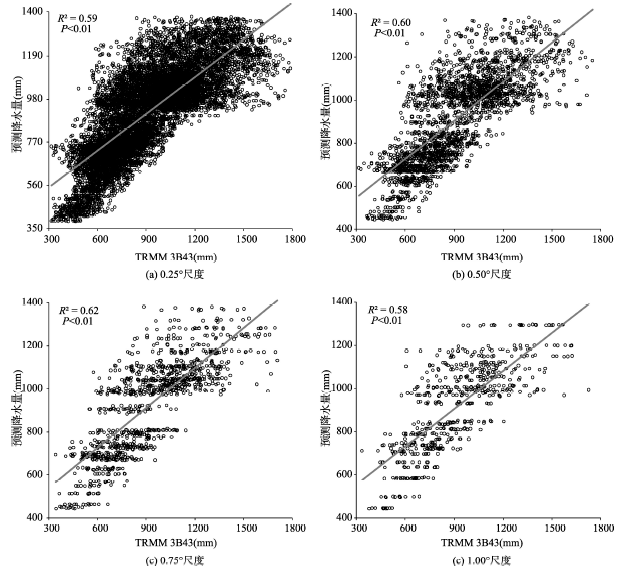
Fig. 5 Scatter diagram between annual precipitation derived from TRMM 3B43 and predicted by regression models图5 不同尺度下TRMM3B43和回归模型预测降水量之间的散点图 |
Tab. 1 Validation results for downscaling of the 2000-2011 TRMM3B43 precipitation at 72 meteorological stations in the study area表1 研究区72个气象站点对应TRMM 3B43降水的降尺度估算结果验证 |
| 0.25° | 0.50° | 0.75° | 1.00° | |
|---|---|---|---|---|
| R2 | 0.71 | 0.69 | 0.70 | 0.65 |
| Bias | 0.03 | 0.02 | 0.03 | 0.03 |
| RMSE(mm) | 14.77 | 14.90 | 14.59 | 15.61 |
| MAE(mm) | 126.60 | 127.70 | 129.00 | 132.60 |
| MRE(%) | 13.26 | 12.87 | 13.67 | 13.58 |
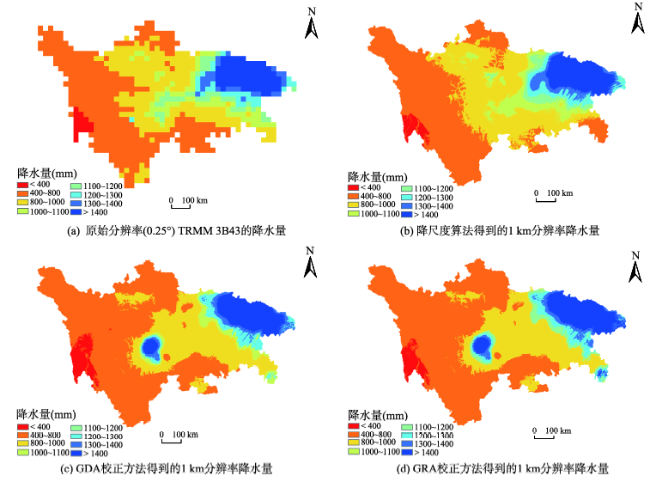
Fig. 6 Annual average precipitation of Sichuan-Chongqing region in 2011图6 川渝地区2011年平均降水量 |
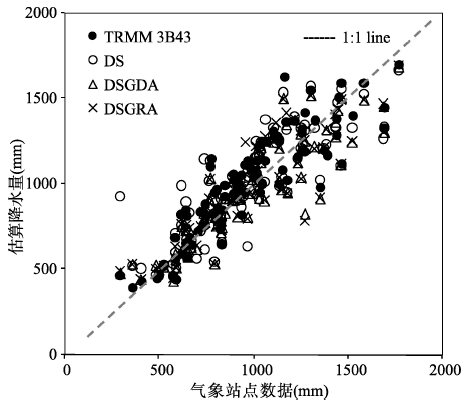
Fig. 7 Scatter plot of the measured annual precipitation from 30 validation rain gauge stations versus the estimated precipitation data from original TRMM 3B43, downscaled (DS), calibrated downscaled using GDA method (DSGDA) and using GRA method图7 地面气象站点降水数据与TRMM 3B43以及3种降尺度降水之间的散点图 |
Tab. 2 Validation results using 30 independent validation rain gauge stations on annual scale for three typical years in Sichuan-Chongqing region表2 3个典型年份川渝地区气象站点降水与TRMM 3B43以及3种降尺度降水之间的验证结果 |
| 年份 | Dataset | Mean(mm) | R2 | Bias | RMSE(mm) | MAE(mm) | MRE(%) |
|---|---|---|---|---|---|---|---|
| 2004(wet) | RGS | 1114 | |||||
| TRMM | 1095 | 0.61 | -0.02 | 177 | 140 | 11.86 | |
| DS | 1109 | 0.60 | 0.00 | 191 | 158 | 13.69 | |
| DSGDA | 1062 | 0.64 | -0.05 | 188 | 150 | 12.58 | |
| DSGRA | 1067 | 0.60 | -0.04 | 189 | 150 | 12.65 | |
| 2006(dry) | RGS | 819 | |||||
| TRMM | 877 | 0.50 | 0.07 | 135 | 103 | 12.97 | |
| DS | 841 | 0.67 | 0.03 | 124 | 87 | 11.34 | |
| DSGDA | 809 | 0.76 | -0.01 | 98 | 68 | 8.92 | |
| DSGRA | 808 | 0.75 | -0.01 | 99 | 70 | 8.97 | |
| 2011(avg) | RGS | 997 | |||||
| TRMM | 1072 | 0.81 | 0.08 | 143 | 117 | 13.76 | |
| DS | 1080 | 0.71 | 0.08 | 212 | 161 | 23.18 | |
| DSGDA | 1016 | 0.84 | 0.02 | 144 | 115 | 13.37 | |
| DSGRA | 1034 | 0.82 | 0.04 | 160 | 125 | 14.41 | |
| 2000-2011 | RGS | 994 | |||||
| TRMM | 1038 | 0.73 | 0.04 | 164 | 129 | 13.15 | |
| DS | 1030 | 0.70 | -0.01 | 166 | 129 | 13.99 | |
| DSGDA | 987 | 0.77 | -0.04 | 137 | 105 | 11.14 | |
| DSGRA | 991 | 0.76 | 0.00 | 139 | 107 | 11.28 |
注:RGS表示地面气象站点数据 |
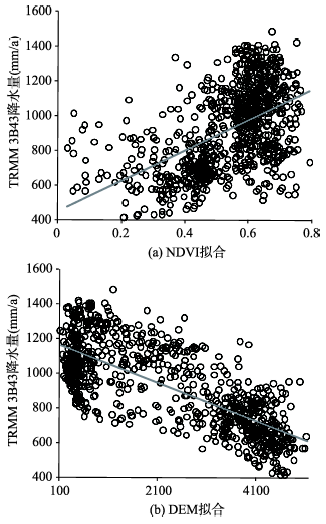
Fig. 8 Fittings of average annual NDVI, DEM and 3B43 accumulated annual precipitation (2000-2011)图8 2000-2011年TRMM 3B43年累计降水与年均NDVI和DEM拟合 |
Tab. 3 The introduction of independent variables in the establishment of linear regression models表3 回归模型中变量的相关性检验 |
| 模型 | R | R2 | 更改统计量 | ||
|---|---|---|---|---|---|
| R Square change | F change | Sig. F change | |||
| 1 | 0.519 | 0.270 | 0.270 | 304.871 | 0.000 |
| 2 | 0.751 | 0.564 | 0.564 | 1067.683 | 0.000 |
The authors have declared that no competing interests exist.
| [1] |
|
| [2] |
|
| [3] |
|
| [4] |
|
| [5] |
|
| [6] |
|
| [7] |
|
| [8] |
|
| [9] |
|
| [10] |
|
| [11] |
|
| [12] |
|
| [13] |
|
| [14] |
|
| [15] |
|
| [16] |
|
| [17] |
|
| [18] |
|
| [19] |
|
| [20] |
|
| [21] |
|
| [22] |
|
| [23] |
|
| [24] |
|
| [25] |
|
| [26] |
|
| [27] |
|
| [28] |
|
/
| 〈 |
|
〉 |